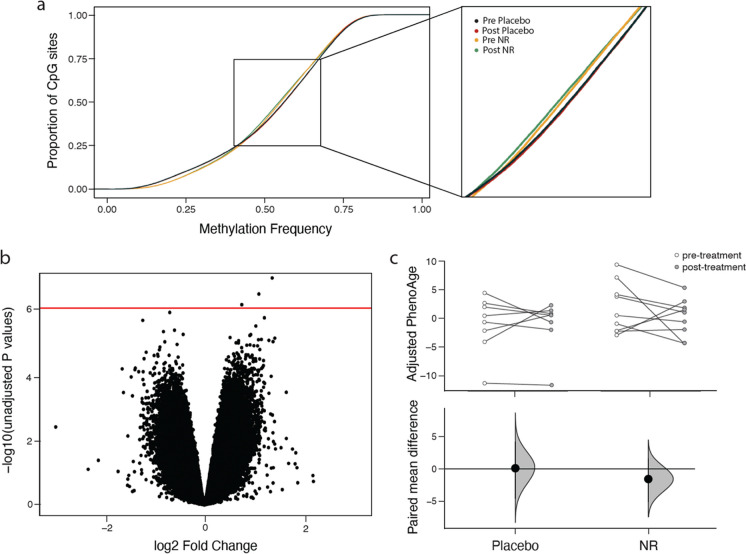
Fig. 5.
Effects of NR on DNA methylation profiles in peripheral blood mononuclear cells. a Cumulative distribution function plots showing methylation profiles of the most variable CpG sites in the range of 0.4–0.7 methylation frequency. b CpG volcano plots of differences between the placebo and NR intervention. X-axis, log2 fold-change of methylation value; Y-axis, −log10 of unadjusted p-values. Red horizontal line, p-value = 1 × 10⁻⁶. c Estimation plot of rate of aging using AgeAccelPheno (above) and paired mean difference (below) shows treatment-associated differences in rate of epigenetic aging between study arms. Dot, average paired mean difference; black vertical line, 95% CI; and distribution in placebo and NR groups

