Abstract
Distinguishing between Alzheimer’s disease (AD) and frontotemporal dementia (FTD) presents a clinical challenge. Inexpensive and accessible techniques such as electroencephalography (EEG) are increasingly being used to address this challenge. In particular, the potential relevance between aperiodic components of EEG activity and these disorders has gained interest as our understanding evolves. This study aims to determine the differences in aperiodic activity between AD and FTD and evaluate its potential for distinguishing between the two disorders. A total of 88 participants, including 36 patients with AD, 23 patients with FTD, and 29 healthy controls (CN) underwent cognitive assessment and scalp EEG acquisition. Neuronal power spectra were parameterized to decompose the EEG spectrum, enabling comparison of group differences in different components. A support vector machine was employed to assess the impact of aperiodic parameters on the differential diagnosis. Compared with the CN group, both the AD and FTD groups showed varying degrees of increased alpha power (both periodic and raw power) and theta alpha power ratio. At the channel level, theta power (both periodic and raw power) in the frontal regions was higher in the AD group compared to the FTD group, and aperiodic parameters (both exponents and offsets) in the frontal, temporal, central, and parietal regions were higher in the AD group than in the FTD group. Importantly, the inclusion of aperiodic parameters led to improved performance in distinguishing between the two disorders. These findings highlight the significance of aperiodic components in discriminating dementia-related diseases.
Supplementary Information
The online version contains supplementary material available at 10.1007/s11357-023-01041-8.
Keywords: Alzheimer’s disease, Frontotemporal dementia, Differential diagnosis, Electroencephalography, Aperiodic, Machine learning
Background
Alzheimer’s disease (AD) and frontotemporal dementia (FTD) are the two most prevalent causes of dementia [1]. AD is characterized by amnesia, fluency aphasia, and visuospatial difficulties, while FTD is characterized by changes in personality and behavior [2]. However, both diseases often present with overlapping clinical symptoms, and FTD can exhibit different patterns of brain atrophy (i.e., temporal and frontal variants), making diagnosis challenging [3]. Neuropsychological tests have yielded inconclusive or even contradictory results [4, 5]. Neuroimaging techniques, such as positron emission tomography, single photon emission computed tomography, and functional magnetic resonance imaging, have been used to identify affected brain regions to improve diagnostic accuracy [6–8]. Nevertheless, their high cost and limited availability have been a constraint. Electroencephalography (EEG), on the other hand, has gained increased interest in clinical practice and research due to its low cost and wide availability [9].
Many studies have consistently found an overall slowing of EEG rhythm in patients with AD, evidenced by increased power in slow rhythm (i.e., delta and theta bands) and decreased power in fast rhythm (i.e., alpha and beta bands) [10–12], resulting in an increased theta alpha power ratio (TAR), which has shown promise in differentiating patients with AD from healthy controls [13]. In contrast, there have been fewer quantitative EEG studies of patients with FTD with controversial results, such as no increase in delta and theta band power while alpha band power increases [14], or an increase in theta power while alpha power remains unchanged [15]. It is worth noting that previous power spectrum analyses have focused on narrowband power, which measures relative or absolute power changes across specific frequency bands.
In recent years, the dominant scale-free “1/f” components of the power spectrum, known as the aperiodic components, have attracted much attention [16–19]. Previous studies considered “1/f” activity as neural noise and often removed it from analyses to emphasize brain oscillations [17]. However, recent studies have shown that these aperiodic components are not unstructured noise but have unique functional significance that indexes the excitation/inhibition (E/I) balance of neuronal populations [20]. It is affected by age [21, 22], state of consciousness [23, 24], and disease, including attention-deficit/hyperactivity disorder, schizophrenia, and Parkinson’s disease [25–27]. Notably, the aperiodic components have been found to be excellent predictors of higher-order cognitive tasks, such as cognitive processing speed and language learning [28, 29]. To date, no studies have investigated the effect of aperiodic components in dementia-related diseases. Therefore, we employed a recently proposed method of parameterizing neuronal power spectra to analyze scalp EEG of patients with AD and FTD [30], exhaustively describing all components of the EEG power spectrum and examining the effect of aperiodic components in distinguishing between these two disorders, aiming to improve diagnostic accuracy affordably and conveniently.
Methods
Participants
We reanalyzed data that were collected from previously published studies [31–34]. This dataset consists of EEG data from 36 patients with AD, 23 patients with FTD, and 29 healthy controls (CN). Cognitive and neuropsychological status was evaluated using the international Mini-Mental State Examination (MMSE), which ranges from 0 to 30, with lower MMSE scores indicating more severe cognitive decline. The duration of the disease was measured in months, and the median value was 25 with an interquartile range of 24–28.5 months. Regarding the AD groups, no comorbidities related to dementia were reported. All patients were diagnosed by an experienced team of neurologists at the 2nd Department of Neurology of AHEPA General Hospital of Thessaloniki.
EEG acquisition
Recordings were acquired from the 2nd Department of Neurology of AHEPA General Hospital of Thessaloniki. A Nihon Kohden EEG 2100 clinical device with 19 scalp electrodes (Fp1, Fp2, F7, F3, Fz, F4, F8, T3, C3, Cz, C4, T4, T5, P3, Pz, P4, T6, O1, and O2) according to the 10–20 international system, and 2 reference electrodes (A1 and A2) placed on the mastoids for impedance check were used for recording, as specified in the manual of the device. Each recording was conducted according to the clinical protocol, with participants in a sitting position and their eyes closed. Before the initialization of each recording, the skin impedance value was checked to ensure it was below 5 kΩ. The sampling rate was 500 Hz with a 10 uV/mm resolution. The recording montages were anterior–posterior bipolar and referential montages using Cz as the common reference. The recordings were received under the range of the following parameters of the amplifier: sensitivity, 10 uV/mm; time constant, 0.3 s; and high-frequency filter at 70 Hz. Each recording lasted approximately 13.5 min for the AD group (min = 5.1, max = 21.3), 12 min for the FTD group (min = 7.9, max = 16.9), and 13.8 min for the CN group (min = 12.5, max = 16.5). In total, 485.5 min of AD, 276.5 min of FTD, and 402 min of CN recordings were collected.
Signal processing
All data preprocessing steps and subsequent analyses were performed using MATLAB (Version 2020a, MathWorks, Inc., Natick, MA, USA) and Python (Version 3.8). First, the EEG data were bandpass filtered using pop_firws function in the EEGLAB toolbox (http://www.sccn.ucsd.edu/eeglab/) with a Hamming window with lower and upper cutoff frequencies of 0.5 and 45 Hz, respectively [35]. Subsequently, an adaptive method named Artifact Subspace Reconstruction was used to remove occasional large-amplitude artifacts [36], and an independent component analysis was performed to decompose constant fixed source noise [37]. The data were then manually inspected for periods of artifact, which were marked for exclusion. After artifact removal, the data were re-referenced to a common average reference due to unknown locally confined spatial origins of aperiodic activity.
Data analysis
To avoid EEG instability at the start of the experiment and subject fatigue at the later stages of the experiment, EEG data of a length of 3 min from 2 min after the start of the experiment were selected in each subject for subsequent analysis. Power spectral density (PSD) estimation was performed using the Welch method with a 0.5-s Hamming window, 50% overlap, and a 0.5-Hz resolution. Then, the FOOOF Python package was used to separate periodic and aperiodic components from the spectral results [30]. The power spectral density for each frequency is expressed as: .
Where the is a combination of the aperiodic components and Gaussians .
The periodic components were parameterized as a mixture of Gaussian distributions: . With as the height of the peak, over and above the aperiodic components, as the center frequency of the peak, as the width of the peak, and as the array of frequency values.
The aperiodic components were also parameterized using a Lorentzian function as: . With as the broadband “offset,” as the “knee,” and as the “exponent” of the aperiodic fit.
The full model was described using these periodic and aperiodic parameters, the goodness of fit was estimated by comparing each fit with the original PSD in terms of the mean absolute error and the of the fit. To avoid overfitting, peak_width_limits were set at 1–12, fitted frequency range was 2–40 Hz, and aperiodic_mode was chosen as “fixed” (fitted without a knee parameter) considering the narrow frequency range. For further analysis, all the models meet the condition that value is higher than 0.95 to exclude the potential influence of noise on the results. After completing the parameterization of the power spectra, the fitted spectra were used to subtract the aperiodic components to obtain periodic oscillatory components. At last, we use bandpower function to calculate the power values, which means calculating the average power in a frequency interval by integrating the power spectral density estimate. We investigated the band-limited power of raw spectra, periodic, and aperiodic components in three frequency bands traditionally used in EEG analysis: theta (4–8 Hz), alpha (8–12 Hz), and beta (12–30 Hz). Our analyses were limited to absolute power because relative power measurements were artificially affected by normalization.
Classification and machine learning algorithms
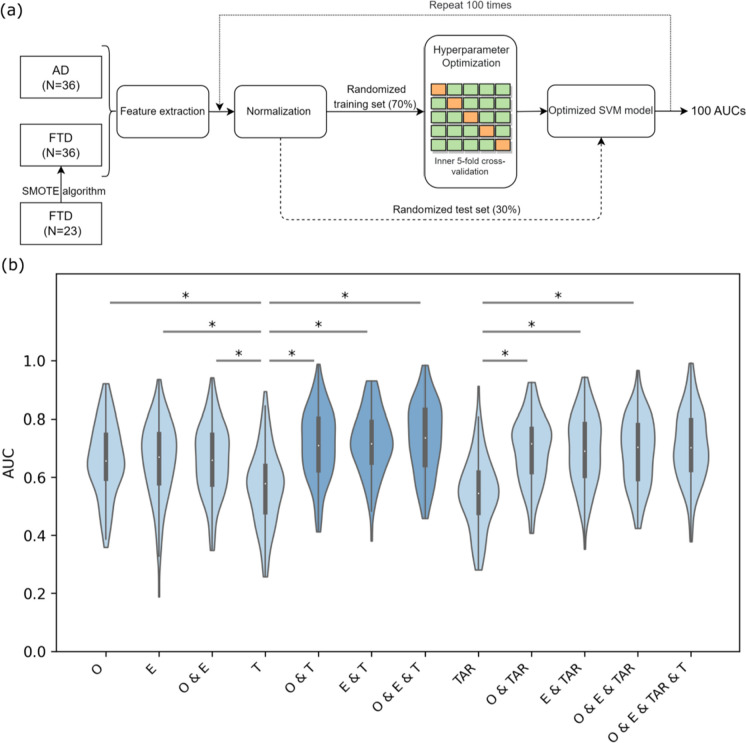
The library for support vector machine (Version 3.25, https://www.csie.ntu.edu.tw/~cjlin/libsvm/) package for MATLAB (Version 2020a, MathWorks, Inc., Natick, MA, USA) was adopted [38]; we assessed the ability of each feature and their combinations in distinguishing between patients with AD and FTD using a support vector machine (SVM) classifier (see Fig. 9a for pipeline schematic diagram). Specifically, each feature mentioned above was averaged across channels for each participant. First, we oversampled the samples with the SMOTE (Synthetic Minority Oversampling Technique) algorithm to address the sample imbalance. The SMOTE algorithm operates by selecting a random sample from the minority class and then identifying its k-nearest neighbors. Instead of simply replicating the chosen sample, SMOTE generates new data points along the line segments connecting the original sample to these k-nearest neighbors. This strategy is employed to address the issue of overfitting and enhance the quality of synthetic samples, thus contributing to a more effective and balanced dataset [39]. Next, all participants were randomly assigned to a training set and a test set with a ratio of 7:3, and the value of each feature was normalized in each group. The hyperparameters of each classifier were optimized with inner fivefold cross-validation. Then, an SVM model with a radial basis function kernel was trained using the whole training set with the optimal hyperparameters. We subsequently repeated the whole process 100 times using different randomized training and testing sets to ensure the robustness of our results, classification effectiveness evaluation was obtained using the receiver operating characteristic curve and area under curve (AUC). Finally, we obtained 100 AUCs for each feature combination and compared them among different feature combinations.
Fig. 9.
Schematic diagram of the SVM model and AUC results. a Pipeline for training and evaluation of SVM models. Feature combinations were extracted from the total dataset (AD group, N = 36; FTD group, N = 36 (data over-sampling)), then normalized and divided into training and test sets in the ratio of 7:3. Hyperparametric optimization was performed in the training set using inner fivefold cross-validation to obtain the best SVM model, and the test set was used to evaluate the performance of the optimized SVM model. Finally, the whole procedure was repeated 100 times using different random training and test sets. Posterior probabilities were calculated to obtain ROC curves and AUC values. b Group comparison of AUC values in different feature combinations. In each violin plot, the white dot in the center corresponds to the mean of the sample; the upper and lower boundaries of the boxes indicate the 25th percentile and 75th percentile, respectively; the length of the whiskers represents the range of the stated data. *p < 0.001. Violin diagrams with the top 3 AUC values are represented in a darker color. Only partially significantly different comparative results are presented in the figure, corresponding results of all statistical comparisons between different feature combinations are shown in Supplementary Table S3. AD, Alzheimer’s disease; FTD, frontotemporal dementia; SVM, support vector machine; ROC, receiver operating characteristic; AUC, area under curve; O, offsets; E, exponents; T, theta raw power; TAR, theta alpha power ratio
Statistical analysis
All statistical analyses were performed with SPSS 25.0 software (SPSS Inc., Chicago, IL, USA), and the significance level was set at α = 0.05. The Shapiro–Wilk method was used to test the normality of the data distribution. Since EEG parameters were not normally distributed in all groups, variables were log-transformed before comparison between groups. For channel-averaged group comparisons, EEG parameters for the three groups were analyzed using one-way analysis of variance (ANOVA) and post hoc tests with Bonferroni correction for multiple comparisons. Channel-by-channel group comparisons were performed using Student’s t-test, and the resulting p-values were corrected for multiple comparisons using the false discovery rate (FDR) procedure across 19 channels. Spearman correlation analysis was used to test the correlation between EEG parameters and MMSE scores, and the FDR procedure was used to correct for multiple comparisons. AUC values obtained for different feature combinations were compared using one-way ANOVA and post hoc tests (Bonferroni correction).
Results
Demographic
All three groups had similar age distributions (see Table 1). In the AD group, a higher proportion of participants were female, whereas more FTD participants were male. Consistent with the disease characteristics, the AD group exhibited more severe impairment in overall cognitive performance (MMSE score) compared to the FTD group (t57 = − 4.3, p < 0.001).
Table 1.
Demographic and clinical variables, mean (standard deviation)
| AD (N = 36) | CN (N = 29) | FTD (N = 23) | Group differences | |
|---|---|---|---|---|
| Male to female | 12:24 | 18:11 | 14:9 |
χ2 = 6.8, p = 0.034a p (AD, CN) = 0.021 p (AD, FTD) = 0.038 p (CN, FTD) = 0.930 |
| Age | 66.4(7.9) | 67.9(5.4) | 63.7(8.2) | F (2, 85) = 2.218, p = 0.115b |
| MMSE | 17.8(4.5) | 30(0) | 22.2(2.6) | t57 = − 4.3, p < 0.001c |
AD Alzheimer’s disease, CN healthy control, FTD frontotemporal dementia, MMSE Mini-Mental State Examination
aChi-square test AD, CN, FTD
bOne-way ANOVA AD, CN, FTD
cStudent’s t-test AD, FTD
Neuronal power spectrum parameterization
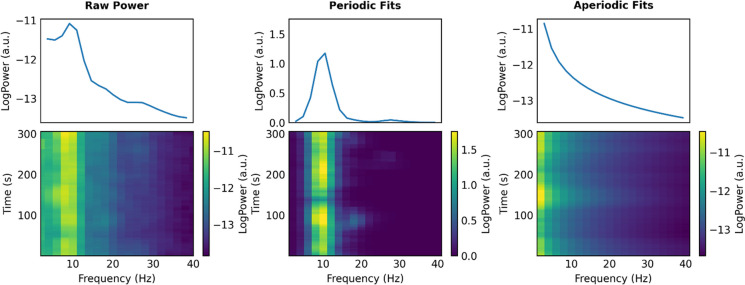
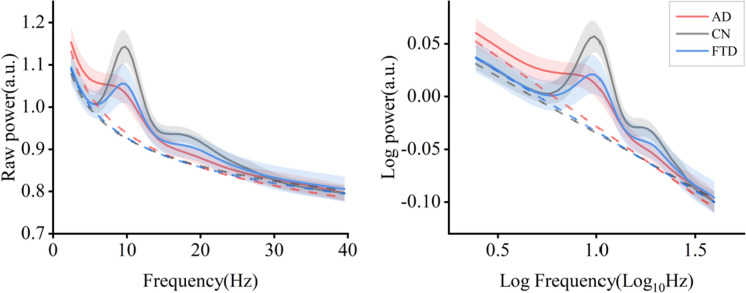
Using the method of parameterizing neural power spectral, we separated the raw power into periodic and aperiodic components, with the periodic components represented by periodic power and the aperiodic components represented by offsets and exponents (as illustrated in Fig. 1, see Fig. 2 for all fitting curves in three groups). ANOVAs showed the following (see Table 2 and Fig. 3).
Fig. 1.
Schematic diagram of separating the power spectra. Raw power (left), periodic fits (middle), and aperiodic fits (right) from an example participant, where raw power is equal to periodic fits plus aperiodic fits. (Spectrogram (top) and time–frequency diagram (bottom))
Fig. 2.
Average PSDs in three groups, including linear scale (left) and log–log scale (right) (95% confidential interval was shown in shadow area). AD, Alzheimer’s disease; CN, healthy control; FTD, frontotemporal dementia; PSD, power spectral density
Table 2.
Group comparison of channel-averaged EEG parameters
| AD | CN | FTD | Group differences | |
|---|---|---|---|---|
| Theta raw power | 5.19 [5.06, 5.33] | 4.96 [4.82, 5.10] | 4.99 [4.78,5.19] |
F (2, 85) = 3.25, p = 0.044 p (AD, CN) = 0.068 p (AD, FTD) = 0.174 p (CN, FTD) = 1.0 |
| Alpha raw power | 4.98 [4.85, 5.11] | 5.33 [5.16, 5.50] | 4.99 [4.80,5.18] |
F (2, 85) = 6.61, p = 0.002 p (AD, CN) = 0.004 p (AD, FTD) = 1.0 p (CN, FTD) = 0.013 |
| Beta raw power | 16.70 [16.38,17.01] | 17.18 [16.88, 17.55] | 16.93 [16.30, 17.55] | F (2, 85) = 1.71, p = 0.187 |
| Theta periodic power | 0.28 [0.23, 0.32] | 0.24 [0.16, 0.31] | 0.20 [0.13, 0.27] | F (2, 85) = 1.51, p = 0.228 |
| Alpha periodic power | 0.40 [0.29, 0.51] | 0.81 [0.68, 0.94] | 0.45 [0.32, 0.58] |
F (2, 85) = 14.63, p < 0.001 p (AD, CN) < 0.001 p (AD, FTD) = 1.0 p (CN, FTD) < 0.001 |
| Beta periodic power | 0.43 [0.31, 0.55] | 0.91 [0.73, 1.08] | 0.48 [0.35, 0.61] |
F (2, 85) = 14.46, p < 0.001 p (AD, CN) < 0.001 p (AD, FTD) = 1.0 p (CN, FTD) < 0.001 |
| Offsets | 1.02 [0.84, 1.20] | 0.76 [0.63, 0.90] | 0.73 [0.49, 0.98] |
F (2, 85) = 3.323, p = 0.041 p (AD, CN) = 0.109 p (AD, FTD) = 0.089 p (CN, FTD) = 1.0 |
| Exponents | 1.31 [1.17, 1.46] | 1.12 [1.02, 1.23] | 1.06 [0.85, 1.27] |
F (2, 85) = 0.512, p = 0.048 p (AD, CN) = 0.193 p (AD, FTD) = 0.071 p (CN, FTD) = 1.0 |
| TAR | 1.05 [1.02, 1.07] | 0.93 [0.92, 0.95] | 1.00 [0.97, 1.03] |
F (2, 85) = 22.43, p < 0.001 p (AD, CN) < 0.001 p (AD, FTD) = 0.053 p (CN, FTD) = 0.001 |
Mean (95% confidence interval) of different EEG parameters. Group comparisons were performed using ANOVAs followed by post hoc tests, Bonferroni-corrected for multiple comparisons
AD Alzheimer’s disease, CN healthy control, FTD frontotemporal dementia, TAR theta alpha power ratio
Fig. 3.
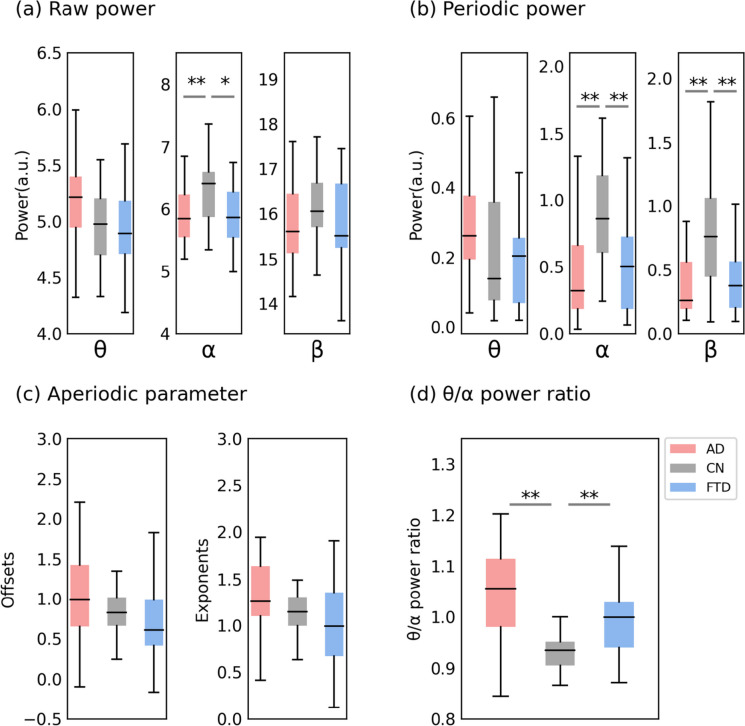
Channel-averaging results of the parameterized spectrum. a Group comparison of raw power. b Group comparison of periodic power. c Group comparison of aperiodic parameter. d Group comparison of θ/α power ratio. In each box plot, the center line corresponds to the median of the sample; the upper and lower borders of the boxes indicate the 25th and 75th percentiles, respectively; the length of the whiskers represents the range of the data. *p < 0.05, **p < 0.01. Corresponding results of the statistical comparisons between groups are shown in Table 2
Group differences in theta power were observed in the raw power analysis (F (2, 85) = 3.25, p = 0.044), but post hoc multiple comparisons revealed no significant differences among the three groups. In the alpha band, consistent group differences were observed in both raw power and periodic power analyses. Specifically, alpha power was reduced in the AD (raw power, mean = 4.98, SD = 0.38; periodic power, mean = 0.40, SD = 0.32) and FTD (raw power, mean = 4.99, SD = 0.44; periodic power, mean = 0.45, SD = 0.31) groups compared to the CN (raw power, mean = 5.33, SD = 0.45; periodic power, mean = 0.81, SD = 0.34) group, with no significant difference observed between the two disease groups (p = 1.0). In the beta band, no group differences were observed in the raw power analysis, but the periodic power analysis revealed that the AD (mean = 0.43, SD = 0.34) and FTD (mean = 0.48, SD = 0.30) groups reduced compared to the CN group (mean = 0.90, SD = 0.45). Both offsets (F (2, 85) = 3.323, p = 0.041) and exponents (F (2, 85) = 0.512, p = 0.048) showed significant group differences at the significance level we set, but post hoc multiple comparisons revealed no significant differences among the three groups in the aperiodic parameters. Finally, raw theta/alpha power ratio (TAR) showed significant group differences (F (2, 85) = 22.43, p < 0.001), with an increased ratio observed in the AD (mean = 1.05, SD = 0.08) and FTD (mean = 1.00, SD = 0.07) groups compared to the CN group (mean = 0.93, SD = 0.04), but no significant difference was observed between the two disease groups (p = 0.053).
Considering the unknown origin of the aperiodic components, to exclude the potential influence of channel averaging on the results, we plotted topographies of EEG parameters on all 19 electrodes to illustrate the spatial patterns of EEG parameters in three groups and conducted pairwise group comparisons. Corresponding results of the statistical comparisons between groups are shown in Supplementary Tables S1 and S2.
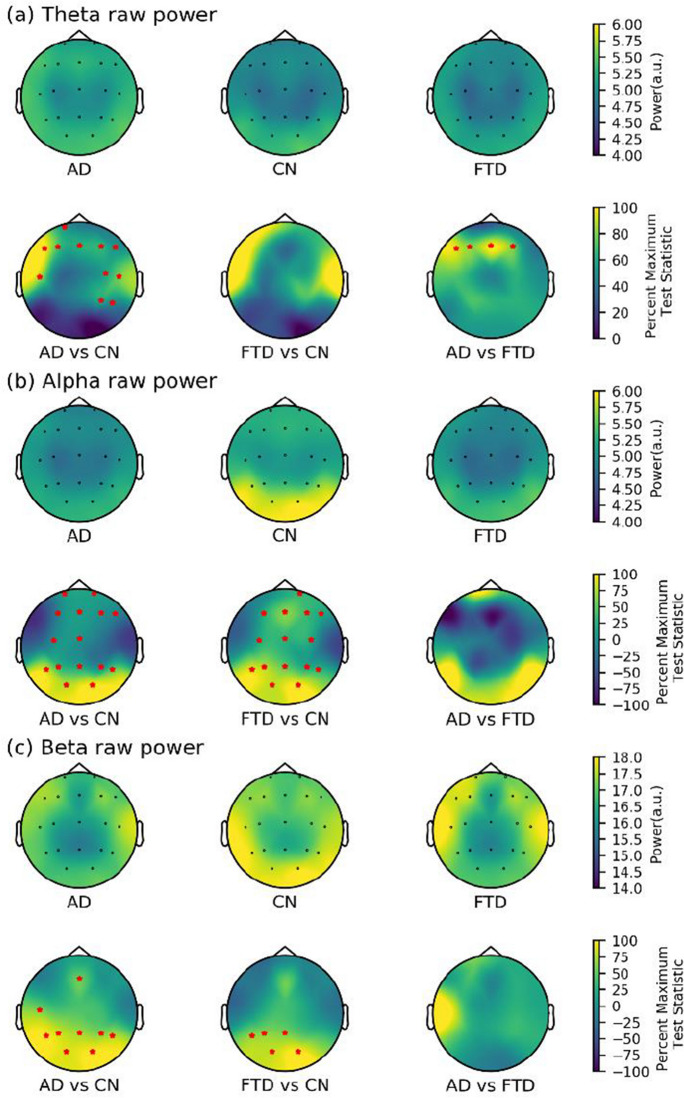
In terms of raw power, significant differences were found between the AD and CN groups in all three bands but in different brain regions (see Fig. 4). Specifically, differences in the theta band were concentrated in the frontotemporal region, while differences in the beta band were observed in the parietooccipital region. In contrast, significant differences in the alpha band were observed in almost the entire brain. The FTD and CN groups showed differences in both alpha (almost the whole brain) and beta (parietal (P3 and Pz), temporal (T5), and bilateral occipital (O1 and O2)) bands. Only theta power in the frontal regions (F3, F4, F7, and Fz) differed between the AD and FTD groups, while no significant differences were found in the alpha and beta bands of all channels.
Fig. 4.
Scalp topography and group comparison for raw power in three groups. a Theta raw power. b Alpha raw power. c Beta raw power. All test statistics were rescaled and normalized to the percentage of the most significant test statistic for better visualization, such that 100 would reflect the most significant test statistic. All electrodes with significant test statistics (FDR-corrected p < 0.05) were marked with red stars. AD, Alzheimer’s disease; CN, healthy control; FTD, frontotemporal dementia; FDR, false discovery rate
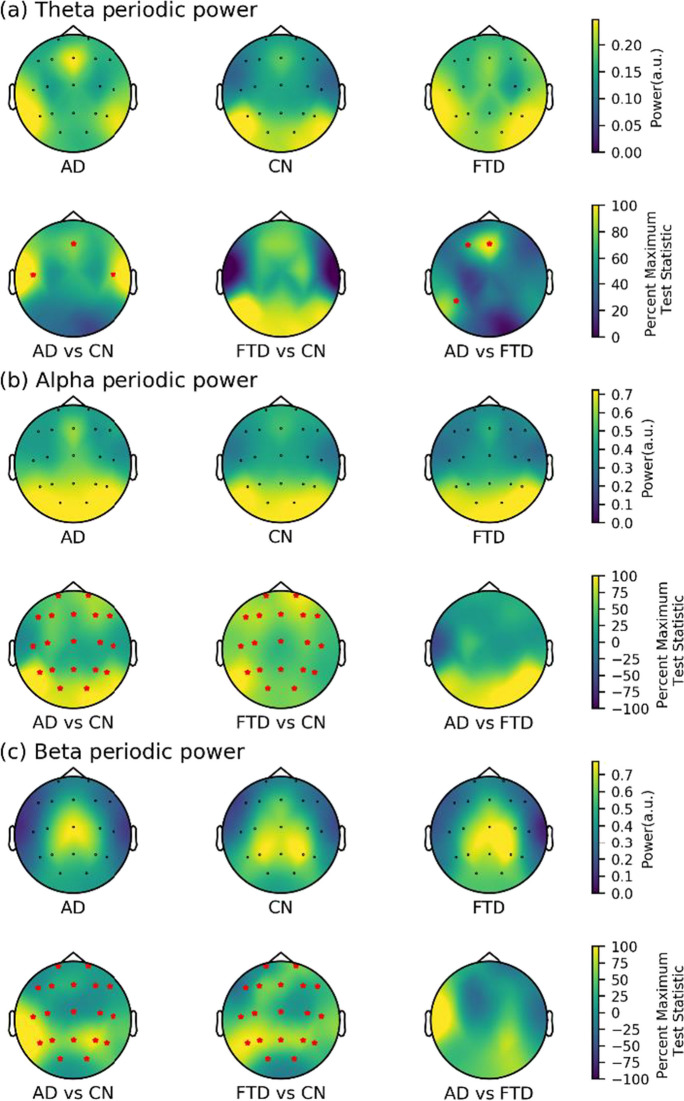
After removing the aperiodic components, we analyzed only periodic power and found significant differences in all three frequency bands between the AD and CN groups (see Fig. 5). Specifically, in the theta band, differential channels were in frontal regions (Fz) and bilateral temporal regions (T3 and T4). In the alpha and beta bands, the AD group showed higher periodic power in all channels compared to the CN group. Similar results were found in the comparison of the FTD and CN groups, with the FTD group showing overall higher periodic power in the alpha and beta bands compared to the CN group. Additionally, compared to the FTD group, the AD group had higher theta power in the frontal (F3 and Fz) and temporal (T5) regions, but no differences were found between the two groups in the fast EEG rhythm (alpha and beta band).
Fig. 5.
Scalp topography and group comparison for periodic power in three groups. a Theta periodic power. b Alpha periodic power. c Beta periodic power. All test statistics were rescaled and normalized to the percentage of the most significant test statistic for better visualization, such that 100 would reflect the most significant test statistic. All electrodes with significant test statistics (FDR-corrected p < 0.05) were marked with red stars. AD, Alzheimer’s disease; CN, healthy control; FTD, frontotemporal dementia; FDR, false discovery rate
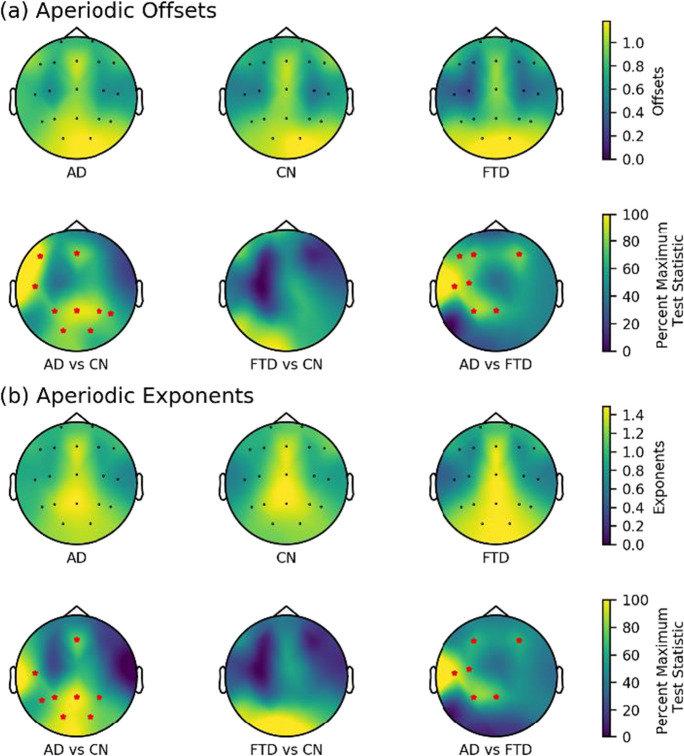
The channel-by-channel comparisons of aperiodic parameters revealed that the AD group exhibited higher offsets and exponents compared to the CN group in the frontal, temporal, parietal, and occipital regions, whereas no significant differences were observed in the aperiodic parameters between the FTD and CN groups across all channels (see Fig. 6). Notably, in the frontal (F3 and F4), temporal (T3), central (C3), and parietal (P3 and Pz) regions, the AD group showed higher offsets and exponents than the FTD group.
Fig. 6.
Scalp topography and group comparison for aperiodic parameters in three groups. a Aperiodic offsets. b Aperiodic exponents. All test statistics were rescaled and normalized to the percentage of the most significant test statistic for better visualization, such that 100 would reflect the most significant test statistic. All electrodes with significant test statistics (FDR-corrected p < 0.05) were marked with red stars. AD, Alzheimer’s disease; CN, healthy control; FTD, frontotemporal dementia; FDR, false discovery rate
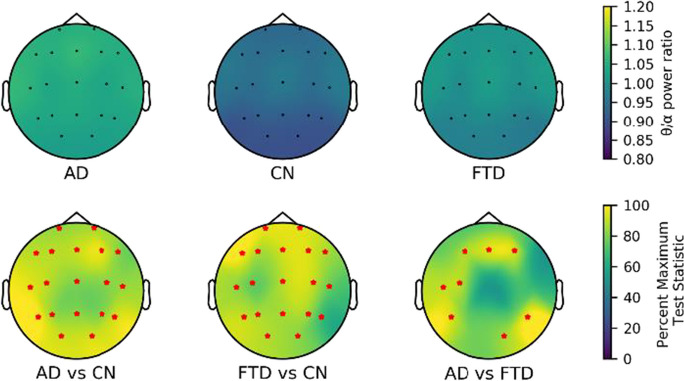
Finally, we compared the TAR results of all channels (see Fig. 7). Compared to the CN group, the TAR of the AD and FTD groups was increased at the whole brain level. Specifically, we observed higher TAR in the frontal (F3, Fz, and F4), temporal (T3, T5, and T6), central (Cz), and occipital (O2) regions in the AD group compared to the FTD group.
Fig. 7.
Scalp topography and group comparison for θ/α power ratio in three groups. All test statistics were rescaled and normalized to the percentage of the most significant test statistic for better visualization, such that 100 would reflect the most significant test statistic. All electrodes with significant test statistics (FDR-corrected p < 0.05) were marked with red stars. AD, Alzheimer’s disease; CN, healthy control; FTD, frontotemporal dementia; FDR, false discovery rate
Correlation relationship analyses
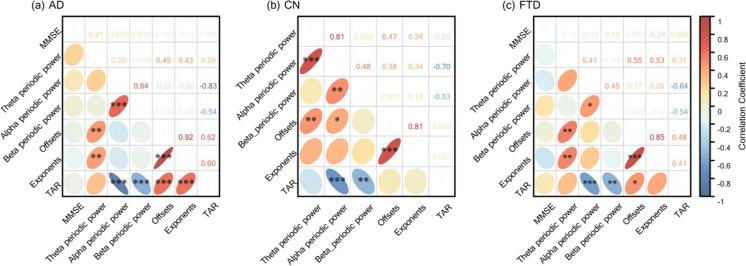
We examined the possible correlations between EEG parameters and overall cognitive impairment (MMSE score) (see Fig. 8). First, the aperiodic parameters had a significant and high positive correlation between each other in all three groups (AD: offsets–exponents, ρ = 0.92, p FDR < 0.001; CN: offsets–exponents, ρ = 0.81, p FDR < 0.001; FTD: offsets–exponents, ρ = 0.85, p FDR < 0.001). Also, there was a low but significant positive correlation between theta periodic power and offsets in all three groups (AD: theta periodic power–offsets, ρ = 0.45, p FDR < 0.01; CN: theta periodic power–offsets, ρ = 0.47, p FDR < 0.01; FTD: theta periodic power–offsets, ρ = 0.55, p FDR < 0.01), while the low positive correlation between periodic theta power and exponents was found only between the AD and FTD groups (AD: theta periodic power–exponents, ρ = 0.43, p FDR < 0.01; FTD: theta periodic power–exponents, ρ = 0.53, p FDR < 0.01). We also observed consistent significant positive correlations between alpha and beta periodic power (AD: alpha periodic power–beta periodic power, ρ = 0.64, p FDR < 0.001; CN: alpha periodic power–beta periodic power, ρ = 0.48, p FDR < 0.01; FTD: alpha periodic power–beta periodic power, ρ = 0.45, p FDR < 0.05), and consistent significant negative correlations between TAR and periodic power (alpha and beta band) in all three groups (AD: TAR–beta periodic power, ρ = − 0.83, p FDR < 0.001, TAR–beta periodic power, ρ = − 0.54, p FDR < 0.001; CN: TAR–beta periodic power, ρ = − 0.70, p FDR < 0.001, TAR–beta periodic power, ρ = − 0.53, p FDR < 0.01; FTD, TAR–beta periodic power, ρ = − 0.64, p FDR < 0.001, TAR–beta periodic power, ρ = − 0.54, p FDR < 0.01). Notably, exponents were negatively correlated with MMSE scores in the AD and FTD groups (AD: exponents—MMSE, ρ = − 0.13, p = 0.02; FTD: exponents–MMSE: ρ = − 0.24, p = 0.03). However, all correlations between aperiodic parameters and MMSE scores were not significant after correction for FDR multiple comparisons (all p FDR > 0.05).
Fig. 8.
Spearman’s correlation between the severity of overall cognitive impairment (MMSE scores) and EEG parameterization results in three groups. a AD. b CN. c FTD. Statistically significant groups are marked by black asterisks on the lower left ellipse (FDR-corrected p-value, *p < 0.05, **p < 0.01, ***p < 0.001), and the transparent number on the upper right represents the correlation coefficient value. Also, the color of the ellipse maps the correlation coefficient value. AD, Alzheimer’s disease; CN, healthy control; FTD, frontotemporal dementia; TAR, theta alpha power ratio; MMSE, Mini-Mental State Examination; FDR, false discovery rate
SVM analysis for diagnostic discrimination
Based on the results above, we chose certain EEG parameters of AD and FTD groups for machine learning classification, ANOVA tests and multiple comparison corrections were performed on the AUC values obtained for all feature combinations. All statistical results can be found in Supplementary Table 2 and 3, partially significantly different comparative results are presented in the Fig. 9b.
Compared with using theta periodic power alone, we obtained significantly higher AUCs using the combination of theta periodic power and aperiodic parameters (theta periodic power vs. offsets and theta periodic power, p < 0.001; theta periodic power vs. exponents and theta periodic power, p < 0.001; theta periodic power vs. offsets and exponents and theta periodic power p < 0.001). Similarly, we obtained significantly higher AUCs using the combination of TAR and aperiodic parameters compared with using TAR alone (TAR vs. offsets and TAR, p < 0.001; TAR vs. exponents and TAR, p < 0.001; TAR vs. offsets and exponents and TAR, p < 0.001).
Our results indicate that when using a single EEG parameter as a feature, the aperiodic parameters offsets (AUC, mean = 0.66, SD = 0.12) and exponents (AUC, mean = 0.66, SD = 0.13) showed the best classification performance. However, when multiple parameters were used as features, the combination of aperiodic parameters (offsets and exponents) and the periodic parameter (theta periodic power) resulted in the best classification performance (AUC, mean = 0.73, SD = 0.12). Surprisingly, the combination of all four parameters did not show the best performance (AUC, mean = 0.71, SD = 0.12).
Discussion
In this study, we aimed to explore changes in different components of scalp EEG between patients with AD and TD by spectral decomposition and investigate the potential of aperiodic components in distinguishing between these two disorders. Specifically, our results revealed that aperiodic parameters (offsets and exponents) and theta power were significantly higher in the AD group compared to the FTD group at the channel level. Moreover, combining aperiodic parameters improved the discriminative ability of EEG features in differentiating AD from FTD. These results suggest that aperiodic parameters could serve as a promising biomarker for the identification and distinction of these dementia-related diseases.
The initial analysis revealed that both the AD and FTD groups exhibited varying degrees of increased EEG low-frequency raw power compared to the CN group, as evidenced by an increase in slow rhythms (theta) and a decrease in fast rhythms (alpha and beta), or an increase in TAR, which is consistent with previous studies on scalp EEG in patients with AD [10, 12]. Importantly, we found that this trend persisted even after the removal of the aperiodic components. Our correlation results indicate a robust association between the TAR and both alpha and beta periodic power, which aligns with Donoghue et al.’s findings, suggesting that TAR predominantly reflects alpha power [40]. However, it is essential to recognize that the band ratio measure is a broad, non-specific metric that amalgamates various potential spectral variations. This raises questions about the interpretability of TAR, indicating that it may not be a straightforward indicator of EEG slowing. This underscores the importance of incorporating parameterized neural power spectra in future studies to gain a more nuanced and precise understanding of underlying neural dynamics. In contrast to a study by Passant and colleagues who reported well-preserved alpha power in patients with FTD [15], our results showed reduced alpha power in the FTD group. We suggest that our results better reflect reality since our FTD group consisted of a larger sample of patients with similar ages and symptom severity.
Our results revealed significantly higher theta power in the AD group compared to the FTD group, which is partially consistent with a previous quantitative EEG study [41], inconsistent in that our results differed only in a few channels, whereas Caso et al. found differences in regions other than the central region. This discrepancy may be attributed to the vulnerability of averaged over different regions of interest to the extreme values of individual channels. Overall, our results indicate that the theta power, including both periodic and raw power, in the frontal regions of the EEG was significantly elevated in the AD group compared to the FTD group under age-matched conditions. These results suggest that varying degrees of EEG slowing may be indicative of distinct pathophysiological processes in different neurodegenerative diseases.
Both computational models and experimental evidence have linked aperiodic activity to an underlying E/I balance of neuronal population [20], where an increase in inhibition (e.g., the use of GABAergic drugs such as propofol) leads to a steepening of the power spectrum (i.e., an increase in exponents) [24, 42], whereas an increase in excitation (e.g., the use of 5-hydroxytryptamine reuptake inhibitors such as escitalopram) leads to a flattening of the power spectrum (i.e., a decrease in exponents) [43]. Additionally, there is growing evidence that alterations in neuronal E/I balance may be a potential cause of neural network dysfunction in AD [44, 45]. Our results indicate higher offsets and exponents in the AD group compared to the FTD group, with the largest difference observed in the temporal region (channel T3). Given the good age match between the two groups, it is unlikely that the observed changes in aperiodic parameters are due to age-related differences [21, 46]. The higher exponents observed in the AD group may suggest a higher degree of inhibition in the neuronal population, but the results obtained from macroscopic-scale analysis differ from those observed at the microscopic scale. At the synaptic level, Aβ plaques cause local alterations in dendrites and cytosol in contact with Aβ, leading to local loss of dendritic spines and GABAergic interneuron terminals [47–49], which can promote the presence of overactive neurons that may cause epileptiform activity. Conversely, neurons with intracellular neurofibrillary tangles (NFTs), another characteristic marker of AD, exhibit significant loss of dendritic spines and consequent synaptic loss in all dendritic regions [50]. Thus, while Aβ plaques may primarily lead to neuronal hyperexcitability, NFTs may be more associated with a reduction in neuronal activity and connectivity[44], which could explain the contradictory results at the micro- and macro-scale. Overall, we inferred the altered E/I balance associated with AD and FTD patients from macroscopic-scale electrophysiological recordings.
Previous research has suggested a potential relationship between aperiodic activity and cognitive status [28, 29]. However, we did not observe a significant correlation between aperiodic parameters and MMSE scores in either the AD or FTD groups in our study. One possible explanation for this discrepancy is that aperiodic parameters may reflect disease-specific pathological changes, such as selective degeneration of the frontal or temporal cortex in patients with FTD [51], in addition to cognitive performance. Nonetheless, we did observe a trend of negative correlation between aperiodic parameters and cognition performance in the FTD group, indicating that larger exponents (steeper power spectrum) were associated with poorer overall cognitive performance. This finding is consistent with a recent study that examined the effects of anesthesia and surgery on cognitive performance, which found that a reduction in the slope of the spectrum after anesthesia (flatter power spectrum) was associated with better language learning [52]. It should be noted that the neuropsychological assessment protocol used in this study contained more detailed and comprehensive subitems compared to the MMSE. Therefore, another explanation for the lack of significant correlation between aperiodic parameters and MMSE scores may be due to the limited sensitivity of the MMSE in assessing subtle cognitive changes. Future studies may need to consider more sensitive and specific neurocognitive assessment protocols to better capture the relationship between aperiodic activity and cognitive status in AD and FTD patients. Moreover, our study did not observe any significant correlation between other EEG parameters and MMSE scores, which contradicts some existing research. For instance, Garn et al. found a significant positive correlation between relative delta power during closed-eye resting state and MMSE scores [53], while Meghdadi et al.’s study revealed a significant negative correlation between TAR and MMSE scores [13]. Although our results indicated higher TAR values in AD and FTD patients compared to healthy controls, aligning with the trend observed in Meghdadi et al.’s study, we believe that these differing results may be attributed to limitations in sample size and the characteristics of the study population. Future investigations should aim to expand the sample size, include a more diverse range of subjects with varying disease severity, and provide a more comprehensive evaluation of the relationship between EEG parameters and MMSE scores.
Furthermore, we observed a weak correlation between aperiodic parameters and periodic theta power, suggesting that they provide distinct information regarding physiological or pathological activity. This indicates that aperiodic parameters and periodic theta power could serve as complementary measures for understanding the disease, reflecting different neuronal mechanisms underlying these distinct types of neural activity [54]. To test this hypothesis, we utilized SVM to classify the two diseases based on different feature combinations. We found that the use of aperiodic parameters yielded higher AUC values compared to the use of only periodic theta power. However, the combination of both aperiodic offsets and exponents did not significantly improve the classification performance, likely due to their high positive correlation, consistent with a correlation-based feature selection approach [55]. Interestingly, the feature combinations that included aperiodic parameters resulted in higher AUC values compared to individual parameters as features (see Supplementary Table 3), indicating that they provide non-redundant information. Specifically, the feature combinations that included offsets, exponents, and periodic theta power yielded the best classification performance. Overall, these results highlight the distinct physiological significance of aperiodic activity in dementia-related diseases and demonstrate the utility of aperiodic parameters in distinguishing AD from FTD.
One potential limitation of this study is the disparity in the gender composition between the AD and FTD groups. Although the impact of gender on aperiodic activity has not been reported, future research should strive to replicate these findings with gender-matched cohorts. Furthermore, we did not differentiate FTD by clinical phenotype, which may result in potential selection bias. Lastly, high-density EEG data should be included in further research to facilitate source analysis and accurately identify the brain regions responsible for the origin of aperiodic components.
Conclusions
Increasing evidence suggests that aperiodic components in neurophysiological signals have physiological significance but have not been studied in dementia-related diseases. In this study, we revealed potential differences in neural oscillatory and non-oscillatory dynamics between AD and FTD patients, with aperiodic components exhibiting better performance in distinguishing between AD and FTD. Our findings provide important new insights for the precise identification and distinction of these two dementia-related diseases.
Supplementary Information
Below is the link to the electronic supplementary material.
Acknowledgements
We acknowledge the support of the 2nd Department of Neurology of AHEPA General University Hospital of Thessaloniki for graciously sharing the datasets. All the participants who volunteered for this study deserve our gratitude. We also thank ChatGPT (version 3.5, Open AI, San Francisco, CA, USA) for its assistance in the visualization of the results.
Abbreviations
- AD
Alzheimer’s disease
- ANOVA
Analysis of variance
- AUC
Area under curve
- CN
Healthy controls
- EEG
Electroencephalography
- E/I
Excitation/inhibition
- FDR
False discovery rate
- FTD
Frontotemporal dementia
- MMSE
Mini-Mental State Examination
- NFTs
Neurofibrillary tangles
- PSD
Power spectral density
- SMOTE
Synthetic Minority Oversampling Technique
- SVM
Support vector machine
- TAR
Theta alpha power ratio
Author contribution
Z.W. and W.Z. provided the concept and design; Z.W., A.L., J.Y., P.W., and Y.B. analyzed and explained the data; J.Z. and S.X. guided the data processing in this study; Z.W. and W.Z. wrote the main manuscript; W.Z., B.G., and J.Z. supervised the study. All authors read and approved the final manuscript.
Data availability
The datasets analyzed during the current study are available in the ds004504 repository, https://github.com/OpenNeuroDatasets/ds004504. The custom codes used for the current study are available at https://github.com/dcgggg/ds004504_Aperdiodic.
Declarations
Ethical approval
Ethical approval was already approved for data acquisition in the previous work [32, 33].
Conflict of interest
The authors declare no competing interests.
Footnotes
Publisher's Note
Springer Nature remains neutral with regard to jurisdictional claims in published maps and institutional affiliations.
Contributor Information
Jiajun Zhang, Email: zhjiajun@mail.sysu.edu.cn.
Hongbo Guo, Email: guohongbo911@126.com.
Wangming Zhang, Email: wzhang@vip.126.com.
References
- 1.Lattante S, Ciura S, Rouleau GA, Kabashi E. Defining the genetic connection linking amyotrophic lateral sclerosis (ALS) with frontotemporal dementia (FTD) Trends Genet. 2015;31:263–273. doi: 10.1016/j.tig.2015.03.005. [DOI] [PubMed] [Google Scholar]
- 2.Mendez MF, Perryman KM, Miller BL, Cummings JL. Behavioral differences between frontotemporal dementia and Alzheimer’s disease: a comparison on the BEHAVE-AD rating scale. Int Psychogeriatr. 1998;10:155–162. doi: 10.1017/s1041610298005262. [DOI] [PubMed] [Google Scholar]
- 3.Piguet O, Hornberger M, Mioshi E, Hodges JR. Behavioural-variant frontotemporal dementia: diagnosis, clinical staging, and management. Lancet Neurol. 2011;10:162–172. doi: 10.1016/S1474-4422(10)70299-4. [DOI] [PubMed] [Google Scholar]
- 4.Perry RJ, Hodges JR. Differentiating frontal and temporal variant frontotemporal dementia from Alzheimer’s disease. Neurology. 2000;54:2277–2284. doi: 10.1212/WNL.54.12.2277. [DOI] [PubMed] [Google Scholar]
- 5.Reul S, Lohmann H, Wiendl H, Duning T, Johnen A. Can cognitive assessment really discriminate early stages of Alzheimer’s and behavioural variant frontotemporal dementia at initial clinical presentation? Alzheimers Res Ther. 2017;9:61. doi: 10.1186/s13195-017-0287-1. [DOI] [PMC free article] [PubMed] [Google Scholar]
- 6.Minoshima S, Mosci K, Cross D, Thientunyakit T. Brain [F-18]FDG PET for clinical dementia workup: differential diagnosis of Alzheimer’s disease and other types of dementing disorders. Semin Nucl Med. 2021;51:230–240. doi: 10.1053/j.semnuclmed.2021.01.002. [DOI] [PubMed] [Google Scholar]
- 7.Talbot PR, Snowden JS, Lloyd JJ, Neary D, Testa HJ. The contribution of single photon emission tomography to the clinical differentiation of degenerative cortical brain disorders. J Neurol. 1995;242:579–586. doi: 10.1007/BF00868810. [DOI] [PubMed] [Google Scholar]
- 8.Yu Q, Mai Y, Ruan Y, Luo Y, Zhao L, Fang W, et al. An MRI-based strategy for differentiation of frontotemporal dementia and Alzheimer’s disease. Alzheimers Res Ther. 2021;13:23. doi: 10.1186/s13195-020-00757-5. [DOI] [PMC free article] [PubMed] [Google Scholar]
- 9.Nardone R, Sebastianelli L, Versace V, Saltuari L, Lochner P, Frey V, et al. Usefulness of EEG techniques in distinguishing frontotemporal dementia from Alzheimer’s disease and other dementias. Dis Markers. 2018;2018:6581490. doi: 10.1155/2018/6581490. [DOI] [PMC free article] [PubMed] [Google Scholar]
- 10.Huang C, Wahlund L, Dierks T, Julin P, Winblad B, Jelic V. Discrimination of Alzheimer’s disease and mild cognitive impairment by equivalent EEG sources: a cross-sectional and longitudinal study. Clin Neurophysiol. 2000;111:1961–1967. doi: 10.1016/s1388-2457(00)00454-5. [DOI] [PubMed] [Google Scholar]
- 11.Jiao B, Li R, Zhou H, Qing K, Liu H, Pan H, et al. Neural biomarker diagnosis and prediction to mild cognitive impairment and Alzheimer’s disease using EEG technology. Alzheimers Res Ther. 2023;15:32. doi: 10.1186/s13195-023-01181-1. [DOI] [PMC free article] [PubMed] [Google Scholar]
- 12.Mattia D, Babiloni F, Romigi A, Cincotti F, Bianchi L, Sperli F, et al. Quantitative EEG and dynamic susceptibility contrast MRI in Alzheimer’s disease: a correlative study. Clin Neurophysiol. 2003;114:1210–1216. doi: 10.1016/s1388-2457(03)00085-3. [DOI] [PubMed] [Google Scholar]
- 13.Meghdadi AH, StevanovićKarić M, McConnell M, Rupp G, Richard C, Hamilton J, et al. Resting state EEG biomarkers of cognitive decline associated with Alzheimer’s disease and mild cognitive impairment. PLoS ONE. 2021;16:e0244180. doi: 10.1371/journal.pone.0244180. [DOI] [PMC free article] [PubMed] [Google Scholar]
- 14.Lindau M, Jelic V, Johansson S-E, Andersen C, Wahlund L-O, Almkvist O. Quantitative EEG abnormalities and cognitive dysfunctions in frontotemporal dementia and Alzheimer’s disease. Dement Geriatr Cogn Disord. 2003;15:106–114. doi: 10.1159/000067973. [DOI] [PubMed] [Google Scholar]
- 15.Passant U, Rosén I, Gustafson L, Englund E. The heterogeneity of frontotemporal dementia with regard to initial symptoms, qEEG and neuropathology. Int J Geriatr Psychiatry. 2005;20:983–988. doi: 10.1002/gps.1388. [DOI] [PubMed] [Google Scholar]
- 16.Milstein J, Mormann F, Fried I, Koch C. Neuronal shot noise and Brownian 1/f2 behavior in the local field potential. PLoS ONE. 2009;4:e4338. doi: 10.1371/journal.pone.0004338. [DOI] [PMC free article] [PubMed] [Google Scholar]
- 17.He BJ. Scale-free brain activity: past, present, and future. Trends Cogn Sci. 2014;18:480–487. doi: 10.1016/j.tics.2014.04.003. [DOI] [PMC free article] [PubMed] [Google Scholar]
- 18.Voytek B, Knight RT. Dynamic network communication as a unifying neural basis for cognition, development, aging, and disease. Biol Psychiatry. 2015;77:1089–1097. doi: 10.1016/j.biopsych.2015.04.016. [DOI] [PMC free article] [PubMed] [Google Scholar]
- 19.Gao R. Interpreting the electrophysiological power spectrum. J Neurophysiol. 2016;115:628–630. doi: 10.1152/jn.00722.2015. [DOI] [PMC free article] [PubMed] [Google Scholar]
- 20.Gao R, Peterson EJ, Voytek B. Inferring synaptic excitation/inhibition balance from field potentials. Neuroimage. 2017;158:70–78. doi: 10.1016/j.neuroimage.2017.06.078. [DOI] [PubMed] [Google Scholar]
- 21.Voytek B, Kramer MA, Case J, Lepage KQ, Tempesta ZR, Knight RT, et al. Age-related changes in 1/f neural electrophysiological noise. J Neurosci. 2015;35:13257–13265. doi: 10.1523/JNEUROSCI.2332-14.2015. [DOI] [PMC free article] [PubMed] [Google Scholar]
- 22.Schaworonkow N, Voytek B. Longitudinal changes in aperiodic and periodic activity in electrophysiological recordings in the first seven months of life. Dev Cogn Neurosci. 2021;47:100895. doi: 10.1016/j.dcn.2020.100895. [DOI] [PMC free article] [PubMed] [Google Scholar]
- 23.Miskovic V, MacDonald KJ, Rhodes LJ, Cote KA. Changes in EEG multiscale entropy and power-law frequency scaling during the human sleep cycle. Hum Brain Mapp. 2019;40:538–551. doi: 10.1002/hbm.24393. [DOI] [PMC free article] [PubMed] [Google Scholar]
- 24.Lendner JD, Helfrich RF, Mander BA, Romundstad L, Lin JJ, Walker MP, et al. An electrophysiological marker of arousal level in humans. Elife 2020;9. 10.7554/eLife.55092. [DOI] [PMC free article] [PubMed]
- 25.Pertermann M, Bluschke A, Roessner V, Beste C. The modulation of neural noise underlies the effectiveness of methylphenidate treatment in attention-deficit/hyperactivity disorder. Biol Psychiatry. 2019;4:743–750. doi: 10.1016/j.bpsc.2019.03.011. [DOI] [PubMed] [Google Scholar]
- 26.Racz F, Farkas K, Stylianou O, Kaposzta Z, Czoch A, Csukly G, et al. Separating scale-free and oscillatory components of neural activity in schizophrenia. Brain Behav 2021;11. 10.1002/brb3.2047. [DOI] [PMC free article] [PubMed]
- 27.Wang Z, Mo Y, Sun Y, Hu K, Peng C, Zhang S, et al. Separating the aperiodic and periodic components of neural activity in Parkinson’s disease. Eur J Neurosci. 2022 doi: 10.1111/ejn.15774. [DOI] [PubMed] [Google Scholar]
- 28.Ouyang G, Hildebrandt A, Schmitz F, Herrmann CS. Decomposing alpha and 1/f brain activities reveals their differential associations with cognitive processing speed. Neuroimage. 2020;205:116304. doi: 10.1016/j.neuroimage.2019.116304. [DOI] [PubMed] [Google Scholar]
- 29.Cross ZR, Corcoran AW, Schlesewsky M, Kohler MJ, Bornkessel-Schlesewsky I. Oscillatory and aperiodic neural activity jointly predict language learning. J Cogn Neurosci. 2022;1–20. 10.1162/jocn_a_01878. [DOI] [PubMed]
- 30.Donoghue T, Haller M, Peterson EJ, Varma P, Sebastian P, Gao R, et al. Parameterizing neural power spectra into periodic and aperiodic components. Nat Neurosci. 2020;23:1655–1665. doi: 10.1038/s41593-020-00744-x. [DOI] [PMC free article] [PubMed] [Google Scholar]
- 31.Miltiadous A, Tzimourta KD, Afrantou T, Ioannidis P, Grigoriadis N, Tsalikakis DG, et al. A dataset of 88 EEG recordings from: Alzheimer’s disease, frontotemporal dementia and healthy subjects 2023. 10.18112/OPENNEURO.DS004504.V1.0.4.
- 32.Miltiadous A, Tzimourta KD, Giannakeas N, Tsipouras MG, Afrantou T, Ioannidis P, et al. Alzheimer’s disease and frontotemporal dementia: a robust classification method of EEG signals and a comparison of validation methods. Diagnostics. 2021;11:1437. doi: 10.3390/diagnostics11081437. [DOI] [PMC free article] [PubMed] [Google Scholar]
- 33.Tzimourta KD, Afrantou T, Ioannidis P, Karatzikou M, Tzallas AT, Giannakeas N, et al. Analysis of electroencephalographic signals complexity regarding Alzheimer’s disease. Comput Electr Eng. 2019;76:198–212. doi: 10.1016/j.compeleceng.2019.03.018. [DOI] [Google Scholar]
- 34.Miltiadous A, Tzimourta KD, Afrantou T, Ioannidis P, Grigoriadis N, Tsalikakis DG, et al. A dataset of scalp EEG recordings of Alzheimer’s disease, frontotemporal dementia and healthy subjects from routine EEG. Data. 2023;8:95. doi: 10.3390/data8060095. [DOI] [Google Scholar]
- 35.Delorme A, Makeig S. EEGLAB: an open source toolbox for analysis of single-trial EEG dynamics including independent component analysis. J Neurosci Methods. 2004;134:9–21. doi: 10.1016/j.jneumeth.2003.10.009. [DOI] [PubMed] [Google Scholar]
- 36.Chang C-Y, Hsu S-H, Pion-Tonachini L, Jung T-P. Evaluation of artifact subspace reconstruction for automatic artifact components removal in multi-channel EEG recordings. IEEE Trans Biomed Eng. 2020;67:1114–1121. doi: 10.1109/TBME.2019.2930186. [DOI] [PubMed] [Google Scholar]
- 37.Winkler I, Haufe S, Tangermann M. Automatic classification of artifactual ICA-components for artifact removal in EEG signals. Behav Brain Funct. 2011;7:30. doi: 10.1186/1744-9081-7-30. [DOI] [PMC free article] [PubMed] [Google Scholar]
- 38.Chang C-C, Lin C-J. LIBSVM: A library for support vector machines. ACM Trans Intell Syst Technol. 2011;2:27:1–27:27. doi: 10.1145/1961189.1961199. [DOI] [Google Scholar]
- 39.Chawla NV, Bowyer KW, Hall LO, Kegelmeyer WP. SMOTE: synthetic minority over-sampling technique. J Artif Intell Res. 2002;16:321–357. doi: 10.1613/jair.953. [DOI] [Google Scholar]
- 40.Donoghue T, Dominguez J, Voytek B. Electrophysiological frequency band ratio measures conflate periodic and aperiodic neural activity. eNeuro 2020;7. 10.1523/ENEURO.0192-20.2020. [DOI] [PMC free article] [PubMed]
- 41.Caso F, Cursi M, Magnani G, Fanelli G, Falautano M, Comi G, et al. Quantitative EEG and LORETA: valuable tools in discerning FTD from AD? Neurobiol Aging. 2012;33:2343–2356. doi: 10.1016/j.neurobiolaging.2011.12.011. [DOI] [PubMed] [Google Scholar]
- 42.Ma C, M N, M B, O G, S C, M R, et al. The spectral exponent of the resting EEG indexes the presence of consciousness during unresponsiveness induced by propofol, xenon, and ketamine. NeuroImage 2019;189. 10.1016/j.neuroimage.2019.01.024. [DOI] [PubMed]
- 43.Zsido RG, Molloy EN, Cesnaite E, Zheleva G, Beinhölzl N, Scharrer U, et al. One-week escitalopram intake alters the excitation-inhibition balance in the healthy female brain. Hum Brain Mapp. 2022 doi: 10.1002/hbm.25760. [DOI] [PMC free article] [PubMed] [Google Scholar]
- 44.Maestú F, de Haan W, Busche MA, DeFelipe J. Neuronal excitation/inhibition imbalance: core element of a translational perspective on Alzheimer pathophysiology. Ageing Res Rev. 2021;69:101372. doi: 10.1016/j.arr.2021.101372. [DOI] [PubMed] [Google Scholar]
- 45.Ghosh I, Liu CS, Swardfager W, Lanctôt KL, Anderson ND. The potential roles of excitatory-inhibitory imbalances and the repressor element-1 silencing transcription factor in aging and aging-associated diseases. Mol Cell Neurosci. 2021;117:103683. doi: 10.1016/j.mcn.2021.103683. [DOI] [PubMed] [Google Scholar]
- 46.Merkin A, Sghirripa S, Graetz L, Smith AE, Hordacre B, Harris R, et al. Do age-related differences in aperiodic neural activity explain differences in resting EEG alpha? Neurobiol Aging. 2022 doi: 10.1016/j.neurobiolaging.2022.09.003. [DOI] [PubMed] [Google Scholar]
- 47.Knafo S, Alonso-Nanclares L, Gonzalez-Soriano J, Merino-Serrais P, Fernaud-Espinosa I, Ferrer I, et al. Widespread changes in dendritic spines in a model of Alzheimer’s disease. Cereb Cortex. 2009;19:586–592. doi: 10.1093/cercor/bhn111. [DOI] [PubMed] [Google Scholar]
- 48.León-Espinosa G, DeFelipe J, Muñoz A. Effects of amyloid-β plaque proximity on the axon initial segment of pyramidal cells. J Alzheimers Dis. 2012;29:841–852. doi: 10.3233/JAD-2012-112036. [DOI] [PubMed] [Google Scholar]
- 49.Garcia-Marin V. Diminished perisomatic GABAergic terminals on cortical neurons adjacent to amyloid plaques. Front Neuroanat 2009;3. 10.3389/neuro.05.028.2009. [DOI] [PMC free article] [PubMed]
- 50.Merino-Serrais P, Benavides-Piccione R, Blazquez-Llorca L, Kastanauskaite A, Rábano A, Avila J, et al. The influence of phospho-tau on dendritic spines of cortical pyramidal neurons in patients with Alzheimer’s disease. Brain. 2013;136:1913–1928. doi: 10.1093/brain/awt088. [DOI] [PMC free article] [PubMed] [Google Scholar]
- 51.Bang J, Spina S, Miller BL. Frontotemporal dementia. Lancet. 2015;386:1672–1682. doi: 10.1016/S0140-6736(15)00461-4. [DOI] [PMC free article] [PubMed] [Google Scholar]
- 52.Lendner JD, Harler U, Daume J, Engel AK, Zöllner C, Schneider TR, et al. Oscillatory and aperiodic neuronal activity in working memory following anesthesia. Clin Neurophysiol. 2023;150:79–88. doi: 10.1016/j.clinph.2023.03.005. [DOI] [PubMed] [Google Scholar]
- 53.Garn H, Waser M, Deistler M, Schmidt R, Dal-Bianco P, Ransmayr G, et al. Quantitative EEG in Alzheimer’s disease: cognitive state, resting state and association with disease severity. Int J Psychophysiol Off J Int Organ Psychophysiol. 2014;93:390–397. doi: 10.1016/j.ijpsycho.2014.06.003. [DOI] [PubMed] [Google Scholar]
- 54.Ibarra Chaoul A, Siegel M. Cortical correlation structure of aperiodic neuronal population activity. Neuroimage. 2021;245:118672. doi: 10.1016/j.neuroimage.2021.118672. [DOI] [PMC free article] [PubMed] [Google Scholar]
- 55.Ranjan B, Sun W, Park J, Mishra K, Schmidt F, Xie R, et al. DUBStepR is a scalable correlation-based feature selection method for accurately clustering single-cell data. Nat Commun. 2021;12:5849. doi: 10.1038/s41467-021-26085-2. [DOI] [PMC free article] [PubMed] [Google Scholar]
Associated Data
This section collects any data citations, data availability statements, or supplementary materials included in this article.
Supplementary Materials
Data Availability Statement
The datasets analyzed during the current study are available in the ds004504 repository, https://github.com/OpenNeuroDatasets/ds004504. The custom codes used for the current study are available at https://github.com/dcgggg/ds004504_Aperdiodic.


