Abstract
The t(14;19)(q32;q13) often juxtaposes BCL3 with immunoglobulin heavy chain (IGH) resulting in overexpression of the gene. In contrast to other oncogenic translocations, BCL3 rearrangement (BCL3-R) has been associated with a broad spectrum of lymphoid neoplasms. Here we report an integrative whole-genome sequence, transcriptomic, and DNA methylation analysis of 13 lymphoid neoplasms with BCL3-R. The resolution of the breakpoints at single base-pair revealed that they occur in two clusters at 5’ (n=9) and 3’ (n=4) regions of BCL3 associated with two different biological and clinical entities. Both breakpoints were mediated by aberrant class switch recombination of the IGH locus. However, the 5’ breakpoints (upstream) juxtaposed BCL3 next to an IGH enhancer leading to overexpression of the gene whereas the 3’ breakpoints (downstream) positioned BCL3 outside the influence of the IGH and were not associated with its expression. Upstream BCL3-R tumors had unmutated IGHV, trisomy 12, and mutated genes frequently seen in chronic lymphocytic leukemia (CLL) but had an atypical CLL morphology, immunophenotype, DNA methylome, and expression profile that differ from conventional CLL. In contrast, downstream BCL3-R neoplasms were atypical splenic or nodal marginal zone lymphomas (MZL) with mutated IGHV, complex karyotypes and mutated genes typical of MZL. Two of the latter four tumors transformed to a large B-cell lymphoma. We designed a novel fluorescence in situ hybridization assay that recognizes the two different breakpoints and validated these findings in 17 independent tumors. Overall, upstream or downstream breakpoints of BCL3-R are mainly associated with two subtypes of lymphoid neoplasms with different (epi)genomic, expression, and clinicopathological features resembling atypical CLL and MZL, respectively.
Introduction
The t(14;19)(q32;q13) is a balanced translocation found in less than 1% of lymphoid neoplasms that often leads to the juxtaposition of BCL3 (B-cell leukemia/lymphoma 3) with regulatory elements of the immunoglobulin heavy chain (IGH) gene, resulting in the overexpression of the gene.1 BCL3 encodes an IκB-like nuclear protein that regulates NF-κB activity apparently as a molecular adaptor between NF-κB transcription factors and nuclear co-activator and co-repressor complexes.2 Although the function of BCL3 in B cells is not fully understood, this gene seems to be involved in regulation of cell proliferation, differentiation, and survival.3,4 In transgenic mice, Bcl3 overexpression promoted accumulation of mature B cells but it was not sufficient to drive malignant transformation.5
Chromosomal translocations activating oncogenes in lymphoid neoplasms are usually associated with relatively specific tumor subtypes. However, the t(14;19) and BCL3 rearrangement (BCL3-R) have been identified in a broad spectrum of different tumor subtypes.6,7 Most patients have been diagnosed with chronic lymphocytic leukemia (CLL), atypical CLL, or transformed CLL. These tumors frequently have an unmutated IGHV (U-IGHV) and trisomy 12. However, they also have atypical features for CLL, including cytology and immunophenotype not characteristic of CLL, frequent IGHV stereotype #8, and aggressive behavior in some series.6-9 Some authors have suggested that B-cell neoplasms carrying the t(14;19) could represent an entity different from CLL.6 In addition to these tumors resembling CLL, the t(14;19) and BCL3-R have been also identified in diffuse large B-cell lymphomas (DLBCL), marginal zone lymphomas (MZL), splenic small B-cell lymphomas, and tumors diagnosed as B-cell non-Hodgkin lymphomas, some of them with evidence of transformation.6,7 Whether this diversity of entities associated with BCL3-R corresponds to a real biological promiscuity is not clear. Some reports included tumors with the t(14;19) by cytogenetics without the specific analysis of BCL3-R. Since this translocation may rearrange genes other than BCL3, it is possible that some of the series reported may have included tumors that did not involve BCL3. Furthermore, some studies included tumors for which the pathological features were not thoroughly reviewed.6,7
The purposes of this study were to characterize the genomic configuration of BCL3-R in B-cell neoplasms and to understand the clinical and biological significance of this alteration using an integrative (epi)genomic and transcriptomic analysis in a cohort of patients with available clinical and pathological characteristics.
Methods
Patients and samples
We searched the cytogenetic files of lymphoid B-cell neoplasms with t(14;19) or BCL3-R in three institutions from 2008 to 2019. Fluorescence in situ hybridization (FISH) with dual-color break-apart probes for IGH and BCL3 genes (XL IGH BA and XL BCL3 BA, Metasystems) was performed in patients with available material. Patients with t(14;19), but lacking confirmation of BCL3-R, were excluded. Overall, 13 B-cell neoplasms carrying BCL3-R, with available material for genomic studies, were identified (Table 1; Online Supplementary Figure S1; Online Supplementary Table S1). These cases represent 0.28% of all small B-cell lymphomas studied genetically. The initial diagnoses were atypical CLL (aCLL) (n=5), SLL/CLL (n=3), splenic marginal zone lymphoma (SMZL) (n=3), lymphoplasmacytic lymphoma (n=1), and unclassifiable low-grade B-cell leukemic neoplasm (n=1). Tumor DNA was obtained from cryopreserved blood cells or frozen tumor tissue in all patients, germline DNA from non-neoplastic blood cells or saliva (n=10), and RNA from peripheral blood purified cells (n=5) or frozen tissue (n=2). Informed consent was obtained from all patients, and the study was approved by the Ethics Committee of the Hospital Clinic of Barcelona.
Genomic studies
Whole-genome sequencing (WGS) of the 13 tumors and 10 paired normal DNA samples was performed using the TruSeq DNA PCR Free or TruSeq DNA nano library preparation. Raw reads were mapped to the human reference genome (GRCh37) using the BWA-MEM algorithm.10 Immunoglobulin gene rearrangements were extracted using IgCaller (version 1.1)11 and annotated using IMGT/V-QUEST.12 Genomic alterations were identified using a multi-caller bioinformatics approach (Online Supplementary Appendix).13 Driver mutations were studied considering a list of 247 recurrently mutated genes in B-cell neoplasms (Online Supplementary Appendix; Online Supplementary Table S2). Total RNA sequencing (RNA-seq) was performed in seven tumors with BCL3-R and nine CLL without BCL3-R. Raw data were analyzed as previously described (Online Supplementary Appendix)13 using the DESeq2 package.14 mRNA-seq data from our International Cancer Genome Consortium CLL cohort were used for comparison.15 DNA methylation profiles of ten BCL3-R tumors were generated using EPIC methylation arrays. Similar data from 85 CLL were obtained for comparison from two previous publications: cohort 1 (C1) included 12 CLL from our institution,13 and cohort 2 (C2) 73 CLL from University Hospital Heidelberg.16 Data analyses were performed using minfi and limma packages.17,18 The AME tool from the MEME suite19 was used for enrichment analysis of known motifs (2022 JASPAR database; Online Supplementary Appendix).20 WGS, RNA-seq, and DNA methylation data are deposited in the European Genome-phenome Archive.
Immunohistochemistry
BCL3 protein expression was studied by immunohistochemistry (IHC) in tumors with formalin-fixed paraffin-embedded tissue. Tissue sections (3 mm) were stained using a Leica Bond-MAX stainer (Leica Biosystems) and the antiBCL3 primary antibody (23959-1-AP; Proteintech) (Online Supplementary Appendix).
Custom BCL3 fluorescence in situ hybridization
Custom BCL3 break-apart FISH probes to detect 5’ and 3’ BCL3 breakpoints were designed using three differentially labeled BAC clones: RP11-927F16 (spectrum orange), CTD-2608C5 (spectrum aqua), and RP11-423N20 (spectrum green) from the Children´s Hospital Oakland Research Institute library obtained from the Molecular Cytogenetics Platform of IMIM (Barcelona, Spain) and Life Technologies. BAC extraction and labeling, slide preparation, and hybridization were performed according to standard procedures.21
Results
Genomic characterization of the BCL3 rearrangement
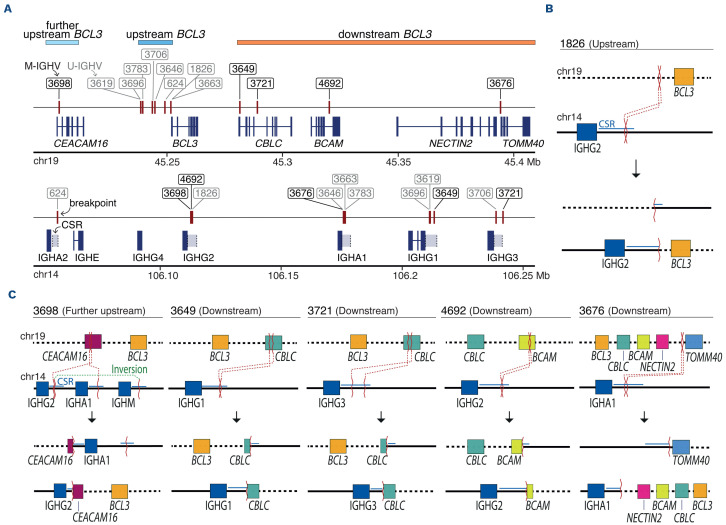
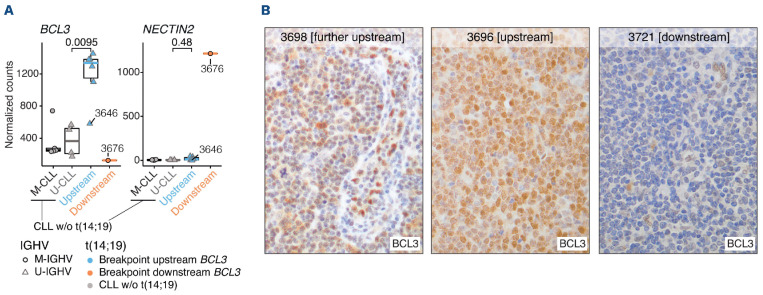
We first characterized the breakpoints of the BCL3 rearrangement at base-pair resolution using WGS data from 13 tumors (Online Supplementary Table S3). BCL3 was rearranged with the IGH region as a clonal event in all but one tumor (3646), in which the number of reads suggested a subclonal distribution. All tumors had breakpoints on chromosome 14 within class switch recombination (CSR) regions of the IGH locus (Figure 1A). Breakpoints occurred in IGHA2 (n=1), IGHG2 (n=3), IGHA1 (n=4), IGHG1 (n=3), and IGHG3 (n=3). Breakpoints on chromosome 19 (chr19) were found upstream of the 5’ untranslated region (UTR) of BCL3 in eight of 13 (61.5%) tumors (Figure 1A). These breakpoints occurred within a window of 13 kb, and the translocation juxtaposed BCL3 downstream of the CSR (Figure 1B). Notably, all eight tumors had U-IGHV, six had 100%, and two had 99.6% IGHV identity with the germline (Figure 1A; Online Supplementary Table S4). One additional tumor (3698) with mutated IGHV (M-IGHV) (94.4% identity) had a breakpoint further upstream of BCL3 truncating CEA-CAM16, although the result of the translocation also placed BCL3 downstream of the CSR (Figures 1A, C). The four remaining tumors had breakpoints downstream of BCL3, two within CBLC, one in BCAM, and one after NEC-TIN2 (Figure 1A). In these four translocations, BCL3 was not located after the CSR of IGH; therefore, it does not seem to be the target of the translocation (Figure 1C). All tumors carrying the breakpoint downstream of BCL3 had M-IGHV with <98% germline identity. In order to determine the influence of the chr19 breakpoint on BCL3 expression, we studied 12 tumors, seven by RNA-seq (6 with the breakpoint upstream and 1 downstream) and seven by IHC (3 upstream and 4 downstream). Two tumors were studied using both approaches (Online Supplementary Table S5). Eight tumors carrying the upstream BCL3-R, including one further upstream (3698), overexpressed BCL3 in comparison to CLL without this rearrangement (Figures 2A, B). No protein expression was detected by IHC in ten additional nodal CLL with unmutated IGHV (U-CLL) with trisomy 12 and without BCL3-R. In contrast, the four tumors downstream BCL3-R did not express BCL3 (Figures 2A, B). The only downstream BCL3-R tumor with RNA available (3676) showed overexpression of NECTIN2, which was negative in all upstream BCL3-R tumors (Figures 2A).
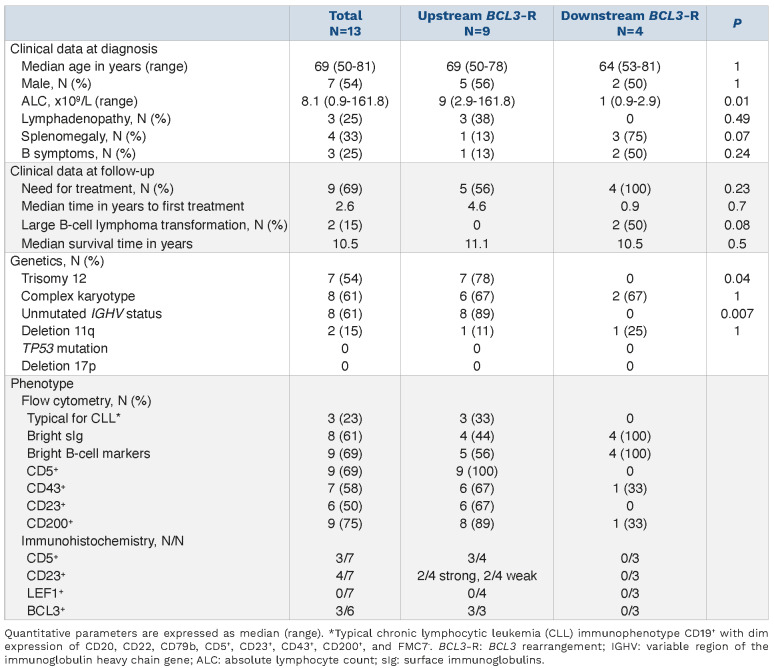
Table 1.
Clinical and pathological features of 13 patients with BCL3 rearrangement.
Overall, the location of the chr19 breakpoint distinguishes two main subgroups: i) tumors with upstream BCL3-R breakpoints, which overexpress BCL3 and are enriched in U-IGHV, and ii) tumors with downstream BCL3-R breakpoints, which do not overexpress BCL3 and carry M-IGHV.
Genomic landscape
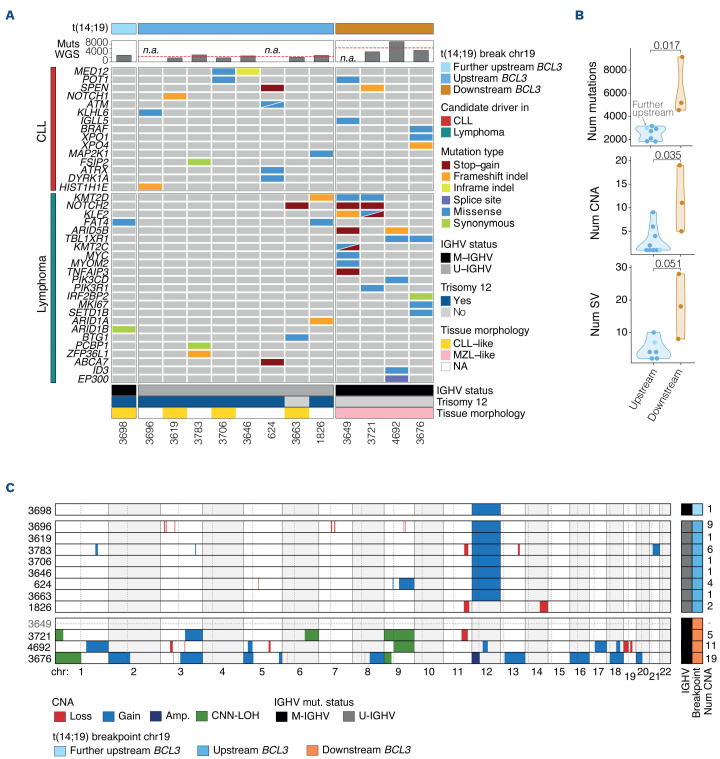
Tumors with upstream BCL3-R, excluding the three patients lacking normal DNA, had significantly fewer somatic mutations (mean 2,511; range, 1,825-3,165; n=7) than tumors with downstream BCL3-R (mean 6,271.7; range, 4,535-9,125; n=3) (P<0.05; Figure 3A, B; Online Supplementary Table S6). Mutational signature analysis identified the presence of SBS1, SBS5, and SBS8 in all cases, SBS18 in seven cases, and SBS9 in three tumors with M-IGHV (Online Supplementary Figure S2; Online Supplementary Table S7). In addition, we searched for activation-induced deaminase (AID) motifs in the mutations occurring in IGH locus between the constant gene and class switch regions. We found that 17 of 25 (68%) mutations occurred in AID motifs (Online Supplementary Table S8).
The driver mutations in the upstream BCL3-R subgroup were very heterogeneous, with only MED12 and FAT4 recurrently mutated in two tumors each. Other mutated genes have also been frequently described in CLL (AT M, NOTCH1, POT1, KHL6). In the four downstream BCL3-R tumors, two carried mutations in KMT2D, NOTCH2, and KLF2, frequently seen in MZL, whereas the remaining two tumors had recurrent mutations in TBL1XR1, detected in aggressive lymphomas, but also in some MZL (Figure 3A).
Figure 1.
Characterization of the breakpoints derived from the t(14;19) at base-pair resolution. (A) Representation of the breakpoints on chromosome 19 (chr19) and chr14 for each patient (red vertical Line). Unmutated variable region of the immunoglobulin heavy chain gene (U-IGHV) and mutated IGHV (M-IGHV) tumors are represented in gray and black labels, respectively. Tumors are classified based on the breakpoint on chromosome 19 (chr19): further upstream BCL3 (pale blue), upstream BCL3 (blue), and downstream BCL3 (orange). (B) Schema of the most recurrent translocation pattern observed in the upstream BCL3 subgroup with IGH and its corresponding class switch recombination (CSR) located upstream BCL3, suggesting a constitutive upregulation of BCL3. (C) Depiction of 5 patients, 1 with the translocation further upstream BCL3 and 4 with the translocation downstream BCL3. In the further upstream tumor (3698), the t(14;19) truncates CEACAM16 and, similar to upstream BCL3 translocations, IGH is located 5' of BCL3 suggesting a constitutive upregulation of this gene. In the downstream tumors, the t(14;19) affects 3 different genes (CBLC, BCAM, NECTIN2) located downstream of BCL3. The resulting derivatives of the t(14;19) suggest that BCL3 is not placed under the regulation of the enhancers of the IGH and, therefore, its expression remains unchanged.
Figure 2.
BCL3 expression in upstream and downstream tumors with BCL3 rearrangement. (A) RNA-sequencing data shows that BCL3 is upregulated in the upstream BCL3 tumors, except tumor 3646 carrying a subclonal t(14;19), compared to unmutated chronic lymphocyitc leukemia (U-CLL). Contrarily, the downstream BCL3 tumor (3676) upregulated NECTIN2 while showed lower BCL3 expression than any of the upstream and CLL tumors. (B) Immunohistochemistry images (400x) displaying a positive BCL3 expression in the further upstream tumor and in a representative upstream tumor, but not in a representative downstream tumor.
In terms of CNA, upstream BCL3-R tumors had a significantly lower genomic complexity (mean 2.9; range, 1-9; n=9) than downstream BCL3-R tumors (mean 11.7; range, 5-19; n=3) (P<0.05; Figure 3B; Online Supplementary Table S9). All but one upstream BCL3-R tumor carried trisomy 12, but this aberration was not observed in any of the downstream BCL3-R tumors (Figures 3B, C; Online Supplementary Figure S3). In line with the copy number alterations (CNA), the number of structural variations (SV) was lower in upstream BCL3-R tumors than in downstream BCL3-R tumors (mean 4.8 SV; range, 2-10 [n=6] vs. 18 SV; range, 8-28 [n=3], respectively) (Figures 3B; Online Supplementary Figure S4; Online Supplementary Table S10).
Gene expression profiling
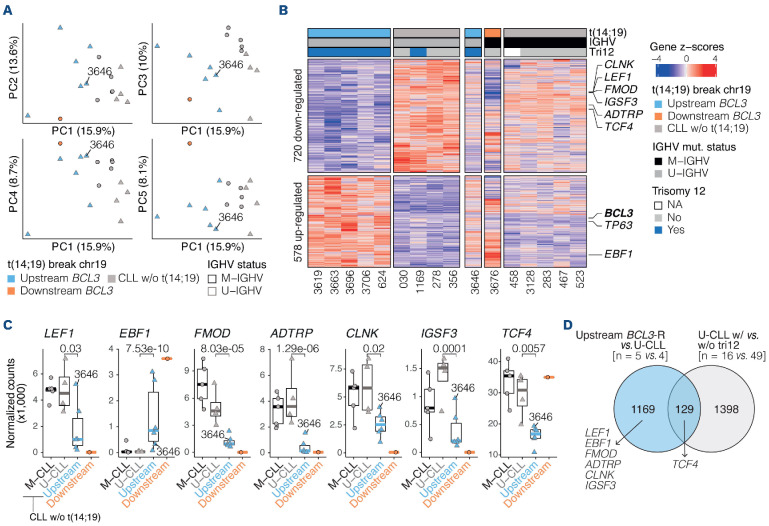
In order to determine the gene expression profile of the BCL3-R tumors, we compared the RNA-seq data of seven BCL3-R tumors (6 with upstream and 1 downstream breakpoint) with nine CLL (4 U-CLL and 5 mutated IGHV [M-CLL]). An unsupervised principal component analysis (PCA) suggested that upstream BCL3-R tumors displayed a distinct gene expression profile with some similarities with both M-CLL and U-CLL, whereas the downstream BCL3-R tumor did not cluster with any of the other tumors (Figure 4A). Then, we conducted a differential expression analysis (DEA) between upstream BCL3-R tumors, all U-IGHV with trisomy 12, four CLL with U-IGHV, and one with trisomy 12 (excluding tumor 3646 with subclonal BCL3-R). This analysis identified 1,298 differentially expressed genes (DEG): 578 upregulated and 720 downregulated in the upstream BCL3-R subgroup (q<0.05; Figure 4B; Online Supplementary Table S11). These genes showed similar expression levels in U- and M-CLL (Figure 4B; Online Supplementary Table S12). Significant expression differences were found in genes previously described as characteristically down- or upregulated in CLL compared with other B-cell neoplasms.22-24 Among them, upstream BCL3-R tumors had significant overexpression of EBF1, usually not expressed in CLL, and, in contrast, downregulation of LEF1, FMOD, ADTRP, CLNK, IGSF3, and TCF4, frequently over-expressed in CLL (Figure 4C).
To rule out a potential confounding effect of trisomy 12, we performed a DEA between 16 U-CLL with trisomy 12 and 49 U-CLL without trisomy 12 using data from our ICGC CLL cohort.15 These analyses identified 1,527 DEG (q<0.05, absolute (log2 fold change [FC])>0.1; Online Supplementary Table S13). Among them, only 129 (9.9%) were shared by the upstream BCL3-R tumors, suggesting that most DEG observed in BCL3-R tumors were not related to trisomy 12 (Figure 4D). Interestingly, most CLL-specific genes modulated in the upstream BCL3-R tumors appeared to be independent of trisomy 12 in U-CLL (Figure 4D; Online Supplementary Figure S5A).
Gene set enrichment analyses of upstream BCL3-R tumors and U-CLL with trisomy 12 showed that, while both subgroups of tumors shared some genes related to trisomy 12, most other pathways identified were expressed at lower levels in BCL3-R tumors, such as B-cell receptor (BCR) signaling or TNFα signaling via NF-κB (Online Supplementary Figure S5B; Online Supplementary Tables S14, S15). The lower BCR-signaling capacity of BCL3-R tumors was confirmed by measuring Ca2+ mobilization upon BCR stimulation with IgM (Online Supplementary Figure S6; Online Supplementary Appendix). These findings suggest that, although upstream BCL3-R tumors share a subset of commonly expressed genes in CLL carrying trisomy 12, they also have a remarkably distinct profile.
Figure 3.
Mutations and structural alterations in B-cell neoplasms with t(14;19) and BCL3 rearrangement identified by whole-exome sequencing. (A) Oncoprint representation of driver gene mutations frequently observed in chronic lymphocytic leukemia (CLL) (red) or in other B-cell lymphomas (blue-green). Total number of mutations are not reported in samples 3649, 3696, and 624 due to the lack of germline DNA (Online Supplementary Appendix; Online Supplementary Table S1). (B) Comparison of the number of mutations, copy number alterations (CNA) and structural variations (SV) between upstream BCL3 rearrangement (BCL3-R) and downstream BCL3-R tumors. (C) Copy number profile of BCL3-R tumors. Tumors are shown in rows and chromosomes in columns. The variable region of the immunoglobulin heavy chain gene (IGHV) mutational status, breakpoint location on chromosome 19, and number of CNA are shown on the right. Sample 3649 had an estimated tumor cell content of 20% that allowed the detection of driver somatic mutations and the BCL3-R but was not sufficient for a proper analysis of CNA (Online Supplementary Appendix; Online Supplementary Table S1). MZL: marginal zone lymphoma; CNN-LOH: copy number neutral loss of heterozygosity; Num: number; mut: mutational; NA: not available; M-IGHV: mutated IGHV; U-IGHV: unmutated IGHV.
Figure 4.
Gene expression profile of upstream tumors with BCL3 rearrangement. (A) Principal component analysis of RNA sequencing data of 6 upstream BCL3 rearrangement (BCL3-R) tumors, 1 downstream BCL3-R tumor, and 9 chronic lymphocytic leukemia (CLL) (1st component is shown against 2nd, 3rd, 4th and 5th components). (B) Heatmap of the differential gene expression analysis between 5 upstream BCL3-R tumors and 4 unmutated CLL (U-CLL), also compared to 1 tumor with downstream BCL3-R tumor and CLL without t(14;19). Tumor 3646 was excluded from the analysis due to its subclonal BCL3-R. Hallmark CLL genes differentially expressed between BCL3-R tumors and CLL are flagged. (C) Expression of CLL hallmark genes in the upstream BCL3-R tumors compared to U-CLL. Q-values are from the differential gene expression analysis. (D) Venn diagram showing the overlap of the differentially expressed genes among upstream BCL3-R versus U-CLL and U-CLL with versus without trisomy 12. Hallmark CLL genes are highlighted. IGHV: variable region of the immunoglobulin heavy chain gene; M-IGHV: mutated IGHV; U-IGHV: unmutated IGHV; NA: not available; M-CLL: mutated CLL; w/o: without.
DNA methylation
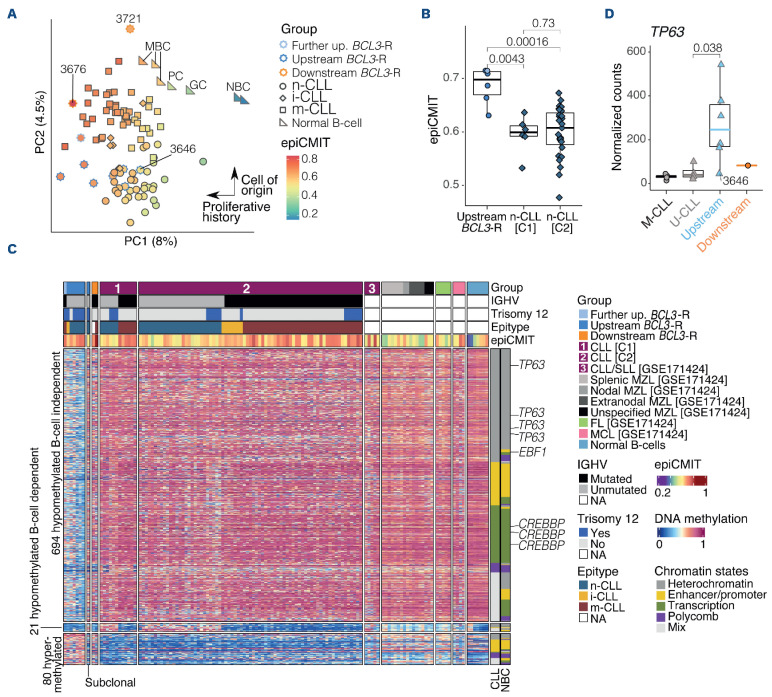
We analyzed the DNA methylation profile of eight upstream BCL3-R tumors, one of which was subclonal, and two downstream BCL3-R, and compared them with that of 85 CLL classified as naive-like CLL (n-CLL) (n=33), intermediate CLL (i-CLL) (n=7), or memory-like (m-CLL) (n=45),25,26 and seven normal B-cell subsets (2 naive, 1 germinal center, 3 memory, and 1 plasma cell). We first performed PCA using 764159 CpG (Figure 5A). Principal component 1 (PC1) reflected the variability related to the proliferative history of the cells captured by the epiCMIT score,26 whereas PC2 grouped samples based on the cell of origin, in which upstream BCL3-R clustered with n-CLL (Figure 5A). Upstream BCL3-R tumors had a higher proliferative history than n-CLL. This observation was confirmed by comparing epiCMIT scores between BCL3-R and n-CLL in the C1 (P=0.0043) and C2 (P=0.00016) CLL cohorts (Figure 5B).
In order to gain further insight into the differences between upstream BCL3-R and CLL, we performed differential methylation analysis between both subgroups of tumors adjusted for trisomy 12, IGHV status, epitype, and cohort (Figure 5C; Online Supplementary Figure S7A). This analysis showed 795 differentially methylated CpG (DMCpG), with 80 hyper- and 715 hypomethylated in BCL3-R tumors (q<0.05; log FC=0.25; Online Supplementary Table S16). A subset of 21 hypomethylated CpG in BCL3-R tumors was modulated during B-cell differentiation, being hypomethylated in germinal center-experienced normal B cells and M-CLL. Unmethylated CpG were enriched in heterochromatin and gene bodies, whereas hypermethylated CpG were enriched in enhancer-promoter regions (Online Supplementary Figure S7B). Among the DMCpG, 69 mapped to 37 DEG, with 45 of 64 (70%) hypomethylated CpG lo cated in the gene body (5’UTR/first exon/body/3’UTR, n=38) or promoter region (TSS1500/TSS200, n=7) of upregulated genes and four of five (80%) hypermethylated CpG mapped to the gene body (n=2) or promoter (n=2) of downregulated genes (Figure 5C; Online Supplementary Table S16). These genes include EBF1, CREBBP, and genes associated with NOTCH1 pathway (EPS15L1, ZMIZ1),27,28 cell proliferation (BHLHE40, TP63),29-31 cell motility and migration (CORO1C, GAB1, GRAMD1B, ITGB2),32-36 and poor outcomes in CLL or other lymphoid neoplasms (IMMP2L, OSBPL10, TP63).31,37,38 Notably, TP63, previously shown to be a pro-survival factor in CLL subset #8,31 was overexpressed in BCL3-R cases (Figure 5D). A subsequent transcription factor (TF) binding analysis in the hypomethylated CpG revealed a significant enrichment in the binding sites of B-cell-related TF such as BCL11B, RUNX3, IRF, JUN/FOS, and FOX families (Online Supplementary Table S17).
Figure 5.
DNA methylation profile of upstream tumors with BCL3 rearrangement. (A) Principal component analysis (PCA) of DNA methylation data of 10 B-cell neoplasms with BCL3 rearrangement (BCL3-R), 85 chronic lymphocytic leukemia (CLL), and 7 normal B-cells subsets (1st and 2nd components are shown). The shape corresponds to the tumor types while the color represents the proliferative history (epiCMIT score). (B) Comparison of the epiCMIT score between upstream BCL3-R tumors and naive-like CLL (n-CLL) from cohorts C1 and C2, respectively. The upstream BCL3-R subgroup of tumors does not include the tumor 3646 carrying a subclonal t(14;19). (C) Heatmap of the differentially methylated CpG between 7 upstream BCL3-R tumors and 85 CLL. The chromatin state of each CpG is shown on the right. Differentially methylated CpG mapping to differentially expressed CLL genes of interest are labeled. (D) TP63 expression in the upstream BCL3-R subgroup compared to CLL. NBC: naive B cell; GC: germinal center B cell; MBC memory B cell; PC: plasma cell; n-CLL: naive-like CLL; i-CLL: intermediate CLL; m-CLL: memory-like CLL; IGHV: variable region of the immunoglobulin heavy chain gene; NA: not available.
Pathology and clinical characteristics
Given the marked genomic differences between upstream and downstream BCL3-R tumors, we reanalyzed their pathological and clinical features separately (Table 1; Figure 6; Online Supplementary Tables S18, S19).
Upstream BCL3 rearrangement tumors
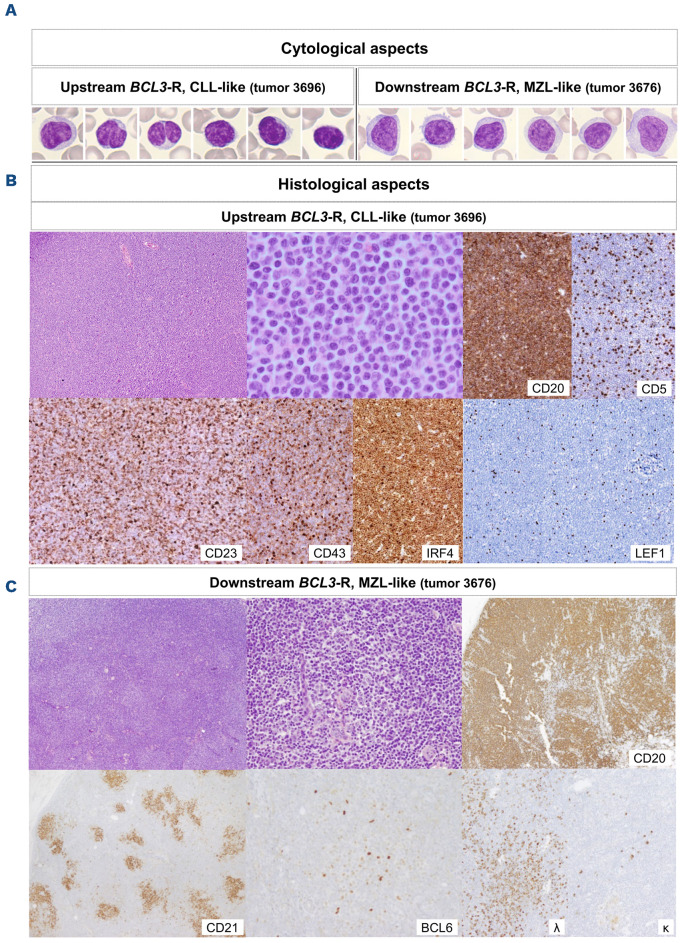
Tumor cells in peripheral blood were small medium-sized with condensed non-clumped chromatin and broader pale cytoplasm than expected in typical CLL/SLL. Typical clumped chromatin was observed in only one tumor. Five tumors had cells with indented nuclei and seven tumors had prominent nucleoli (Figure 6A). Lymph node biopsies showed diffuse infiltration by small-to medium-sized cells in all tumors. In two tumors the cells had irregular nuclei and prominent nucleoli. Variable numbers of dispersed large cells were observed in all tumors, but clear proliferation centers were observed in only two. Flow cytometry showed expression of mature B-cell markers with CD5 and CD200 positivity in all tumors, but a typical CLL immunophenotype (CD19+, CD79b+, CD5+, CD23+, CD43+, CD200+ with dim expression of CD20, CD22, and FMC7-) was only found in three of nine tumors (Table 1; Online Supplementary Table S19). The other tumors expressed bright B-cell antigens/surface IgG and/or were dim/negative for CD23 and CD43. In the tissue sections, the four tumors studied were LEF1 negative and no or very scant follicular dendritic networks were observed (Figure 6B).
Downstream BCL3-R tumors
Tumor cells in peripheral blood were larger than those in the previous group, and three of four tumors had villi or clasmatosis (Figure 6A). The patient without villous lymphocytes had multiple chromosomal alterations that were not specific to any lymphoid neoplasm. The two lymph nodes examined in these patients had infiltration by atypical small cells that partially preserved the architecture, with open sinusoids and occasional residual germinal centers. Tumor cells expanded the perifollicular areas and colonized germinal centers. One patient showed marked monotypic plasmacytosis. The two spleens showed expansion of the white pulp and partial infiltration of the red pulp by small-to medium-sized lymphoid proliferation with occasional larger cells, consistent with SMZL (Figure 6C). The four tumors expressed strong B-cell markers and were CD5 and CD23 negative. CD200 and CD43 were positive in one of three of the tumors, and two of three expressed IgD. Follicular dendritic cells highlighted the presence of residual germinal centers in all tumors (Figure 6C).
Clinical characteristics
The main clinical difference between the two subgroups was the higher lymphocyte count in the upstream BCL3-R subgroup (P=0.01) and splenomegaly in three of the four patients with downstream BCL3-R (P=0.07) (Table 1). Two of the latter patients transformed to a large B-cell lymphoma 5 and 11 years after diagnosis. Transformations were not observed in the upstream BCL3-R subgroup with a similar median follow-up time as the downstream tumors (6.3 years vs. 5.3 years, respectively; P=0.4).
All downstream BCL3-R patients required therapy, in contrast to only five of nine patients from the upstream BCL3-R subgroup, although no significant differences were found in the median time to first treatment. There were six deaths in the whole cohort, four of which were disease-related, two in the upstream BCL3-R subgroup, and two in the downstream BCL3-R subgroup, without differences in median survival time. Patients with upstream BCL3-R tumors had a similar overall survival as patients with U-CLL and trisomy 12 in our ICGC CLL cohort (Online Supplementary Figure S8).
Fluorescence in situ hybridization validation of BCL3 rearrangement breakpoints and expanded cohort
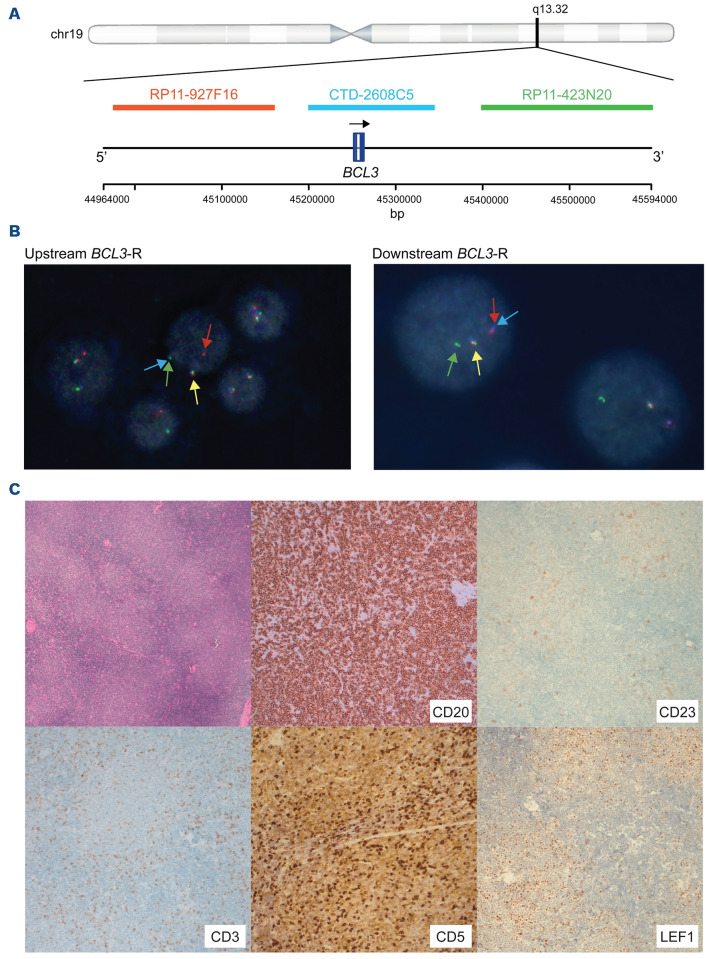
As the current commercially available FISH probes do not distinguish between the 5’ and 3’ rearrangements of BCL3-R identified in this study, we designed a new three-color FISH assay that could identify the new BCL3 5’ and 3’ breakpoints (Figure 7A). We tested the new assay in nine of our 13 tumors and confirmed the breakpoints concordantly with the WGS in all tumors, seven upstream and two downstream (Figure 7B; Online Supplementary Figure S9A; Online Supplementary Table S1).
We used the new FISH assay in 17 additional B-cell neoplasms with t(14;19) or BCL3-R (Online Supplementary Table S20, S21; Online Supplementary Figure S9B). We identified an upstream breakpoint in 13 tumors and downstream in four. In line with our previous observations, 11 tumors with upstream breakpoints were diagnosed as aCLL (n=8) or CLL (n=3) and two as leukemic non-nodal MCL. The aCLL had bright B-cell markers and LEF1 was negative in the six tumors studied. Trisomy 12 was present in eight of eleven and six of seven had U-IGHV. Lymph nodes examined in four cases were consistent with CLL, including prominent proliferation centers in two patients (Figure 7C; Online Supplementary Figure S10A). The two MCL were leukemic non-nodal, with CCND1 rearrangement and overexpression, and SOX11 negative (Online Supplementary Figure S10B). Three of the four patients with downstream BCL3-R were SMZL, one of them with atypical features previously published,6 splenomegaly and leukemic disease. Two cases carried del(7)(q32) and one case studied mutations frequent in SMZL (TNFAIP3, NOTCH1, KMT2D) (Online Supplementary Table S21).39
Figure 6.
Images of tumors with representative upstream and downstream BCL3 rearrangement. (A) Cells in peripheral blood smears from representative tumors. Both tumors show features such as nuclear irregularities and lobulation, non-clumped chromatin, central nucleoli, ample cytoplasm, or villi, which are atypical for conventional chronic lymphocytic leukemia (CLL). 1000x oil immersion, light microscope and camera, Leishman stain. (B, C) Histology (hematoxilin & eosin staining) and immunohistochemistry images were obtained from scanned slides (Ventana DP200 scanner, Roche Diagnostics). The upstream BCL3 rearrangement (BCL3-R) tumor had a diffuse growth pattern, resembling chronic lymphocyitc leukemia (CLL), but without proliferation centers (100x). At high power (600x), the cells were small, with scarce cytoplasm, distinct irregular nuclei, and central nucleoli. Larger scattered cells were observed. The immunophenotype is atypical for a CLL tumor (CD5-, CD23+ weak, and CD43+ weak), and the cells are LEF1 negative. CD5 was negative in the lymph nodes by immunohistochemistry but positive in the peripheral blood according to flow cytometry. The downstream BCL3-R tumor has a perifollicular growth pattern (100x), leaving residual germinal centers (400x), with a residual follicular dendritic network on CD21 and germinal center cells on BCL6, resembling marginal zone lymphoma. This tumor has a non-specific B-cell phenotype and plasma cell differentiation with κ light-chain restriction. MZL: marginal zone lymphoma.
Figure 7.
Custom fluorescence in situ hybridization assay to map the breakpoints of the BCL3 rearrangement and images of a representative tumor from the validation cohort. (A) Schematic representation of the custom design of BCL3 break-apart fluorescence in situ hybridization (FISH) probe. BCL3 gene and BCL3 FISH probe are annotated based on GRCh37/hg19 assembly. (B) Interphase nucleus of tumor 3783 (left panel) and 3676 (right panel). Tumor 3783 shows a positive signal constellation indicating a break upstream of BCL3 since the BAC-clone RP11-927F16 is split from CTD2608C5 and RP11-423N20. Tumor 3676 displays a positive signal constellation suggesting a break downstream of BCL3 with the BAC-clone RP11-423N20 split from CTD2608C5 and RP11-927F16. (C) Histology (hematoxilin & eosin staining) and immunohistochemistry images of tumor 1 from the validation cohort. Low power magnification (50x) of lymph node shows clear proliferation centers. CD20 shows diffuse positivity (100x). CD23 is only partially and faintly expressed in proliferation centers (100x). CD3 highlights few admixed T cells (100x). CD5 shows few admixed T cells (strong staining intensity) and low expression in tumor cells in the lymph node (100x). LEF1 shows expression in T cells and few cells in proliferation centers but mainly negative in tumor cells (100x). BCL3-R: BCL3 rearrangement.
Discussion
In this study, we characterized the breakpoints of t(14;19) at base-pair resolution in 13 patients with B-cell neoplasms in whom the BCL3 rearrangement had been detected by FISH. These tumors showed marked molecular, pathological, and clinical differences according to the location of the breakpoint in the 5’ or 3’ BCL3 region, suggesting that they correspond to different entities. Specifically, tumors upstream BCL3-R showed BCL3 over-expression, unmutated IGHV, low genomic complexity, trisomy 12, gene mutations and mutational signatures typically observed in CLL. In contrast, tumors with downstream BCL3-R did not upregulate BCL3 and carried M-IGHV, high genomic complexity, and mutations typically observed in MZL. Intriguingly, all the breakpoints in the IGHV were mediated by aberrant CSR, but eight of the nine tumors with the 5’ BCL3 breakpoints had U-IGHV and six of them had 100% identity with the germline, consistent with the fact that CSR occurs before germinal cell commitment and initiation of somatic mutations in the immunoglobulin genes.40,41
The pathological features of both subgroups were atypical for CLL or MZL, raising difficulties in their precise taxonomic classification. Upstream BCL3-R tumors have characteristics supporting their relationship with CLL including the presence of nodal proliferation centers in some tumors, trisomy 12 in virtually all tumors, and mutations in genes seen in CLL and uncommon in other lymphoid neoplasms. However, the cytological and phenotypic features of most tumors are not completely typical of CLL with bright expression of B-cell antigens and surface Ig, weak or negative CD23 and the expression profile of a subset of genes different from that seen in U-CLL with trisomy 12 such as negative/low expression of LEF1 and upregulation of EBF1 among others. In addition, the BCR signaling response was lower than that in U-CLL with trisomy 12. These findings were confirmed in the validation cohort and suggest that lymphoid neoplasms with upstream BCL3-R may correspond to a distinct atypical subset of CLL.
Downstream BCL3-R tumors had features of MZL with the presence of villous lymphocytes and genetic alterations frequently seen in these tumors (KLF2, NOTCH2, TBL1XR1). However, they also had some atypical characteristics, such as the exclusive leukemic presentation for 5 and 11 years in two patients and large cell transformation in two of them, an event only seen in 10-15% of SMZL cases.42 Three of four tumors with downstream BCL3-R in the validation series were also SMZL, two of them with del(7)(q32).6 The candidate gene of the downstream BCL3-R is unclear. We could only study one of these cases using RNA-seq, which overexpressed NECTIN2. This gene, also known as PVRL2 or CD112, is a member of immunoglobulin-like cell adhesion molecules and a ligand for natural killer cells. Although its potential oncogenic role is unknown, translocations of this gene with IG and T-cell recepetor have been detected in occasional DLBCL and peripheral T-cell lymphomas, respectively.43,44 Further studies are required to determine whether tumors with downstream BCL3-R are a homogeneous group within the marginal zone spectrum.
The biological and clinical differences between tumors with 5’ and 3’ BCL3-R observed in our study may explain the heterogeneity described in the literature. Most of the published tumors resemble our atypical CLL subgroup with an increased frequency of trisomy 12, U-IGHV, and atypical morphology and immunophenotype, although some tumors have also been described as having typical CLL features.7-9,4 5 The other subgroup is more heterogeneous with frequent M-IGHV and also MZL characteristics, although with occasional atypical features. Some of the tumors had large B-cell morphology similar to our transformed 3’ BCL3-R tumors.6,7,46 The possible prognostic impact of BCL3-R in lymphoid neoplasms in the literature is also controversial. Some studies have indicated that CLL or aCLL with BCL3-R have an adverse prognosis8,47-49 but this was not confirmed by others.50 Our patients with upstream BCL3-R had a similar time to the first treatment and overall survival as U-CLL with trisomy 12.
Our new BCL3-R FISH assay identified two breakpoints in 11 of 12 (92%) initial tumors studied and in all 17 independent lymphoid neoplasms, 13 with a 5’ breakpoint and four with a 3’ breakpoint. Interestingly, 11 tumors with upstream BCL3-R had pathological and genetic features similar to those of aCLL/CLL with U-IGHV, trisomy 12, and negative LEF1 expression. The tumors with the 3’ breakpoint were three SMZL, with some atypical features.6 These results confirm the value of this new FISH assay in identifying different BCL3 breakpoints and diseases. The finding of a 5’ BCL3-R in two nnMCL suggests that, similar to other translocations in lymphoid neoplasms, BCL3-R is not specific to a single entity and needs to be interpreted in the appropriate context.
In conclusion, identification of breakpoints upstream or downstream of BCL3 revealed two different subgroups of lymphoid neoplasms. Tumors with a 5’ breakpoint may correspond to a distinct subset of aCLL/CLL with distinct (epi)genomic, transcriptomic, and clinicopathological features, whereas 3’-rearranged tumors appear to be in the MZL spectrum. We developed a novel FISH assay that recognizes these two BCL3 breakpoints and is therefore useful in clinical practice to identify the two subgroups of patients.
Supplementary Material
Acknowledgments
The authors thank the Hematopathology Collection registered at the Biobank of Hospital Clinic - Institut d’Investigacions Biomèdiques August Pi i Sunyer (IDIBAPS), the Biobank HUB-ICO-IDIBELL (PT17/0015/0024), integrated in the Spanish Biobank Network and funded by Instituto de Salud Carlos III (PT17/0015/0024), and Xarxa de Bancs de Tumors de Catalunya sponsored by Pla Director d’Oncologia de Catalunya (XBTC), and the Molecular Cytogenetics Platform of IMIM, Hospital del Mar (Barcelona) for providing BAC clones. This work was partially developed at the Center Esther Koplowitz (CEK, Barcelona, Spain).
Funding Statement
Funding: This study was supported by the “la Caixa" Foundation (CLLEvolution - LCF/PR/HR17/52150017 [HR17-00221LCF] and CLLSYSTEMS - LCF/PR/HR22/52420015 [HR22-00172] Health Research 2017 and 2022 Programs, to EC), the European Research Council (to EC and JIM-S) under the European Union’s Horizon 2020 research and innovation program (810287, BCLLatlas, to EC), Ministry of Science and Innovation (MCIN) /AEI/10.13039/501100011033/ and European Regional Development Fund “Una manera de hacer Europa” (PID2021-123054OB-I00 to EC) and the Generalitat de Catalunya Suport Grups de Recerca AGAUR (2021-SGR01172 to EC and 2021-SGR-01293 to SB). HP-A is a recipient of a pre-doctoral fellowship from the Spanish Ministry of Science, Innovation and Universities (FPU19/03110). MD-F acknowledges the research support from the AECC Scientific Foundation. FN acknowledges research support from the American Association for Cancer Research (2021 AACR-Amgen Fellowship in Clinical/Translational Cancer Research, 21-40-11-NADE), European Hematology Association (EHA Junior Research Grant 2021, RG-202012-00245), and Lady Tata Memorial Trust (International Award for Research in Leukemia 2021-2022, LADY_TATA_21_3223). EC is an Academia Researcher of the “Institució Catalana de Recerca i Estudis Avançats” (ICREA) of the Generalitat de Catalunya.
References
- 1.Michaux L, Mecucci C, Stul M, et al. BCL3 rearrangement and t(14;19)(q32;q13) in lymphoproliferative disorders. Genes Chromosomes Cancer. 1996;15(1):38-47. [DOI] [PubMed] [Google Scholar]
- 2.Palmer S, Chen YH. Bcl-3, a multifaceted modulator of NF-kappaB-mediated gene transcription. Immunol Res. 2008;42(1–3):210–218. [DOI] [PubMed] [Google Scholar]
- 3.Liu H, Zeng L, Yang Y, Guo C, Wang H. Bcl-3: a double-edged sword in immune cells and inflammation. Front Immunol. 2022;13:847699. [DOI] [PMC free article] [PubMed] [Google Scholar]
- 4.Zhang X, Paun A, Claudio E, Wang H, Siebenlist U. The tumor promoter and NF-κB modulator Bcl-3 regulates splenic B cell development. J Immunol. 2013;191(12):5984-5992. [DOI] [PMC free article] [PubMed] [Google Scholar]
- 5.Ong ST, Hackbarth ML, Degenstein LC, Baunoch DA, Anastasi J, McKeithan TW. Lymphadenopathy, splenomegaly, and altered immunoglobulin production in BCL3 transgenic mice. Oncogene. 1998;16(18):2333-2343. [DOI] [PubMed] [Google Scholar]
- 6.Soma LA, Gollin SM, Remstein ED, et al. Splenic small B-cell lymphoma with IGH/BCL3 translocation. Hum Pathol. 2006;37(2):218-230. [DOI] [PubMed] [Google Scholar]
- 7.Martín-Subero JI, Ibbotson R, Klapper W, et al. A comprehensive genetic and histopathologic analysis identifies two subgroups of B-cell malignancies carrying a t(14;19)(q32;q13) or variant BCL3-translocation. Leukemia. 2007;21(7):1532-1544. [DOI] [PubMed] [Google Scholar]
- 8.Kelly RJ, Wright D, Patil K, et al. t(14;19)(q32;q13) incidence and significance in B-cell lymphoproliferative disorders. Br J Haematol. 2008;141(4):561-563. [DOI] [PubMed] [Google Scholar]
- 9.Huh YO, Schweighofer CD, Ketterling RP, et al. Chronic lymphocytic leukemia with t(14;19)(q32;q13) is characterized by atypical morphologic and immunophenotypic features and distinctive genetic features. Am J Clin Pathol. 2011;135(5):686-696. [DOI] [PubMed] [Google Scholar]
- 10.Li H, Durbin R. Fast and accurate short read alignment with Burrows-Wheeler transform. Bioinformatics. 2009;25(14):1754-1760. [DOI] [PMC free article] [PubMed] [Google Scholar]
- 11.Nadeu F, Mas-de-les-Valls R, Navarro A, et al. IgCaller for reconstructing immunoglobulin gene rearrangements and oncogenic translocations from whole-genome sequencing in lymphoid neoplasms. Nat Commun. 2020;11(1):3390. [DOI] [PMC free article] [PubMed] [Google Scholar]
- 12.Brochet X, Lefranc M-P, Giudicelli V. IMGT/V-QUEST: the highly customized and integrated system for IG and TR standardized V-J and V-D-J sequence analysis. Nucleic Acids Res. 2008;36(Web Server issue):W503-508. [DOI] [PMC free article] [PubMed] [Google Scholar]
- 13.Nadeu F, Royo R, Massoni-Badosa R, et al. Detection of early seeding of Richter transformation in chronic lymphocytic leukemia. Nat Med. 2022;28(8):1662-1671. [DOI] [PMC free article] [PubMed] [Google Scholar]
- 14.Love MI, Huber W, Anders S. Moderated estimation of fold change and dispersion for RNA-seq data with DESeq2. Genome Biol. 2014;15(12):550. [DOI] [PMC free article] [PubMed] [Google Scholar]
- 15.Puente XS, Beà S, Valdés-Mas R, et al. Non-coding recurrent mutations in chronic lymphocytic leukaemia. Nature. 2015;526(7574):519-524. [DOI] [PubMed] [Google Scholar]
- 16.Lu J, Cannizzaro E, Meier-Abt F, et al. Multi-omics reveals clinically relevant proliferative drive associated with mTOR-MYC-OXPHOS activity in chronic lymphocytic leukemia. Nat Cancer. 2021;2(8):853-864. [DOI] [PMC free article] [PubMed] [Google Scholar]
- 17.Ritchie ME, Phipson B, Wu D, et al. limma powers differential expression analyses for RNA-sequencing and microarray studies. Nucleic Acids Res. 2015;43(7):e47. [DOI] [PMC free article] [PubMed] [Google Scholar]
- 18.Aryee MJ, Jaffe AE, Corrada-Bravo H, et al. Minfi: a flexible and comprehensive Bioconductor package for the analysis of Infinium DNA methylation microarrays. Bioinformatics. 2014;30(10):1363-1369. [DOI] [PMC free article] [PubMed] [Google Scholar]
- 19.Bailey TL, Johnson J, Grant CE, Noble WS. The MEME suite. Nucleic Acids Res. 2015;43(W1):W39-W49. [DOI] [PMC free article] [PubMed] [Google Scholar]
- 20.Castro-Mondragon JA, Riudavets-Puig R, Rauluseviciute I, et al. JASPAR 2022: the 9th release of the open-access database of transcription factor binding profiles. Nucleic Acids Res. 2022;50(D1):D165-D173. [DOI] [PMC free article] [PubMed] [Google Scholar]
- 21.Ventura RA, Martin-Subero JI, Jones M, et al. FISH analysis for the detection of lymphoma-associated chromosomal abnormalities in routine paraffin-embedded tissue. J Mol Diagn. 2006;8(2):141-151. [DOI] [PMC free article] [PubMed] [Google Scholar]
- 22.Navarro A, Clot G, Martínez-Trillos A, et al. Improved classification of leukemic B-cell lymphoproliferative disorders using a transcriptional and genetic classifier. Haematologica. 2017;102(9):e360-e363. [DOI] [PMC free article] [PubMed] [Google Scholar]
- 23.Seifert M, Sellmann L, Bloehdorn J, et al. Cellular origin and pathophysiology of chronic lymphocytic leukemia. J Exp Med. 2012;209(12):2183-2198. [DOI] [PMC free article] [PubMed] [Google Scholar]
- 24.Gutierrez A, Tschumper RC, Wu X, et al. LEF-1 is a prosurvival factor in chronic lymphocytic leukemia and is expressed in the preleukemic state of monoclonal B-cell lymphocytosis. Blood. 2010;116(16):2975-2983. [DOI] [PMC free article] [PubMed] [Google Scholar]
- 25.Kulis M, Heath S, Bibikova M, et al. Epigenomic analysis detects widespread gene-body DNA hypomethylation in chronic lymphocytic leukemia. Nat Genet. 2012;44(11):1236-1242. [DOI] [PubMed] [Google Scholar]
- 26.Duran-Ferrer M, Clot G, Nadeu F, et al. The proliferative history shapes the DNA methylome of B-cell tumors and predicts clinical outcome. Nat Cancer 2020;1(11):1066–1081. [DOI] [PMC free article] [PubMed] [Google Scholar]
- 27.Griffen TL, Dammer EB, Dill CD, et al. Multivariate transcriptome analysis identifies networks and key drivers of chronic lymphocytic leukemia relapse risk and patient survival. BMC Med Genomics. 2021;14(1):171. [DOI] [PMC free article] [PubMed] [Google Scholar]
- 28.Pinnell N, Yan R, Cho HJ, et al. The PIAS-like coactivator Zmiz1 is a direct and selective cofactor of Notch1 in T cell development and leukemia. Immunity. 2015;43(5):870-883. [DOI] [PMC free article] [PubMed] [Google Scholar]
- 29.Cook ME, Jarjour NN, Lin C-C, Edelson BT. Transcription factor Bhlhe40 in immunity and autoimmunity. Trends Immunol. 2020;41(11):1023-1036. [DOI] [PMC free article] [PubMed] [Google Scholar]
- 30.Rauschmeier R, Reinhardt A, Gustafsson C, et al. Bhlhe40 function in activated B and TFH cells restrains the GC reaction and prevents lymphomagenesis. J Exp Med. 2022;219(2):e20211406. [DOI] [PMC free article] [PubMed] [Google Scholar]
- 31.Papakonstantinou N, Ntoufa S, Tsagiopoulou M, et al. Integrated epigenomic and transcriptomic analysis reveals TP63 as a novel player in clinically aggressive chronic lymphocytic leukemia. Int J Cancer. 2019;144(11):2695-2706. [DOI] [PubMed] [Google Scholar]
- 32.Roadcap DW, Clemen CS, Bear JE. The role of mammalian coronins in development and disease. Subcell Biochem. 2008;48:124-135. [DOI] [PubMed] [Google Scholar]
- 33.Seda V, Vojackova E, Ondrisova L, et al. FoxO1-GAB1 axis regulates homing capacity and tonic AKT activity in chronic lymphocytic leukemia. Blood. 2021;138(9):758-772. [DOI] [PMC free article] [PubMed] [Google Scholar]
- 34.Khanna P, Lee JS, Sereemaspun A, Lee H, Baeg GH. GRAMD1B regulates cell migration in breast cancer cells through JAK/STAT and Akt signaling. Sci Rep. 2018;8(1):9511. [DOI] [PMC free article] [PubMed] [Google Scholar]
- 35.Hutterer E, Asslaber D, Caldana C, et al. CD18 (ITGB2) expression in chronic lymphocytic leukaemia is regulated by DNA methylation-dependent and -independent mechanisms. Br J Haematol. 2015;169(2):286-289. [DOI] [PMC free article] [PubMed] [Google Scholar]
- 36.Goldin LR, McMaster ML, Rotunno M, et al. Whole exome sequencing in families with CLL detects a variant in Integrin β 2 associated with disease susceptibility. Blood. 2016;128(18):2261-2263. [DOI] [PMC free article] [PubMed] [Google Scholar]
- 37.Dobashi A, Togashi Y, Tanaka N, et al. TP53 and OSBPL10 alterations in diffuse large B-cell lymphoma: prognostic markers identified via exome analysis of cases with extreme prognosis. Oncotarget. 2018;9(28):19555-19568. [DOI] [PMC free article] [PubMed] [Google Scholar]
- 38.Schweighofer CD, Coombes KR, Majewski T, et al. Genomic variation by whole-genome SNP mapping arrays predicts time-to-event outcome in patients with chronic lymphocytic leukemia: a comparison of CLL and HapMap genotypes. J Mol Diagn. 2013;15(2):196-209. [DOI] [PMC free article] [PubMed] [Google Scholar]
- 39.Grau M, López C, Navarro A, et al. Unraveling the genetics of transformed splenic marginal zone lymphoma. Blood Adv. 2023;7(14):3695-3709. [DOI] [PMC free article] [PubMed] [Google Scholar]
- 40.Oppezzo P, Vuillier F, Vasconcelos Y, et al. Chronic lymphocytic leukemia B cells expressing AID display dissociation between class switch recombination and somatic hypermutation. Blood. 2003;101(10):4029-4032. [DOI] [PubMed] [Google Scholar]
- 41.Roco JA, Mesin L, Binder SC, et al. Class-switch recombination occurs infrequently in germinal centers. Immunity. 2019;51(2):337-350. [DOI] [PMC free article] [PubMed] [Google Scholar]
- 42.Bastidas‐Mora G, Beà S, Navarro A, et al. Clinico‐biological features and outcome of patients with splenic marginal zone lymphoma with histological transformation. Br J Haematol. 2022;196(1):146-155. [DOI] [PMC free article] [PubMed] [Google Scholar]
- 43.Otto C, Scholtysik R, Schmitz R, et al. Novel IGH and MYC translocation partners in diffuse large B-cell lymphomas. Genes Chromosomes Cancer. 2016;55(12):932-943. [DOI] [PubMed] [Google Scholar]
- 44.Almire C, Bertrand P, Ruminy P, et al. PVRL2 is translocated to the TRA@ locus in t(14;19)(q11;q13)-positive peripheral T-cell lymphomas. Genes Chromosomes Cancer. 2007;46(11):1011-1018. [DOI] [PubMed] [Google Scholar]
- 45.Chapiro E, Radford-Weiss I, Bastard C, et al. The most frequent t(14;19)(q32;q13)-positive B-cell malignancy corresponds to an aggressive subgroup of atypical chronic lymphocytic leukemia. Leukemia. 2008;22(11):2123-2127. [DOI] [PubMed] [Google Scholar]
- 46.Salido M, Baró C, Oscier D, et al. Cytogenetic aberrations and their prognostic value in a series of 330 splenic marginal zone B-cell lymphomas: a multicenter study of the Splenic B-Cell Lymphoma Group. Blood. 2010;116(9):1479-1488. [DOI] [PubMed] [Google Scholar]
- 47.Busschots AM, Mecucci C, Stul M, et al. Translocation (14;19)(q32;q13.1) in a young patient who developed a large cell lymphoma after an initial diagnosis of CLL. Leuk Lymphoma. 1991;5(4):281-286. [DOI] [PubMed] [Google Scholar]
- 48.Michaux L, Dierlamm J, Wlodarska I, Bours V, Van Den Berghe H, Hagemeijer A. t(14;19)/BCL3 rearrangements in lymphoproliferative disorders: a review of 23 cases. Cancer Genet Cytogenet. 1997;94(1):36-43. [DOI] [PubMed] [Google Scholar]
- 49.Fang H, Reichard KK, Rabe KG, et al. IGH translocations in chronic lymphocytic leukemia: Clinicopathologic features and clinical outcomes. Am J Hematol. 2019;94(3):338-345. [DOI] [PMC free article] [PubMed] [Google Scholar]
- 50.Rossi D, Deambrogi C, Monti S, et al. BCL3 translocation in CLL with typical phenotype: assessment of frequency, association with cytogenetic subgroups, and prognostic significance. Br J Haematol. 2010;150(6):702-704. [DOI] [PubMed] [Google Scholar]
Associated Data
This section collects any data citations, data availability statements, or supplementary materials included in this article.


