Abstract
The concentration of anthocyanins in fruits of “Assaria” pomegranate, a sweet Portuguese cultivar typically grown in Algarve (south Portugal), was monitored during storage under different conditions. The fruits were exposed to cold storage (5°C) after the following treatments: spraying with wax; spraying with 1.5% CaCl2; spraying with wax and 1.5% CaCl2; covering boxes with 25 μc thickness low-density polyethylene film. Untreated fruits were used as a control. The anthocyanin levels were quantified by either comparison with an external standard of cyanidin 3-rutinoside (based on the peak area) or individual calculation from the peak areas based on standard curves of each anthocyanin type. The storage time as well as the fruit treatment prior to storage influenced total anthocyanin content. The highest levels were observed at the end of the first month of storage, except for the fruits treated with CaCl2, where the maximal values were achieved at the end of the second month. The anthocyanin quantification method influenced the final result. When total anthocyanin was calculated as a sum of individual pigments quantified based on standard curves of each anthocyanin type, lower values were obtained.
INTRODUCTION
Pomegranate has been considered a fruit tree species of minor importance, but the increased consumer demand for exotic fruits as well as for high nutritional quality foods opens new perspectives for consumption of that traditional species. Pomegranate seeds, the edible portion of the fruit, are rich in sugars, vitamins, polysaccharides, polyphenols, and minerals [1]. They have low oil content and are rich in polyunsaturated (n-3) fatty acids. The pomegranate seed extract possesses high antioxidant activity [2]. The antioxidant capacity of commercial pomegranate juice is three times higher than those of red wine and green tea [3]. The antioxidant qualities of pomegranate juice make it appealing for the production of health supplements and nutraceuticals [2].
The antioxidant activity was suggested to be related, in part, to the three major anthocyanidins found in pomegranate seed extract [4]. Therefore evaluation of the anthocyanin content in food products is very important. At present, various methods for anthocyanin quantification are used [5]. In pomegranate juice, anthocyanin content is determined usually according to the method developed by Gil et al [6]. Application of various methods may influence the final result. Besides the quantification method, the anthocyanin content also depends on factors like species, varieties, maturity index, seasonal conditions, processing type, or storage conditions of the food products [3, 5, 7]. Application of various anthocyanin extraction methods also influences the evaluation of antioxidant activities of extracts [3].
In the present paper, two quantification methods of anthocyanins as well as the influence of storage conditions on anthocyanin content in “Assaria” pomegranate juice were evaluated.
MATERIALS AND METHODS
Fruits and treatments
Sweet pomegranates (Punica granatum cultivator “Assaria”) were harvested in an orchard in eastern Algarve (Portugal). Fruits were transported, on the same day, to the laboratory at the University of Algarve. After selection (diseased, bruised, and injured fruits were rejected), healthy fruits of uniform size and appearance were randomly distributed into alveolated boxes and stored in 4 modalities of fruit covering. The fruits were subjected to several treatments; treatment 1: control (no covering); treatment 2: wax coating by spraying fruits with Brillaqua wax emulsion (polyethylene wax (3.8%) (w/w), shellac (1.5%) (w/w), and wood resin (10%) (w/w), from Brillaqua, Valencia, Spain); treatment 3: covering boxes with a 25 μc low-density polyethylene film; treatment 4: 1.5% CaCl2 fruit spraying; treatment 5: 1.5% CaCl2 and Brillaqua wax emulsion (combination of treatments 2 and 4). The fruits were stored at 5°C.
At harvest and monthly, for 4 months, 10 fruits of each replication were removed and the concentration of anthocyanins was measured. For each sampling point, there were 4 replications.
Anthocyanins quantification
Pomegranates were manually peeled and the seeds liquefied by hand. The tegmina were discarded. The juice sample (1 mL) was centrifuged (2 minutes at 10 000 rpm) and filtered through a 0.45 μm filter.
The identification of anthocyanins was performed by HPLC with a detector UV-Vis Beckman 166 (USA), using a Li-Chrochart 100 RP-18 column (25 cm × 0.4 cm inner diameter; 5 μm particle size, Merck (USA)). The mobile phase was 5% formic acid (A) and methanol (B) in a linear gradient starting with 15% B to reach 35% B in 15 minutes, then isocratic until 20 minutes, at a flow rate of 1 mL/min. Chromatograms were recorded at the absorbance of 510 nm. Injection volume was 20 μL using an injector with a 20 μL loop (Rheodyne, Calif, USA).
Anthocyanins were identified by comparison of their retention times with those of pure standards.
To quantify total concentration of anthocyanins, two methods were used. Method 1: the concentration of anthocyanins was calculated from their peak areas in the chromatograms and compared with an external standard of cyanidin-3-rutinoside as previously reported [6]. Method 2: anthocyanins were identified and quantified individually based on standard curves of each anthocyanin type: delphinidin 3, 5-diglucoside (Dp3, 5), delphinidin 3-glucoside (Dp3), cyanidin 3, 5-diglucoside (Cy3, 5), cyanidin 3-glucoside (Cy3), pelargonidin 3, 5-diglucoside (Pg3, 5), and pelargonidin 3-glucoside (Pg3), at four concentrations (0.01, 0.02, 0.04, and 0.08 mg/L). Total amount of anthocyanin in the samples was calculated as the sum of the mean of individual pigments.
RESULTS
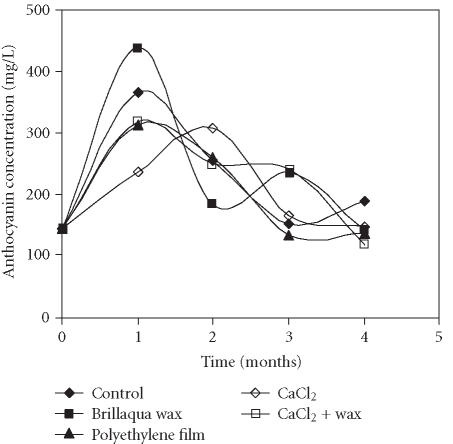
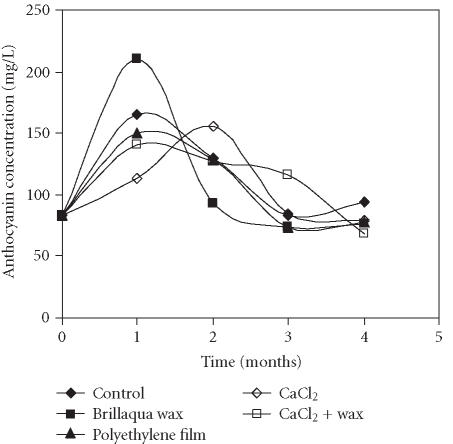
The total anthocyanin concentration in the “Assaria” pomegranate juice determined by two different quantitative methods, method 1 and method 2, monitored over 4 months of storage, is presented in Figures 1 and 2. Application of two quantification methods resulted in obtaining different results: the concentration of anthocyanins was always 2-fold higher when cyanidin 3-rutinoside, as external standard, was used. Both methods showed That during the first month of storage, an increase of the total anthocyanin level occurred in all treatments, reaching a maximal value at the end of the first month of storage with the exception of fruits treated with CaCl2. The highest concentration was found in the fruits treated with wax, independent of the quantification method used (439.0 mg/L and 210.9 mg/L for methods 1 and 2, respectively). In the fruits treated with CaCl2, the maximal concentration of anthocyanins was obtained only after two months of storage (307.2 and 155.4 mg/L, for methods 1 and 2, respectively). At the end of the first month of storage, these fruits showed the lowest levels of anthocyanins (236.5 and 113.3 mg/L, respectively).
Figure 1.
Evolution of total anthocyanin concentration in juice of the “Assaria” pomegranate fruits, during storage at 5°C, quantified by comparison with an external standard of cyanidin 3-rutinoside (Apin Chemicals, UK). Total amount of anthocyanins in the samples was calculated as the sum of the mean of individual pigments.
Figure 2.
Evolution of total anthocyanin concentration in juice of the “Assaria” pomegranate fruits, during storage at 5°C, calculated from standard curves of Dp3, 5; Dp3; Cy3, 5; Cy3, Pg3, 5, and Pg3. Total amount of anthocyanins in the samples was calculated as the sum of the mean of individual pigments.
During the second, third, and fourth months of storage in all treatments, with the exception of CaCl2 treatment, significant decrease in anthocyanin levels was observed. The same tendency was observed with the CaCl2 treatment in the third and fourth months of storage. Nevertheless, the anthocyanin amount still remained above the initial values in all treatments. The greatest decrease was observed in the wax treatment.
Six anthocyanins were detected in the “Assaria” pomegranate juice: delphinidin 3-glucoside (Dp3), cyanidin 3-glucoside (Cy3), pelargonidin 3-glucoside (Pg3), delphinidin 3, 5-diglucoside (Dp3, 5), cyanidin 3, 5-diglucoside (Cy3, 5), and pelargonidin 3, 5-diglucoside (Pg3, 5). Their relative amounts were different among treatments.
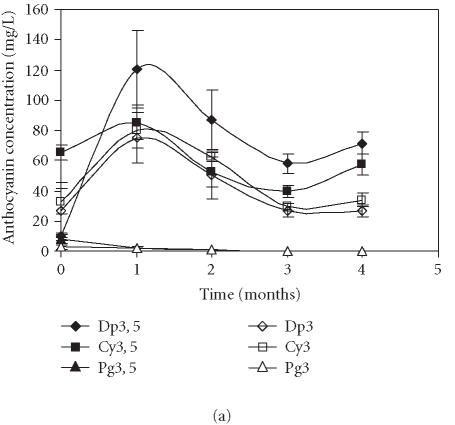
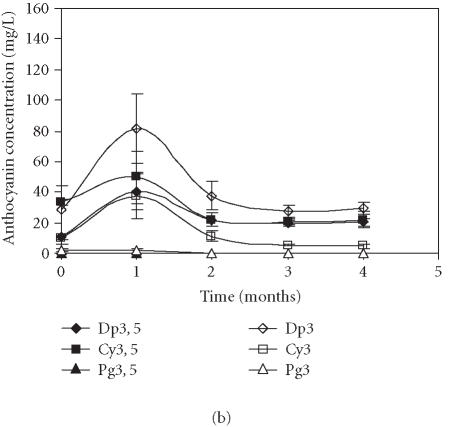
Figures 3a and 3b represent the time course of concentration of each anthocyanin in the control fruits, using the quantitative methods 1 and 2, respectively. Application of both methods showed that the levels of Pg3 and Pg3, 5 were very low in comparison to the remaining anthocyanins. The quantification method influenced identification of the major anthocyanins. Thus, when the levels of anthocyanins were calculated based on cyanidin-3-rutinoside as an external standard, Dp3, 5 was the major anthocyanin present in samples (Figure 3a). When the quantification was obtained from standard curves of each pigment, Dp3 was the dominating anthocyanin (Figure 3b). In both methods, the same evolution profile of anthocyanins was observed: higher accumulation of anthocyanins during the first storage month followed by their decrease in the following months.
Figure 3.
Evolution of delphinidin 3, 5-diglucoside (Dp3, 5), cyanidin 3, 5-diglucoside (Cy3, 5), pelargonidin 3, 5-diglucoside (Pg3, 5), delphinidin 3-glucoside (Dp3), cyanidin 3-glucoside (Cy3), and pelargonidin 3-glucoside (Pg3) concentration in “Assaria” pomegranate juice from control fruits, during storage at 5°C. (a) Individual anthocyanins were quantified by comparison with an external standard of cyanidin 3-rutinoside (Apin Chemicals). (b) The concentrations of anthocyanins were calculated from standard curves of Dp3, 5; Dp3; Cy3, 5; Cy3, Pg3, 5, and Pg3. Bars represent standard deviations of four replicates.
In order to make the results easier to interpret, hereafter the quantification of anthocyanins is made comparing the peak areas of each anthocyanin with those obtained from calibration curves of each standard stock solution (method 2). This methodology is the most adequate because the standards' composition was close to that of the samples, as required in analytical chemistry.
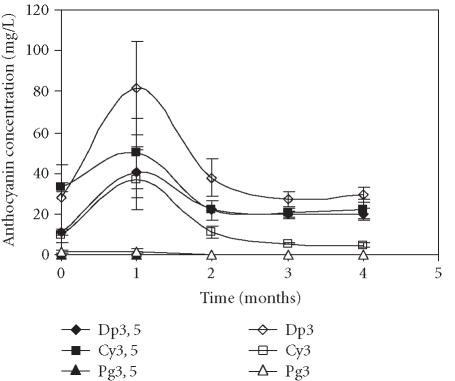
As mentioned earlier, the fruits treated with wax showed the greatest accumulation of anthocyanins after one month of storage (Figure 4). Among the anthocyanins monitored, Dp3 was the major pigment. The maximal value reached after the first month of storage was 81.7 mg/L, and was superior to the control with 66.5 mg/L (Figure 3b).
Figure 4.
Evolution of delphinidin 3, 5-diglucoside (Dp3, 5), cyanidin 3, 5-diglucoside (Cy3, 5), pelargonidin 3, 5-diglucoside (Pg3, 5), delphinidin 3-glucoside (Dp3), cyanidin 3-glucoside (Cy3), and pelargonidin 3-glucoside (Pg3) concentration in “Assaria” pomegranate juice from fruits treated with Brillaqua wax, during storage at 5°C. The concentrations of anthocyanins were calculated from standard curves of Dp3, 5; Dp3; Cy3, 5; Cy3, Pg3, 5, and Pg3. Bars represent standard deviations of four replicates.
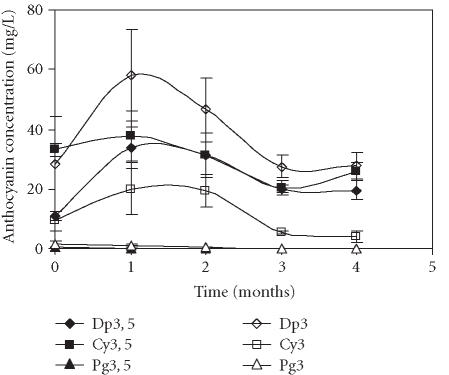
The polyethylene film treatment also induced a great accumulation of Dp3 (58.0 mg/L) during the first month of storage (Figure 5). Contrary to the significant changes in the levels of Dp3, 5, Cy3, 5, and Cy3, the variations of the Cy3, 5 level over time were lower.
Figure 5.
Evolution of delphinidin 3, 5-diglucoside (Dp3, 5), cyanidin 3, 5-diglucoside (Cy3, 5), pelargonidin 3, 5-diglucoside (Pg3, 5), delphinidin 3-glucoside (Dp3), cyanidin 3-glucoside (Cy3), and pelargonidin 3-glucoside (Pg3) concentration in “Assaria” pomegranate juice from fruits covered with polyethylene film, during storage at 5°C. The concentrations of anthocyanins were calculated from standard curves of Dp3, 5; Dp3; Cy3, 5; Cy3, Pg3, 5, and Pg3. Bars represent standard deviations of four replicates.
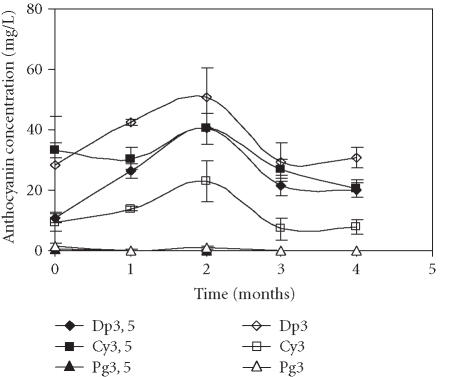
The fruits treated with CaCl2 showed the lowest amounts of anthocyanins (Figure 6). As mentioned earlier, the highest concentration was detected at the end of the second month of storage. Similarly to the previous treatments, the major anthocyanin was Dp3. The highest concentration of this pigment, observed at the end of the second month of storage, was 50.5 mg/L.
Figure 6.
Evolution of delphinidin 3, 5-diglucoside (Dp3, 5), cyanidin 3, 5-diglucoside (Cy3, 5), pelargonidin 3, 5-diglucoside (Pg3, 5), delphinidin 3-glucoside (Dp3), cyanidin 3-glucoside (Cy3), and pelargonidin 3-glucoside (Pg3) concentration in “Assaria” pomegranate juice from fruits treated with 1.5% CaCl2, during storage at 5°C. The concentrations of anthocyanins were calculated from standard curves of Dp3, 5; Dp3; Cy3, 5; Cy3, Pg3, 5, and Pg3. Bars represent standard deviations of four replicates.
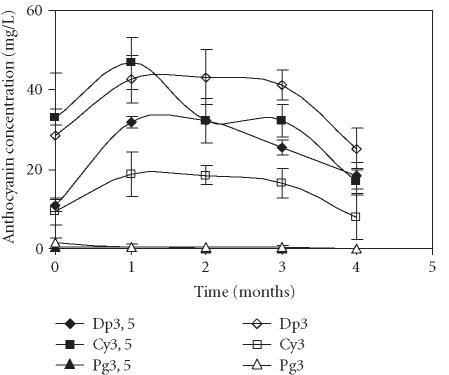
Contrary to the treatments described above in which Dp3 was the major pigment after one month of storage, two main pigments were detected in the fruits treated with CaCl2 plus wax: Cy3, 5 (46.7 mg/L) and Dp3 (42.8 mg/L) (Figure 7).
Figure 7.
Evolution of delphinidin 3, 5-diglucoside (Dp3, 5), cyanidin 3, 5-diglucoside (Cy3, 5), pelargonidin 3, 5-diglucoside (Pg3, 5), delphinidin 3-glucoside (Dp3), cyanidin 3-glucoside (Cy3), and pelargonidin 3-glucoside (Pg3) concentration in “Assaria” pomegranate juice from fruits treated with 1.5% CaCl2 plus Brillaqua wax, during storage at 5°C. The concentrations of anthocyanins were calculated from standard curves of Dp3, 5; Dp3; Cy3, 5; Cy3, Pg3, 5, and Pg3. Bars represent standard deviations of four replicates.
DISCUSSION
The anthocyanin profiles of some food products derived from red fruits are used to verify the authenticity and control the quality of these products [5]. Nevertheless, a great number of the laboratories that perform such analyses use their own methods. This fact renders the comparison and validation of these methods difficult. The most advisable method for quantitative chromatographic analysis involves the preparation of a series of standard solutions that approximate the composition of the unknown sample. This does not happen when cyanidin-3-rutinoside is used in the method that is frequently used by some authors for anthocyanin quantification in pomegranate juices [6]. In the present paper, it was considered that applications of the standard solutions of each anthocyanin were more appropriate as the samples than the standard solution of cyanidin-3-rutinoside. Therefore, the results were obtained comparing the peak areas with those obtained from the standard solutions of each anthocyanin, maintaining the same assay conditions.
The anthocyanins present in pomegranate seeds of cultivator “Assaria” were as those previously isolated and identified for cultivator “Mollar” [6]. However, their amounts were different. A great variation of the amounts of Dp3, 5, Dp3, and Cy3 was registered over time, regardless of whether the levels of Cy3, 5, were more stable. The variation was more evident between the harvesting time and the first month of storage, when a great increase of anthocyanin level was monitored, followed by decrease until the end of storage. Previously, it was reported that Dp3, 5 and Dp3 were the best substrates to undergo enzymatic oxidation for pomegranate cultivar “Mollar” [8]. This could partly explain the important decrease that was registered in the amounts of these anthocyanins in the “Assaria” pomegranate juice.
The increase in the total amount of anthocyanins during the first month of storage may be due to the continued biosynthesis of phenolic compounds after harvest, related to the ripening processes. The increase of anthocyanin concentration after harvest was reported previously in pomegranates [6, 7] and that was correlated with the activity of the enzymes of the anthocyanin biosynthetic pathway: phenylalanine ammonia lyase (PAL) and UDP-glucose: flavonoid-3-O-glucosyltransferase (GT). Nevertheless, in juice of pomegranates stored in different atmospheres, Holcroft et al [7] observed that the increase in the total amount of anthocyanins was correlated with PAL activity but not with GT activity.
The pattern of anthocyanin content variation was distinct among the treatments during storage period. The greatest value was observed in wax treatment at the end of the first month but the fruits of that treatment presented the lowest content a month later. In contrast, the fruits treated with CaCl2 that presented the greatest value in the second month had the lowest content in the first month. Therefore, using the appropriate storage treatment, it is possible to have fruits with high anthocyanin content until two months after harvest.
The effect of the different treatments could be related to changes in the fruit internal atmosphere. Holcroft et al [7] showed that in juice of pomegranates stored in air enriched with CO2, the anthocyanin concentration increased in time in both air-stored fruits and fruits stored in 10 kPa CO2, but remained stable for four weeks and subsequently decreased in fruits stored in 20 kPa CO2. In our work, the treatments used affected distinct biochemical mechanisms that could modify anthocyanin stability in different ways, making the treatment effect difficult to interpret.
Besides the storage treatments being very important for maintaining the external appearance, delaying senescence, and controlling decay of pomegranates, they can also contribute to increasing anthocyanin amounts during the first month of storage.
References
- 1.Melgarejo P, Artés F. Total lipid content and fatty acid composition of oilseed from lesser known sweet pomegranate clones. J Sci Food Agric. 2000;80(10):1452–1454. [Google Scholar]
- 2.Singh R.P, Murthy K.N.C, Jayaprakasha G.K. Studies on the antioxidant activity of pomegranate (Punica granatum) peel and seed extracts using in vitro models. J Agric Food Chem. 2002;50(1):81–86. doi: 10.1021/jf010865b. [DOI] [PubMed] [Google Scholar]
- 3.Gil M.I, Tomas-Barberan F.A, Hess-Pierce B, Holcroft D.M, Kader A.A. Antioxidant activity of pomegranate juice and its relationship with phenolic composition and processing. J Agric Food Chem. 2000;48(10):4581–4589. doi: 10.1021/jf000404a. [DOI] [PubMed] [Google Scholar]
- 4.Noda Y, Kaneyuki T, Mori A, Packer L. Antioxidant activities of pomegranate fruit extract and its anthocyanidins: delphinidin, cyanidin, and pelargonidin. J Agric Food Chem. 2002;50(1):166–171. doi: 10.1021/jf0108765. [DOI] [PubMed] [Google Scholar]
- 5.da Costa C.T, Horton D, Margolis S.A. Analysis of anthocyanins in foods by liquid chromatography, liquid chromatography-mass spectrometry and capillary electrophoresis. J Chromatogr A. 2000;881(1-2):403–410. doi: 10.1016/s0021-9673(00)00328-9. [DOI] [PubMed] [Google Scholar]
- 6.Gil M.I, García-Viguera C, Artés F, Tomás-Barberán F.A. Changes in pomegranate juice pigmentation during ripening. J Sci Food Agric. 1995;68:77–81. [Google Scholar]
- 7.Holcroft D.M, Gil M.I, Kader A.A. Effect of carbon dioxide on anthocyanins, phenylalanine ammonia lyase and glucosyltransferase in the arils of stored pomegranates. J Am Soc Hortic Sci. 1998;123(1):136–140. [Google Scholar]
- 8.Artés F, Villaescusa R, Tudela J. Modified atmosphere packaging of pomegranate. J Food Sci. 2000;65(7):1112–1116. [Google Scholar]


