

Abstract
In the recent years many studies on anthocyanins have revealed their strong antioxidant activity and their possible use as chemotherapeutics. The finding that sour cherries (Prunus cerasus L) (also called tart cherries) contain high levels of anthocyanins that possess strong antioxidant and anti-inflammatory properties has attracted much attention to this species. Here we report the preliminary results of the induction of anthocyanin biosynthesis in sour cherry callus cell cultures. The evaluation and characterization of the in vitro produced pigments are compared to those of the anthocyanins found in vivo in fruits of several sour cherry cultivars. Interestingly, the anthocyanin profiles found in whole fruit extracts were similar in all tested genotypes but were different with respect to the callus extract. The evaluation of antioxidant activity, performed by ORAC and TEAC assays, revealed a relatively high antioxidant capacity for the fruit extracts (from 1145 to 2592 μmol TE/100 g FW) and a lower one for the callus extract (688 μmol TE/100 g FW).
INTRODUCTION
Anthocyanins, one of the major groups of pigments belonging to the secondary metabolite group of flavonoids, are often responsible for the orange, red, and blue colors in fruits, vegetables, flowers, and other storage tissues in plants. Thus, they have become important as food additives. However, interest in anthocyanins has recently intensified because of their possible health benefits. One of the best known properties of flavonoids in general is their strong antioxidant activity in metabolic reactions due to their ability to scavenge oxygen radicals and other reactive species. This feature makes flavonoids a potential tool for use in studies on oxidative stress, the ageing process, and cancer [1], especially since it has been reported that anthocyanins inhibit the growth of cancer cells [2] and act as chemotherapeutics for numerous diseases [3]. The finding that sour cherries (Prunus cerasus L) contain significant levels of anthocyanins [4] has attracted much attention to this species. Anthocyanins from sour cherry have been shown to possess strong antioxidant and anti-inflammatory activities [5] and to inhibit tumor development in ApcMin mice and the growth of human colon cancer cell lines [6]. Moreover, cyanidin, the anthocyanin aglycon, has shown more efficient anti-inflammatory activity than aspirin [5]. Although cherry fruit tissue has recently been used in meat products for improved nutritional qualities (less rancidity and the inhibition of the formation of heterocyclic aromatic amines), the use of purified anthocyanins extracted from cherry cells cultured in vitro is an alternative to consider. The production of anthocyanins extracted from cherry fruit is restricted to their seasonal production; moreover, the fruit has too high a value as a fresh fruit to be used for anthocyanin extraction. Plant cells/tissue cultures offer an opportunity for continuous production of plant metabolites. Moreover, plant cell culture is an attractive production source, since it is scalable according to specific needs [7] and also gives greater potential for the manipulation of anthocyanin quality [8, 9].
Here we report the preliminary results of the induction of anthocyanin biosynthesis in sour cherry (P cerasus L) callus cell cultures. The evaluation and characterization of anthocyanin pigments produced in vitro as well as of those extracted from the whole fruits of several cultivars are reported. The anthocyanins pigment profiles in fruits and in callus cultures producing anthocyanins were characterized by reverse-phase high-performance liquid chromatography (RP-HPLC). This technique coupled with a photodiode array detector has become the method of choice for monitoring anthocyanin profiles [4, 10, 11]. Oxygen radical absorbance capacity (ORAC) assay and Trolox equivalent antioxidant capacity (TEAC) assay on fruit and callus extracts have also been performed in order to evaluate the antioxidant activity of the extracts.
MATERIALS AND METHODS
Chemicals
All reagents (from Carlo Erba, Milan, Italy, if not otherwise indicated) were of analytical reagent grade or HPLC grade, as required. Anthocyanin standards were supplied by Extrasynthese (Lyon, France).
Plant material
Fruits of sour cherry (P cerasus L) cv Amarena Mattarello (AM), Visciola Ninno (VN), and Visciola Sannicandro (VS) (genotypes from the local germplasm) were picked up in June 2003 on a local experimental field (Bari, Italy). Cherries were flushed with nitrogen in freezer bags prior to storage at −20°C.
Callus induction and anthocyanin production
In vitro shoot culture of P cerasus L, cv AM, was previously set up [12].
Callus cultures were induced from leaf segments on a callus induction medium (CIM), containing Murashige and Skoog (MS) mineral salts and vitamins, 30 g L−1 sucrose, 1 mg L−1 α-naphthaleneacetic acid (NAA), and 0.1 mg L−1 N6-benzyladenine (BA). Leaf explants were taken from plants grown in vitro on a plant multiplication medium (PMM) [12]. The explants were incubated in a growth chamber at 25 ± 2°C in the dark. Callus cultures were maintained on the same CIM in the dark and transferred to a fresh CIM every three weeks.
At the end of the growth cycle, callus cultures were transferred to several types of media, later referred to as anthocyanin induction media (AIM) [13], and then incubated under light (Philips TLD/83,125 μmol m−2s−1), with a 16 hour photoperiod. Anthocyanin producing calli were harvested after two weeks of incubation under light, flushed with nitrogen, and stored at −20°C for further analysis.
Extraction of the anthocyanins
Pitted and frozen cherries (10 g) of each cv were ground twice for 30 second in a Waring blender (Waring, Conn, USA) in the presence of liquid N2, thus providing a uniform powdered sample. Frozen calli were pulverized with a pestle and mortar and then treated as the homogenized fruits. A sample of the powder (1 g) was centrifuged (Allegra 21 R centrifuge, Beckman Coulter, Fullerton, Calif) at 10 000 g for 10 minutes at 4°C. The supernatant juices were stored at −20°C as stock solutions for the analysis of antioxidant activity. Another sample of the same powder (3 g) was extracted with a double volume of acidified methanol (0.01% HCl) (v/v), at 4°C, with stirring overnight. After extraction, the colored liquid was separated from the solid matrix and concentrated at 35°C in vacuo and then dissolved in the mobile phase used for HPLC analysis.
HPLC/DAD analysis
The profile of anthocyanins was determined using an HPLC system consisting of a Model SCL-10AVP system controller, equipped with a solvent delivery unit Model LC-10ADVP; an online vacuum membrane degasser, Model DGU-14A; a column oven, Model CTO-10ASVP; and a photodiode array detector UV-Vis, Model SPD-10AVP, in conjunction with an LC workstation Model Class VP 5.3 (all from Shimadzu, Milan, Italy). Analytical separation of anthocyanin compounds was carried out on a Polaris C18A column (150 × 2.0 mm, id 5 μm, Varian, Palo Alto, Calif) equipped with a C18 guard column. The samples were introduced onto the column via a Rheodyne Model 9125 nonmetal injection valve with a peak sample of 5 μL volume. The temperature of the column oven was set at 30 ± 0.1°C. Solvent A was water : formic acid (9 : 1 v/v); solvent B was acetonitrile : water : formic acid (5 : 4 : 1 v/v). The percentage of solvent B was increased linearly from 8% to 18% in 12 minutes, followed by elution under isocratic conditions for the next 5 minutes, and by a second linear gradient segment from 18% to 35% B in 13 minutes. The column was reconditioned with the initial eluent for about 20 minutes. The solvent flow rate was 0.2 mL/min. Acquisition range was set between 240 and 600 nm with a sampling period of 0.32 second and a time constant of 0.64 second. The chromatogram was monitored at 518 nm. The purity of the peaks was also monitored using the diode array purity test system included in the software.
Identification of anthocyanins
The anthocyanin identification in sour cherry extracts was made from matching UV-Vis spectra and retention times with authentic standards. The quantities of different anthocyanins were assessed from the peak areas and calculated as equivalents of cyanidin 3-glucoside. The standard curve of this compound showed excellent linearity over the concentration range of 4–50 mg/mL with correlation coefficient better than 0.9999 and nearly passed through the origin. Relative standard deviations were less than 2%. Sour cherry samples were analyzed in triplicate, and the mean peak areas of all anthocyanins were used to determine the quantities present in the different cultivars and in the callus cell cultures.
ORAC assay
ORAC assays for fruit and calli juices were carried out following the modified procedures of the method previously described by Ou et al [14]. This assay measures the ability of antioxidant components in test materials to inhibit the decline in disodium fluorescein (FL) (Sigma-Aldrich, St Louis, Mo) fluorescence that is induced by the peroxyl radical generator, 2′,2′-Azobis (2-amidinopropane) dihydrochloride (AAPH) (Wako Chemicals, Richmond, Va). The reaction mixture contained in the final assay mixture (0.7 mL total volume) FL (6.3 × 10⁻⁸ M) and AAPH (1.28 × 10⁻² M). All reagents were prepared with 75 mM phosphate buffer, pH 7.4. The final volume was used in a 10 mm wide fluorometer cuvette. FL, phosphate buffer, and samples were preincubated at 37°C for 15 minutes. The reaction was started by the addition of AAPH. Fluorescence was measured and recorded every 1 minutes at the emission length of 515 nm and excitation length of 493 nm using a Shimadzu RF-5301PC (Columbia, Md) until the fluorescence of the last reading declined to a value of less than or equal to 5% of the first reading. This usually took about 30 minutes. Phosphate buffer was used as the blank and 1, 5, 12.5 μM Trolox (Sigma-Aldrich, Steinheim, Germany) were used as the control standards. Samples and Trolox calibration solutions were analyzed in duplicate. The final ORAC values were calculated by using a regression equation between the Trolox concentration and the net area under the FL decay curve (Figure 1) and were expressed as Trolox equivalents (TE) as micromole (μmol) per 100 g of fresh weight (FW).
Figure 1.

Trolox concentration effect on FL fluorescence decay curve. Data is pooled from two runs.
ABTS radical cation decolorization assay
This TEAC assay for fruit and callus juices was carried out following the procedures previously described by Re et al [15]. 2,2′-azino-bis (3-ethylbenzothiazoline-6-sulfonic acid; (ABTS) (Sigma-Aldrich, St Louis, Mo) was dissolved in water to a 7 mM concentration. ABTS radical cation (ABTS•+) was produced by reacting ABTS stock solution with 2.45 mM potassium persulfate (final concentration) and allowing the mixture to stand in the dark at room temperature for 12–16 hours before use. For the study of fruit and callus juices, the ABTS•+ solution was diluted with PBS, pH 7.4, to an absorbance of 0.70 (± 0.02) at 734 nm. Fruit and callus juices were diluted so that, after the introduction of a 10 μL aliquot of each extract into the assay, they produced between 20%–80% inhibition of the blank absorbance. After addition of 1.0 mL of diluted ABTS•+ solution to 10 μL of extracts or Trolox standards (final concentration 0–15 μM) in PBS, the absorbance reading was taken up to 6 minutes. Appropriate PBS blanks were run in each assay. All determinations were carried out twice. The final TEAC decolorization assay values were calculated by using a regression equation between the Trolox concentration and the percentage of inhibition of absorbance at 734 nm after 6 minutes and were expressed as TE as micromole (μmol) per 100 g of FW.
RESULTS AND DISCUSSION
Sour cherry (P cerasus L) is a temperate fruit with marginal importance, even though since the 1980s this crop has become more appreciated than the sweet cherry crop for reasons such as minor agrobiological needs, the greater ease of mechanical harvesting, and its numerous uses in the food industry. Sour cherry may acquire new interest, mainly due to the fact that it can be considered as a “functional food” because of its high content of antioxidant compounds. Recent studies have revealed that anthocyanins from sour cherry exhibit in vitro antioxidant activities comparable to those from commercial products, such as butylated hydroxyanisole (BHA) and butylated hydroxytoluene (BHT), and superior to vitamin E at 2 mM concentration [5]. In an anti-inflammatory assay, cyanidin (the aglycon of the main tart cherry anthocyanins) showed better anti-inflammatory activity than aspirin [5]. Thus, the production of a “natural aspirin” could be a pharmaceutical alternative for people with digestive tract ulcer or allergies to aspirin and to nonsteroidal anti-inflammatory compounds.
The interest in sour cherry anthocyanins has pushed us into a new research project concerned with the in vitro production of anthocyanin from the species and the characterization of the secondary metabolites, compared to the in vivo products from the fruits of different cultivars.
Leaf explants cultured in the dark produced actively growing callus cultures in a short time. The production of anthocyanins was observed at different levels in most of the AIM tested. Even in the CIM (control medium) anthocyanin production was noticeable, confirming that an important factor for anthocyanin induction is light. Takeda [16] reported that, in carrot cell cultures, light irradiation induced the expression of enzymes of the phenylpropanoid metabolic pathway, such as phenylalanine ammonia-lyase and chalcone synthase, at the transcription level.
During several subcultures (nearly ten), a stepwise selection of callus cultures allowed the isolation of a cell line with high and homogeneous anthocyanin production (Figure 2).
Figure 2.
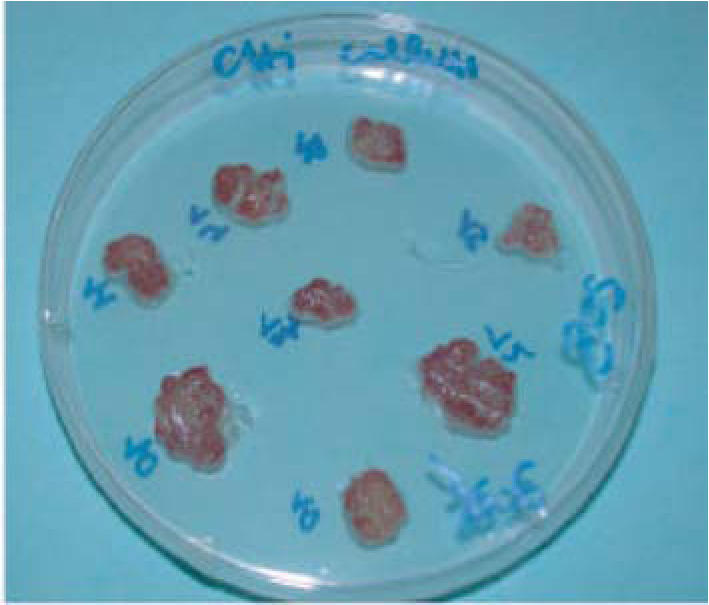
Callus culture of sour cherry (P cerasus L) cv Amarena Mattarello on callus induction medium, after ten days of light exposure.
The pigmented callus cultures as well as the fruit extracts from different local cultivars were used for the evaluation and quantification of the anthocyanins.
Figure 3 shows the anthocyanin profiles found in AM cherry extract and in callus extract. The spectra of the separated anthocyanins in sour cherry samples were very similar to those of cyanidin 3-glucoside, the standard used for their quantification (Figure 4). Cyanidin 3-glucosylrutinoside, cyanidin 3-sophoroside, cyanidin 3-rutinoside, and cyanidin 3-glucoside were identified as major components in the analyzed samples in agreement with the findings previously reported in the literature [4]. The chromatographic results showed that, in the analyzed sour cherry, the same compounds were present in all the cultivars but at different levels. The total anthocyanin content ranged from 27.8 to 80.4 mg/100 g (Table 1).
Figure 3.

HPLC profile of sour cherry (P cerasus L) cv Amarena Mattarello fruit extract (A) and callus extract (B). Chromatographic conditions as reported in the test. Identification peaks: cyanidin 3-sophoroside (tr 10.133); cyanidin 3-glucosylrutinoside (tr 11.300), cyanidin 3-glucoside (tr 12.200), cyanidin 3-rutinoside (tr 13.967).
Figure 4.

Overlapped spectra of cyanidin 3-glucoside chloride standard with the spectra of peaks eluting at times 10.133; 11.300; 12.200; 13.133; 13.967 minutes.
Table 1.
Total anthocyanin content and composition of sour cherry (P cerasus L) fruit extracts of Visciola Ninno, Amarena Mattarello, and Visciola Sannicandro cultivars and of callus culture extract. Anthocyanin composition was determined as a percentage of total anthocyanins calculated from the peak area at 518 nm; nd = not detected.
| Extracts | Total anthocyanin (mg/100 g) | Peak area at 518 nm (%) | |||
|---|---|---|---|---|---|
| Cyanidin 3-sophoroside | Cyanidin 3-glucosylrutinoside | Cyanidin 3-glucoside | Cyanidin 3-rutinoside | ||
| VN | 27.8 ± 0.010 | 2.58 | 62.23 | 1.87 | 33.32 |
| AM | 80.4 ± 0.100 | 2.91 | 64.54 | 1.13 | 31.42 |
| VS | 74.6 ± 0.050 | 3.87 | 67.58 | 1.71 | 26.84 |
| Callus | 4.2 ± 0.001 | nd | nd | 72.14 | 27.86 |
As reported in Table 1, the total anthocyanin content was much higher in the fruit extracts than in the callus extract. Our in vitro system is at a preliminary stage of development and it is important to set up the best possible microenvironmental conditions to improve the anthocyanin production. The callus cultures we selected are capable of producing 20-fold less anthocyanin than the fruit of the same field-grown cultivar (AM) (Table 1). Our aim is now to greatly improve the pigment production, to make the in vitro process economically viable and an alternative to the field-grown material. To raise the efficiency it is important, for example, to induce anthocyanin production not only at the surface but even inside the callus.
Although total anthocyanin content in our cultivars varied, depending on the genotype, each cultivar profile contained the same compounds in quite similar proportions. Cyanidin 3-glucosylrutinoside was the main anthocyanin found, followed by cyanidin 3-rutinoside, cyanidin 3-sophoroside, and cyanidin 3-glucoside. The anthocyanin profile found in fruit extracts was similar in all tested genotypes and was quite different from that found in the callus extract. In the callus extract only cyanidin 3-glucoside and cyanidin 3-rutinoside were present, the first one at a very high proportion (72.14%) (Table 1). This aspect reveals the ability of the in vitro cell to modulate the anthocyanin metabolism towards less evolved molecular structures. It is reported that the metabolic flux of in vitro systems is often simplified but could be driven towards the accumulation of specific compounds with interesting characteristics [9, 17], thus providing a powerful tool for biotechnological applications.
Since it has been shown that the role of fruit and vegetables in protection against cancer, cardiovascular disease, and cerebrovascular disease is to be attributed to the various antioxidant compounds contained in these foods, and that the biological activities of anthocyanins could also be due to their antioxidant properties, the evaluation of the antioxidant capacity of anthocyanin containing fruits or anthocyanin extracts is an important parameter for the suitable formulation of functional foods.
Several methods have been developed to measure the total antioxidant capacity of various biological samples. Among them, ORAC and TEAC are the most important.
We used an improved ORAC assay using FL as a fluorescent probe, since it has been shown that the previously used probe, the β-Phycoerythrin, gave problems in terms of photostability and reproducibility [18].
The total antioxidant capacity of fruit extracts, measured as ORACFL, ranged from a low 1145 to 1916 μmol TE/100 g of FW (Figure 5). These values are not comparable with those reported in several papers in which β-Phycoerythrin is used as the fluorescent probe, as described by Ou et al [14]. In TEAC assay, values showed a range of 2000–2600 μmol TE/100 g of FW (Figure 6). Few reports deal with the evaluation of the antioxidant activity of fruit extracts using the TEAC procedure [19]. The values found in sour cherry fruits are comparable to those found in some berry fruits, for example, strawberry, and are higher than in apple and kiwiafruit [20]. The total antioxidant capacity of the callus extracts was lower than that of fruits, in both ORAC and TEAC assays (630–746 μmol TE/100 g of FW) (Figures 5 and 6). However, if we compare the total antioxidant capacity of the callus to that of the fruit, the value is nearly 4-fold less, whereas it was 20-fold less in terms of anthocyanin content. The antioxidant capacity can be supported even by other polyphenolic compounds contained in sour cherry fruits, as reported by Wang et al, [21]. These compounds could be at a high level in callus cultures, thus contributing to the total antioxidant capacity.
Figure 5.

ORAC value of sour cherry (P cerasus L) fruit and callus extracts. The results are expressed as micromole Trolox equivalents per gram of fresh weight. Data is expressed as means ± SD of two assays per extract. Fruits are taken from the cultivars Amarena Mattarello, Visciola Ninno, and Visciola Sannicandro. Callus has been generated in vitro from the leaves of sour cherry cv Amarena Mattarello.
Figure 6.

TEAC value of sour cherry (P cerasus L) fruit and callus extracts. The results are expressed as micromole Trolox equivalents per gram of fresh weight. Data is expressed as means ± SD of two assays per extract. Fruits are taken from the cultivars Amarena Mattarello, Visciola Ninno, and Visciola Sannicandro. Callus has been generated in vitro from the leaves of sour cherry cv Amarena Mattarello.
The values found for sour cherry in the ORAC and TEAC assays were quite similar, even though the two methods are based on different reaction mechanisms. TEAC is based on the inhibition of the absorbance of the radical cation of ABTS by antioxidants. The antioxidants are oxidized by the oxidant ABTS•+, with a single electron transfer (SET) reaction from the antioxidant molecule to the oxidant. The ORAC assay is based on a hydrogen atom transfer (HAT) reaction, with a peroxyl radical ROO• that abstracts a hydrogen atom from the antioxidants, thus retarding or inhibiting the reaction between the ROO• and the target molecule probe. The different reaction mechanisms of the two assays could explain the different rank order of the three cultivars. The ORAC value for cv VN was different from the TEAC value, whereas the values for the other materials were comparable.
The antioxidant activity assays used juice extracts while the anthocyanin analysis used methanolic extracts in order to perform both assays on samples extracted with the most suitable solvent for each method. Therefore, it is possible to compare the anthocyanin content to the values found in the antioxidant capacity assays. The trend shown by the ORAC assay fitted that of the anthocyanin content particularly for fruits. The higher anthocyanin contents were for cv AM and cv VS, which showed the higher ORAC values. For callus, we discussed above the possible contribution of antioxidant compounds other than anthocyanins. Moreover, the antioxidant melatonin was recently identified in two cultivars (Balaton and Montmorency) of tart cherry [22]. This finding provides an interesting link with the anecdotal consumption of cherries as a health promoting food, and represents a further reason for studying this fruit species.
References
- 1.Rice-Evans C. Screening of phenolics and flavonoids for antioxidant activity. In: Packer L, Hiramatsu M, Yoshikawa T, editors. Antioxidant Food Supplements in Human Health. San Diego, Calif: Academic Press; 1999. pp. 239–253. [Google Scholar]
- 2.Kamei H, Kojima S, Hasegawa M, Umeda T, Terabe K, Yukawa T. Suppressive effect of flavonoid extracts from flower petals on cultured human malignant cells. J Clin Exp Med. 1993;164:829–830. [Google Scholar]
- 3.Bomser J, Madhavi D.L, Singletary K, Smith M.A. In vitro anticancer activity of fruit extracts from Vaccinium species. Planta Med. 1996;62(3):212–216. doi: 10.1055/s-2006-957862. [DOI] [PubMed] [Google Scholar]
- 4.Wang H, Nair M.G, Iezzoni A, Strasburg G.M, Booren A.M, Gray J.I. Quantification and characterization of anthocyanins in Balaton tart cherries. J Agric Food Chem. 1997;45(7):2556–2560. [Google Scholar]
- 5.Wang H, Nair M.G, Strasburg G.M, et al. Antioxidant and antiinflammatory activities of anthocyanins and their aglycon, cyanidin, from tart cherries. J Nat Prod. 1999;62(2):294–296. doi: 10.1021/np980501m. [DOI] [PubMed] [Google Scholar]
- 6.Kang S.Y, Seeram N.P, Nair M.G, Bourquin L.D. Tart cherry anthocyanins inhibit tumor development in ApcMin mice and reduce proliferation of human colon cancer cells. Cancer Lett. 2003;194(1):13–19. [PubMed] [Google Scholar]
- 7.Smith M.A, Pépin M. Stimulation of bioactive flavonoid production in suspension and bioreactor-based cell cultures. In: Altman A, Ziv M, Izhar S, editors. Plant Biotechnology and In Vitro Biology in the 21st Century. Dordrecht: Kluwer Academic Publishers; 1999. pp. 333–336. [Google Scholar]
- 8.Curtin C, Zhang W, Franco C. Manipulating anthocyanin composition in Vitis vinifera suspension cultures by elicitation with jasmonic acid and light irradiation. Biotechnol Lett. 2003;25(14):1131–1135. doi: 10.1023/a:1024556825544. [DOI] [PubMed] [Google Scholar]
- 9.Plata N, Konczak-Islam I, Jayram S, McClelland K, Woolford T, Franks P. Effect of methyl jasmonate and p-coumaric acid on anthocyanin composition in a sweet potato cell suspension culture. Biochemical Engineering Journal. 2003;14(3):171–177. [Google Scholar]
- 10.Hong V, Wrolstad R.E. Characterization of anthocyanin-containing colorants and fruit juices by HPLC/photodiode array detection. J Agric Food Chem. 1990;38(3):698–708. [Google Scholar]
- 11.Goiffon J-P, Mouly P.P, Gaydou E.M. Anthocyanic pigment determination in red fruit juices, concentrated juices and syrups using liquid chromatography. Anal Chim Acta. 1999;382(1-2):39–50. [Google Scholar]
- 12.Blando F. In vitro propagation of Prunus cerasus L. Italus Hortus. 2002;9(3):16–17. [Google Scholar]
- 13.Blando F, Gala R, Gerardi C, Druart P, editors. Sour cherry (Prunus cerasus L) production towards the utilization for a new century. In: Proceedings of the 26th International Horticultural Congress; 2002; Toronto. IHS ed; p. 180. [Google Scholar]
- 14.Ou B, Hampsch-Woodill M, Prior R.L. Development and validation of an improved oxygen radical absorbance capacity assay using fluorescein as the fluorescent probe. J Agric Food Chem. 2001;49(10):4619–4626. doi: 10.1021/jf010586o. [DOI] [PubMed] [Google Scholar]
- 15.Re R, Pellegrini N, Proteggente A, Pannala A, Yang M, Rice-Evans C. Antioxidant activity applying an improved ABTS radical cation decolorization assay. Free Radic Biol Med. 1999;26(9-10):1231–1237. doi: 10.1016/s0891-5849(98)00315-3. [DOI] [PubMed] [Google Scholar]
- 16.Takeda J. Light-induced synthesis of anthocyanin in carrot cells in suspension. J Exp Bot. 1991;41:749–755. [Google Scholar]
- 17.Konczak-Islam I, Nakatani M, Yoshinaga M, Yamakawa O. Effect of ammonium ion and temperature on anthocyanin composition in sweet potato cell suspension culture. Plant Biotechnol. 2001;18(2):109–117. [Google Scholar]
- 18.Huang D, Ou B, Hampsch-Woodill M, Flanagan J.A, Prior R.L. High-throughput assay of oxygen radical absorbance capacity (ORAC) using a multichannel liquid handling system coupled with a microplate fluorescence reader in 96-well format. J Agric Food Chem. 2002;50(16):4437–4444. doi: 10.1021/jf0201529. [DOI] [PubMed] [Google Scholar]
- 19.Proteggente A.R, Pannala A.S, Paganga G, et al. The antioxidant activity of regularly consumed fruit and vegetables reflects their phenolic and vitamin C composition. Free Radic Res. 2002;36(2):217–233. doi: 10.1080/10715760290006484. [DOI] [PubMed] [Google Scholar]
- 20.Lister C.E, Wilson P.E, Sutton K.H, Morrison S.C. Understanding the health benefits of blackcurrants. Acta Hort. 2002;585:443–449. [Google Scholar]
- 21.Wang H, Nair M.G, Strasburg G.M, Booren A.M, Gray J.I. Novel antioxidant compounds from tart cherries (Prunus cerasus) J Nat Prod. 1999;62(1):86–88. doi: 10.1021/np980268s. [DOI] [PubMed] [Google Scholar]
- 22.Burkhardt S, Tan D.X, Manchester L.C, Hardeland R, Reiter R.J. Detection and quantification of the antioxidant melatonin in Montmorency and Balaton tart cherries (Prunus cerasus) J Agric Food Chem. 2001;49(10):4898–4902. doi: 10.1021/jf010321+. [DOI] [PubMed] [Google Scholar]