

Summary
Human induced pluripotent stem cells (hiPSCs) offer advantages for disease modeling and drug discovery. However, recreating innate cellular pathologies, particularly in late-onset neurodegenerative diseases with accumulated protein aggregates including Parkinson’s disease (PD), has been challenging. To overcome this barrier, we developed an optogenetics-assisted α-synuclein (α-syn) aggregation induction system (OASIS) that rapidly induces α-syn aggregates and toxicity in PD hiPSC-midbrain dopaminergic neurons and midbrain organoids. Our OASIS-based primary compound screening with SH-SY5Y cells identified 5 candidates that were secondarily validated with OASIS PD hiPSC-midbrain dopaminergic neurons and midbrain organoids, leading us to finally select BAG956. Furthermore, BAG956 significantly reverses characteristic PD phenotypes in α-syn preformed fibril models in vitro and in vivo by promoting autophagic clearance of pathological α-syn aggregates. Following the FDA Modernization Act 2.0’s emphasis on alternative non-animal testing methods, our OASIS can serve as an animal-free preclinical test model (newly termed “nonclinical test”) for the synucleinopathy drug development.
Introduction
Parkinson’s disease (PD) is a progressive, age-related neurodegenerative disease characterized by the loss of midbrain dopaminergic (mDA) neurons1. The formation of unique, filamentous inclusion bodies called Lewy bodies (LBs) or Lewy neurites, comprised mostly of pathological alpha-synuclein (α-syn) aggregates which is the product of the SNCA gene, is considered the hallmark of both PD and dementia with LBs1–5. PD is the second most common neurodegenerative disorder, and key pathology in PD is known to be synucleinopathy1,3–5; however, there is no effective cure yet. One of the major obstacles of studying PD is the inaccessibility of the brain tissue samples from PD patients. The current understanding of PD pathology has been mostly derived from postmortem brain study6. Although the animal models have been very useful in exploring the pathogenesis of PD as an alternative method, they do not fully recapitulate the pathological phenotypes of human PD.
With the recent FDA Modernization Act 2.0, signed into law in December 2022, the focus on developing alternative non-animal testing methods has grown, and the FDA no longer mandates animal testing for every new drug development protocol7,8. This change emphasizes the importance of human-based models, such as human induced pluripotent stem cell (hiPSC) technology and organoids, for nonclinical tests (preclinical tests) in drug development and safety testing. Therefore, it is important to develop a new advanced in vitro hiPSC-based model, recapitulate human disease pathology, offer improved preclinical assessment of drug candidates, and align with the goals of the FDA Modernization Act 2.0.
Recent advances in hiPSC technology makes it possible to generate mDA neurons of PD patients. However, it is difficult to model late-onset human disease including PD with hiPSCs since somatic reprogramming also resets their pathological state back to an embryonic condition. For PD-iPSCs, this means that further methods are needed to recapitulate the accumulated aberrant protein aggregation that is a necessary component for modeling disease progression. Several hiPSC studies have shown that the differentiation of hiPSCs into certain mature cell types often takes months to exhibit disease-associated features9,10. Therefore, it is challenging to develop the disease-associated α-syn aggregation neuronal cell model11,12 which can be applied for novel compound screening. Moreover, most non-cell-based compound screening have a limitation of low reproducibility in human neurons.
In recent years, various optogenetic proteins have been developed as a controlling tool of diverse biological processes using light13. These optogenetic proteins allow light-induced spatiotemporal control of protein interaction including homo-oligomerization. The power to dynamically and precisely modulate the protein association/aggregation activity in neurodegenerative disease has been postulated, but this has yet to be applied in clinically relevant mammalian model systems.
In this study, we present OASIS, an optogenetics-assisted alpha-synuclein aggregation induction system, that uses optogenetic proteins to allow light-induced spatiotemporal control of protein interactions, and the development of an OASIS-based drug screening platform. Together, these methods lead us to identify one small molecule, BAG 956, which rescues α-syn aggregation-mediated toxicity to PD hiPSC-derived mDA neurons and midbrain organoids (MOs), as well as α-syn preformed fibrils (PFF) models14–16 in mouse primary neurons and in vivo in autophagy-dependent manner.
Results
Light-induced pathologic α-syn aggregation with neuronal toxicity in PD hiPSC-derived mDA neurons
We speculated that increasing the spatial proximity of each α-syn monomer through optogenetic modulation could facilitate the formation of disease-related α-syn aggregates. To test this hypothesis, we introduced a light-responsive domain (Cry2clust)17 into mCherry-tagged α-syn (Figures 1A and 1B); Cry2clust promotes homo-interaction upon blue light illumination. We confirmed that the α-syn construct fused with Cry2clust at the C-terminus (named opto-α-syn) efficiently induced α-syn aggregates in PD hiPSC-derived neural progenitors stimulated with our customized blue light illumination plate (Figures S1A–S1D). We utilized SNCA triplication hiPSCs18 to generate opto-α-syn or opto-mock-expressing PD hiPSC lines using CRISPR-Cas9 (Figure S1E). We then differentiated these PD hiPSCs into mDA neurons without any significant changes in differentiation efficiency, as described previously19,20 (Figures 1C and S1F–S1G). We found a significant induction of spatially regulated α-syn aggregates in response to blue light only in opto-α-syn PD hiPSC-derived mDA (opto-α-syn-mDA) neurons in a time-dependent manner by live cell imaging (Figure 1D and Videos S1–5). These opto-α-syn-aggregates formed more rapidly in the neurite region than in the cell body region (Figures 1E, 1F, S1H, S1I, and Videos S6, S7) and transmitted to adjacent neurons (Figure S1J and Video S8) as previously reported21–26. We further confirmed the participation of endogenous α-syn in the opto-α-syn aggregation process by using SNCA−/− hiPSC-derived mDA neurons (Figures 1G and S1K).
Figure 1. Light-induced disease-associated α-syn aggregation in PD hiPSC-derived mDA neurons.
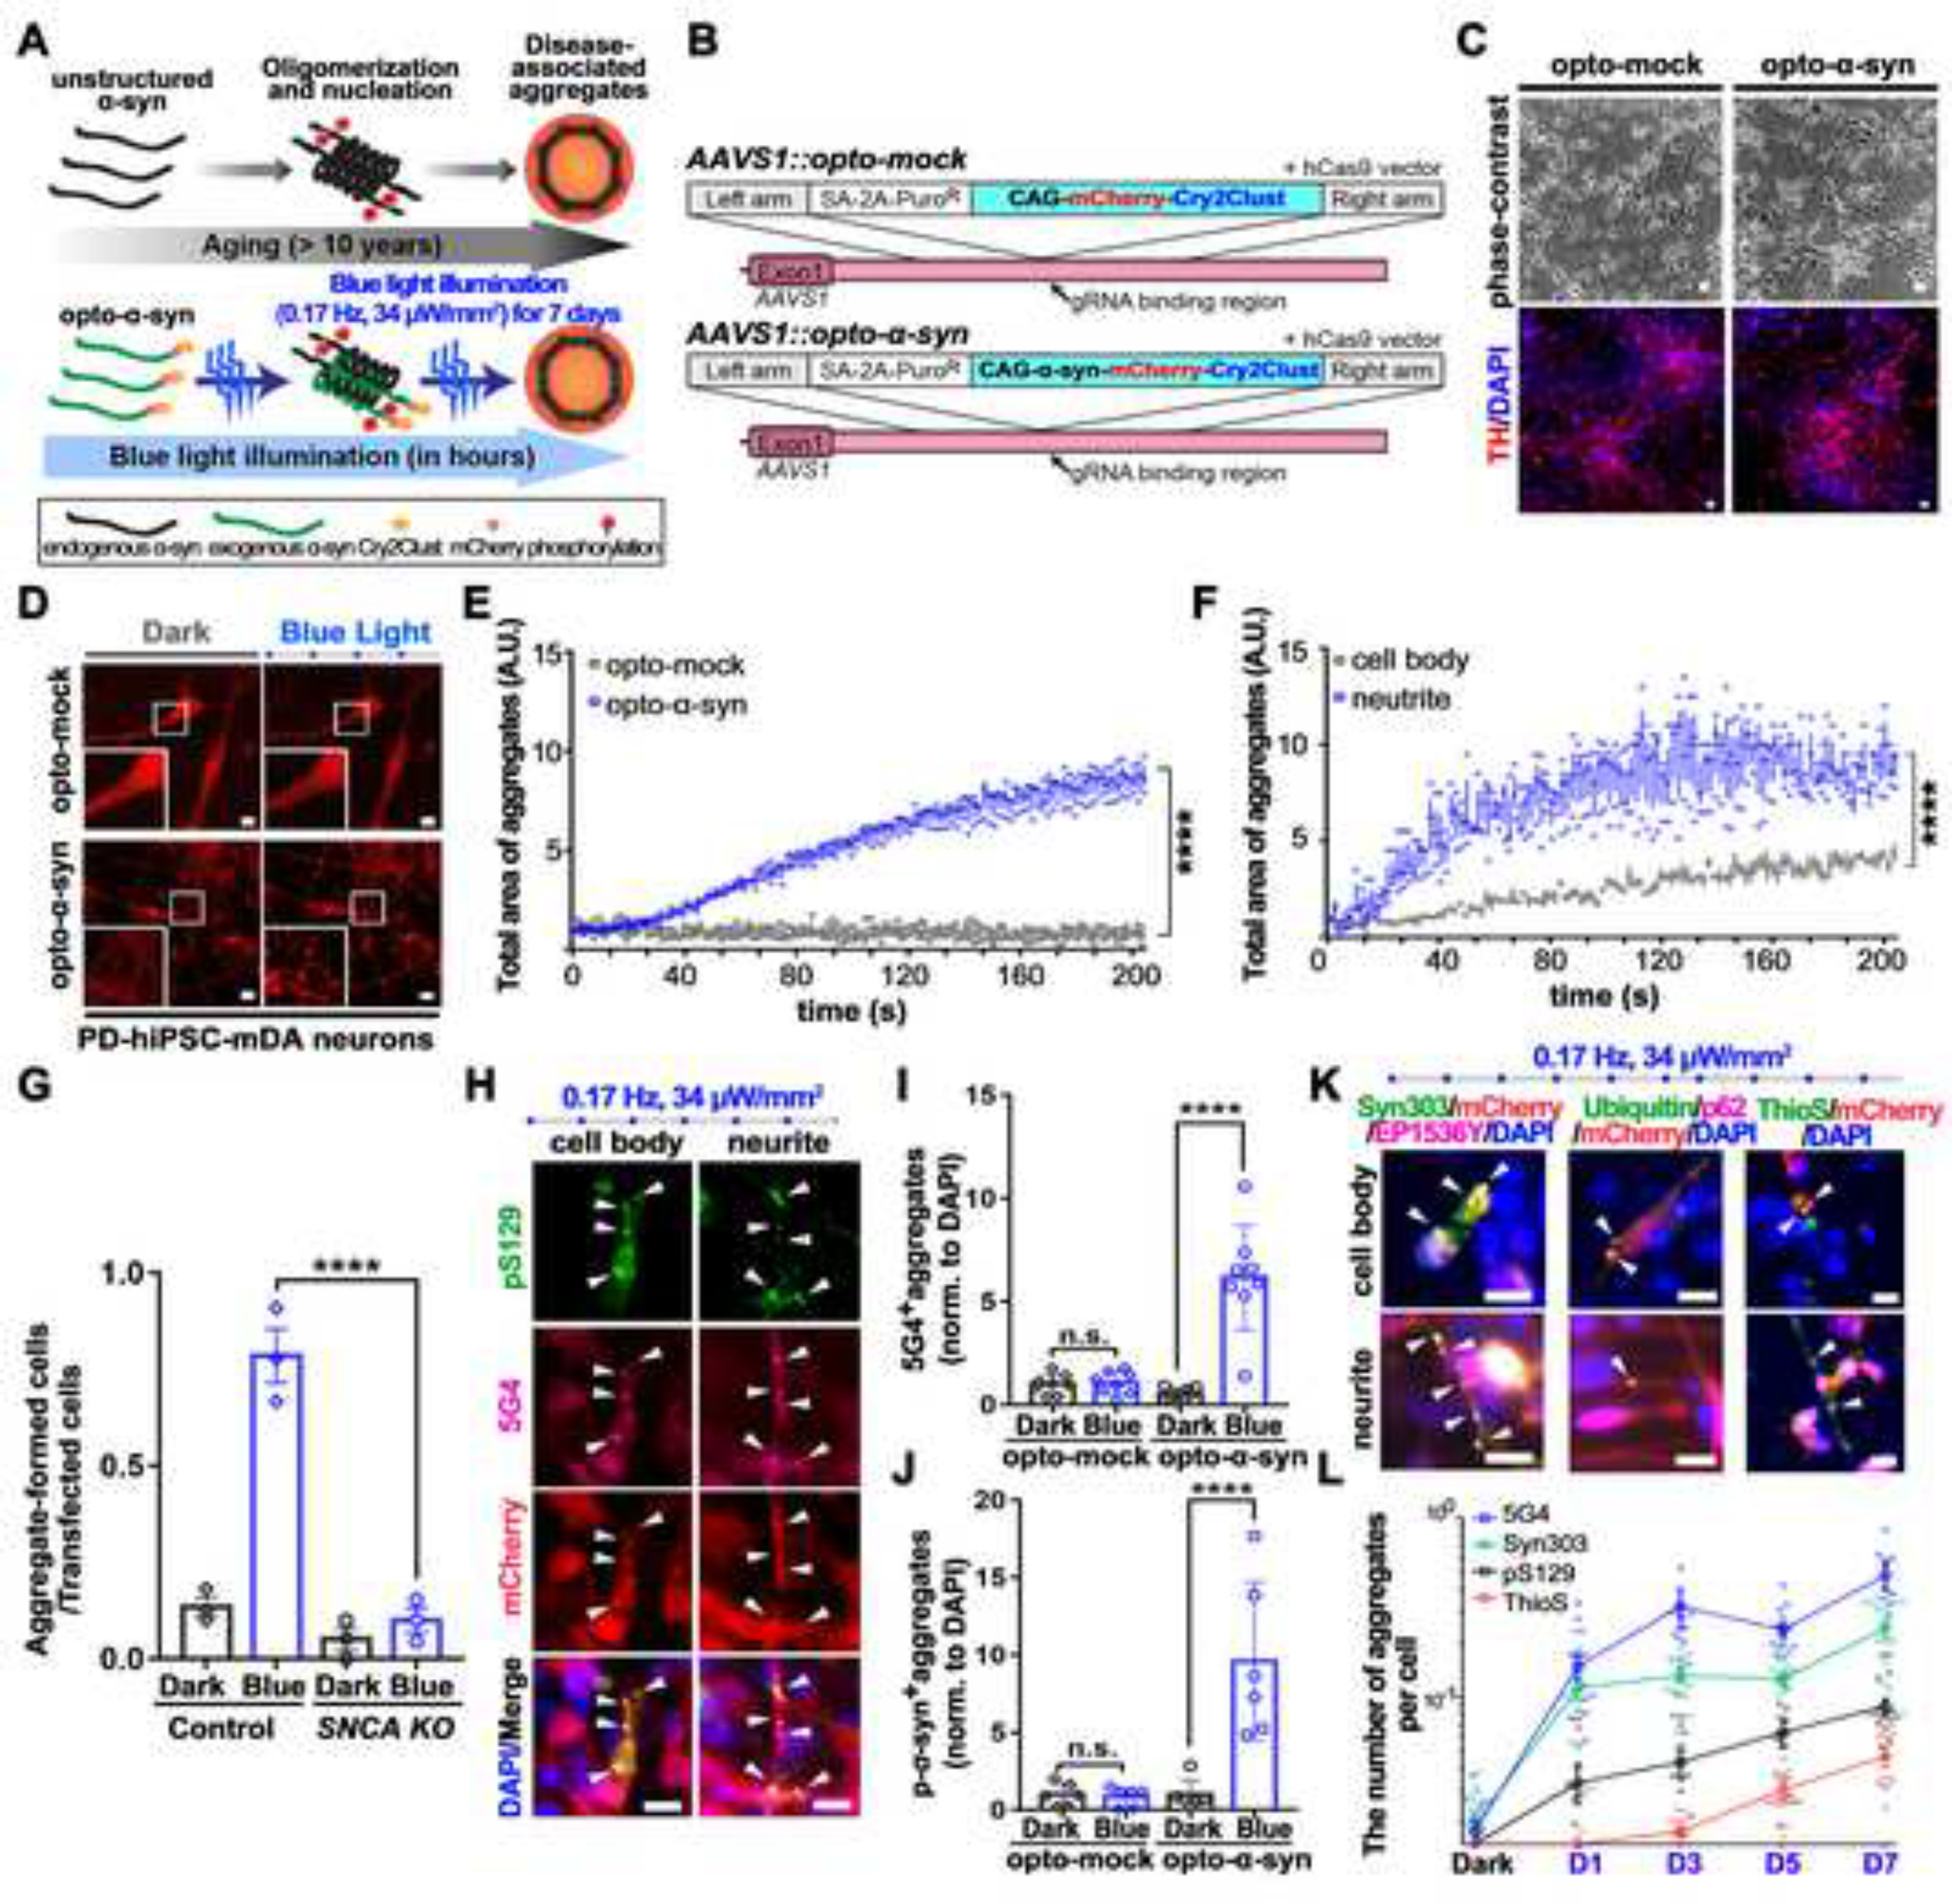
(A) Schematic representation of the optogenetics-assisted α-syn aggregation induction system (OASIS).
(B) Schematic for AAVS1 locus targeting using homologous recombination enhanced by CRISPR/Cas9 system. SA, splice acceptor.
(C) Representative images of differentiated TH+ mDA neurons from opto-mock or opto-α-syn PD hiPSCs.
(D) The opto-α-syn aggregates formation in PD-hiPSC-mDA neurons.
(E) Quantification of the total area of opto-α-syn aggregate in mDA neurons expressing opto-mock or opto-α-syn over time using automated live-cell imaging system. (n = 3, each experiment contains at least 40 cells, ordinary two-way ANOVA).
(F) Quantification of the total area of opto-α-syn aggregate in cell body or neurite of opto-α-syn-expressing mDA neurons over time using automated live-cell imaging system. (n = 3, each experiment contains at least 40 cells, ordinary two-way ANOVA).
(G) Quantification of aggregate-forming cells in control or SNCA−/− cells (n = 3, one-way ANOVA followed by Tukey’s post hoc test).
(H) Representative images of light-induced α-syn aggregates in opto-α-syn-mDA neurons.
(I) Quantification of the number of 5G4+ aggregates in mDA neurons (n = 8, one-way ANOVA followed by Tukey’s post hoc test).
(J) Quantification of the number of pS129-α-syn+ aggregates in mDA neurons (n = 6, one-way ANOVA followed by Tukey’s post hoc test).
(K) Co-localization of mCherry+ aggregates with indicated antibodies or Thioflavin S (ThioS) (White arrowheads).
(L) Quantification of the indicated marker aggregates at the indicated time-point after blue light illumination in opto-α-syn-mDA neurons (n = 12).
Scale bars, 10 μm. Bars represent means ± SEM. n.s., not significant. ****P < 0.0001. Blue light condition: 34 μW/mm2 at 470 nm, 0.17 Hz, 0.5 s, for 7 days for fixed-cell imaging, 1.5 μW at 488nm, 0.5 Hz, 1 s for live-cell imaging.
To further characterize the opto-α-syn aggregates, we stained them with antibodies against markers for pathologic PD-associated aggregates, including anti-5G427,28, anti-pS129-α-syn29, anti-syn30312,30, anti-p62, and anti-ubiquitin31 antibodies and ThioS32 (Figures 1H–1K and S1L–S1S). Our quantitative immunostaining experiments looked at key PD markers over a course of time and showed different increasing profiles of each marker-specific aggregate (Figure 1L), suggesting these conformation-selective antibodies and probes were related to the gradual progress of α-syn pathology, and OASIS efficiently reproduced the late-onset PD-phenotypes in PD-hiPSC mDA neurons. We also detected a selective loss of tyrosine hydroxylase-positive (TH+) mDA neurons in opto-α-syn-mDA neurons with blue light (Figures 2A–2D and S2A–S2D). To validate this result, we generated a mDA neuron-specific reporter system in opto-mock or opto-α-syn PD hiPSC lines using nuclear receptor related 1 (NURR1) as the mDA neuron marker (NURR1::GFP PD hiPSCs)33 (Figures 2E and S2E, S2F). We confirmed that the percentage of NURR1::GFP+ cells was significantly decreased by blue light illumination only in opto-α-syn mDA neurons (Figure 2F). Consistently, we observed a gradual increase of cleaved caspase-3 with blue light over time (Figures 2G and 2H) and a decrease of mitochondrial potential (Figure S2G) in opto-α-syn-mDA neurons34,35. Collectively, our data suggested that blue light-exposed opto-α-syn-mDA neurons induced the formation of pathological α-syn aggregates and TH+ mDA neuron-specific neurotoxicity, which are key features of PD pathology36–39.
Figure 2. Selective death of PD hiPSC-derived mDA neurons induced by the optogenetics-assisted α-syn aggregation induction system.
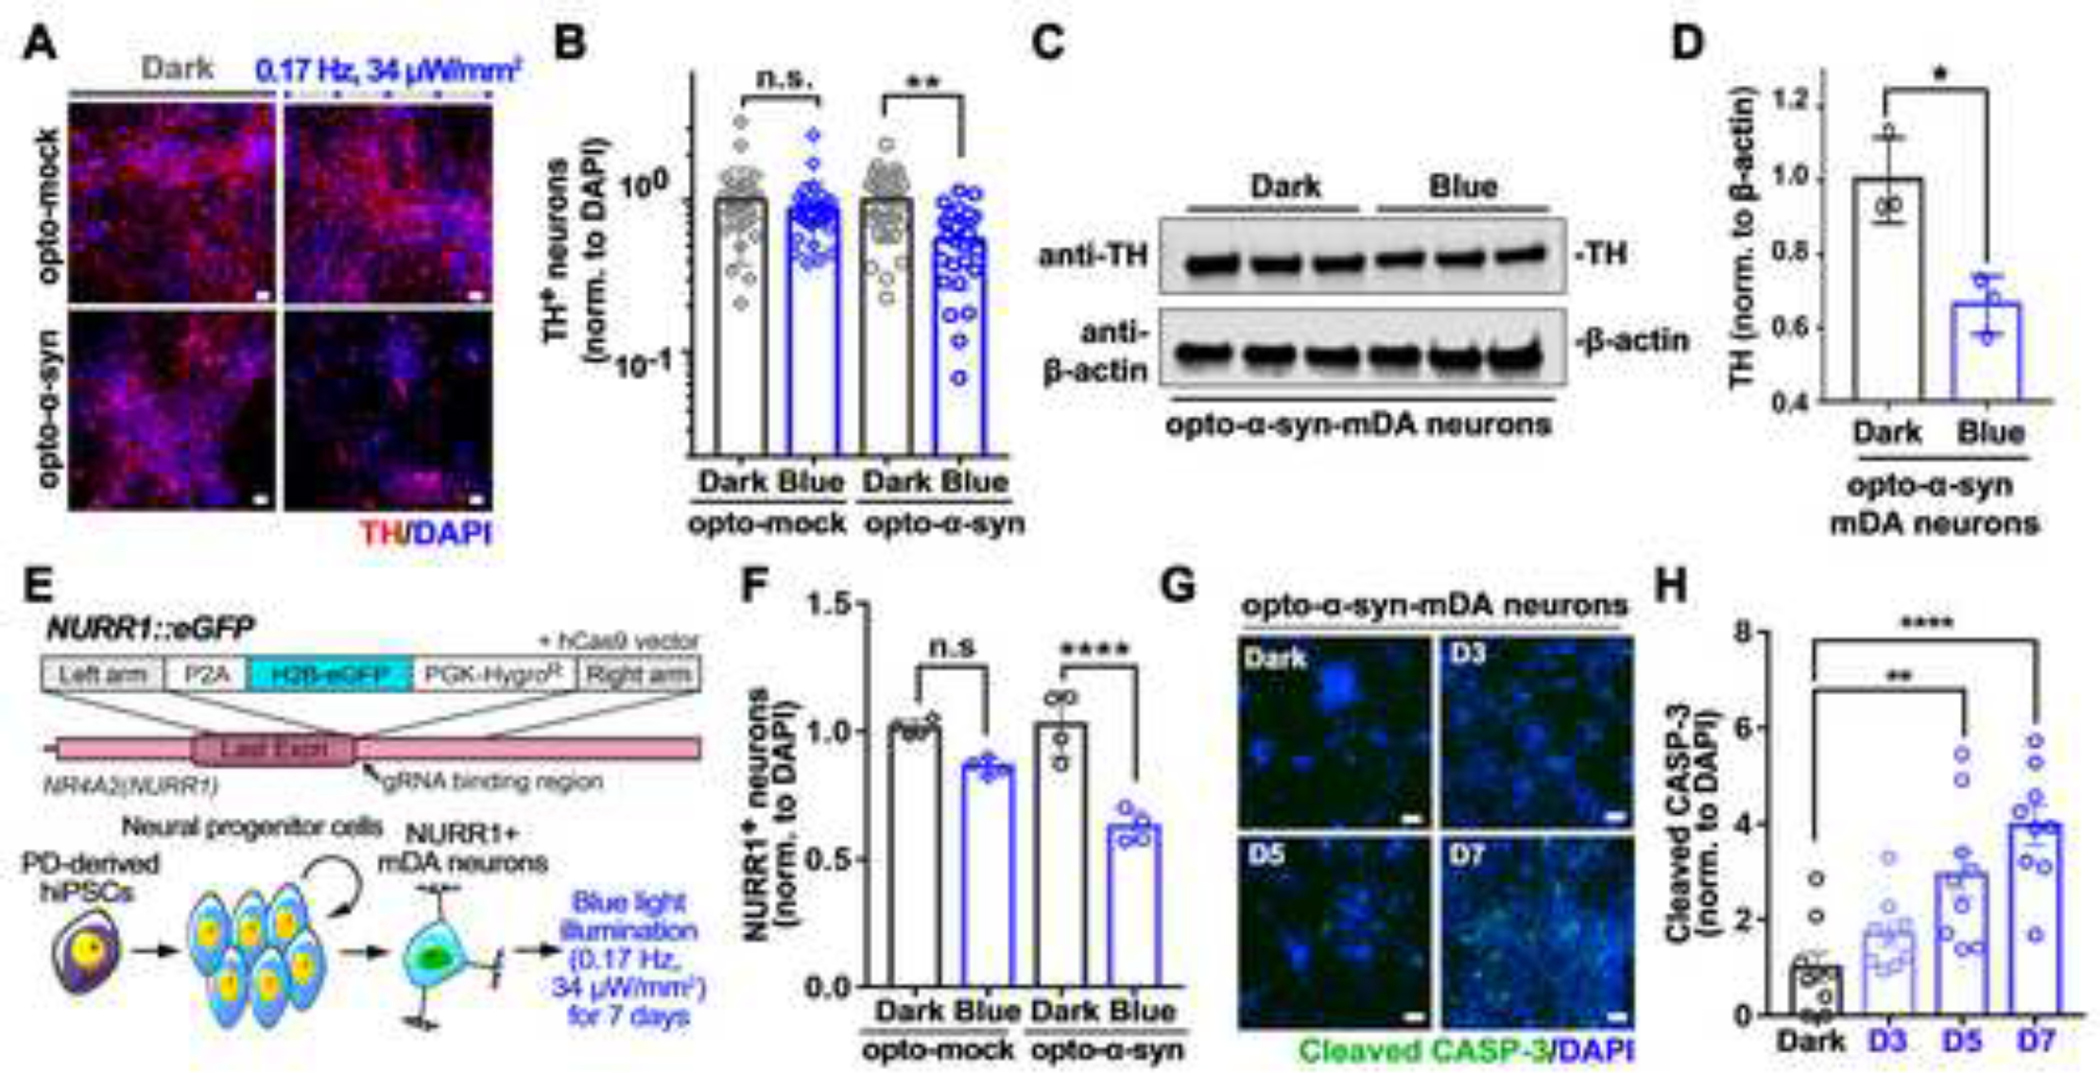
(A) Representative images of TH+ neurons kept in dark or exposed to blue light.
(B) Quantification of the number of TH+ neurons in response to blue light (n = 30, one-way ANOVA followed by Tukey’s post hoc test).
(C) Representative western blot images of TH in opto-α-syn-mDA neurons kept in dark or exposed to blue light.
(D) Quantification of the level of TH in opto-α-syn-mDA neurons kept in dark or exposed to blue light (n = 3, two-tailed unpaired t-test).
(E) Schematic representation for NR4A2 (also known as NURR1) locus targeted by CRISPR/Cas9 system and differentiation of NURR1::GFP+ neurons.
(F) Quantification of NURR1::GFP+ neurons with or without blue light (n = 4, one-way ANOVA followed by Tukey’s post hoc test).
(G) Representative immunostaining images of cleaved caspase-3 in opto-α-syn-mDA neurons at the indicated time point in response to blue light stimulation.
(H) Quantification of cleaved caspase-3 in opto-α-syn-mDA neurons in response to blue light stimulation (n = 9, one-way ANOVA followed by Tukey’s post hoc test).
Scale bars, 10 μm. Bars represent means ± SEM. n.s., not significant, *P < 0.05, **P < 0.01, ***P < 0.001, ****P < 0.0001. Blue light condition: 34 μW/mm2 at 470 nm, 0.17 Hz, 0.5 s.
Application of the optical induction system for α-syn aggregation into high-content imaging (HCI) compound screening
There have been strong needs to develop a human neuronal cell-based in vitro screening platform to identify novel compounds for preventing or curing PD. To develop simplified and efficient OASIS-based high throughput screening, we established an opto-α-syn knock-in SH-SY5Y cell line using CRISPR/Cas9 (Figure S3A and S3B). We detected the opto-α-syn aggregates with PD-specific antibodies recognizing phosphorylated, aggregated (5G4, Syn-O240)- or misfolded (Syn30312,30)-α-syn in opto-α-syn SH-SY5Y cells with blue light illumination (Figures S3C–S3E). In addition, the 5G4+ α-syn aggregates that co-localized with pS129-α-syn or ubiquitin were insoluble in 1% Triton X-100 (Figure S3F), suggesting we developed a pathologic OASIS in human neuronal cells as well as opto-α-syn mDA neurons without causing any blue light-induced cellular toxicities (Figure S3G and S3H). Next, we developed an OASIS with a high-content imaging (HCI) assay using an anti-5G4 antibody, which has been suggested that only binds to disease-associated forms of aggregated α-syn found in the brain of PD patients, with superior comparative immunohistochemical studies41–43, to identify chemical compounds that inhibit or delay α-syn aggregation. We optimized the protocol for immunocytochemistry-based automated imaging and data analysis with the measurement of the index of 5G4+ aggregates, termed Aggregate Induction Score (AIS, relative index compared to blue control; Figures 3A, 3B and S3I–S3K). We validated the OASIS-based HCI assay with excellent Z’ values of 0.550, which is a criterion for determining whether or not the assay is suitable for compound screening44, by using the AIS value (Figure 3C). Next, we screened a library of 1,280 small molecules (1 μM in 0.1% DMSO) that contained diverse compounds active at GPCRs, kinases, ion channels, nuclear receptors, and transporters. We selected 19 compounds as potential hits in the primary screening (hit rate, 1.5%) (Figure 3D and Table S1). Among them, four of the 19 compounds have been previously reported as potential neuroprotective drugs for PD45–48, confirming the feasibility of our OASIS-based HCI assay. We further validated and selected five potential hit compounds with a significant decrease of AIS when compared with the control (Figures 3E and S3L).
Figure 3. High-content imaging screening with the optogenetics-assisted α-syn aggregation induction system.
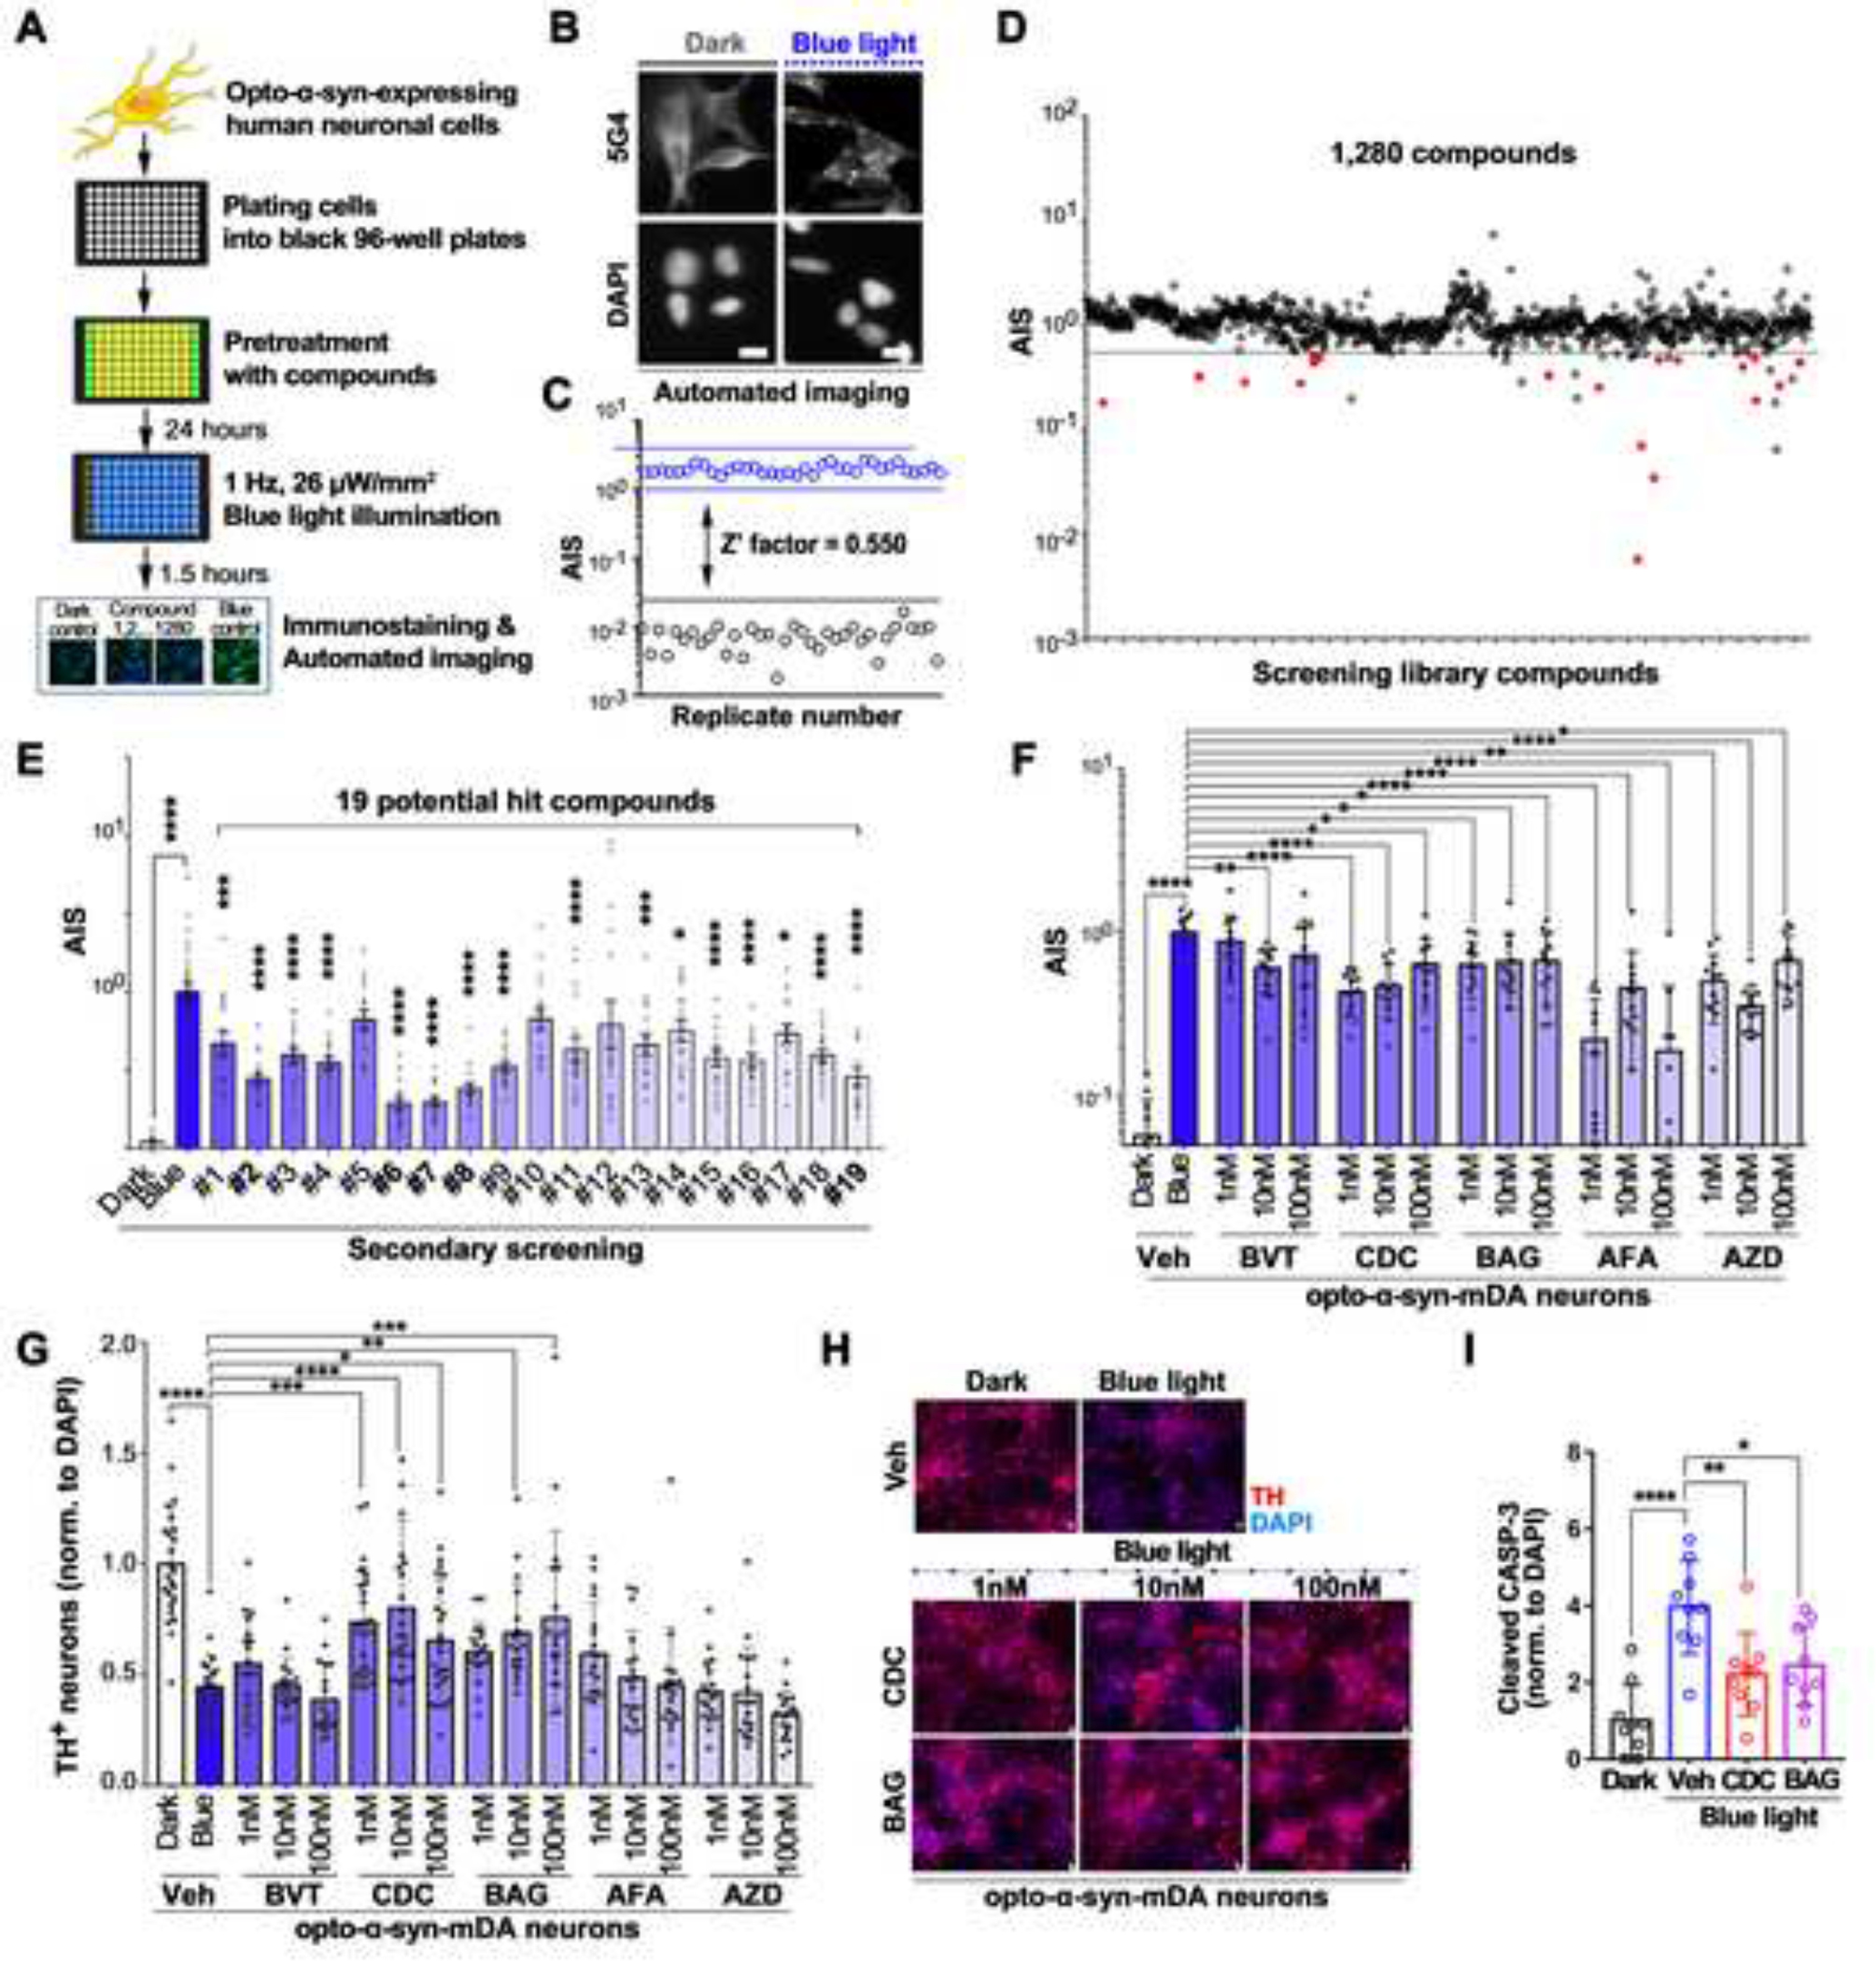
(A) Schematic representation of the process of high-content imaging (HCI) screening with optogenetics-assisted α-synuclein aggregation induction system (OASIS).
(B) Representative images of 5G4+ aggregates or DAPI+ cells by automated imaging in SH-SY5Y cells.
(C) Calculation of Z’-factor for HCI screening with OASIS; opto-α-syn cells in dark (black circles) or exposed to blue light (blue circles) (n = 36).
(D) Scatter plot of compounds screened in the OASIS-based HCI assay. For each compound, the corresponding Aggregates Induction Score (AIS) observed in the drug-treated is plotted (positive control was set as 1.0). 1,280 compounds were screened, and red closed circles represent 19 selected potential hit compounds, with an AIS value of less than 0.5.
(E) Validating effect of 19 compounds on α-syn aggregation in SH-SY5Y cells under 24-well plate culture conditions (n = 31 or 42, one-way ANOVA followed by Dunnett’s post hoc test). Detailed information of numbered compounds was described in Table S1.
(F) Quantification of AIS in opto-α-syn-mDA neurons kept in dark or exposed to blue light with or without 5 selected molecules (n = 12 for BVT (BVT948), BAG (BAG956), AFA (Arcyriaflavin A), and AZD (AZD1480); n =18 for CDC (C 021 dihydrochloride), one-way ANOVA followed by Dunnett’s post hoc test).
(G) Quantification of TH+ neurons in opto-α-syn-mDA neurons kept in dark or exposed to blue light with or without 5 selected molecules (n = 18, one-way ANOVA followed by Dunnett’s post hoc test).
(H) Representative images of TH+ opto-α-syn-mDA neurons kept in dark or exposed to blue light with or without CDC or BAG treatment.
(I) Quantification of cleaved caspase-3 in opto-α-syn-mDA neurons kept in dark or exposed to blue light with or without CDC or BAG treatment (n = 9, one-way ANOVA followed by Dunnett’s post hoc test).
Scale bars, 10 μm. Bars represent means ± SEM. n.s., not significant, *P < 0.05, **P < 0.01, ***P < 0.001, ****P < 0.0001.
Neuroprotective effects of the hit compounds in opto-α-syn-expressing PD hiPSC-derived mDA neurons
We tested whether these potential hit compounds could rescue α-syn aggregation-induced neuronal toxicity on opto-α-syn mDA neurons. The 5G4+ aggregates were significantly decreased in response to all five compounds treatment (Figures 3F and S3M). Out of these five compounds, C 021 dihydrochloride (CDC) and BAG 956 (BAG), rescued the survival rate of TH+ mDA neurons without causing cellular toxicity (Fig. 3G, 3H and S3N, S3O). However, they did not affect the number of TUJ1+ neurons under blue light (Figure S3P). Moreover, we confirmed the dose-dependent neuroprotection effects on TH+ neurons (Figures S3Q and S3R) and decreased levels of cleaved-caspase-3 by CDC and BAG treatment (Figure 3I). Also, we found that all three target proteins (C-C motif chemokine receptor 4 (CCR4) for CDC, Phosphoinositide 3-kinase (PI3K) and Phosphoinositide-dependent kinase-1 (PDK1) for BAG) were up-regulated in mDA neurons compared with hESCs, suggesting the possibility that these two compounds could act selectively in mDA neurons (Figure S3S).
Selective cell death of TH+ mDA neurons and neuroprotective effects of the screened compounds in opto-α-syn-expressing PD hiPSC-derived midbrain organoids
Compared with single-cell type cultures, organoids consist of multiple cell types and display enhanced cellular maturation49. Midbrain organoids (MOs) are particularly useful for modeling midbrain-specific neurodegenerative disorders such as PD50,51. We generated MOs from opto-mock (opto-mock MOs) or opto-α-syn (opto-α-syn MOs) PD hiPSCs52 without any significant difference in the size of organoids after three months of development (Figures S4A and S4B). Consistent with previous results, the level of TH+ mDA neurons was decreased and the number of 5G4+ aggregates was increased only in the blue light illuminated opto-α-syn MOs (Figures 4A–4D and S4C). In addition, 5G4 signals were mainly detected in TH+ mDA neurons (Figure 4B). However, the number of GFAP+ cells did not show significant changes by blue light illumination (Figures 4E and S4D). We further confirmed that the three cytokines and chemokines, MIF, CXCL12, and CCL2, which are related to PD pathology53–55, were increased only in the light-exposed opto-α-syn MOs (Figure S4E). Next, we found that CDC and BAG treatment decreased the 5G4+ aggregates and increased the survival of TH+ mDA neurons without changes of TUJ1+ neurons in opto-α-syn MOs (Figures 4F–4H and S4F, S4G). Additionally, we confirmed that two screened compounds, CDC and BAG, downregulated pre-existing opto-α-syn aggregates in dark condition (Figures 4I–4K), suggesting our OASIS-based screened compounds could activate the clearance of pre-formed α-syn aggregates. Overall, the selected two compounds rescued the PD-related pathology not only in 2D cultures but also in 3D organoid models.
Figure 4. Confirmation of the effects of selected two compounds on the opto-α-syn-expressing PD hiPSC-derived midbrain organoids (MOs).
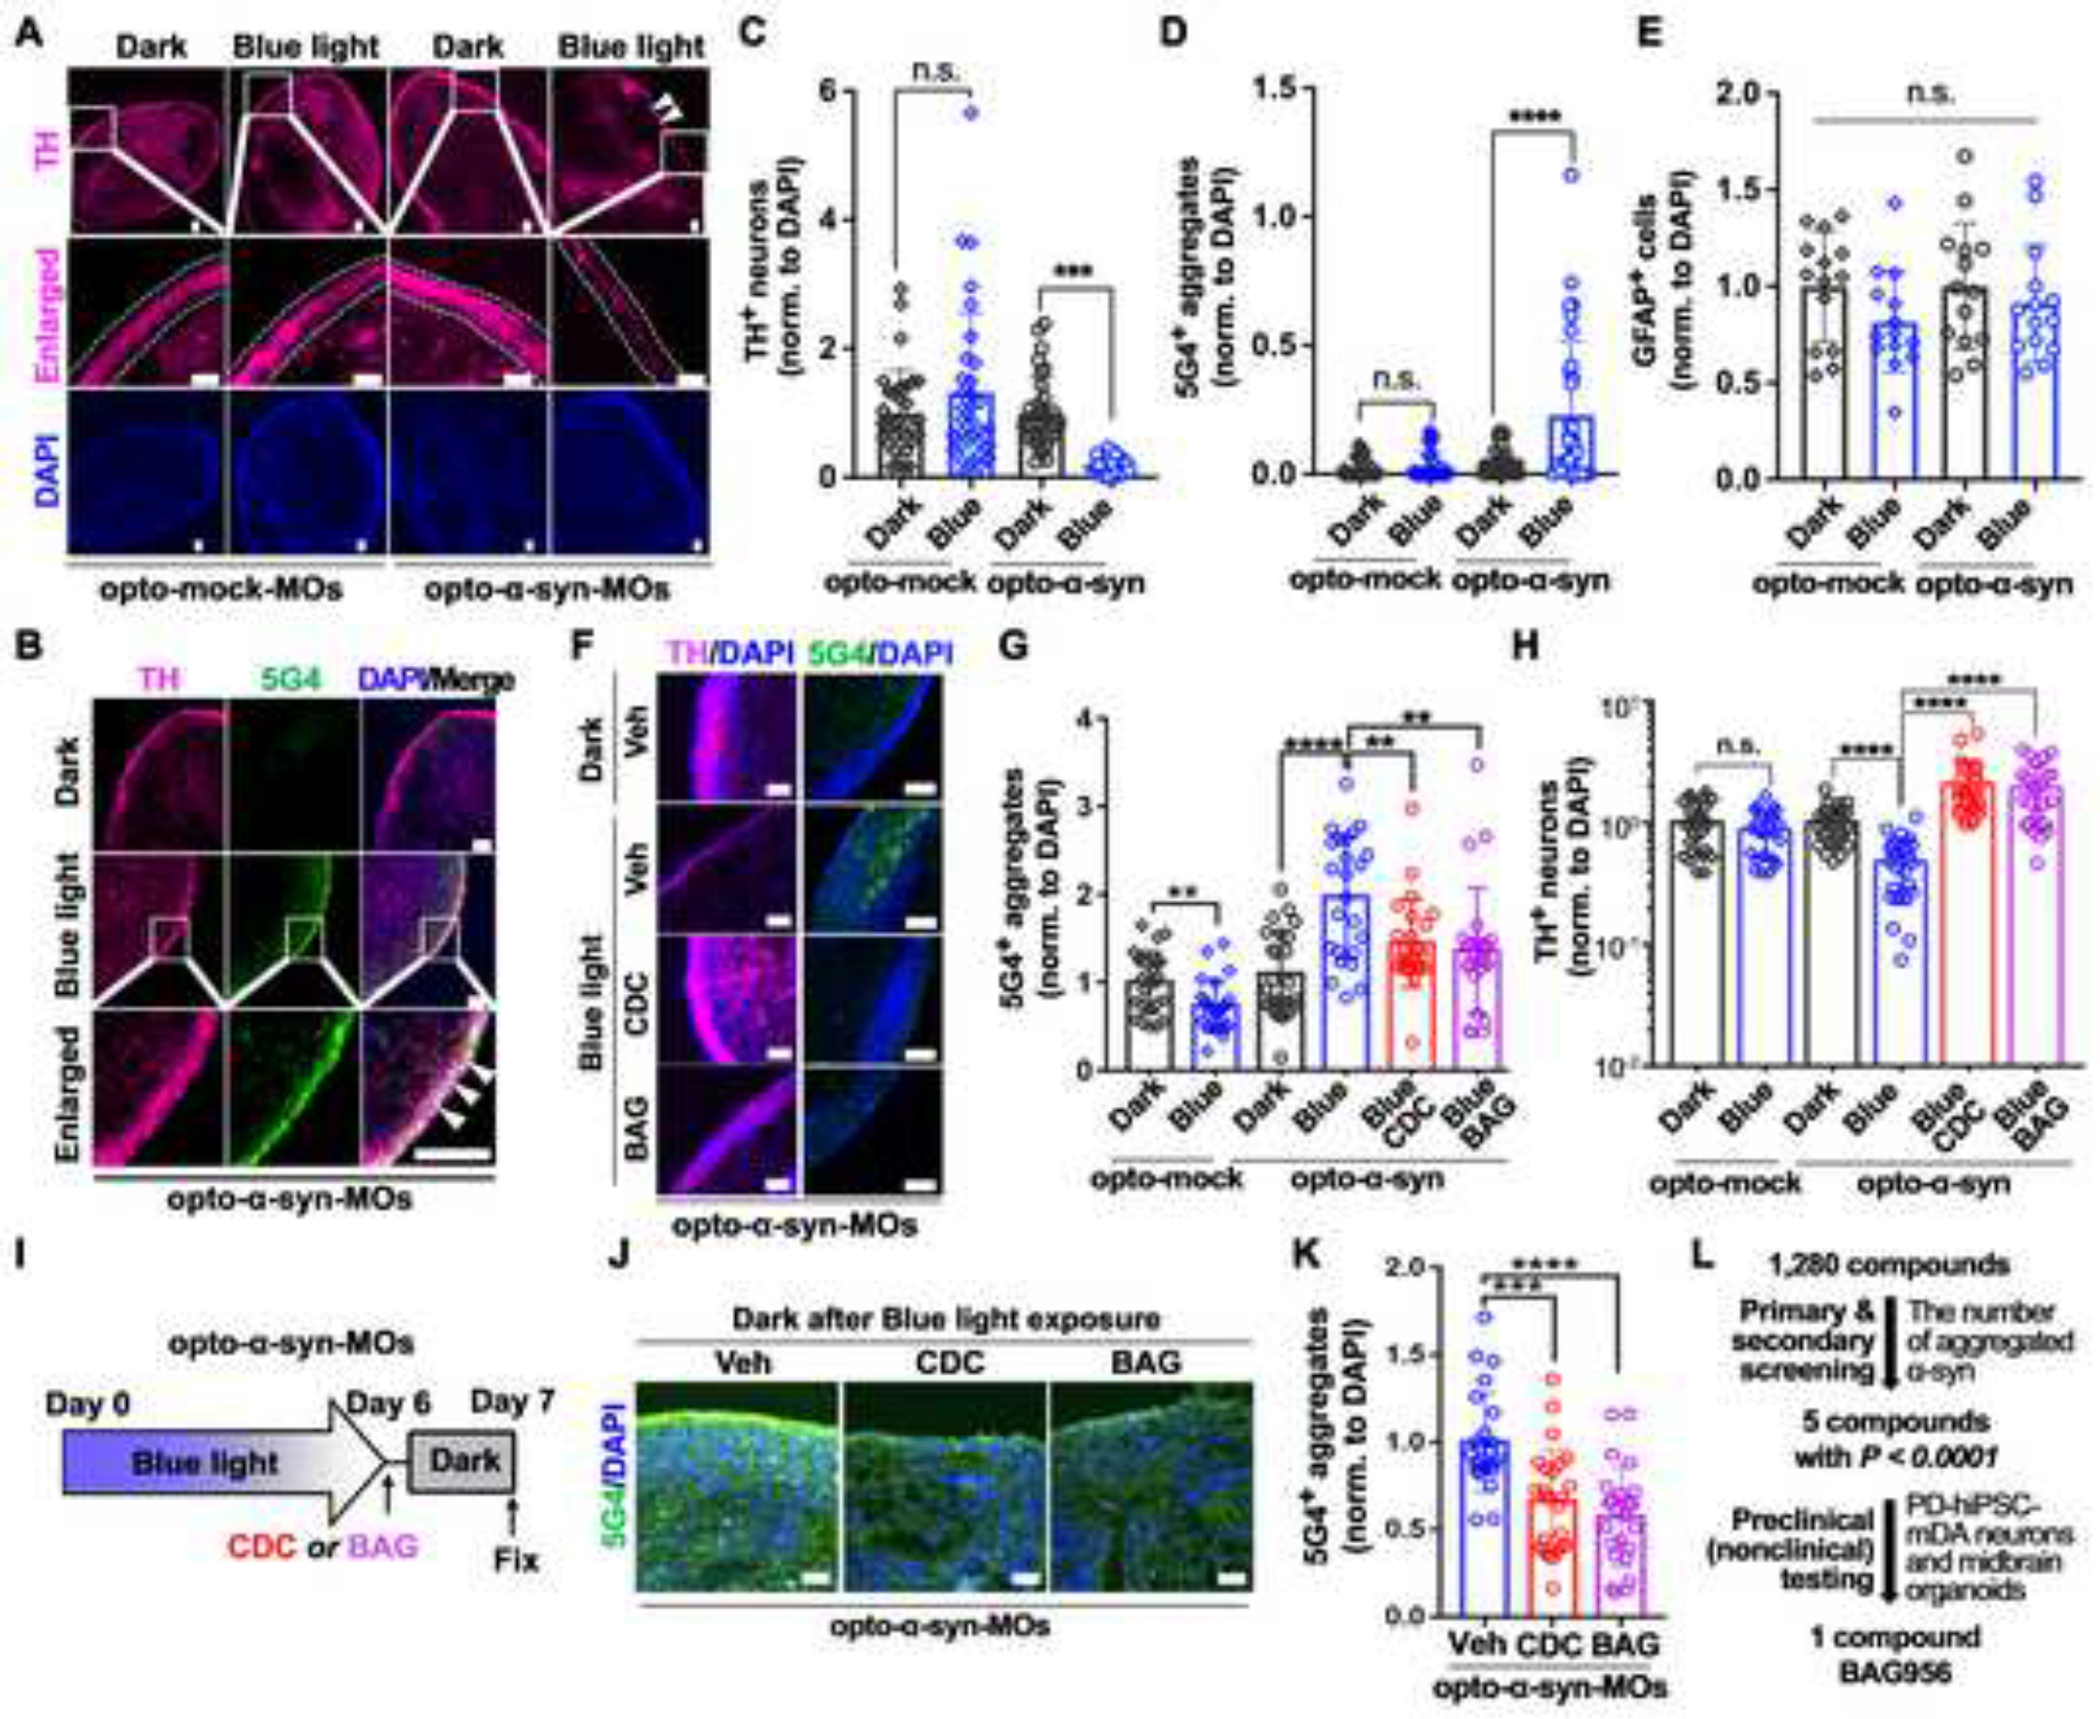
(A) Representative immunostaining images of TH in opto-mock- or opto-α-syn-MOs kept in dark or exposed to blue light. White dotted lines and arrowheads indicate the area containing TH+ mDA neurons and the decreased level of TH+ neurons, respectively.
(B) Representative images of 5G4+ signals in TH+ neurons in opto-α-syn-MOs kept in dark or exposed to blue light. White arrowheads indicate the co-localization between TH+ and 5G4+ signals.
(C) Quantification of TH+ neurons in opto-mock- or opto-α-syn-MOs kept in dark or exposed to blue light (n = 32, total 8 organoids, one-way ANOVA followed by Tukey’s post hoc test).
(D) Quantification of 5G4+ signals in opto-mock- or opto-α-syn-MOs kept in dark or exposed to blue light (n = 32, total 8 organoids, one-way ANOVA followed by Tukey’s post hoc test).
(E) Quantification of GFAP in opto-mock- or opto-α-syn-MOs kept in dark or exposed to blue light. (n = 14, total 8 organoids, one-way ANOVA followed by Tukey’s post hoc test).
(F) Representative immunostaining images of TH and 5G4 in opto-α-syn-MOs kept in dark or exposed to blue light with or without CDC or BAG treatment.
(G) Quantification of 5G4+ α-syn aggregates in opto-mock- or opto-α-syn-MOs (n = 24, total 8 organoids, two-tailed unpaired t-test).
(H) Quantification of TH+ neurons in opto-mock- or opto-α-syn-MOs (n = 24, total 8 organoids, two-tailed unpaired t-test).
(I) Schematic representation of degradation efficiency checking system of blue light-induced opto-α-syn aggregates in MOs. Opto-α-syn-MOs were exposed to blue light for 6 days and then kept in dark with vehicle, CDC, or BAG for 1 day.
(J) Representative images of 5G4+ α-syn aggregates in opto-α-syn-MOs kept in dark for 1 day with vehicle, CDC, or BAG, after blue light illumination for 6 days.
(K) Quantification of 5G4+ signals with or without CDC or BAG in opto-α-syn-MOs (n = 24, total 8 organoids, one-way ANOVA followed by Tukey’s post hoc test).
(L) Schematic summary of OASIS-based compound screening.
Scale bars, 100 μm. Bars represent means ± SEM. n.s., not significant, *P < 0.05, **P < 0.01, ***P < 0.001, ****P < 0.0001. Blue light condition: 34 μW/mm2 at 470 nm, 0.17 Hz, 0.5 s.
Validation of selected compounds BAG and CDC efficacies in α-syn PFF models on mouse primary neurons and human PD hiPSC-derived mDA neurons
Next, we aimed to validate the effects of these two compounds on the OASIS-independent model. We treated α-syn PFF with BAG or CDC for mouse primary neurons or non-OASIS-human PD hiPSC-derived mDA neurons. Treatment with CDC and BAG significantly reduced pathologic α-syn in the Triton X-100 (TX)-insoluble fraction (Figures S4H and S4I); these results were confirmed by immunocytochemistry in mouse primary neurons (Figure S4J). We also confirmed that BAG treatment led to a significant decrease of TX-insoluble pS129-α-syn in human PD hiPSC-derived mDA neurons (Figures S4K and S4L). Collectively, by screening 1,280 compounds and validating the selected 5 compounds on PD iPSC-mDA neurons, we identified one potential compound, BAG, for PD treatment (Figure 4L).
Validation of neuroprotective effect of BAG on α-syn PFF-induced behavioral deficits
To evaluate the neuroprotective potential of BAG, we initially used in vivo α-syn PFF mouse model for a short-term period. Following BAG treatment at 2 mg/kg or 10 mg/kg for two months after one month of intrastriatal PBS or α-syn PFF injection, immunostaining analysis showed that BAG significantly reduced pathological pS129-α-syn immunoreactivity induced by α-syn PFF injection in TH+ neurons of the ventral midbrain (Figure S5A–S5C). Next, we assessed BAG’s long-term efficacy in the α-syn PFF mouse model through comprehensive behavioral and biochemical assays.
Behavioral analysis was conducted to examine the behavioral deficits caused by intrastriatal α-syn PFF injection and any restoration of behavioral dysfunction by oral administration of BAG for 6 months at a low (2 mg/kg) or high (10 mg/kg) concentration after one-month recovery from α-syn PFF injection (Figure 5A). No endpoint body mass differences were observed in all groups (Figure S5D). Intrastriatal α-syn PFF injected model showed significant reduction of fore- and hind-limb grip strength (Figure 5B), and latency to fall from the rotarod test (Figure 5C), but these were dramatically recovered with treatment of BAG at both 2 mg/kg and 10 mg/kg doses. In open field test (OFT) and elevated plus maze (EPM) to evaluate locomotion, exploration, and anxiety behaviors, α-syn PFF injected mice preferred to stay closer to the wall of the designated area (Figures 5D and 5E) or the closed arm of the EPM (Figures 5F and 5G). The time spent, number of entries, and travelled distance in the center zone of the OFT (Figures 5E and S5E) or in the far zone of the open arm of the EPM (Figures 5G and S5F), were significantly reduced in the PFF mouse model. Nonetheless, these behavioral abnormalities were significantly alleviated with BAG treatment at 10 mg/kg. Furthermore, in hippocampal- or amygdala-dependent learning and memory based contextual or cued fear conditioning tests, the α-syn PFF injected mouse model showed dampened freezing phenotypes including total freezing time and freezing episodes (Figures 5H and S5G). However, these phenotypes were recovered by BAG treatment at both 2 mg/kg and 10 mg/kg doses.
Figure 5. Behavioral deficits and PD-like pathologies induced by α-syn PFF injection were recovered by oral administration of BAG 956.
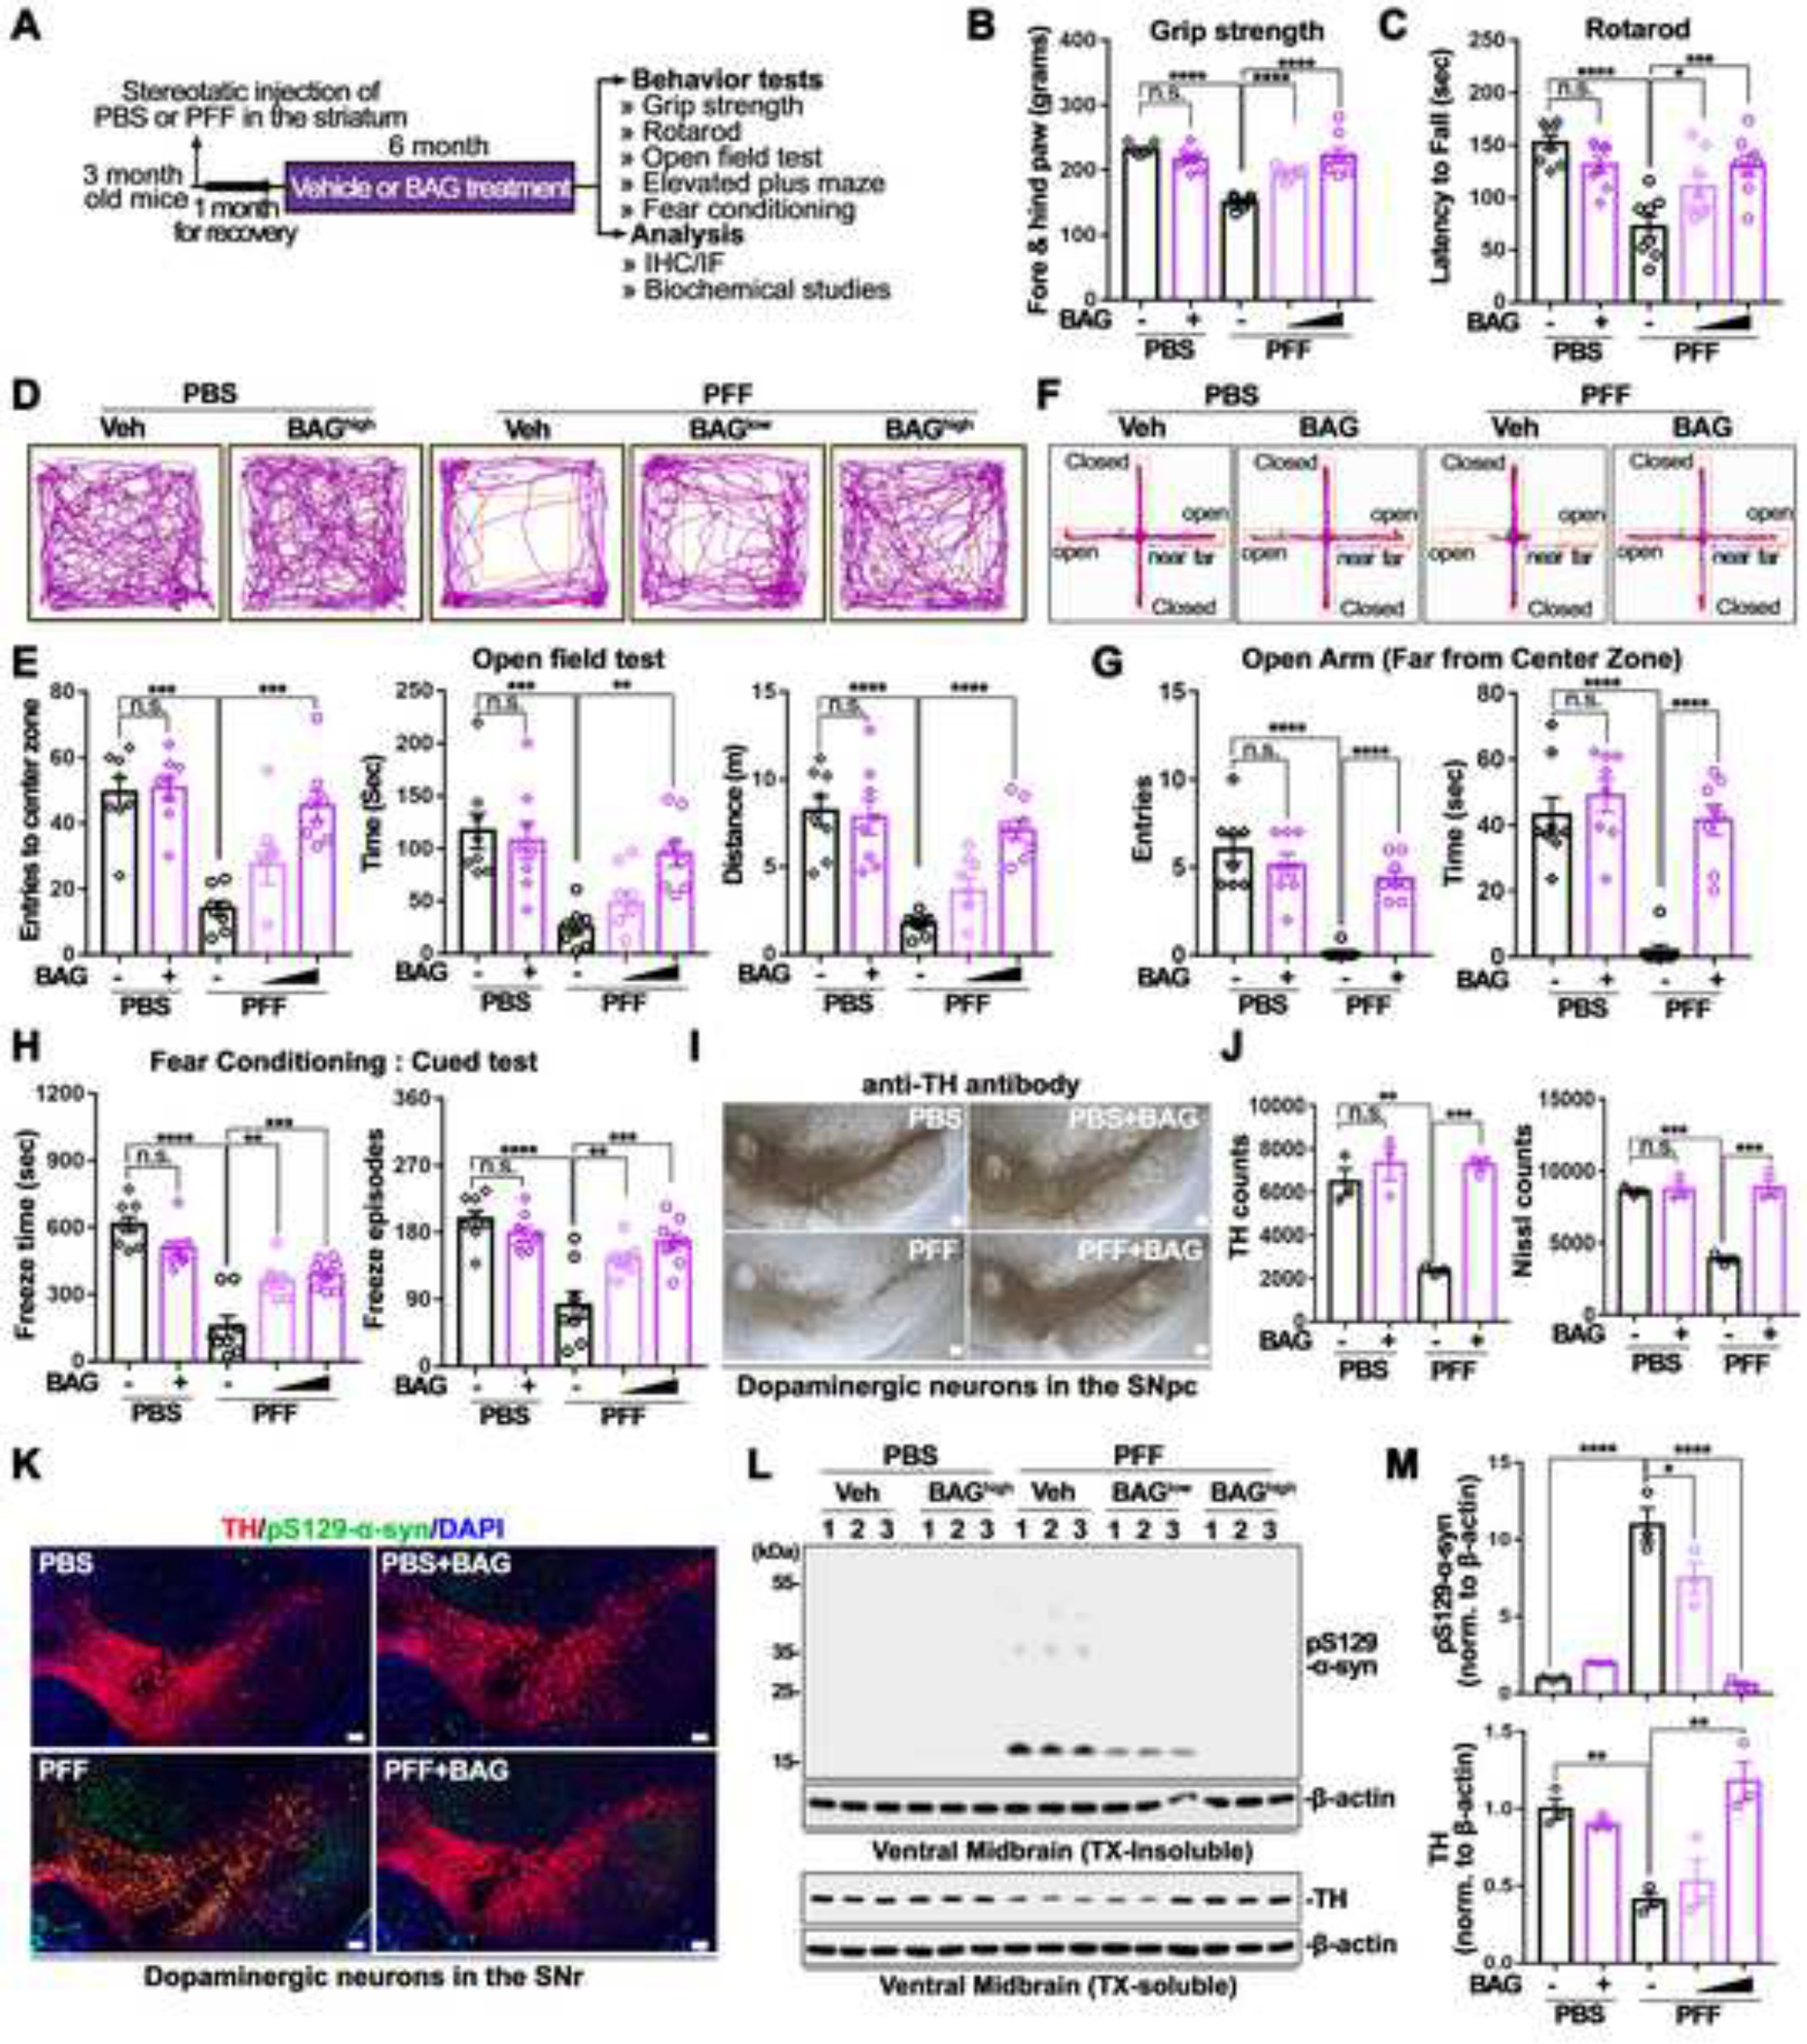
(A) Schematical diagram for behavioral assessment at 7 months after intrastriatal injection of PBS or α-syn PFF (n = 8). PBS injected mice were treated vehicle or BAGhigh (10 mg/kg), whereas α-syn PFF injected mice were orally administered with vehicle, BAGlow (2 mg/kg), or BAGhigh (10 mg/kg).
(B) Fore- and hind-limb grip strength test (n = 8, one-way ANOVA followed by Tukey’s post hoc test).
(C) Latency to fall from the rotarod test (n = 8, one-way ANOVA followed by Tukey’s post hoc test).
(D) Representative showed locomotion and central activity of each group via travelled path in the OFT.
(E) The number of entries (left), time spent (middle), and distance travelled (right) in the center zone of the OFT are shown (n = 8, one-way ANOVA followed by Tukey’s post hoc test).
(F) Representative movement paths of mice from each group in the EPM
(G) The number of entries (left) and time spent (right) in the open area far from center zone are shown (n = 8, one-way ANOVA followed by Tukey’s post hoc test).
(H) Evaluation α-syn PFF induced loss of learning and memory by total freeze time and freezing episode from cued FC (n = 8, one-way ANOVA followed by Tukey’s post hoc test).
(I) Representative photomicrographs from coronal mesencephalon sections including TH+ and Nissl+ neurons in PBS or α-syn PFF with or without BAG.
(J) Quantification of TH+ and Nissl+ neurons in PBS or α-syn PFF with or without BAG (n = 3, one-way ANOVA followed by Tukey’s post hoc test).
(K) Representative fluorescence image of anti-pS129-α-syn immunoreactivities from PBS or α-syn PFF with or without BAG treatment.
(L) Representative immunoblot from insoluble (upper) and soluble (lower) fraction of ventral midbrain regions.
(M) Quantification of pS129-α-syn protein level (upper) and TH level (lower, n = 3, one-way ANOVA followed by Tukey’s post hoc test).
Scale bars, 100 μm. Bars represent means ± SEM. n.s., not significant. *P < 0.05, **P < 0.01, ***P < 0.001, ****P < 0.0001.
Validation of neuroprotective efficacy of BAG on α-Syn PFF-induced PD-like pathologies in vivo
To investigate whether oral administration of BAG could mitigate the loss of DA neurons induced by intrastriatal α-syn PFF injection, the number of TH+ neurons in the substantia nigra pars compacta (SNpc) was measured via an unbiased stereological counting analysis56. Representative TH immune-stained images of the SNr (Figure 5I) and quantification of the number of TH+ and Nissl+ stained DA neurons (Figure 5J) revealed a significant loss of DA neurons in α-syn PFF injected mice, which was recovered by treatment with BAG at 10 mg/kg. Notably, α-syn PFF injection significantly reduced striatal TH+ fiber density, as assessed by IHC, which was rescued by treatment with BAG at 10 mg/kg (Figure S5H). Pathological pSer129-α-syn immunoreactivity was elevated in TH+ neurons of the SN of α-syn PFF injected mice, as evaluated by IHC. Consistently, this increase was significantly rescued by treatment with BAG at 10 mg/kg (Figure 5K). Similar results were observed in WB analysis with TX-insoluble fractions from the ventral midbrains (Figure 5L). α-syn PFF injection increased the levels of pS129-α-syn in the TX-insoluble fraction, which was significantly reduced by BAG treatment at both 2 mg/kg and 10 mg/kg doses (Figures 5L and 5M, upper panels in M). In addition, α-syn PFF injection decreased the protein levels of TH in both the ventral midbrain and striatum, which were rescued by BAG treatment at 10 mg/kg (Figures 5L, 5M, lower panels in M, and S5I).
Autophagy-enhancing potential of BAG 956 on neuroprotective effects against α-syn pathology
Previous studies demonstrated that α-syn was degraded by autophagy, and autophagic defects exacerbate α-syn-mediated PD pathology57,58. Since autophagy can be activated by inhibiting the PI3K or the PDK1 pathway59,60, we investigated whether treatment with BAG can induce the autophagic flux to decrease α-syn aggregates in opto-α-syn mDA neurons and MOs. Interestingly, only BAG treatment increased and decreased the levels of autophagic marker LC-3II and autophagy flux protein p62, respectively, compared to control or CDC treatment in α-syn PFF-treated opto-α-syn-mDA neurons (Figures 6A–6C). Additionally, BAG treatment increased the level of LC-3II in blue light-illuminated opto-α-syn-mDA neurons (Figures S6A and S6B), and this observation was consistent with the treatment of BYL719 (BYL, alpelisib) or BAY 80–6946 (BAY, copanlisib); both of which are pan-PI3K inhibitors approved by FDA (Figure S6C). We further confirmed that BAG treatment increased the number of LC3+ puncta as well as LC3+/5G4+ co-localized vesicles in PD iPSC-mDA neurons with blue light (Figures S6D–S6F). These results were consistent when BAG was only treatment during the dark condition after blue light illumination for six days in opto-α-syn-MOs (Figures 6D, 6E and S6G), suggesting that autophagy is involved in BAG-mediated degradation of opto-α-syn aggregates. Moreover, co-treatment of BAG with the autophagy inhibitor, bafilomycin A1, reversed the reduction of 5G4+ α-syn aggregates and the level of TH+ mDA neurons in blue light-illuminated opto-α-syn mDA neurons (Figures 6F–6H), suggesting that autophagic degradation is crucial for the BAG-mediated neuroprotective effects against α-syn pathology.
Figure 6. Induction of autophagy-mediated clearance of α-syn-aggregates through inhibition of PI3K-PDK1/AKT/mTOR pathway by BAG 956 treatment.
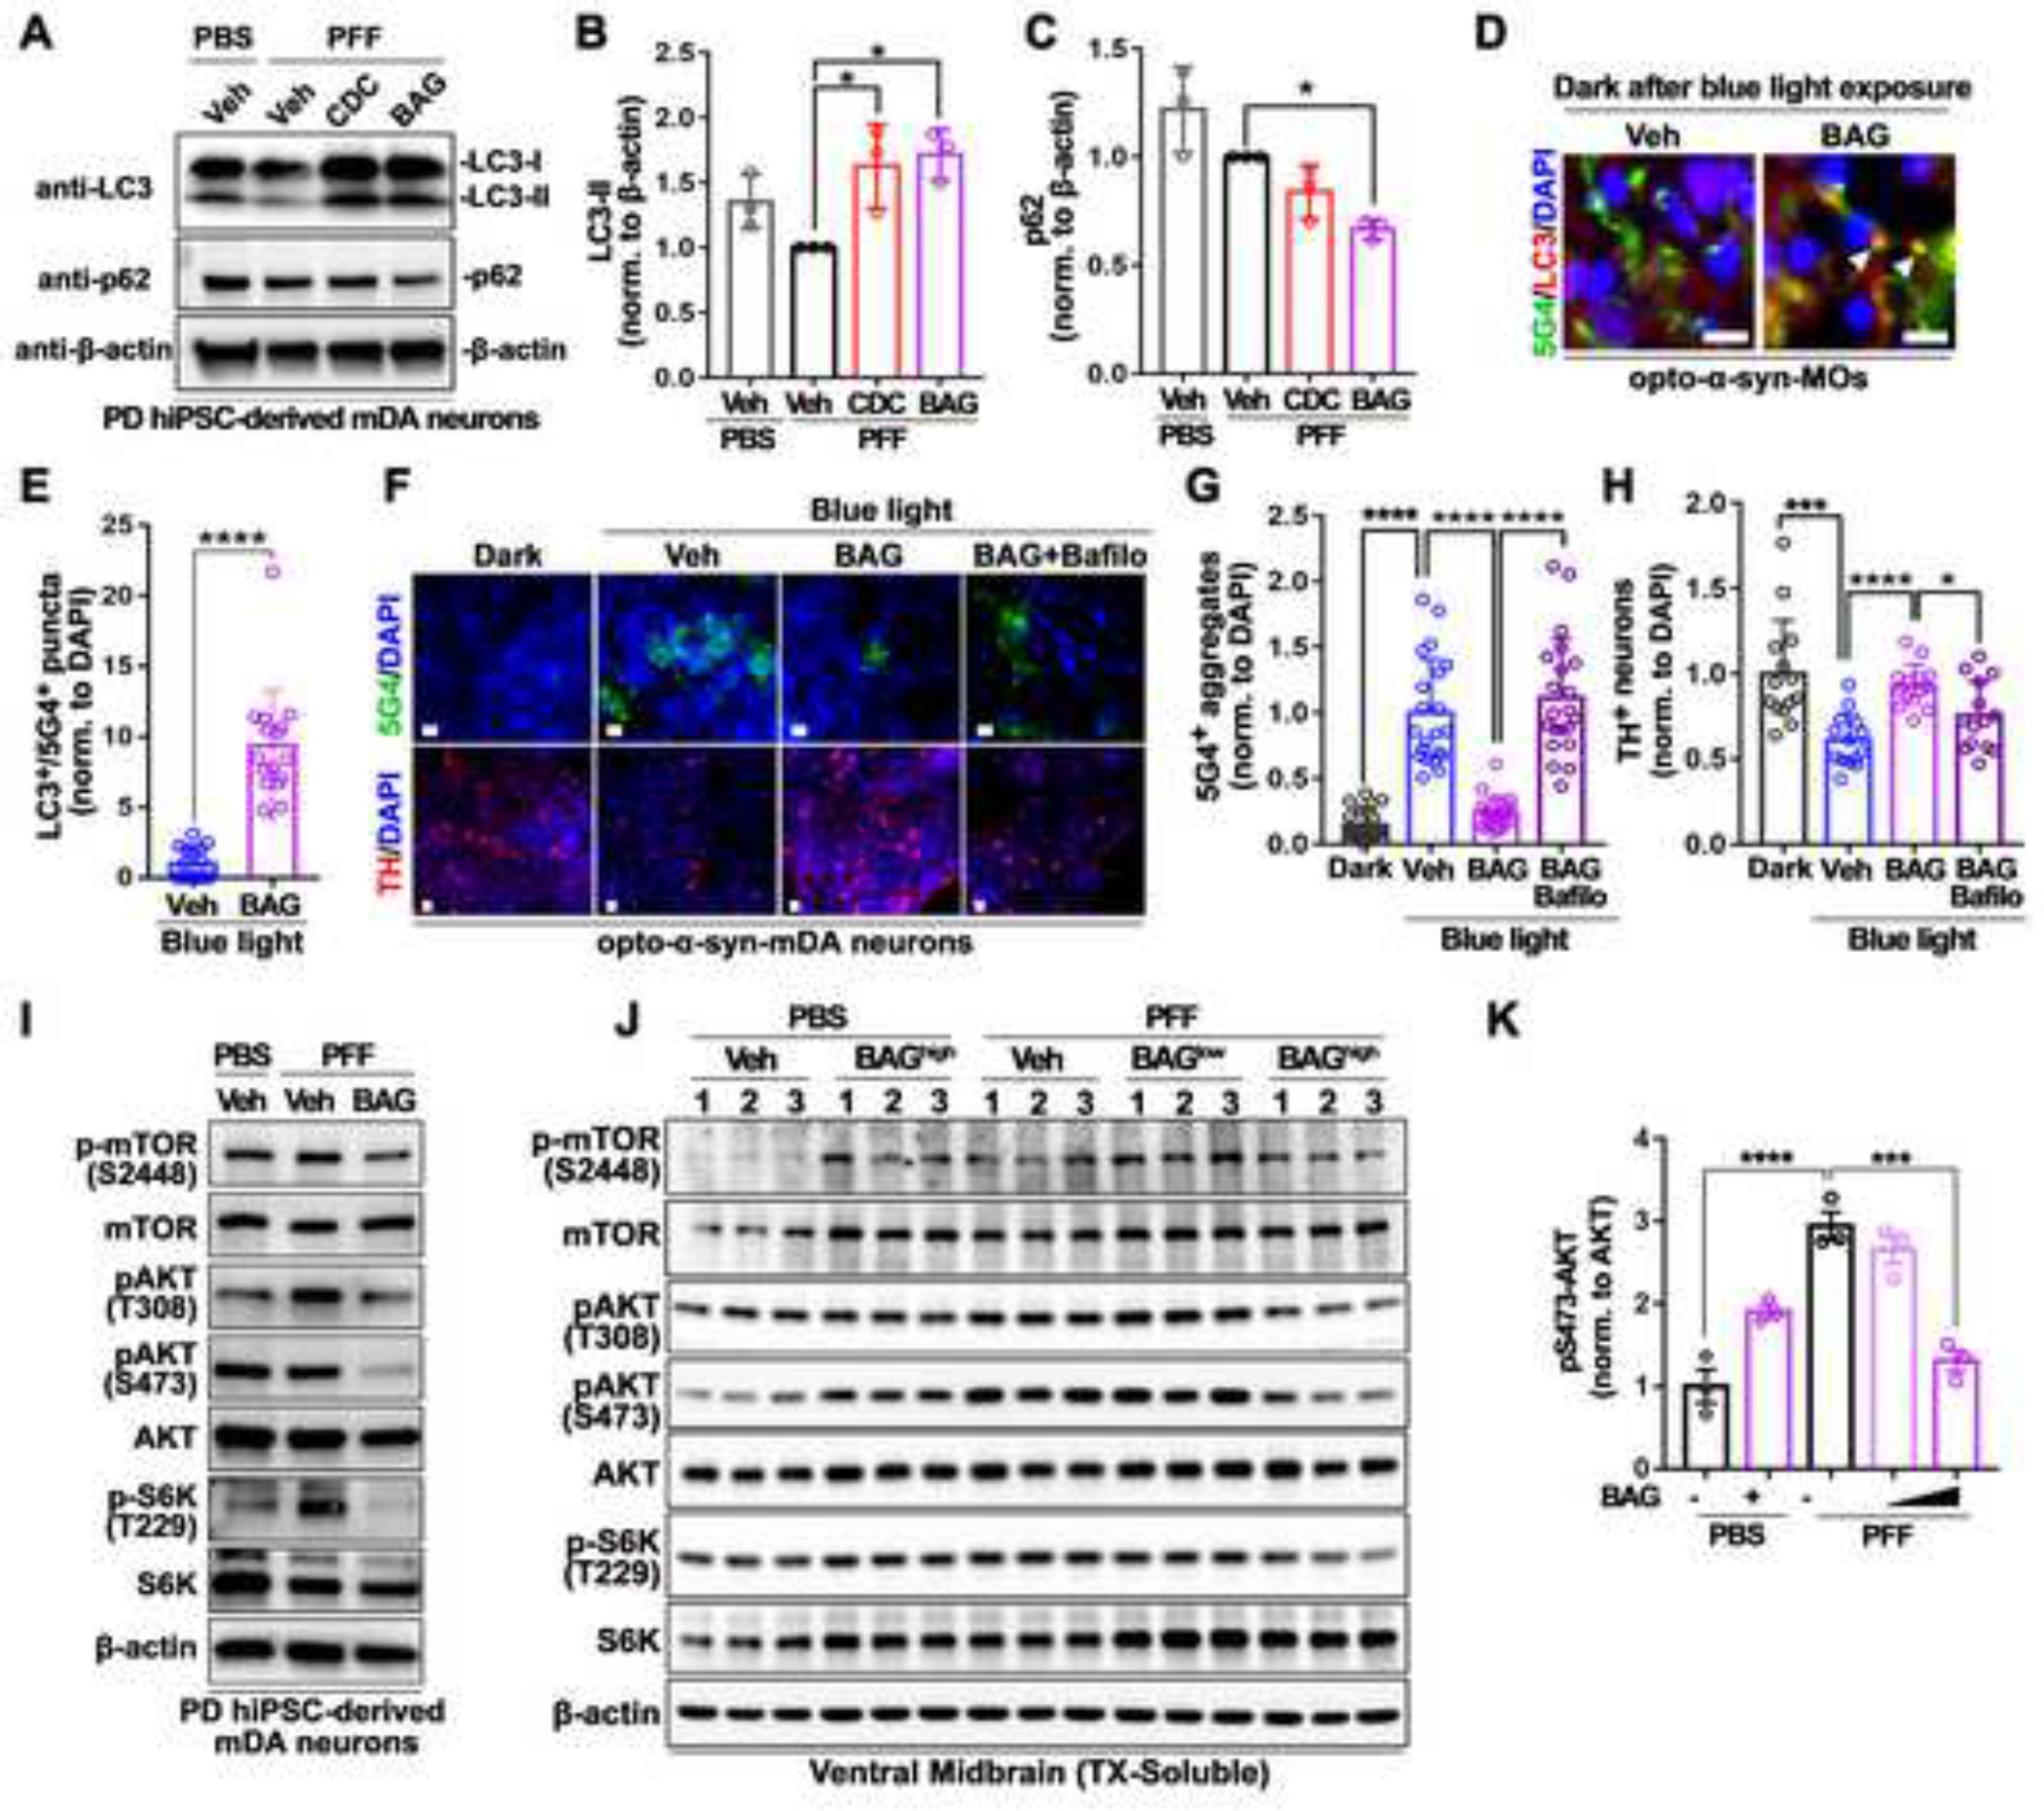
(A) Representative western blot images in PD hiPSC-derived mDA neurons treated with PBS or α-syn PFF with vehicle, BAG, or CDC.
(B) Quantification of LC3-II in PD hiPSC-derived mDA neurons treated with PBS or α-syn PFF with vehicle, BAG, or CDC (n = 3, one-way ANOVA followed by Tukey’s post hoc test).
(C) Quantification of p62 in PD hiPSC-derived mDA neurons treated with PBS or α-syn PFF with vehicle, BAG, or CDC (n = 3, one-way ANOVA followed by Tukey’s post hoc test).
(D) Representative immunostaining images of LC3+/5G4+ co-localized dots (white arrowheads) in opto-α-syn-MOs kept in dark after blue light illumination (6 days). Scale bars, 100 μm.
(E) Quantification of LC3+/5G4+ co-localization in opto-α-syn-MOs kept in dark after blue light illumination (n = 16, total 8 organoids, two-tailed unpaired t-test).
(F) Representative immunostaining images of 5G4+ α-syn aggregates and TH+ neurons in opto-α-syn-mDA neurons with vehicle, BAG, or BAG and Bafilomycin A1 (Bafilo). Scale bars, 10 μm.
(G) Quantification of 5G4+ α-syn aggregates in opto-α-syn-mDA neurons (n = 21, two-tailed unpaired t-test).
(H) Quantification of TH+ neurons in opto-α-syn-mDA neurons (n = 14, two-tailed unpaired t-test).
(I) Representative western blot images of PI3K/PDK1 downstream targets in PD hiPSC-derived mDA neurons with PBS or α-syn PFF with vehicle or BAG.
(J) Representative western blot images of PI3K/PDK1 downstream targets in mouse ventral midbrain with PBS or α-syn PFF with vehicle or BAG.
(K) Quantification of pS473-AKT normalized to pan-AKT (n = 3, one-way ANOVA followed by Tukey’s post hoc test)
Bars represent means ± SEM. n.s., not significant. *P < 0.05, **P < 0.01, ***P < 0.001, ****P < 0.0001. Blue light condition: 34 μW/mm2 at 470 nm, 0.17 Hz, 0.5 s, for 7 days.
We further investigated the effects of BAG on PFF models, as the PI3K-PDK1/AKT/mTOR signaling pathway has a critical role in autophagy regulation. Our findings indicated that BAG treatment significantly reduced the phosphorylation of PDK1 downstream targets, including PI3K, AKT, S6K, and mTOR, in α-syn PFF-treated PD hiPSC-derived dopaminergic neurons (Figure 6I) and mouse primary neurons (Figure S6H), as well as in α-syn PFF-injected mice (Figures 6J and S6I). Importantly, α-syn PFF injection significantly increased pS473-AKT, which was reduced by BAG treatment in α-syn PFF injected mice (Figure 6K). Consequently, our findings suggest that BAG may function as an autophagy-enhancing drug by inhibiting the PI3K-PDK1/AKT/mTOR signaling pathway (Figure S6J).
Discussion
It is widely accepted that pathologic α-syn aggregates are crucial for understanding the molecular and cellular mechanisms of PD, as well as for identifying therapeutic targets15,26,61–67. However, no sophisticated model currently exists to induce α-syn aggregation intracellularly in human neurons. In this study, we developed an optically controllable α-syn aggregation inducing system in various human neuronal cells, including SH-SY5Y cells, PD hiPSC-derived mDA neurons, and mDA organoids. Importantly, OASIS generated light-induced α-syn aggregates stained with various pathological markers for PD. Furthermore, our model demonstrated that α-syn aggregates were transmitted to adjacent neurons, an important feature for α-syn aggregation and disease progression. OASIS has a considerably shortened time for the pathological aggregate formation (hours to days), which enabled us to develop an OASIS-based HCI screening assay.
The OASIS-based HCI screening of the 1,280 compounds identified two potential neuroprotective compounds, CDC and BAG. In particular, BAG successfully rescued the α-syn pathology induced by α-syn PFF (an OASIS-independent PD model), which has been extensively used to study α-syn pathology and PD in vitro and in vivo. Importantly, we validated the efficacy of BAG on α-syn PFF-induced PD-like symptoms in an in vivo mouse model by a wide range of pathological, behavioral, and biochemical studies suggesting BAG could be a potent candidate for alleviating PD symptoms. Furthermore, we found that BAG activated autophagic flux by inhibiting the PI3K-PDK1/AKT/mTOR signaling pathway, inducing the clearance of α-syn aggregates. BAG, a dual PI3K-PDK1 inhibitor, acts by blocking the PDK1-mediated activation of AKT, subsequently inhibiting mTOR signaling pathway, and promoting autophagy68,69. This mechanism of action not only targets the formation of α-syn aggregates but also contributes to their clearance, potentially slowing the progression of PD. Interestingly, pS473-AKT, which is the target of mTOR complex 2 (mTORC2)70,71, was the most effective target following BAG treatment. This finding suggests that BAG may enhance autophagy by regulating both mTORC1 and mTORC2-dependent mechanisms. Originally, BAG was reported as an anticancer agent due to its inhibitory effects on PI3K and PDK1 signaling pathways, which are known to be involved in cell proliferation and survival72,73. Our study expands upon BAG’s known anticancer properties by demonstrating its potential neuroprotective effects in PD, emphasizing its ability to promote autophagy and clearance of α-syn aggregates through inhibiting both mTORC1 and mTORC2. Further research is needed to confirm the benefits of selectively targeting mTORC2 and optimize the therapeutic approach.
Although our current study focuses only on the α-syn aggregation in PD, most neurodegenerative diseases are pathophysiologically associated with protein aggregation: Aβ and tau in AD, α-syn in PD and dementia with LBs, huntingtin in Huntington’s disease, ataxins in polyglutamine diseases, prions in prion diseases, SOD1 and TDP43 in amyotrophic lateral sclerosis and frontotemporal lobar degeneration (FLD), and tau in frontotemporal dementia and FLD. The processes of protein aggregation in each neurodegenerative disease are exceedingly complex and occur over a considerable amount of time, and thus, revealing both the mechanisms of formation and the pathophysiological effects of protein aggregation are challenging due to a lack of proper model systems. Accordingly, our opto-aggregation system can be applied to various other diseases with pathogenic protein aggregations. In summary, our OASIS provides a highly efficient and rapid humanized neuron and organoid model for identifying novel compounds rescuing α-synucleinopathy-related phenotypes in PD.
With the recent passage of the FDA Modernization Act 2.07,8, there is growing interest in adopting non-animal testing methods for compound discovery, particularly using New Approach Methodologies (NAMs) such as microphysiological systems (MPS) and organ-on-a-chip (OOC) technologies. Our OASIS model, which enables rapid induction of α-syn aggregation and relevant mDA neuron pathology in human neurons and organoids, presents an advanced and suitable alternative to traditional animal models as a preclinical (nonclinical) test for studying PD and identifying potential therapeutic compounds. The implementation of our model aligns with the objectives of the FDA Modernization Act 2.0, promoting the use of human-relevant in vitro models for increased efficiency and accuracy in preclinical drug discovery while minimizing reliance on animal testing.
Limitations of Study
In this study, we demonstrated the potential of BAG as a neuroprotective compound for PD via decreasing the levels of α-synuclein aggregates. However, it is important to note that further studies with multiple cell lines will be warranted to confirm its efficacy in much diverse genetic backgrounds. Additionally, our study employed a range of experimental techniques to assess the effects of BAG, such as immunohistochemistry and western blot analysis, but extensive techniques like transcriptomics and proteomics could provide a more comprehensive understanding of the molecular mechanisms underlying its neuroprotective effects. Furthermore, although CDC and BAG were identified as potential neuroprotective molecules, it is possible that other compounds with similar or even better efficacy may exist with much higher success in future clinical trials. Lastly, while our study focused exclusively on the effects of BAG on α-synuclein aggregation in PD, it is important to consider whether BAG could be effective in treating other neurodegenerative diseases associated with protein aggregation, for example other synucleinopathies, tauopathies, etc.
RESOURCE AVAILABILITY
Lead Contact
Further information and requests for resources and reagents should be directed to the Lead Contact, Gabsang Lee (glee48@jhmi.edu).
Materials Availability
Cell lines and plasmids generated in this study are available upon reasonable request from the Lead Contact.
Data and code availability
All data reported in this paper will be shared by the lead contact upon request.
This paper does not report original code.
Any additional information required to reanalyze the data reported in this paper is available from the lead contact upon request.
EXPERIMENTAL MODEL AND SUBJECT DETAILS
Cell lines
SNCA triplication PD hiPSCs (ND27760–8; 46XX)18, opto-mock (AAVS1::opto-mock) or opto-α-syn (AAVS1::opto-α-syn) PD hiPSCs, and healthy SNCA KO hiPSCs (SC1015–1; 46XX)74 on mitotically inactivated mouse embryonic fibroblasts (MEFs, Global Stem or Applied Stem Cell), in hESC medium containing DMEM/F-12, 20% knockout serum replacement (KSR), 0.1 mM MEM-NEAA, 2 mM L-glutamine, 55 μM β-mercaptoethanol (all from Life Technologies) and 10 ng/mL FGF2 (R&D Systems) as used routinely for iPSC cultures. SH-SY5Y cells were grown in culture medium containing DMEM/F-12, 15% heat-inactivated FBS, 2 mM L-glutamine, and 1% penicillin/streptomycin (all from Life Technologies). All cells were maintained at 37 °C and 5% CO2 in a humidified incubator. All cell lines are cultured at 37°C with 5% CO2 and routinely tested for mycoplasma.
Generation of knock-in hiPSC lines by using homologous recombination
The feeder-free SNCA triplication PD hiPSCs (ND27760–8)18 were dissociated into single cells using Accutase (Innovative Cell Technologies), and 2 × 10⁶ cells were resuspended in nucleofection solution V (Lonza) with 10 μg hCas9/gRNA and 10 μg donor plasmids for AAVS1::opto-α-syn (see Plasmid construction and transfection). Nucleofection was performed with Nucleofector™ II according to the manufacturer’s instruction (using the B-16 program, Lonza). The nucleofected cell suspension was subsequently plated on puromycin-resistant MEFs (DR4, Global Stem) in hESC medium with 10 μM Y-27632. Four days after nucleofection, the cells that had undergone homologous recombination were selected by adding 0.5 μg/ml of puromycin to hESC medium for four days.
Generation of SNCA knock-out hiPSC line
Healthy hiPSCs (SC1015–1)74, which are for the age-matched control of SNCA triplication PD hiPSCs (ND27760–8)18, were dissociated into single cells using Accutase (Innovative Cell Technologies), and 2 × 10⁶ cells were resuspended in nucleofection solution V (Lonza) with 20 μg PX458-SNCA plasmid (see Plasmid construction and transfection). Nucleofection was performed with Nucleofector™ II according to the manufacturer’s instruction (using the B-16 program, Lonza). Forty-eight hours later after nucleofection, the eGFP-expressing cells were sorted with FACS and plated in low density (50–150 cells per cm2) on mouse embryonic fibroblasts (MEFs; ASF-1213, Applied Stem Cell). The colonies were picked 10–14 days later and were passaged twice before genomic DNA isolation. Genomic DNA for each hiPSC colony was extracted using the QuickExtract DNA Extraction Solution (QE09050, Epicentre) following the manufacturer’s protocol. The SNCA genomic region surrounding the gRNA-binding site was PCR amplified (forward primer, 5’-GAGTCTCACACTTTGGAGGG-3’; reverse primer, 5’-CACATACCTCTGACTCAGTCC-3’), and the PCR products were purified using QIAquick Gel extraction kit (28706, Qiagen) following the manufacturer’s protocol. The purified PCR products were subjected to Sanger sequencing (JHU Synthesis & Sequencing Facility). The clones with biallelic nonsense mutations were expanded and differentiated for subsequent experiments.
mDA neuronal differentiation
We used previously described methods of mDA neuron induction20 and neural progenitor cell expansion19. Briefly, dissociated hiPSCs were plated on Geltrex at a density of 50,000 cells/cm2 in MEF-conditioned KSR medium containing DMEM/F-12, 20% KSR, 0.1 mM MEM-NEAA, 2 mM L-glutamine, and 55 μM β-mercaptoethanol with 10 ng/mL FGF2 and 10 μM ROCK-inhibitor (Y-27632, Cayman Chemical). After confluency of the cells reached 80%–90%, differentiation was initiated by switching to KSR medium supplemented with 100 nM LDN193189 (STEMCELL Technologies) and 10 μM SB431542 (Cayman Chemical). Supplements of 100 ng/mL Shh (C25II, R&D), 2 μM Purmorphamine (PMP, Cayman Chemical) and 100 ng/mL FGF8 (PeproTech) were added on days from 1 to 7, and 3 mM CHIR99021 (CHIR, Tocris) was added at day 3 to day 11. Beginning on day 5, the KSR medium was gradually replaced with increasing amounts of N2 medium (25% increments every other day). To expand neural progenitors, the cells were split on Geltrex and maintained in medium containing DMEM/F-12, N-2 supplement (Life Technologies), 2 mM L-glutamine, 1% penicillin/streptomycin, 100 nM LDN193189, 3 μM CHIR and 10 μM Y-27632 on day 11. After that, the cells were re-plated on dishes pre-coated with Geltrex in NB/B-27 medium supplemented with 3 μM CHIR, 20 ng/mL BDNF, 0.2 mM ascorbic acid, 20 ng/mL GDNF, 1 ng/mL TGFβ3, 0.5 mM dbcAMP and 10 μM DAPT for at least 10 days to complete differentiation.
Generation of midbrain organoids
Midbrain organoids (MOs) were generated from PD hiPSCs as previously described52. Briefly, hiPSCs were dissociated into single cells using TrypLE™ (Gibco), and 1.0 × 10⁵ single cell–dissociated hiPSCs were replated per well in ultra low–attachment U-bottom 96-well plates (Corning) for the generation of uniform EBs using embryoid body forming medium (EBM), consisting of DMEM/F12 (Corning) supplemented with 20% KSR (Gibco), 1% penicillin/streptomycin (Gibco), GlutaMAX™ (Gibco), NEAA (Gibco), 55 μM ß-mercaptoethanol (Gibco), 1 μg/mL of heparin (Sigma-Aldrich), 3% fetal bovine serum (FBS) (Seradigm), 4 ng/mL of bFGF (PeproTech), and 50 μM Y27632 (Calbiochem). At 24 h after plating, the medium was changed to brain organoid generation medium (BGM) containing of 1:1 mix of DMEM/F12 and neurobasal medium (Gibco) supplemented with 1× N2 supplement (Gibco), 1× B27 without vitamin A (Gibco), 1% penicillin/streptomycin, 1% GlutaMAX™, 1% NEAA, 55 μM ß-mercaptoethanol, 1 μg/mL heparin, 2 μM dorsomorphin (Sigma-Aldrich), 2 μM A83–01 (PeproTech), 1 μM IWP2 (Biogems), and 3 μM CHIR99021 (Tocris). On day 4, 100 ng/mL FGF8 (PeproTech) and 2 μM SAG (PeproTech) were added to induce specification into the mesencephalic floor plate. After 3 days, MOs were embedded into growth factor–reduced Geltrex (Thermo fisher scientific) droplets. Geltrex-embedded MOs were transferred onto 6-cm petri dishes containing BGM supplemented with 100 ng/mL of FGF8, 2 μM SAG, 200 ng/mL laminin (BD science), and 2.5 μg/mL insulin for facilitating basal-apical lamination. After 2 days, MOs were transferred into ultra low–attachment 6-well plates (Corning) containing brain organoid maturation medium (BMM), consisting of 1:1 mix of DMEM/F12 and neurobasal medium supplemented with 1× N2 supplement, 1× B27, 1% penicillin/streptomycin, 1% GlutaMAX™, 1% NEAA, 55 μM ß-mercaptoethanol, 1 μg/mL heparin, 10 ng/mL BDNF (PeproTech), 10 ng/mL GDNF (PeproTech), 200 μM ascorbic acid (Sigma-Aldrich), and 125 μM cAMP (PeproTech). From this maturation step, MOs were cultured on an orbital shaker. BMM was replaced every other day. After 3 months of maturation, organoids were fixed with 3.7% paraformaldehyde and cryosectioned for immunostaining.
Generation of knock-in SH-SY5Y cell lines by using homologous recombination
After SH-SY5Y cells reached 90% confluence in 10 cm dishes, they were transfected with 5 μg hCas9/gRNA and 15 μg donor plasmids for AAVS1::opto-α-syn or AAVS1::opto-mock (see Plasmid construction and transfection) using Lipofectamine® LTX and Plus™ Reagent according to the manufacturer’s instructions. Two days after the transfection, the cells were re-plated into 10 cm dishes, and then the cells that had undergone homologous recombination were selected with the 2 μg/mL puromycin-containing culture media for a week. Surviving cells were cultured for another 8 weeks to form single colonies.
SH-SY5Y cell neuronal differentiation
For the neuronal differentiation, we followed a previously described protocol75. Briefly, undifferentiated SH-SY5Y cells were plated on uncoated dishes in reduced-serum (2.5% or 1%) culture media supplemented with 10 μM RA (Sigma-Aldrich) and media was changed on every other day until day 10. Then cells were split to Geltrex (Life Technologies)-coated dishes in Neurobasal medium (Life Technologies) supplemented with 10 μM RA, 2 mM L-glutamine, 1% penicillin/streptomycin, 1X B-27 (Life Technologies), 2 mM dbcAMP (Sigma-Aldrich) and 50 ng/mL BDNF (PeproTech). The cells were terminally differentiated into neurons at day 18.
Primary cortical neuron culture
Cortical neurons were prepared from embryonic day 15.5 of pregnant CD-1 mice (Charles River, Wilmington, MA). Dissected neurons were plated onto dishes pre-coated with PLL (Sigma-Aldrich) in Borate buffer (50 mM Boric acid in ddH2O, pH 8.5). The culture medium consists of Neurobasal media (Invitrogen), containing B27 supplement, 1× GlutaMAX and 1× penicillin/streptomycin (Gibco). All procedures involving mice were approved by and conformed to the guidelines of the Johns Hopkins University Animal Care and Use Committee.
Animals
C57BL/6 mice were obtained from the Jackson Laboratory (ME, USA). All procedures involving animals were approved by and conformed to the guidelines of the Institutional Animal Care Committee of Johns Hopkins University (Protocol Number MO20M52). Mice were housed 5 per cage in a 12 h light/dark cycle with free access to water and food. All mice were acclimatized in the procedure room before starting any animal experiments. We have taken great measures to reduce the number of animals used in these studies, and all efforts were made to reduce animals suffering from pain and discomfort.
Method Details
Plasmid construction and transfection
Cry2PHR coding sequence from pmCitrine-opto-FGFR176 (gift from Won Do Heo) was subcloned into pHM6-HA-α-syn (Addgene plasmid #40824, a gift from David Rubinsztein) to generate either pHM6-HA-α-syn-Cry2PHR (pHM6-opto-α-syn) or pHM6-HA-Cry2PHR (pHM6-opto-mock). Cry2clust coding sequence is from mCherry-CRY2clust (Addgene plasmid #105624). α-syn-mCherry-Cry2clust or mCherry-Cry2clust, and NURR1 homology arms sequences with 2A-H2B-eGFP gene cassette (for NURR1::GFP donor vector) were synthesized by GenScript (Piscataway, NJ, USA). The dsDNA donor vectors for homologous recombination at the AAVS1 locus are designed to have either SA-2A-PuroR-CAG-HA-α-syn-PHR (for AAVS1::HA-opto-α-syn), SA-2A-PuroR-CAG-HA-PHR (for AAVS1::HA-opto-mock), SA-2A-PuroR-CAG-α-syn-mCherry-Cry2clust (for AAVS1::opto-α-syn) or SA-2A-PuroR-CAG-mCherry-Cry2clust (for AAVS1::opto-mock) gene cassettes between both homology arms, using AAV-CAGGS-EGFP (for AAVS1::eGFP; Addgene plasmid #22212, a gift from Rudolf Jaenisch) as a backbone. Each homology arm has 804 bp (AAVS1 left arm) or 837 bp (AAVS1 right arm) sequences in the first intron of PPP1R12C. A gRNA target sequence for AAVS1 was chosen to have the same sequence as that of gRNA_AAVS1-T1 (Addgene plasmid #41817, a gift from George Church) and subcloned into PX458 (hCas9/gRNA, Addgene plasmid #48138, a gift from Feng Zhang). The oligonucleotides for the PX458-AAVS1 construct were as follows: forward 5’-CACCGTCCCCTCCACCCCACAGTG-3’ and reverse 5’-AAACCACTGTGGGGTGGAGGGGAC-3’. A gRNA target sequence for SNCA was chosen to avoid off-targeting and locate in the downstream of start codon of SNCA gene using CRISPR Design Tool (http://crispr.mit.edu/), and subcloned into gRNA and hCas9–2A-eGFP expression vector, PX458. The oligonucleotides for the PX458-SNCA construct were as follows: SNCA-gRNA, forward 5’-CACCGCCATGGATGTATTCATGAA-3’, reverse 5’-AAACTTCATGAATACATCCATGGC-3’. For generating a NR4A2 (NURR1)-driven GFP expressing cell lines, we used the dsDNA donor vector of 2A-H2B-eGFP gene cassettes between both homology arms with the replaced endogenous NURR1 stop codon. We used sequences of homology arms gRNA in PX458 for homologous recombination at the NURR1 locus following a previously described protocol77. Each homology arm has 794bp (NURR1 left arm) or 910 bp (NURR1 right arm) sequences in the last exon of NR4A2. The oligonucleotides for the PX458-NURR1 construct were as follows: forward 5’-CACCGATTATTTGTCCAAACTGTTG-3’ and reverse 5’-AAACCAACAGTTTGGACAAATAATC-3’. All insert sequences were verified by Sanger DNA sequencing (JHU Synthesis & Sequencing Facility). Plasmid transfections were performed using Lipofectamine® LTX and Plus™ Reagent (Invitrogen) according to the manufacturer’s instructions.
Blue light illumination
A customized blue light illumination plate (TouchBright W-Series) was designed and manufactured by Live Cell Instrument (Seoul, Korea). This plate contained 17 LEDs (70 mW per LED) per well on a 12-well plate. The light intensity, frequency, and duration were controlled by customized software (Live Cell Instrument). The actual light intensity at 470 nm to the cell plate was measured by LaserCheck (Coherent). The light intensity at the maximal output in 12-well, 24-well, and 96-well plates was 34 μW/mm2, 34 μW/mm2, and 26 μW/mm2, respectively.
Immunocytochemistry
The cells were fixed in 4% paraformaldehyde (PFA) and stained with the primary antibodies (listed below) after permeabilization with 0.1% Triton X-100/0.5% BSA in PBS solution. To examine the detergent-insoluble α-syn aggregates, the cells were fixed with 4% PFA containing 1% Triton X-100 for 15 min78. The appropriate Alexa Fluor 488-, 568-, or 647-labeled secondary antibody (Life Technologies) and DAPI (Roche Applied Science) nuclear counter-staining were used for visualization. The stained samples were analyzed using fluorescence microscopy (Eclipse TE2000-E, Nikon). The numbers of aggregate+, pS129-α-syn+, DAPI+, and transfected cells were counted under fluorescence microscopy. The primary antibodies used in this study are as follows with the target (clone), manufacturer, catalog number, isotype, and dilution specified, respectively: α-Syn (42/α-Synuclein), BD Transduction Laboratories, 610786, mouse IgG1, and 1/1000; α-Syn (5G4), Millipore, MABN389, mouse IgG1, and 1/1000; α-Syn (Syn303), BioLegend, 824301, mouse IgG1, and 1/500; α-Syn (Syn-O2), BioLegend, 847602, mouse IgG1, and 1/500; pS129-α-syn (P-syn/81A), BioLegend, 825701, mouse IgG2a, and 1/1000; pS129-α-syn (EP1536Y), abcam, ab51253, rabbit IgG, and 1/1000; GFP, abcam, ab13970, chicken IgY, and 1/1000; HA (16B12), BioLegend, 901501, mouse IgG1, and 1/1000; HA, abcam, ab9110, rabbit IgG, and 1/1000; HA (Poly9023), BioLegend, 902301, rabbit IgG, and 1/1000; TH, Pel-Freez Biologicals, P40101–150, rabbit IgG, and 1/1000; TUJ1, BioLegend, MMS-435P, mouse IgG2a, and 1/1000; mCherry, BioLegend, 677701, mouse IgG2a and 1/1000; mCherry, Sigma-Aldrich, AB356482, rabbit, and 1/1000; p62, Sigma-Aldrich, P0067, and 1/500; and Ubiquitin, DAKO, Z0458, rabbit IgG, and 1/500, and GABA, Sigma-Aldrich, A2052, rabbit, and 1/200; cleaved caspase-3 (Asp175), Cell Signaling Technology, #9661, rabbit IgG and 1/500; LC3, Signaling Technology, #12741, rabbit IgG, and 1/1000, and 1/1000. For Thioflavin S staining, the fixed cells were incubated in 0.1% (w/v) Thioflavin S (Sigma-Aldrich) solution for 8 min and were then washed with 50% ethanol for 5 min. For staining midbrain organoids, anti-GFAP antibody was purchased from MP Biomedicals (#691102, mouse, and 1/200).
Live-cell imaging
All live-cell imaging experiments were performed on Zeiss AxioObserver inverted microscope with LSM800 confocal module equipped with a stagetop incubator utilizing an oil immersion objective (Zeiss Plan-Neofluar 40X 1.30 N.A., DIC). Following differentiation into mDA neurons, cells were equilibrated on the preheated (37 °C and 5% CO2) stagetop incubator for 10 min prior to imaging. Acute blue light stimulation was achieved by utilizing the 488nm laser and the stimulation module within ZEN imaging software. Stimulation with blue light varied from 1–5 s and laser power was 1% (1.5 μW). Following 5 baseline images, laser stimulation was performed, and cells were imaged for up to each indicated time of post-activation. Data presented are representative of at least two independent experiments utilizing three or more biological replicates per experiment.
Investigating transmission of α-synuclein in co-culture systems
The three-dimensional localization of 5G4+ α-synuclein aggregates in AAVS1::eGFP mDA neurons (referred to as ‘recipient’ cells) was investigated. eGFP-expressing mDA neuronal progenitor cells (NPCs) were co-cultured/differentiated with opto-α-syn PD-hiPSCs-derived mDA NPCs (referred to as ‘donor’ cells) for one week. Subsequently, the cells were exposed to blue light (34 μW/mm2 at 470 nm, 0.17 Hz, 0.5 s) for 7 days. The cells were then immunostained with 5G4 (red) and DAPI (blue) and analyzed using LSM 800 confocal microscopy. The interval between individual Z-stack serial images was determined using the ‘Optimal’ option of the software. The 3D volume reconstruction and processing of the Z-series with XYZ-slice projection were performed using Zen blue 3.0 software.
Western blot analysis
The cells including mouse primary neurons, iPSC-derived cells, SH-SY5Y or the tissues of striatum and ventral midbrain were homogenized and lysed in RIPA buffer (Cell Signaling Technology) supplemented with 1% SDS (Amersco), 10% glycerol (Sigma-Aldrich) or TX-soluble lysis buffer (50mM Tris, 150mM NaCl and 1% Triton X-100) or containing protease inhibitor cocktail (cOmplete™ EDTA-free protease inhibitor cocktail, Roche or Cell Signaling Technology) and phosphatase inhibitor (PhosSTOP™, Roche or Cell Signaling Technology) followed by centrifugation at 15000 rpm for 30 min in 4 °C to collect supernatants. Insoluble cell pellets were subsequently lysed by TX-insoluble lysis buffer (50mM Tris, 150mM NaCl, 1% Triton X-100 and 2% SDS) containing both protease and phosphatase inhibitor. Protein concentration was measured using BCA Kit (Pierce, IL, USA). Equal amounts of proteins (10–20μg) prepared from the cells or the tissues and then mixed with 4X Laemmli buffer (Bio-Rad) to resolve the sample on 8–16%, 4–20% Tris-Glycine or 4–12% Bis-Tris gradient gels followed by transfer to nitrocellulose membranes or PVDF membranes. These membranes were blocked with blocking solution (Tris-buffered saline with 3% or 5% non-fat dry milk respectively based on antibody specificity with 0.05% Tween-20) for 1 h followed by incubation at 4 °C overnight with primary antibodies followed by HRP-conjugated rabbit or mouse secondary antibodies (1:5000, Thermo Scientific) for 1 h at room temperature. Chemiluminescence signals from immunoblot were visualized by ImageQuant LAS4000 mini (Cytiva)
The western blot analyses were performed with the following antibodies with the target (clone), company, catalog number, and dilution specified, respectively: α-syn (42/α-Synuclein), BD Transduction Laboratories™, 610786, 1/1000 or Cell Signaling Technology, #4179, 1/1000; pS129-α-syn, Cell Signaling Technology, #23706, 1/1000; β-actin (8H10D10), Cell Signaling Technology, #3700, 1/5000 or Sigma-Aldrich, a3854, 1/1000; HA (16B12), BioLegend, 901501, 1/1000; HSP90, Santa Cruz Biotechnology, sc-7947, 1/5000; PDK1, Cell Signaling Technology, #3062, 1/1000; PI3K, Thermo Fisher Scientific, PA599518, 1/1000; CCR4, Thermo Fisher Scientific, PA599885, 1/5000; LC3, Cell Signaling Technology, #12741, 1/1000; p-mTOR(S2448), Cell Signaling Technology, #2971, 1/1000; pan-mTOR, Cell Signaling Technology, #2972, 1/1000; pAKT(T308) (L32A4), Cell Signaling Technology, #5106, 1/1000; Phospho-Akt (Thr308)(244F9), Cell Signaling Technology, #4056, 1/1000; pAKT(S473)(D9E), Cell Signaling Technology, #4060, 1/1000; pan-AKT, Cell Signaling Technology, #4685, 1/1000; pS6K(T229), Sigma-Aldrich, SAB4503955, 1/1000; pan-S6K, Cell Signaling Technology, #9202, 1/1000; TH, Novus Biologicals, NB300–109, 1/1000; LAMP1, Cell Signaling Technology, #9091, 1/1000; HRP-conjugated rabbit, Thermo Scientific, HRP 31460, 1/5000; mouse secondary HRP-conjugated mouse, Thermo Scientific, HRP 31430, 1/5000.
Cell viability analysis
The SH-SY5Y cells (1 × 10⁴ cells/well) were seeded into 96-well plates in triplicate and the cytotoxicities of blue light illumination were measured using CCK-8 cell counting kit from Dojindo and LDH cytotoxicity assay kit according to the manufacturer’s protocols.
Mitochondrial membrane potential
Mitochondrial membrane potential was assessed using the MitoProbe™ DiOC2(3) (3,3′-diethyloxacarbocyanine iodide) Assay Kit (#M34150, Invitrogen) followed by flow cytometry (Attune™ NxT Flow Cytometer, Invitrogen) as described by the manufacturer. Briefly, differentiated mDA neurons were detached using Accutase (Innovative Cell Technologies), suspended in 1 mL of warm PBS at approximately 1 × 10⁶ cells/mL, loaded with 5 μL of 10 μM DiOC2(3), and incubated at 37 °C, 5% CO2, for 20–30 min. For the control tube, cells were added with 1 μL of 50 mM CCCP (carbonyl cyanide 3-chlorophenylhydrazone) and incubated at 37 °C for 5 min prior to DiOC2(3) incubation. After staining with DiOC2(3), cells were visualized by flow cytometry using 488 nm excitation and green (BL-1: 515 nm) or red (BL-3: >600 nm) emission filters. The intensity of DiOC2(3) staining, which produces bright red fluorescence in mitochondria with active membrane potentials, decreases with decreased mitochondrial membrane potential, accompanied by a shift from red to green fluorescence.
Primary screen, validation, and hit selection
The opto-α-syn expressing SH-SY5Y cells were seeded in 96-well black flat bottom imaging microplates (Falcon) at 30,000 cells per well in 100 μL of complete media using E1-ClipTip electronic multichannel pipette (Thermo Fisher Scientific) and incubated in 37 °C and 5% CO2 humidified incubator. After 18 h of incubation, 10 μL of 10 μM compounds (column 2 to 10) or 1% DMSO (column 1 and 12) were added (final concentration of DMSO is 0.1%). In order to induce aggregations, the plates were illuminated with blue light (26 μW/mm2) on customized blue light illumination 96-well plates for 1.5 h. Afterward, cells were fixed in 4% paraformaldehyde (PFA) for 15 min and stained with the aggregated-α-syn antibody (5G4) after permeabilization with 0.1% Triton X-100/0.5% BSA/PBS solution. The Alexa Fluor 488 secondary antibody and DAPI nuclear counter-staining were used. After staining, every four images per well of the stained samples were captured automatically using BD Pathway™ 855 Bioimager for High-Content cell analysis. To analyze images, the automated aggregation quantification algorithm and cell counting algorithm in the form of macro were developed using ImageJ software79. Briefly, the algorithm includes the inversion, subtracting background, threshold selection, and analyzing particles with ranged size and circularity. The Aggregates Induction Score (AIS) was calculated using the following equation:
where is the number of aggregates and is the number of total cells in each group treated with a specific compound. The value in each well was normalized by the value obtained from positive control group (Blue light illuminated group), which was set as 1.0. We applied the developed algorithms and calculated AIS for all samples to nominate candidate hits out of the 1,280 compounds. The hit selection strategy was based on calculated AIS; hits were defined as AIS < 0.5. The 31 compounds fulfilled those criteria, but 12 compounds with too low cell numbers were excluded as possible compounds due to exhibiting toxicity. Remaining 19 potential hits were further validated in 24-well plates; 5 images per well were taken randomly. Two independent experiments were performed, and total 10 images per well are analyzed to calculate AIS. Finally, 5 compounds were chosen as AIS < 0.5 and P < 0.0001.
Cytokine array
Midbrain organoids were in dark or exposed to blue light (34 μW/mm2 at 470 nm, 0.17 Hz, 0.5 s) for 3 days. The media were collected for cytokine array, and organoids were dissociated using Dispase (Invitrogen) to measure a protein concentration of each cell lysate using Pierce™ BCA Protein Assay Kit (#23225, Thermo Scientific™). The levels of secreted cytokines in cell culture supernatants were measured by Proteome Profiler Human Cytokine Array Kit (#ARY005B, R&D Systems) as described in the manufacturer’s instructions. 1 mL of the supernatant was added to a prepared cytokine antibody membrane, and then membranes were exposed with ECL reagent. Quantification was performed with ImageJ software, and the quantified values were normalized to the protein concentration of midbrain organoids.
Biochemical extraction and western blot analysis from primary neuron culture
Primary neurons were treated with 2.5 μg/mL of α-syn PFF. After 14 days of α-syn PFF treatment with or without treatment of 100 nM CDC or BAG, cells were washed two times with artificial cerebrospinal fluid (ACSF), and cells were harvested and then lysed with Triton X-100 (TX, Sigma-Aldrich) soluble and insoluble buffer, Cells were prepared with sequential lysis step. Samples were homogenized in TX-soluble lysis buffer containing 50 mM Tris, 150 mM NaCl, 1% TX with protease and phosphatase inhibitor followed by sonication. After centrifugation at 22,000 × g for 30 min, the soluble supernatant was collected. The insoluble pellet was resuspended in TX-insoluble buffer containing 50 mM Tris, 150 mM NaCl, 1% TX, 2% SDS with protease and phosphatase inhibitor followed by sonication, and then centrifuged at 22,000 × g for 30 min. Protein concentrations were determined by BCA assay (Pierce, Rockford, IL, USA) and samples of 10 μg total proteins were used. 4× Laemmli buffer (Bio-Rad) was utilized to dilute the lysates. Equal amounts of lysates were separated on 8–16% gradient SDS-PAGE gels (Life technologies) and transferred to nitrocellulose membrane. Membrane was blocked with TTBS [150 mM NaCl, 10 mM Tris-HCl (pH 7.4), 0.05% Tween-20] containing 3% skim milk for 30 min and incubated at 4 °C overnight with primary antibodies; anti-α-syn (1:1000, Cell signaling Technology) anti-p-α-syn (1:1000, Cell signaling Technology), anti-β-Actin (1:5000, Sigma-Aldrich) followed by HRP-conjugated rabbit or mouse secondary antibodies (1:5000, Thermo Scientific) for 1 h at room temperature. Chemiluminescence (Thermo Scientific) was utilized to visualize the immunoblot signals.
In vitro immunofluorescence analysis
Primary hippocampal neurons (1.8 × 10⁵ cells/well in 24-well plates) were seeded on coverslips coated with PLL in Borate buffer for 24 h. Primary hippocampal neurons were treated with 1 μg/mL of α-syn PFF at DIV10. After 14 days of α-syn PFF treatment with or without treatment of 10 nM CDC or BAG, cells were washed with ACSF and fixed with 4% paraformaldehyde for 10 min at RT, permeabilized with 0.1% Triton X-100 in PBS for 20 min and washed with PBS three times. Then, cells were blocked with 5% normal goat serum (Jackson ImmunoResearch) in 0.1% Tween-20 in PBS (PBST) for 30 min and incubated with anti-pS129-α-syn (1:500, Biolengend), anti-MAP2 (1:500, Sigma-Aldrich) at 4°C overnight. Cells were then washed with PBST for three times followed by incubation in a mixture of Alexa Fluor 488 (1:1000, ThermoFisher) and Alexa Fluor 568 (1:1000, ThermoFisher) secondary antibodies for 1 h at room temperature and then washed three times with PBST. Coverslips were mounted on a glass slide in a mounting medium with DAPI (VECTASHIELD, Vector Laboratories, CA, USA). The fluorescence images were acquired via a Zeiss confocal microscope (LSM 710, Carl Zeiss, CA, USA).
Dose-Response Curve Analysis
The concentration-response relationship of CDC and BAG on the survival of TH+ neurons was determined using a TH+ Neurons Survival Assay. The mDA neurons were seeded and treated with various concentrations of CDC and BAG (1 nM, 5 nM, 10 nM, 25 nM, 50 nM, 75 nM, and 100 nM) for 7 days under different conditions including Dark+Vehicle, Blue+Vehicle, Blue+CDC, and Blue+BAG. The survival of TH+ neurons was measured using an immunostaining and quantification method. The concentration-response data were plotted as log values of the concentrations against the measured response. A non-linear regression model, log[agonist] vs. response, was used to fit the data using Graph pad 7.0, with the equation:
and the values of bottom, top, and EC50 for both compounds were calculated. Sigmoidal curve graphs were generated to illustrate the concentration-response relationship for each compound.
Chemical library
The library used for the screen contains 1,280 chemicals obtained from Tocris Bioscience. Tocriscreen™ compounds library has the collections of unique and diverse bioactive compounds suitable for high-throughput screening (HTS), cell-based high-content screening (HCS) and chemical biology applications including high purity compounds active at GPCRs, kinases, ion channels, nuclear receptors, and transporters.
Stereotaxic α-syn PFF injection
Mice were anesthetized with a mixture of ketamine (100 mg/kg) and xylazine (10 mg/kg). For stereotaxic intrastriatal injection of α-syn PFF, the injection cannula (26.5-gauge Hamilton syringe, NV, USA) was unilaterally injected into the striatum with the following coordinates: anteroposterior= 0.2 mm, mediolateral (ML) = 2.0 mm, and dorsoventral (DV) = 2.6 mm from the bregma. The infusion of 2 μL of α-syn PFF (2.5 μg/μL in PBS) or PBS was performed by automated injection pump at a rate of 0.2 μL per min. After the injection, the needle remained for an additional 5 min to allow for complete absorption and then slowly removed from the mouse brain. After surgery, mice were monitored, and post-surgical care was provided.
Drug preparation and treatment
For in vivo and behavior studies, BAG 956 (Tocris, MN, USA) were firstly dissolved in DMSO and then diluted to 2 mg/kg/10mL or 10 mg/kg/10mL in 0.5% carboxymethylcellulose sodium salt (CMC-Na) with 0.1% Tween-80 in ddH2O. The vehicle groups were received 2.5% DMSO/0.5% CMC-Na/0.1% Tween-80 vehicle solution, whereas experimental groups were received with addition of BAG 956 at 2 mg/kg or 10 mg/kg in vehicle solution respectively by oral administration at least 5 days a week for 6 months after 1-month recovery from stereotaxic intrastriatal α-syn PFF injection.
Immunohistochemistry and quantification
Mice were perfused with ice-cold phosphate buffered saline (PBS) and then fixed with 4% paraformaldehyde/PBS (pH 7.4). Brains were collected and post-fixed for 4 h in PBS containing 4% paraformaldehyde and incubated in PBS solution containing 30% sucrose (pH 7.4). Brains were molded with frozen OCT compound followed by coronal sections cut in thickness of 30 μm using a microtome. Free-floating 30 μm sections were blocked with 5% goat serum, 0.2% Triton X-100, and 0.02% NaN3 in PBS, and then incubated with rabbit anti TH antibody (Novus Biologicals, USA), followed by incubated with biotin-conjugated anti-rabbit secondary antibody (ABC kit, Vector Labs). After triple washing steps, ABC reagents (Vector Labs) were added, and sections were developed using SigmaFast DAB Peroxidase Substrate (Sigma-Aldrich). The brain slices were mounted on Superfrost Plus microscope slide (Fisher Scientific) with D.P.X mounting solution (Sigma-Aldrich). Sections were counterstained with Nissl (0.09% thionin). TH+ and Nissl+ DA neurons from the SNpc region were counted through optical fractionators, an unbiased method for cell counting. This method was carried out using a computer-assisted image analysis system consisting of an Axiophot photomicroscope (Carl Zeiss Vision, Jena, Germany) equipped with a computer controlled motorized stage (Ludl Electronics, NY, USA), a Hitachi HV C20 camera, and Stereo Investigator software (MicroBright-Field, MBF Bioscience, VT, USA). The total number of TH-stained neurons and Nissl counts was analyzed.
Immunofluorescence analysis
Immunofluorescence was performed with 30 μm thick serial brain sections which were prepared same method used in IHC. For immunofluorescence studies, primary anti-TH (Novus Biologicals) and anti-pS129-α-syn (Biolegend) were incubated for overnight at 4 °C. After PBS washing, floating brain sections were incubated in 0.1% Triton X-100 and 5% goat serum in PBS, followed by 1 h of RT incubation in a mixture of Alexa Fluor 488- and Alexa Fluor 568-conjugated (ThermoFisher Scientific) secondary antibodies at room temperature. The fluorescent images were acquired via a Zeiss confocal microscope (Zeiss Confocal LSM 710) after the coverslips were mounted with DAPI mounting solution (VECTASHIELD HardSet Antifade Mounting Medium with DAPI, Vector laboratories). All images were processed by the Zeiss Zen software. The selected area in the signal intensity range of the threshold was measured using ImageJ analysis.
Behavioral tests
To evaluate α-syn PFF-induced behavioral deficits, PBS and α-syn PFF injected mice were assessed by the pole test, grip strength test and rotarod test for motor deficits. Open field test and elevated plus maze test were performed to validate locomotion and anxiety-based behavior deficits 2-weeks prior to sacrifice. The experimenter was blinded to treatment group for all behavioral studies. All tests were performed and recorded between 10:00–16:00 in the lights-on cycle with dim light on the animal behavior room.
Grip strength test
Grip strength test was performed using a Bioseb grip strength test machine (BIO-GS3, Bioseb, FL, USA). Performance of mice was assessed three times. To validate grip strength, each mouse was allowed to hold a metal grid with forelimbs or both fore and hind limbs. Mouse was lifted by the tail so that its hindlimbs were not able to reach the grid. Mice were gently pulled backwards by the tail until they could no longer hold the grid. Maximum grip strength was digitally recorded and displayed as force in grams. Grip strength was scored as grams (g).
Rotarod test, (Rota Rod Rotamex 5, Columbus Instruments)
For the rotarod test, the mice were trained 3 days before test. On test day 4, mice were placed on an accelerating rotarod cylinder, and the latency time of the animals was measured. The experimental setup for accelerating starts from 5 up to 50rpm with increment of 1rpm per every 5 seconds. A trial ended if the animal fell from the rod of the device or spun around for 2 consecutive revolutions without attempting to walk on the rungs. Motor test data are presented as mean of latency time (3 trials) on the rotarod.
Open field test (OFT, ANY-Maze video tracking system and software)
The open field consisted of a square plastic box (50 cm × 50 cm × 50 cm, 4 × 4) divided into peripheral and central sectors, where the central sectors included 4 central squares (2 × 2) and surrounded by the remaining peripheral squares. The mouse was placed into the open field and allowed to explore for 10 min under dim light. A video tracking system (ANY-Maze software) was used to record the distance traveled as a measurement of locomotor activity. The time spent in and entries into the center were measured as an anxiolytic indicator.
Elevated plus maze (EPM, ANY-Maze video tracking system and software)
EPM was consist of non-transparent/opaque plastic textured two open arms (45 cm × 8 cm) and two closed arms with walls (45 cm × 8 cm × 15 cm) connected to a center zone (8 cm × 8 cm). Maze was lifted 50 cm higher from the floor. A video tracking system was equipped on the ceiling and overlook the whole maze to record the experiment. Each mouse was placed in the central intersection facing an open arm. The maze area touched by a mouse was cleaned throughout each trial to eliminate odors and residues. Both the time spent in the open arms and the number of entries into the open arms were recorded for 8 min period using the Any-Maze behavioral tracking system. The designated areas for near or far zone from the center were applied to clarify the animal behavior for anxiety and exploration traits. An entry was defined when center of body was crossing the line. The time spent, number of entries and total distance travelled in designated area were measured and counted respectively.
Fear conditioning (FC)
To evaluate contextual and cued learning and memory, a conditioned stimulus (tone), an aversive unconditioned stimulus (shock), new olfactory cue (acetic acid), floor texture (grid to acryl plate), visual cue (light on/off) were used. On first day, the mice were placed in chamber of Context A for 10 min to habituate. On second day, mice received four tone-shock pairings, the shock (0.5 mA, 2 s) was applied after the end of the tone (80 dB, 2 kHz, 10 s). On 3rd day, mice were placed in chamber with context A for 5min and freezing episode and total freezing time were counted and validated as a contextual FC. On 4th day, mice were placed in context B with different texture, olfactory and visual cues. After tone alarmed, the freezing episode and total freezing time was measured and validated as a cued FC. Freezing is defined as the complete lack of motion for a minimum of 0.75 s.
QUANTIFICATION AND STATISTICAL ANALYSIS
Statistical significance, type of the test used for individual testing, number of independent experiments are indicated in the figure legends.
Quantitative image analysis
Analysis of immunostained images was performed by ImageJ software (NIH). Images were converted to grayscale, and a threshold was adjusted to exclude the background based on the size of particles. Setting a threshold was also used for accomplishing desired intensity values for each experiment. Once a threshold value was determined, all the images in each experiment were applied with the fixed threshold value, and then the number and the total area of immunopositive aggregates per field were measured using the measurement function.
Statistical analysis
The Z’ factor was used to assess assay performance. The factor constitutes a dimensionless parameter that ranges from 1 (infinite separation) to < 0. It is defined as: , where , , , and are the standard deviations (σ) and averages (μ) of the positive control (c+, blue light illuminated opto-α-syn SH-SY5Y cells treated with 0.1% DMSO) and the negative control (c−, opto-α-syn SH-SY5Y cells in dark treated with 0.1% DMSO). factor between 0.5 and 1 indicates an excellent assay with good separation between controls. factor between 0 and 0.5 indicates a marginal assay, and < 0 signifies a poor assay with no separation between controls. All data are represented as the mean ± SEM. Representative images were taken out of at least 3 experiments with similar results. The statistical analysis was performed using Prism 7 (GraphPad). Two-tailed unpaired t-test was used for assessment of the differences between two means and the differences among multiple means were assessed by ANOVA followed by Tukey’s or Dunnett’s post hoc test. Assessments with P < 0.05 were considered significant.
Supplementary Material
Video S1. Formation of mCherry+ opto-α-syn aggregates with acute blue light stimulation (1.5 μW at 488nm, 0.5 Hz, 1 s) using live-cell imaging in opto-α-syn-expressing PD hiPSC-derived mDA neurons, Related to Figure 1
Video S2. Formation of mCherry+ opto-mock aggregates with acute blue light stimulation (1.5 μW at 488nm, 0.5 Hz, 1 s) using live-cell imaging in opto-mock-expressing PD hiPSC-derived mDA neurons, Related to Figure 1
Video S3. mCherry+ opto-α-syn aggregation with acute blue light stimulation (1.5 μW at 488nm, 0.25 Hz, 1 s) using live-cell imaging in opto-α-syn-expressing PD hiPSC-derived mDA neurons, Related to Figure 1
Video S4. mCherry+ opto-α-mock aggregation with acute blue light stimulation (1.5 μW at 488nm, 0.25 Hz, 1 s) using live-cell imaging in opto-mock-expressing PD hiPSC-derived mDA neurons, Related to Figure 1
Video S5. Spatially controlled mCherry+ opto-α-syn aggregates with acute blue light stimulation (blue circle; 1.5 μW at 488nm, 0.17 Hz, 1 s) using live-cell imaging in opto-α-syn-expressing PD hiPSC-derived mDA neurons, Related to Figure 1
Video S6. Formation of mCherry+ opto-α-syn aggregates with acute blue light stimulation (1.5 μW at 488nm, 0.17 Hz, 1 s) using live-cell imaging in the cell body of opto-α-syn-expressing PD hiPSC-derived mDA neurons, Related to Figure 1
Video S7. Formation of mCherry+ opto-α-syn aggregates with acute blue light stimulation (1.5 μW at 488nm, 0.17 Hz, 1 s) using live-cell imaging in the neurite of opto-α-syn-expressing PD hiPSC-derived mDA neurons, Related to Figure 1
Video S8. Transmission of mCherry+ opto-α-syn aggregates with acute blue light stimulation into AAVS1::eGFP mDA neurons in co-culture model, Related to Figure 1
Key resources table.
| REAGENT or RESOURCE | SOURCE | IDENTIFIER |
|---|---|---|
| Antibodies | ||
| Mouse monoclonal anti-α-Synuclein, clone 42/α-Synuclein | BD Transduction Laboratories | Cat# 610786; RRID:AB_398107 |
| Mouse monoclonal anti-Aggregated a-Synuclein, clone 5G4 | Millipore | Cat# MABN389; RRID:AB_2716647 |
| Mouse monoclonal anti-α-Synuclein, clone SYN303 | BioLegend | Cat# 824301; RRID:AB_2564879 |
| Mouse monoclonal anti-Aggregated α-Synuclein, clone Syn-O2 | BioLegend | Cat# 847602; RRID:AB_2632701 |
| Mouse monoclonal anti-α-Synuclein (phospho S129), clone P-syn/81A | BioLegend | Cat# 825701; RRID:AB_2564891 |
| Rabbit monoclonal anti-α-synuclein (phospho S129), clone EP1536Y | Abcam | Cat# ab51253; RRID:AB_869973 |
| Rabbit monoclonal anti-α-Synuclein (phospho, S129), clone D1R1R | Cell Signaling Technology | Cat# 23706, RRID:AB_2798868 |
| Chicken polyclonal anti-GFP | Abcam | Cat# ab13970; RRID:AB_300798 |
| Mouse monoclonal anti-HA, clone 16B12 | BioLegend | Cat# 901501; RRID:AB_2565006 |
| Rabbit polyclonal anti-HA | Abcam | Cat# ab9110, RRID:AB_307019 |
| Rabbit polyclonal anti-HA, clone poly9023 | BioLegend | Cat# 902301, RRID:AB_2565018 |
| Rabbit polyclonal anti-TH | Pel-Freez Biologicals | Cat# P40101-150; RRID:AB_2617184 |
| Rabbit polyclonal anti-TH | Novus Biologicals | Cat# NB300-109; RRID:AB_10077691 |
| Mouse monoclonal anti-Tubulin β 3 (TUBB3, TUJ1) | BioLegend | Cat# MMS-435P; RRID:AB_2313773 |
| Mouse monoclonal anti-mCherry | BioLegend | Cat# 677701; RRID:AB_2801131 |
| Rabbit polyclonal anti-mCherry | Sigma-Aldrich | Cat# AB356482, RRID:AB_2889995 |
| Rabbit polyclonal anti-p62/SQSTM1 | Sigma-Aldrich | Cat# P0067; RRID:AB_1841064 |
| Rabbit polyclonal anti-Ubiquitin | DAKO | Cat# Z0458; RRID:AB_2315524 |
| Rabbit polyclonal anti-CLEAVED-CASP3 (ASP175) | Cell Signaling Technology | Cat# 9661; RRID:AB_2341188 |
| Rabbit monoclonal anti-LC3A/B, clone D3U4C | Signaling Technology | Cat# 12741; RRID:AB_2617131 |
| Rabbit polyclonal anti-GABA | Sigma-Aldrich | Cat# A2052; RRID:AB_477652 |
| Mouse monoclonal anti-GFAP | MP Biomedicals | Cat# 691102; RRID:AB_2335129 |
| Rabbit polyclonal anti-PDK1 | Cell Signaling Technology | Cat# 3062; RRID:AB_2236832 |
| Rabbit polyclonal anti-PI3K p85/p55 | Thermo Fisher Scientific | Cat# PA599518; RRID:AB_2818451 |
| Rabbit polyclonal anti-CCR4 | Thermo Fisher Scientific | Cat# PA599885; RRID:AB_2818818 |
| Rabbit polyclonal anti-Phospho-mTOR (Ser2448) | Cell Signaling Technology | Cat# 2971; RRID:AB_330970 |
| Rabbit polyclonal anti-pan-mTOR | Cell Signaling Technology | Cat# 2972; RRID:AB_330978 |
| Mouse monoclonal anti-Phospho-Akt (Thr308), Clone L32A4 | Cell Signaling Technology | Cat# 5106; RRID:AB_836861 |
| Rabbit monoclonal anti-Phospho-Akt (Thr308), clone 244F9 | Cell Signaling Technology | Cat# 4056; RRID:AB_331163 |
| Rabbit polyclonal anti-Phospho-Akt (Ser473) | Cell Signaling Technology | Cat# 4060; RRID:AB_2315049 |
| Rabbit monoclonal anti-pan-Akt, clone 11E7 | Cell Signaling Technology | Cat# 4685; RRID:AB_2225340 |
| Rabbit polyclonal anti-phospho-p70 S6 Kinase (pS6K, pThr229) | Sigma-Aldrich | Cat# SAB4503955; RRID:AB_2937010 |
| Rabbit polyclonal anti-pan-p70 S6 Kinase (S6K) | Cell Signaling Technology | Cat# 9202; RRID:AB_331676 |
| Rabbit monoclonal anti-LAMP1 (D2D11) | Cell Signaling Technology | Cat# 9091; RRID:AB_2687579 |
| Mouse monoclonal anti-β-actin, clone 8H10D10 | Cell Signaling Technology | Cat# 3700, RRID:AB_2242334 |
| Mouse monoclonal anti-HRP-conjugated β-actin, clone AC-15 | Sigma-Aldrich | Cat# A3854, RRID:AB_262011 |
| goat polyclonal anti-Goat anti-Rabbit IgG (H+L) Secondary, HRP | Thermo Fisher Scientific | Cat# 31460, RRID:AB_228341 |
| goat polyclonal anti-Goat anti-Mouse IgG (H+L) Secondary, HRP | Thermo Fisher Scientific | Cat# 31430, RRID:AB_228307 |
| Chemicals, peptides, and recombinant proteins | ||
| penicillin/streptomycin | Gibco | Cat# 15140163 |
| Puromycin dihydrochloride | Sigma-Aldrich | Cat# P8833 |
| Retinoic Acid | Sigma-Aldrich | Cat# R2625 |
| L-glutamine | Gibco | Cat# 25030081 |
| N-2 supplement | Gibco | Cat# 17502048 |
| B-27 supplement | Gibco | Cat# 12587010 |
| MEM-NEAA | Gibco | Cat# 11140-050 |
| β-mercaptoethanol | Gibco | Cat# 21985023 |
| FGF2 | Life Technologies | Cat# PHG0263 |
| Y-27632 (ROCK-inhibitor) | Cayman Chemical | Cat# 10005583-10 |
| LDN193189 (LDN) | STEMCELL Technologies |
Cat# 72148 |
| SB431542 (SB) | Cayman Chemical | Cat# 13031 |
| Shh | R&D | Cat# 464-SH |
| Purmorphamine (PMP) | Cayman Chemical | Cat# 10009634-5 |
| FGF8 | PEPROTECH | Cat# 100-25 |
| CHIR99021 (CHIR) | Tocris | Cat# 4423 |
| brain-derivedneurotrophicfactor (BDNF) | PeproTech | Cat# 450-02 |
| glialcellline-derivedneurotrophicfactor (GDNF) | PeproTech | Cat# 450-10 |
| Ascorbic Acid (AA) | Sigma-Aldrich | Cat# A4544 |
| dibutyrylcAMP (dbcAMP) | Sigma-Aldrich | Cat# D0627 |
| DAPT | PEPROTECH | Cat# 2088055 |
| TGFβ3 | R&D | Cat# 243-B3 |
| GlutaMAX | Gibco | Cat# 35050061 |
| heparin | Sigma-Aldrich | Cat# H3149-25KU |
| dorsomorphin | Sigma-Aldrich | Cat# P5499 |
| A83-01 | Sigma-Aldrich | Cat# SML0788 |
| IWP2 | Biogems | Cat# 6866167 |
| SAG | PeproTech | Cat# 9128694 |
| Geltrex | Thermo Fisher Scientific | Cat# A1413202 |
| laminin | BD science | Cat# 354232 |
| insulin | Sigma-Aldrich | Cat# 91077C |
| cAMP | PeproTech | Cat# 6099240 |
| BAG 956 | Tocris | Cat# 3606 |
| C 021 dihydrochloride | Tocris | Cat# 3581 |
| Tocriscreen Plus Micro (1,280 compounds) | Tocris | Cat# 6455 |
| SIGMA FAST DAB TABLET SETS | MilliporeSigma | Cat# D4293-50SET |
| Poly-L-lysine Solution | Sigma-Aldrich | Cat# P4707 |
| Critical commercial assays | ||
| MitoProbe™ DiOC2(3) (3,3’-diethyloxacarbocyanine iodide) Assay Kit | Invitrogen | Cat# M34150 |
| QuickExtract DNA Extraction Solution | Epicentre | Cat# QE09050 |
| AccuPower® PCR premix | Bioneer | Cat# K-2016 |
| BCA protein assay kit | Pierce | Cat# 23228 |
| CCK-8 cell counting kit | Dojindo | Cat# CK04 |
| LDH cytotoxicity assay kit | Sigma-Aldrich | Cat# 4744926001 |
| Proteome Profiler Human Cytokine Array Kit | R&D Systems | Cat# ARY005B |
| VECTASTAIN Elite ABC Kit (Rabbit IgG) | Vector Laboratories | Cat# PK-6101 |
| Experimental models: Cell lines | ||
| Human: SH-SY5Y | ATCC | Cat# CRL-2266 |
| Human: HA-α-syn-Cry2PHR expressing SH-SY5Y (Opto-α-syn SH-SY5Y) | This paper | N/A |
| Human: H9 (WA-09) hESC line | WiCell Research Institute | NIHhESC-10-0062 |
| Human: SNCA triplication PD hiPSC line (ND27760-8) | Ted M. Dawson Lab, Johns Hopkins University | N/A |
| Human: α-syn-mCherry-Cry2clust expressing PD hiPSC line (Opto-α-syn PD hiPSCs) | This paper | N/A |
| Human: mCherry-Cry2clust expressing PD hiPSC line (Opto-mock PD hiPSCs) | This paper | N/A |
| Human: healthy control hiPSC line (SC1015-1) | Ted M. Dawson Lab, Johns Hopkins University | N/A |
| Human: SNCA knock-out hiPSC line | This paper | N/A |
| Human: NURR1-GFP reporter hESC | This paper | N/A |
| Experimental models: Organisms/strains | ||
| Mouse : C57BL/6 | The Jackson Laboratory | JAX:000664 |
| Oligonucleotides | ||
| NR4A2 gRNA sequence: forward 5’-CACCGATT ATTT GTCCAAACT GTTG-3’ | This Paper | N/A |
| NR4A2 gRNA sequence: reverse 5’-AAACCAACAGTTTGGACAAATAATC-3’ | This Paper | N/A |
| AAVS1 gRNA sequence: forward 5’-CACCGTCCCCTCCACCCCACAGTG-3’ | Addgene | Cat# 41817 |
| AAVS1 gRNA sequence: reverse 5’-AAACCACT GTGGGGT GGAGGGGAC-3’ | Addgene | Cat# 41817 |
| SNCA gRNA sequence: forward 5’-CACCGCCATGGAT GT ATT CAT GAA-3’, | This Paper | N/A |
| SNCA gRNA sequences: reverse 5’-AAACTTCATGAATACATCCATGGC-3’ | This Paper | N/A |
| Recombinant DNA | ||
| PX458 Cas9-GFP | Addgene | Cat# 48138 |
| AAV-CAGGS-EGFP | Addgene | Cat# 22212 |
| HA-α-Syn-Cry2PHR in pHR3 | see Table S2 | N/A |
| mCherry-Cry2clust in pHR3 | see Table S2 | N/A |
| α-Syn-mCherry-Cry2clust in pHR3 | see Table S2 | N/A |
| Nurr1-H2B-eGFP-PGK-HygroR in pU57 | see Table S2 | N/A |
| Software and algorithms | ||
| ImageJ | (Schneider et al., 2012) | https://imagej.nih.gov/ij/ |
| customized Blue light illumination control software | Live Cell Instrument | N/A |
| Other | ||
| customized blue light illumination plates (TouchBright W-Series) | Live Cell Instrument | N/A |
| LaserCheck (Coherent) | Coherent | Cat# 1098293 |
| BD Pathway™ 855 Bioimager | BD Biosciences | https://www.bd.com/resource.aspx?IDX=17780 |
Acknowledgments:
We thank Ted M. Dawson (Institute for Cell Engineering, Johns Hopkins University) for generously sharing the SNCA triplication PD hiPSC line (ND27760-8) and its age-matched healthy control hiPSC line (SC1015-1) used in this study.
Funding:
This work was supported by grants from the National Institutes of Health through R01NS093213 (G.L.) and R01NS107404 (H.S.K.), and the Maryland Stem Cell Research Funding (MSCRFD-5411 and MSCRFD-5859, H.S.K.), the American Parkinson Disease Association (award No. 970643, G.L.). This work was also supported by Korea Drug Development Fund funded by Ministry of Science and ICT (MSIT), Ministry of Trade, Industry, and Energy, and Ministry of Health and Welfare (HN21C1258, Republic of Korea; YO) and the NRF grants funded by the Korean government (MSIT) (NRF-2019M3A9H1103783, NRF-2020R1A2C1009172; Y.O.).
Footnotes
Declaration of interests: M.S.K., E.R., H.S.K., and G.L. are inventors of a patent related to this study. G.L. is a scientific founder, shareholder and serves as scientific advisors of Vita Therapeutics. The Lee lab receives a funding from Vita Therapeutics.
References
- 1.Dauer W, and Przedborski S (2003). Parkinson’s disease: mechanisms and models. Neuron 39, 889–909. 10.1016/s0896-6273(03)00568-3. [DOI] [PubMed] [Google Scholar]
- 2.Olanow CW, and Tatton WG (1999). Etiology and pathogenesis of Parkinson’s disease. Annual review of neuroscience 22, 123–144. 10.1146/annurev.neuro.22.1.123. [DOI] [PubMed] [Google Scholar]
- 3.Polymeropoulos MH, Lavedan C, Leroy E, Ide SE, Dehejia A, Dutra A, Pike B, Root H, Rubenstein J, Boyer R, et al. (1997). Mutation in the alpha-synuclein gene identified in families with Parkinson’s disease. Science 276, 2045–2047. 10.1126/science.276.5321.2045. [DOI] [PubMed] [Google Scholar]
- 4.Singleton AB, Farrer M, Johnson J, Singleton A, Hague S, Kachergus J, Hulihan M, Peuralinna T, Dutra A, Nussbaum R, et al. (2003). alpha-Synuclein locus triplication causes Parkinson’s disease. Science 302, 841. 10.1126/science.1090278. [DOI] [PubMed] [Google Scholar]
- 5.Lee VM, and Trojanowski JQ (2006). Mechanisms of Parkinson’s disease linked to pathological alpha-synuclein: new targets for drug discovery. Neuron 52, 33–38. 10.1016/j.neuron.2006.09.026. [DOI] [PubMed] [Google Scholar]
- 6.Hartmann A (2004). Postmortem studies in Parkinson’s disease. Dialogues Clin Neurosci 6, 281–293. [DOI] [PMC free article] [PubMed] [Google Scholar]
- 7.Han JJ (2023). FDA Modernization Act 2.0 allows for alternatives to animal testing. Artif. Organs. 10.1111/aor.14503. [DOI] [PubMed] [Google Scholar]
- 8.Wadman M (2023). FDA no longer has to require animal testing for new drugs. Science 379, 127–128. 10.1126/science.adg6276. [DOI] [PubMed] [Google Scholar]
- 9.Cornacchia D, and Studer L (2017). Back and forth in time: Directing age in iPSC-derived lineages. Brain Res 1656, 14–26. 10.1016/j.brainres.2015.11.013. [DOI] [PMC free article] [PubMed] [Google Scholar]
- 10.Liu GH, Ding Z, and Izpisua Belmonte JC (2012). iPSC technology to study human aging and aging-related disorders. Current opinion in cell biology 24, 765–774. 10.1016/j.ceb.2012.08.014. [DOI] [PubMed] [Google Scholar]
- 11.Miller JD, Ganat YM, Kishinevsky S, Bowman RL, Liu B, Tu EY, Mandal PK, Vera E, Shim JW, Kriks S, et al. (2013). Human iPSC-based modeling of late-onset disease via progerin-induced aging. Cell stem cell 13, 691–705. 10.1016/j.stem.2013.11.006. [DOI] [PMC free article] [PubMed] [Google Scholar]
- 12.Luk KC, Song C, O’Brien P, Stieber A, Branch JR, Brunden KR, Trojanowski JQ, and Lee VM (2009). Exogenous alpha-synuclein fibrils seed the formation of Lewy body-like intracellular inclusions in cultured cells. Proceedings of the National Academy of Sciences of the United States of America 106, 20051–20056. 10.1073/pnas.0908005106. [DOI] [PMC free article] [PubMed] [Google Scholar]
- 13.Rost BR, Schneider-Warme F, Schmitz D, and Hegemann P (2017). Optogenetic tools for subcellular applications in neuroscience. Neuron 96, 572–603. 10.1016/j.neuron.2017.09.047. [DOI] [PubMed] [Google Scholar]
- 14.Chung HK, Ho HA, Perez-Acuna D, and Lee SJ (2020). Modeling alpha-Synuclein Propagation with Preformed Fibril Injections (vol 12, pg 139, 2019). J Mov Disord 13, 77–79. 10.14802/jmd.19046.e. [DOI] [PMC free article] [PubMed] [Google Scholar]
- 15.Volpicelli-Daley LA, Luk KC, Patel TP, Tanik SA, Riddle DM, Stieber A, Meaney DF, Trojanowski JQ, and Lee VMY (2011). Exogenous alpha-Synuclein Fibrils Induce Lewy Body Pathology Leading to Synaptic Dysfunction and Neuron Death. Neuron 72, 57–71. 10.1016/j.neuron.2011.08.033. [DOI] [PMC free article] [PubMed] [Google Scholar]
- 16.Kim S, Kwon SH, Kam TI, Panicker N, Karuppagounder SS, Lee S, Lee JH, Kim WR, Kook M, Foss CA, et al. (2019). Transneuronal Propagation of Pathologic alpha-Synuclein from the Gut to the Brain Models Parkinson’s Disease. Neuron 103, 627-+. 10.1016/j.neuron.2019.05.035. [DOI] [PMC free article] [PubMed] [Google Scholar]
- 17.Park H, Kim NY, Lee S, Kim N, Kim J, and Heo WD (2017). Optogenetic protein clustering through fluorescent protein tagging and extension of CRY2. Nat Commun 8, 30. 10.1038/s41467-017-00060-2. [DOI] [PMC free article] [PubMed] [Google Scholar]
- 18.Devine MJ, Ryten M, Vodicka P, Thomson AJ, Burdon T, Houlden H, Cavaleri F, Nagano M, Drummond NJ, Taanman JW, et al. (2011). Parkinson’s disease induced pluripotent stem cells with triplication of the alpha-synuclein locus. Nat Commun 2, 440. 10.1038/ncomms1453. [DOI] [PMC free article] [PubMed] [Google Scholar]
- 19.Fedele S, Collo G, Behr K, Bischofberger J, Muller S, Kunath T, Christensen K, Gundner AL, Graf M, Jagasia R, and Taylor V (2017). Expansion of human midbrain floor plate progenitors from induced pluripotent stem cells increases dopaminergic neuron differentiation potential. Sci Rep 7, 6036. 10.1038/s41598-017-05633-1. [DOI] [PMC free article] [PubMed] [Google Scholar]
- 20.Kriks S, Shim JW, Piao J, Ganat YM, Wakeman DR, Xie Z, Carrillo-Reid L, Auyeung G, Antonacci C, Buch A, et al. (2011). Dopamine neurons derived from human ES cells efficiently engraft in animal models of Parkinson’s disease. Nature 480, 547–551. 10.1038/nature10648. [DOI] [PMC free article] [PubMed] [Google Scholar]
- 21.Braak H, Del Tredici K, Rub U, de Vos RAI, Steur ENHJ, and Braak E (2003). Staging of brain pathology related to sporadic Parkinson’s disease. Neurobiol Aging 24, 197–211. Pii S0197–4580(02)00065–9 Doi 10.1016/S0197-4580(02)00065-9. [DOI] [PubMed] [Google Scholar]
- 22.Kanazawa T, Uchihara T, Takahashi A, Nakamura A, Orimo S, and Mizusawa H (2008). Three-layered structure shared between Lewy bodies and Lewy neurites - Three-dimensional reconstruction of triple-labeled sections. Brain Pathol 18, 415–422. 10.1111/j.1750-3639.2008.00140.x. [DOI] [PMC free article] [PubMed] [Google Scholar]
- 23.Orimo S, Uchihara T, Nakamura A, Mori F, Kakita A, Wakabayashi K, and Takahashi H (2008). Axonal alpha-synuclein (alpha S) aggregates herald centripetal degeneration of cardiac sympathetic nerve in Parkinson’s disease (PD). Movement Disord 23, S19–S19. [DOI] [PubMed] [Google Scholar]
- 24.Kordower JH, Chu YP, Hauser RA, Freeman TB, and Olanow CW (2008). Lewy body-like pathology in long-term embryonic nigral transplants in Parkinson’s disease. Nat Med 14, 504–506. 10.1038/nm1747. [DOI] [PubMed] [Google Scholar]
- 25.Luk KC, Kehm V, Carroll J, Zhang B, O’Brien P, Trojanowski JQ, and Lee VMY (2012). Pathological alpha-Synuclein Transmission Initiates Parkinson-like Neurodegeneration in Nontransgenic Mice. Science 338, 949–953. 10.1126/science.1227157. [DOI] [PMC free article] [PubMed] [Google Scholar]
- 26.Spillantini MG, Schmidt ML, Lee VMY, Trojanowski JQ, Jakes R, and Goedert M (1997). alpha-synuclein in Lewy bodies. Nature 388, 839–840. Doi 10.1038/42166. [DOI] [PubMed] [Google Scholar]
- 27.Kovacs GG, Wagner U, Dumont B, Pikkarainen M, Osman AA, Streichenberger N, Leisser I, Verchere J, Baron T, Alafuzoff I, et al. (2012). An antibody with high reactivity for disease-associated alpha-synuclein reveals extensive brain pathology. Acta Neuropathol 124, 37–50. 10.1007/s00401-012-0964-x. [DOI] [PubMed] [Google Scholar]
- 28.Kovacs GG, Breydo L, Green R, Kis V, Puska G, Lorincz P, Perju-Dumbrava L, Giera R, Pirker W, Lutz M, et al. (2014). Intracellular processing of disease-associated alpha-synuclein in the human brain suggests prion-like cell-to-cell spread. Neurobiol. Dis. 69, 76–92. 10.1016/j.nbd.2014.05.020. [DOI] [PubMed] [Google Scholar]
- 29.Chen L, and Feany MB (2005). Alpha-synuclein phosphorylation controls neurotoxicity and inclusion formation in a Drosophila model of Parkinson disease. Nat Neurosci 8, 657–663. 10.1038/nn1443. [DOI] [PubMed] [Google Scholar]
- 30.Giasson BI, Duda JE, Quinn SM, Zhang B, Trojanowski JQ, and Lee VM (2002). Neuronal alpha-synucleinopathy with severe movement disorder in mice expressing A53T human alpha-synuclein. Neuron 34, 521–533. 10.1016/s0896-6273(02)00682-7. [DOI] [PubMed] [Google Scholar]
- 31.Kuusisto E, Parkkinen L, and Alafuzoff I (2003). Morphogenesis of Lewy bodies: dissimilar incorporation of alpha-synuclein, ubiquitin, and p62. J Neuropathol Exp Neurol 62, 1241–1253. 10.1093/jnen/62.12.1241. [DOI] [PubMed] [Google Scholar]
- 32.Lee HJ, Shin SY, Choi C, Lee YH, and Lee SJ (2002). Formation and removal of alpha-synuclein aggregates in cells exposed to mitochondrial inhibitors. J Biol Chem 277, 5411–5417. 10.1074/jbc.M105326200. [DOI] [PubMed] [Google Scholar]
- 33.Saucedo-Cardenas O, Quintana-Hau JD, Le WD, Smidt MP, Cox JJ, DeMayo F, Burbach JPH, and Conneely OM (1998). Nurr1 is essential for the induction of the dopaminergic phenotype and the survival of ventral mesencephalic late dopaminergic precursor neurons. Proceedings of the National Academy of Sciences of the United States of America 95, 4013–4018. DOI 10.1073/pnas.95.7.4013. [DOI] [PMC free article] [PubMed] [Google Scholar]
- 34.Bose A, and Beal MF (2016). Mitochondrial dysfunction in Parkinson’s disease. J Neurochem 139 Suppl 1, 216–231. 10.1111/jnc.13731. [DOI] [PubMed] [Google Scholar]
- 35.Exner N, Lutz AK, Haass C, and Winklhofer KF (2012). Mitochondrial dysfunction in Parkinson’s disease: molecular mechanisms and pathophysiological consequences. EMBO J 31, 3038–3062. 10.1038/emboj.2012.170. [DOI] [PMC free article] [PubMed] [Google Scholar]
- 36.Wong YC, and Krainc D (2017). alpha-synuclein toxicity in neurodegeneration: mechanism and therapeutic strategies. Nat Med 23, 151–163. 10.1038/nm.4269. [DOI] [PMC free article] [PubMed] [Google Scholar]
- 37.Delenclos M, Burgess JD, Lamprokostopoulou A, Outeiro TF, Vekrellis K, and McLean PJ (2019). Cellular models of alpha-synuclein toxicity and aggregation. Journal of Neurochemistry 150, 566–576. 10.1111/jnc.14806. [DOI] [PMC free article] [PubMed] [Google Scholar]
- 38.Patterson JR, Duffy MF, Kemp CJ, Howe JW, Collier TJ, Stoll AC, Miller KM, Patel P, Levine N, Moore DJ, et al. (2019). Time course and magnitude of alpha-synuclein inclusion formation and nigrostriatal degeneration in the rat model of synucleinopathy triggered by intrastriatal alpha-synuclein preformed fibrils. Neurobiol Dis 130, 104525. 10.1016/j.nbd.2019.104525. [DOI] [PMC free article] [PubMed] [Google Scholar]
- 39.Mahul-Mellier AL, Burtscher J, Maharjan N, Weerens L, Croisier M, Kuttler F, Leleu M, Knott GW, and Lashuel HA (2020). The process of Lewy body formation, rather than simply alpha-synuclein fibrillization, is one of the major drivers of neurodegeneration. Proceedings of the National Academy of Sciences of the United States of America 117, 4971–4982. 10.1073/pnas.1913904117. [DOI] [PMC free article] [PubMed] [Google Scholar]
- 40.Majbour NK, Vaikath NN, van Dijk KD, Ardah MT, Varghese S, Vesterager LB, Montezinho LP, Poole S, Safieh-Garabedian B, Tokuda T, et al. (2016). Oligomeric and phosphorylated alpha-synuclein as potential CSF biomarkers for Parkinson’s disease. Mol Neurodegener 11, 7. 10.1186/s13024-016-0072-9. [DOI] [PMC free article] [PubMed] [Google Scholar]
- 41.Woodard CM, Campos BA, Kuo SH, Nirenberg MJ, Nestor MW, Zimmer M, Mosharov EV, Sulzer D, Zhou H, Paull D, et al. (2014). iPSC-derived dopamine neurons reveal differences between monozygotic twins discordant for Parkinson’s disease. Cell Rep 9, 1173–1182. 10.1016/j.celrep.2014.10.023. [DOI] [PMC free article] [PubMed] [Google Scholar]
- 42.Jones DR, Delenclos M, Baine AT, DeTure M, Murray ME, Dickson DW, and McLean PJ (2015). Transmission of soluble and insoluble alpha-synuclein to mice. J Neuropathol Exp Neurol 74, 1158–1169. 10.1097/NEN.0000000000000262. [DOI] [PMC free article] [PubMed] [Google Scholar]
- 43.Kellie JF, Higgs RE, Ryder JW, Major A, Beach TG, Adler CH, Merchant K, and Knierman MD (2014). Quantitative Measurement of Intact Alpha-Synuclein Proteoforms from Post-Mortem Control and Parkinson’s Disease Brain Tissue by Intact Protein Mass Spectrometry. Sci. Rep. 4. ARTN 5797 10.1038/srep05797. [DOI] [PMC free article] [PubMed] [Google Scholar]
- 44.Zhang JH, Chung TD, and Oldenburg KR (1999). A Simple Statistical Parameter for Use in Evaluation and Validation of High Throughput Screening Assays. J Biomol Screen 4, 67–73. 10.1177/108705719900400206. [DOI] [PubMed] [Google Scholar]
- 45.Dzamko N, Gysbers A, Perera G, Bahar A, Shankar A, Gao J, Fu Y, and Halliday GM (2017). Toll-like receptor 2 is increased in neurons in Parkinson’s disease brain and may contribute to alpha-synuclein pathology. Acta Neuropathol 133, 303–319. 10.1007/s00401-016-1648-8. [DOI] [PMC free article] [PubMed] [Google Scholar]
- 46.Hedya SA, Safar MM, and Bahgat AK (2018). Cilostazol mediated Nurr1 and autophagy enhancement: neuroprotective activity in rat rotenone PD model. Mol Neurobiol 55, 7579–7587. 10.1007/s12035-018-0923-1. [DOI] [PubMed] [Google Scholar]
- 47.McLeary FA, Rcom-H’cheo-Gauthier AN, Kinder J, Goulding M, Khoo TK, Mellick GD, Chung RS, and Pountney DL (2018). Dexamethasone inhibits copper-induced alpha-synuclein aggregation by a metallothionein-dependent mechanism. Neurotox Res 33, 229–238. 10.1007/s12640-017-9825-7. [DOI] [PubMed] [Google Scholar]
- 48.Qin H, Buckley JA, Li X, Liu Y, Fox TH 3rd, Meares GP, Yu H, Yan Z, Harms AS, Li Y, et al. (2016). Inhibition of the JAK/STAT pathway protects against alpha-synuclein-induced neuroinflammation and dopaminergic neurodegeneration. J Neurosci 36, 5144–5159. 10.1523/JNEUROSCI.4658-15.2016. [DOI] [PMC free article] [PubMed] [Google Scholar]
- 49.Kelava I, and Lancaster MA (2016). Stem Cell Models of Human Brain Development. Cell stem cell 18, 736–748. 10.1016/j.stem.2016.05.022. [DOI] [PubMed] [Google Scholar]
- 50.Jo J, Xiao Y, Sun AX, Cukuroglu E, Tran HD, Goke J, Tan ZY, Saw TY, Tan CP, Lokman H, et al. (2016). Midbrain-like Organoids from Human Pluripotent Stem Cells Contain Functional Dopaminergic and Neuromelanin-Producing Neurons. Cell stem cell 19, 248–257. 10.1016/j.stem.2016.07.005. [DOI] [PMC free article] [PubMed] [Google Scholar]
- 51.Qian X, Nguyen HN, Song MM, Hadiono C, Ogden SC, Hammack C, Yao B, Hamersky GR, Jacob F, Zhong C, et al. (2016). Brain-Region-Specific Organoids Using Mini-bioreactors for Modeling ZIKV Exposure. Cell 165, 1238–1254. 10.1016/j.cell.2016.04.032. [DOI] [PMC free article] [PubMed] [Google Scholar]
- 52.Kwak TH, Kang JH, Hali S, Kim J, Kim KP, Park C, Lee JH, Ryu HK, Na JE, Jo J, et al. (2020). Generation of homogeneous midbrain organoids with in vivo-like cellular composition facilitates neurotoxin-based Parkinson’s disease modeling. Stem Cells 38, 727–740. 10.1002/stem.3163. [DOI] [PubMed] [Google Scholar]
- 53.Rocha NP, de Miranda AS, and Teixeira AL (2015). Insights into Neuroinflammation in Parkinson’s Disease: From Biomarkers to Anti-Inflammatory Based Therapies. Biomed Res Int 2015, 628192. 10.1155/2015/628192. [DOI] [PMC free article] [PubMed] [Google Scholar]
- 54.Shen R, Lin S, He L, Zhu X, Zhou Z, Chen S, Wang Y, and Ding J (2019). Association of Two Polymorphisms in CCL2 With Parkinson’s Disease: A Case-Control Study. Front Neurol 10, 35. 10.3389/fneur.2019.00035. [DOI] [PMC free article] [PubMed] [Google Scholar]
- 55.Li Y, Niu M, Zhao A, Kang W, Chen Z, Luo N, Zhou L, Zhu X, Lu L, and Liu J (2019). CXCL12 is involved in alpha-synuclein-triggered neuroinflammation of Parkinson’s disease. J Neuroinflammation 16, 263. 10.1186/s12974-019-1646-6. [DOI] [PMC free article] [PubMed] [Google Scholar]
- 56.Seo BA, Kim D, Hwang H, Kim MS, Ma SX, Kwon SH, Kweon SH, Wang H, Yoo JM, Choi S, et al. (2021). TRIP12 ubiquitination of glucocerebrosidase contributes to neurodegeneration in Parkinson’s disease. Neuron 109, 3758–3774 e3711. 10.1016/j.neuron.2021.09.031. [DOI] [PMC free article] [PubMed] [Google Scholar]
- 57.Cuervo AM, Stefanis L, Fredenburg R, Lansbury PT, and Sulzer D (2004). Impaired degradation of mutant alpha-synuclein by chaperone-mediated autophagy. Science 305, 1292–1295. 10.1126/science.1101738. [DOI] [PubMed] [Google Scholar]
- 58.Webb JL, Ravikumar B, Atkins J, Skepper JN, and Rubinsztein DC (2003). Alpha-Synuclein is degraded by both autophagy and the proteasome. J Biol Chem 278, 25009–25013. 10.1074/jbc.M300227200. [DOI] [PubMed] [Google Scholar]
- 59.Klionsky DJ, and Emr SD (2000). Autophagy as a regulated pathway of cellular degradation. Science 290, 1717–1721. 10.1126/science.290.5497.1717. [DOI] [PMC free article] [PubMed] [Google Scholar]
- 60.Simonsen A, and Tooze SA (2009). Coordination of membrane events during autophagy by multiple class III PI3-kinase complexes. J Cell Biol 186, 773–782. 10.1083/jcb.200907014. [DOI] [PMC free article] [PubMed] [Google Scholar]
- 61.Bieri G, Brahic M, Bousset L, Couthouis J, Kramer NJ, Ma R, Nakayama L, Monbureau M, Defensor E, Schule B, et al. (2019). LRRK2 modifies alpha-syn pathology and spread in mouse models and human neurons. Acta Neuropathologica 137, 961–980. 10.1007/s00401-019-01995-0. [DOI] [PMC free article] [PubMed] [Google Scholar]
- 62.Fields CR, Bengoa-Vergniory N, and Wade-Martins R (2019). Targeting Alpha-Synuclein as a Therapy for Parkinson’s Disease. Front Mol Neurosci 12. ARTN 299. 10.3389/fnmol.2019.00299. [DOI] [PMC free article] [PubMed] [Google Scholar]
- 63.Henderson MX, Cornblath EJ, Darwich A, Zhang B, Brown H, Gathagan RJ, Sandler RM, Bassett DS, Trojanowski JQ, and Lee VMY (2019). Spread of alpha-synuclein pathology through the brain connectome is modulated by selective vulnerability and predicted by network analysis. Nature Neuroscience 22, 1248-+. 10.1038/s41593-019-0457-5. [DOI] [PMC free article] [PubMed] [Google Scholar]
- 64.Mahul-Mellier AL, Fauvet B, Gysbers A, Dikiy I, Oueslati A, Georgeon S, Lamontanara AJ, Bisquertt A, Eliezer D, Masliah E, et al. (2014). c-Abl phosphorylates alpha-synuclein and regulates its degradation: implication for alpha-synuclein clearance and contribution to the pathogenesis of Parkinson’s disease. Hum Mol Genet 23, 2858–2879. 10.1093/hmg/ddt674. [DOI] [PMC free article] [PubMed] [Google Scholar]
- 65.Polymeropoulos MH, Lavedan C, Leroy E, Ide SE, Dehejia A, Dutra A, Pike B, Root H, Rubenstein J, Boyer R, et al. (1997). Mutation in the alpha-synuclein gene identified in families with Parkinson’s disease. Science 276, 2045–2047. DOI 10.1126/science.276.5321.2045. [DOI] [PubMed] [Google Scholar]
- 66.Thakur P, Breger LS, Lundblad M, Wan OW, Mattsson B, Luk KC, Lee VMY, Trojanowski JQ, and Bjorklund A (2017). Modeling Parkinson’s disease pathology by combination of fibril seeds and alpha-synuclein overexpression in the rat brain. Proceedings of the National Academy of Sciences of the United States of America 114, E8284–E8293. 10.1073/pnas.1710442114. [DOI] [PMC free article] [PubMed] [Google Scholar]
- 67.Winner B, Jappelli R, Maji SK, Desplats PA, Boyer L, Aigner S, Hetzer C, Loher T, Vilar M, Campioni S, et al. (2011). In vivo demonstration that alpha-synuclein oligomers are toxic. Proceedings of the National Academy of Sciences of the United States of America 108, 4194–4199. 10.1073/pnas.1100976108. [DOI] [PMC free article] [PubMed] [Google Scholar]
- 68.Zoncu R, Efeyan A, and Sabatini DM (2011). mTOR: from growth signal integration to cancer, diabetes and ageing. Nat Rev Mol Cell Biol 12, 21–35. 10.1038/nrm3025. [DOI] [PMC free article] [PubMed] [Google Scholar]
- 69.Liu P, Gan W, Chin YR, Ogura K, Guo J, Zhang J, Wang B, Blenis J, Cantley LC, Toker A, et al. (2015). PtdIns(3,4,5)P3-Dependent Activation of the mTORC2 Kinase Complex. Cancer Discov 5, 1194–1209. 10.1158/2159-8290.CD-15-0460. [DOI] [PMC free article] [PubMed] [Google Scholar]
- 70.Hresko RC, and Mueckler M (2005). mTOR.RICTOR is the Ser473 kinase for Akt/protein kinase B in 3T3-L1 adipocytes. J Biol Chem 280, 40406–40416. 10.1074/jbc.M508361200. [DOI] [PubMed] [Google Scholar]
- 71.Dibble CC, and Manning BD (2013). Signal integration by mTORC1 coordinates nutrient input with biosynthetic output. Nat Cell Biol 15, 555–564. 10.1038/ncb2763. [DOI] [PMC free article] [PubMed] [Google Scholar]
- 72.Serra V, Markman B, Scaltriti M, Eichhorn PJ, Valero V, Guzman M, Botero ML, Llonch E, Atzori F, Di Cosimo S, et al. (2008). NVP-BEZ235, a dual PI3K/mTOR inhibitor, prevents PI3K signaling and inhibits the growth of cancer cells with activating PI3K mutations. Cancer Res 68, 8022–8030. 10.1158/0008-5472.CAN-08-1385. [DOI] [PubMed] [Google Scholar]
- 73.Kong D, and Yamori T (2008). Phosphatidylinositol 3-kinase inhibitors: promising drug candidates for cancer therapy. Cancer Sci 99, 1734–1740. 10.1111/j.1349-7006.2008.00891.x. [DOI] [PMC free article] [PubMed] [Google Scholar]
- 74.Kim JW, Yin X, Jhaldiyal A, Khan MR, Martin I, Xie Z, Perez-Rosello T, Kumar M, Abalde-Atristain L, Xu J, et al. (2020). Defects in mRNA Translation in LRRK2-Mutant hiPSC-Derived Dopaminergic Neurons Lead to Dysregulated Calcium Homeostasis. Cell stem cell 27, 633–645 e637. 10.1016/j.stem.2020.08.002. [DOI] [PMC free article] [PubMed] [Google Scholar]
- 75.Shipley MM, Mangold CA, and Szpara ML (2016). Differentiation of the SH-SY5Y human neuroblastoma cell line. J Vis Exp, 53193. 10.3791/53193. [DOI] [PMC free article] [PubMed] [Google Scholar]
- 76.Kim N, Kim JM, Lee M, Kim CY, Chang KY, and Heo WD (2014). Spatiotemporal control of fibroblast growth factor receptor signals by blue light. Chemistry & biology 21, 903–912. 10.1016/j.chembiol.2014.05.013. [DOI] [PubMed] [Google Scholar]
- 77.Riessland M, Kolisnyk B, Kim TW, Cheng J, Ni J, Pearson JA, Park EJ, Dam K, Acehan D, Ramos-Espiritu LS, et al. (2019). Loss of SATB1 Induces p21-Dependent Cellular Senescence in Post-mitotic Dopaminergic Neurons. Cell stem cell 25, 514–530 e518. 10.1016/j.stem.2019.08.013. [DOI] [PMC free article] [PubMed] [Google Scholar]
- 78.Guo JL, Covell DJ, Daniels JP, Iba M, Stieber A, Zhang B, Riddle DM, Kwong LK, Xu Y, Trojanowski JQ, and Lee VM (2013). Distinct alpha-synuclein strains differentially promote tau inclusions in neurons. Cell 154, 103–117. 10.1016/j.cell.2013.05.057. [DOI] [PMC free article] [PubMed] [Google Scholar]
- 79.Schneider CA, Rasband WS, and Eliceiri KW (2012). NIH Image to ImageJ: 25 years of image analysis. Nat Methods 9, 671–675. 10.1038/nmeth.2089. [DOI] [PMC free article] [PubMed] [Google Scholar]
Associated Data
This section collects any data citations, data availability statements, or supplementary materials included in this article.
Supplementary Materials
Video S1. Formation of mCherry+ opto-α-syn aggregates with acute blue light stimulation (1.5 μW at 488nm, 0.5 Hz, 1 s) using live-cell imaging in opto-α-syn-expressing PD hiPSC-derived mDA neurons, Related to Figure 1
Video S2. Formation of mCherry+ opto-mock aggregates with acute blue light stimulation (1.5 μW at 488nm, 0.5 Hz, 1 s) using live-cell imaging in opto-mock-expressing PD hiPSC-derived mDA neurons, Related to Figure 1
Video S3. mCherry+ opto-α-syn aggregation with acute blue light stimulation (1.5 μW at 488nm, 0.25 Hz, 1 s) using live-cell imaging in opto-α-syn-expressing PD hiPSC-derived mDA neurons, Related to Figure 1
Video S4. mCherry+ opto-α-mock aggregation with acute blue light stimulation (1.5 μW at 488nm, 0.25 Hz, 1 s) using live-cell imaging in opto-mock-expressing PD hiPSC-derived mDA neurons, Related to Figure 1
Video S5. Spatially controlled mCherry+ opto-α-syn aggregates with acute blue light stimulation (blue circle; 1.5 μW at 488nm, 0.17 Hz, 1 s) using live-cell imaging in opto-α-syn-expressing PD hiPSC-derived mDA neurons, Related to Figure 1
Video S6. Formation of mCherry+ opto-α-syn aggregates with acute blue light stimulation (1.5 μW at 488nm, 0.17 Hz, 1 s) using live-cell imaging in the cell body of opto-α-syn-expressing PD hiPSC-derived mDA neurons, Related to Figure 1
Video S7. Formation of mCherry+ opto-α-syn aggregates with acute blue light stimulation (1.5 μW at 488nm, 0.17 Hz, 1 s) using live-cell imaging in the neurite of opto-α-syn-expressing PD hiPSC-derived mDA neurons, Related to Figure 1
Video S8. Transmission of mCherry+ opto-α-syn aggregates with acute blue light stimulation into AAVS1::eGFP mDA neurons in co-culture model, Related to Figure 1
Data Availability Statement
All data reported in this paper will be shared by the lead contact upon request.
This paper does not report original code.
Any additional information required to reanalyze the data reported in this paper is available from the lead contact upon request.