

Abstract
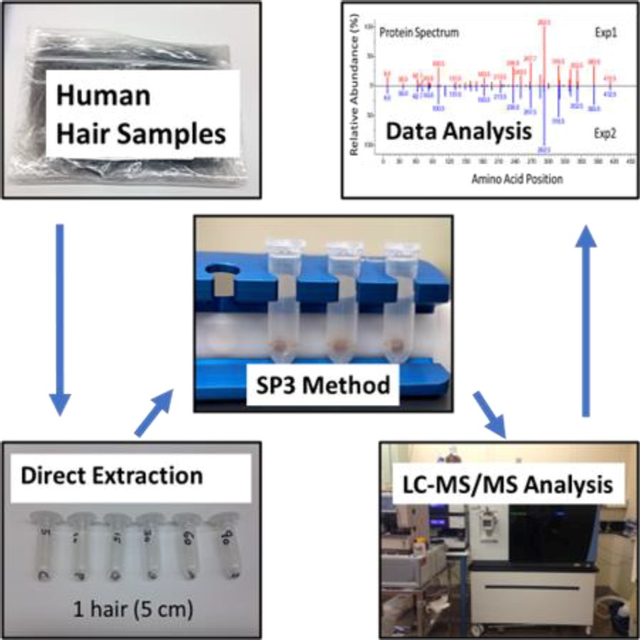
A fast and sensitive Direct Extraction (DE) method developed in our group can efficiently extract proteins in 30 min from a 5 cm-long hair strand. Previously we coupled DE to downstream analysis using gel electrophoresis followed by in-gel digestion, which can be time-consuming. In searching for a better alternative, we found that a combination of DE with a bead-based method (SP3) can lead to significant improvements in protein discovery from the human hair. Since SP3 is designed for general applications, we optimized it to process hair proteins following DE and compared it to several other in-solution-digestion methods. Of particular concern are genetically variant peptides (GVPs), which can be used for human identification in forensic analysis. Here we demonstrated improved GVP discovery with the DE and SP3 workflow which was three times faster than the previous in-gel digestion method and required significantly less instrument time depending on the number of gel slices processed. Additionally, it led to increased numbers of identified proteins and GVPs. Among the tested in-solution digestion methods, DE combined with SP3 showed the highest sequence coverage with higher abundances of the identified peptides. This provides a significantly enhanced means for identifying proteins and GVPs in human hair.
Keywords: SP3 method, variant peptide discovery, protein spectrum, reproducibility, trace detection
Graphical Abstract
INTRODUCTION
Protein and peptide identification from hair samples is difficult due to heavy cross-linking and the poor solubility of hair keratins and keratin-associate proteins.1,2 Previously, we developed a method called the Direct Extraction (DE) method3 to efficiently extract hair proteins from a single 5 cm-long hair strand. This method simplified the protein extraction because it involves only placing the hair sample in SDS-PAGE sample loading buffer with dithiothreitol (DTT) and heating at 90 °C for 30 min.
At the time we developed the DE method, we coupled it with SDS-PAGE for protein separation and purification, then with in-gel digestion to generate digested peptides for downstream liquid chromatography-tandem mass spectrometry (LC-MS/MS) analysis. Since SDS-PAGE and in-gel digestion are time-consuming and laborious, we sought to further simplify the process. The recently published SP3 method,4 which is based on Sera-Mag Carboxylate-Modified magnetic beads, provides an efficient and fast nonselective binding of proteins to the beads, thereby separating proteins from chemicals or contaminants in the extraction buffer. Proteins are immobilized on beads and enzymatic digestion can be carried out directly on the beads. The whole procedure, from the beginning of sample preparation to the end, can be performed in one Eppendorf tube. These advantages make SP3 a straightforward and reliable method for sample preparation after proteins have been extracted and a method that has the potential to be used for automated sample preparation. The SP3 method has been used in a wide range of proteomics studies from single cell human oocyte5 to different types of cell lines6,7 and from normal tissues like nephron8 to tumor tissues such as formalin fixed tumor sections.9 However, to our knowledge there has been no literature report that applies the SP3 method to proteins extracted from human hair samples. Since the original published protocol is for general applications, we needed to optimize it for processing proteins extracted from hair samples.
In this manuscript, we describe an SP3 protocol optimized for this purpose by finding several optimal experimental conditions for processing human hair samples, which included binding, washing, pH, bead ratio, and bead-to-protein ratio. The optimized SP3, when combined with the DE method, greatly simplified, and accelerated sample preparation for studying the hair proteome. Reproducibility is critically important to proteomic studies. We tested other in-solution-digestion methods and found the DE method combined with SP3 not only was more efficient but also resulted in higher reproducibility. In addition, the new DE and SP3 workflow proved effective at discovering genetically variant peptides (GVPs) derived from human hair proteins which have been studied as alternative evidence for human identification in forensics.10,11,12 Furthermore, we applied a newly developed data analysis software tool that creates protein “spectra” for accurate quantification. Putting all these together, we present here a simple, efficient, and reproducible workflow for protein extraction, purification, digestion, and data analysis, leading to improved protein and GVP detection from trace amounts of human hair.
METHOD
Human Hair Sample Preparation
We used hair shafts from a randomly selected Asian male donor (AM, 30 years old) to set up our methods. Hair samples from AM donor were commercially obtained from BioreclamationIVT (LOT# BRH1363732). We briefly washed hair shafts with 20 % methanol by volume and water, then dried and stored them at −20 °C (at −80 °C for a long-term storage). The National Institute of Standards and Technology (NIST) Forensic Special Program Office (SPO) has supported this project as part of a Trace Evidence Research Program. The related protocols have been reviewed and approved by the NIST Human Subjects Review Board on a yearly basis.
Optimized SP3 Method
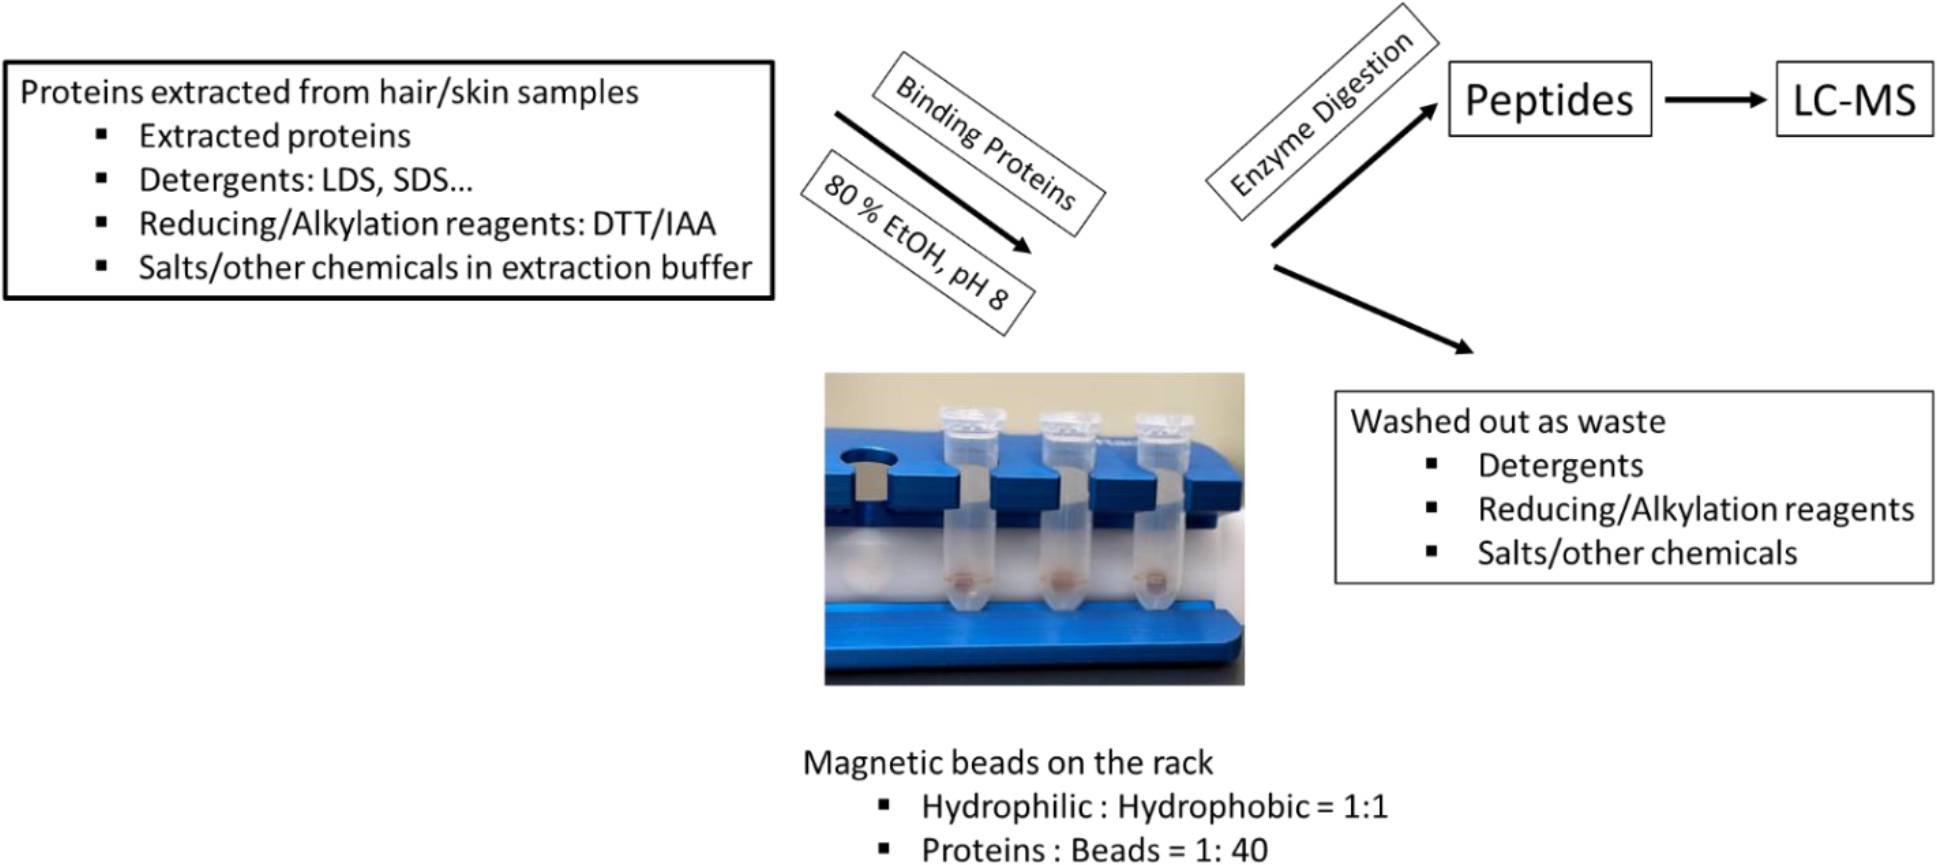
Proteins were extracted from single 5 cm-long hair shafts of this AM donor by the DE method, reduced (50 mmol/L DTT), and alkylated using the workflow previously published,3 followed by purification and digestion with the SP3 method4 optimized under these conditions (Figure 1 shows the workflow):
Figure 1.
Optimized Workflow for Human Hair Samples
Figure 1. Proteins were extracted, reduced, and alkylated, followed by purification and digestion using the optimized SP3 magnetic-bead method: the protein-to-total-bead (hydrophilic+hydrophobic) ratio was 1:40 (protein : bead/type = 1:20; equal mixture of the two types of beads); adding pure EtOH to a final concentration of 80 % (pH=8); immobilizing the beads on a magnetic rack and washing away contaminants with 80 % EtOH three times; performing enzyme digestion as described in the METHOD section.
total bead-to-protein (hydrophilic (Cytiva, 45152105050250) + hydrophobic (Cytiva, 65152105050250)) ratio was 40:1
adding pure ethanol (EtOH) to a final concentration of 80 % by volume (pH=8), which was the optimal solvent condition for binding hair proteins to the beads (will be described in more details in the RESULTS AND DISCUSSION)
immobilizing the beads on a magnetic rack (Cytiva, MagRack6, 28948964) and completing three 80 % EtOH washes to remove chemicals and contaminants
performing the enzyme digestion in the same tube using trypsin and LysC (Promega, V5111 and V1671) with enzyme-to-protein ratio 1: 20 and an 18-hour incubation period at 37 °C
peptides were cleaned up with MonoSpin C18 columns (GL Sciences Inc., 5010–21701) for LC-MS/MS on a Thermo Scientific Orbitrap Fusion Lumos mass spectrometer as described previously3
Other Tested Methods
In-solution digestion method 1
Anionic surfactant (AS: Waters, RapiGest surfactant, 186001861) based method:
AS_A: 1 % of AS with 50 mmol/L DTT at 60 °C for 30 min following the instruction of the product
AS_B: 1 % of AS at 60 °C for 30 min, followed by 10 mmol/L tris (2-carboxyethyl) phosphine (TCEP, Thermo, 77720) at room temperature for an hour
AS_C: 1 % of AS at 100 °C for 30 min, followed by 10 mmol/L TCEP at temperature for an hour
In-solution digestion method 2
Guanidine (G: Sigma, G4505) based method:
G_A: 6 mol/L of G with 50 mmol/L DTT at 40 °C for 30 min
G_B: 6 mol/L of G with 50 mmol/L DTT at 95 °C for 30 min
Alkylation, enzyme digestion, and peptide cleanup were the same as the SP3 method. The starting material was one single 5 cm-long hair strand in each experiment.
Expanded FASTA File
Human protein FASTA file (downloaded from NCBI, January 2022) with 20,375 sequences was expanded by adding mutations reported by BioMuta13 for 54 keratins with 7,554 proposed mutations and 92 keratin-associated proteins with 4,534 proposed mutations. These mutations are either genetic variants or disease related variants. For each mutation, a separate sequence entry was created in the FASTA file. For that purpose, we first took the reference protein sequence containing a mutation site and trimmed it to keep up to 40 flanking amino acids on both sides of the site. For a mutation site closer to the protein N- or C-terminus, the flanking amino acids could be less than 40. We then replaced the mutation site with the mutant (or variant) amino acid. Thus, most mutant sequence entries were 81 amino acids in length with the variant residue occupying the center position. An identified peptide was considered a GVP only if it mapped to a mutant sequence and also contained a mutant amino acid.
Sequence Database Searching
We used Sequest14 (Proteome Discoverer 2.4) and MSFragger15 (v3.4) for database searching with a precursor ion tolerance of 20 ppm and fragment ion tolerance of 50 ppm. The top scoring peptide identification was selected, and the false discovery rate level set at 1 % using the FASTA file described above. Settings for modifications are: 1) dynamic modification: oxidation (O) on Methionine (M); 2) static modification: carbamidomethyl (CAM) on cysteine (C). Different search engines used different validation tools: target-decoy for Sequest (S) and percolator for MSFragger (F).
Data Analysis Software
A program was developed to extract data from the MSFragger output. Abundances of identified peptides were taken from extracted ion chromatogram (XIC) peak areas. Protein “spectra”, where each peak is an identified peptide sequence, were used to show the reproducibility of a method. NIST MS Search,16 widely distributed for displaying and comparing reference mass spectra collected in spectral libraries, was adapted to display and compare these protein spectra. Details about the data analysis software tool was described elsewhere.17
Data availability: all raw data files are available on MassIVE (MSV000093203).
RESULTS AND DISCUSSION
Optimizing the SP3 Method for Hair Analysis
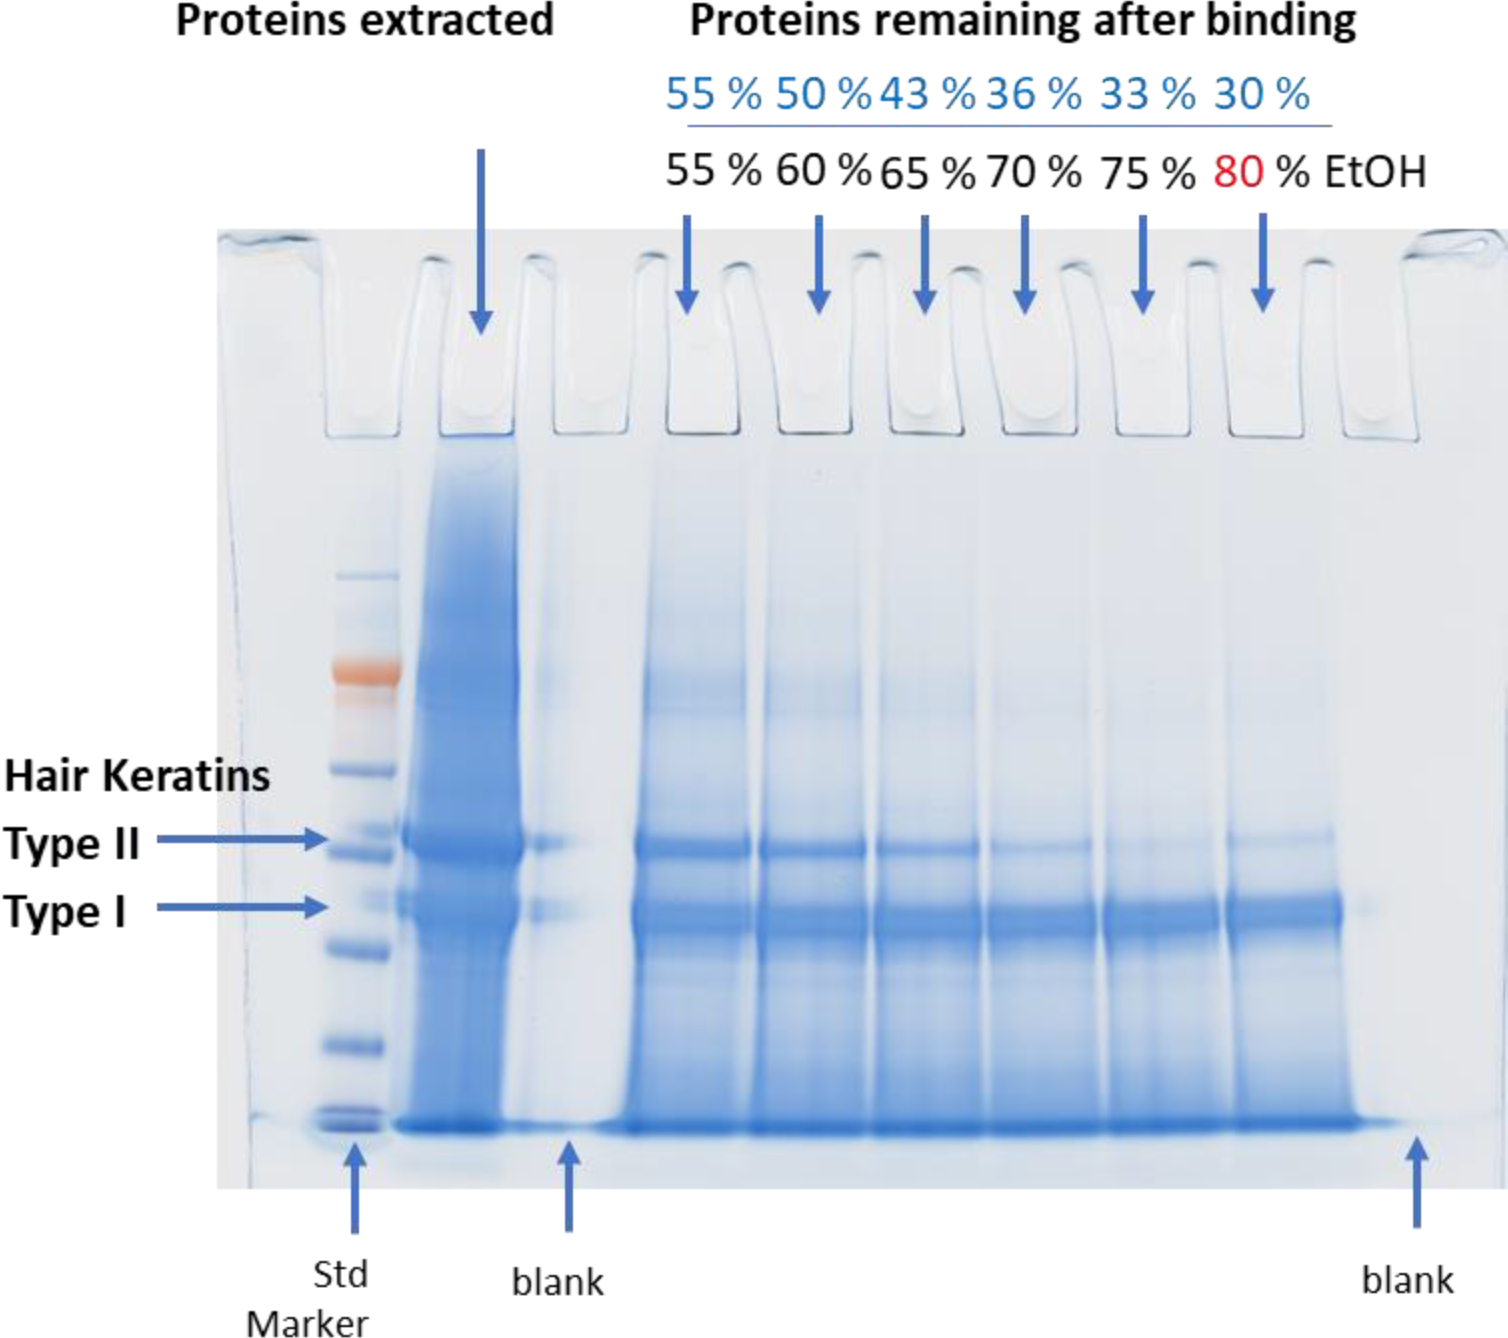
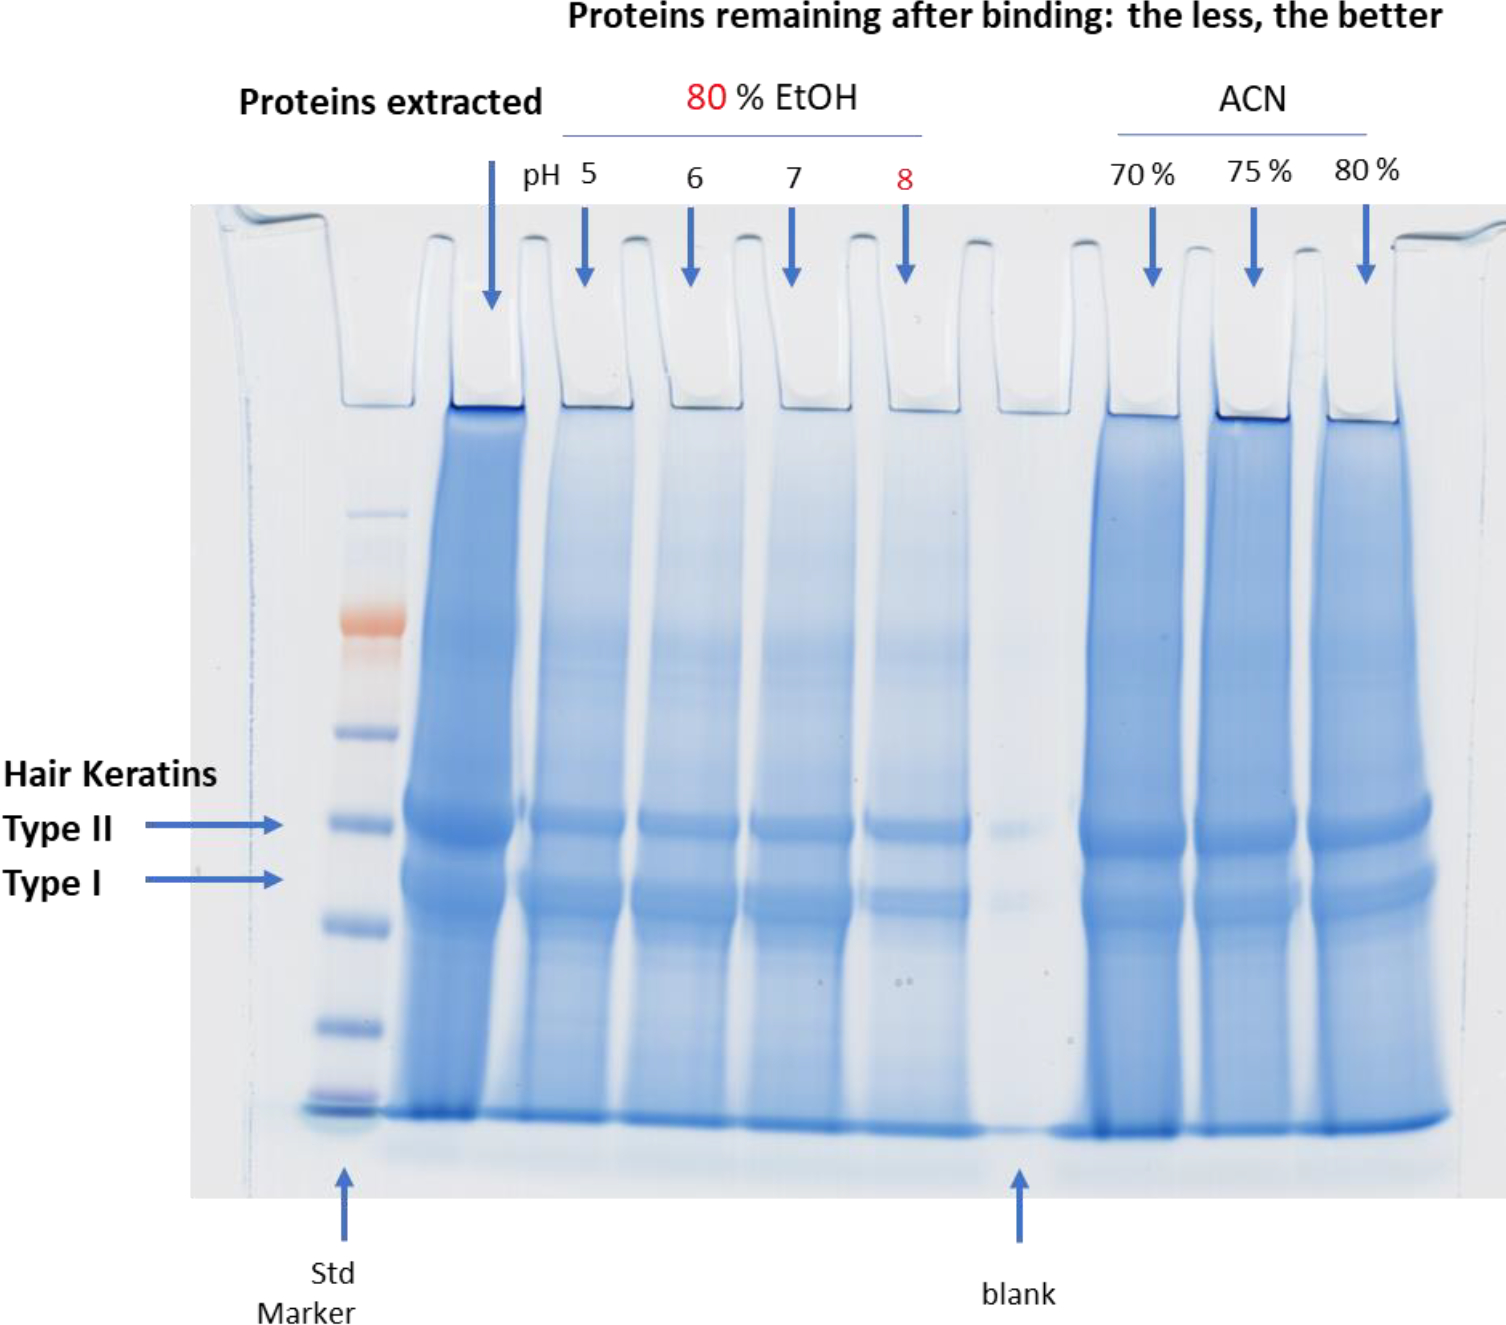
Initial optimization of the SP3 method was performed with extracted hair proteins. Several experimental conditions (the final concentration of EtOH, pH value, the amount of beads,…etc.) were tested to ensure optimal results for processing hair proteins following the DE extraction. We first tested the binding condition by varying the EtOH concentration from 55 % to 80 % by volume and collected the supernatant after incubation with the beads for 20 min. SDS-PAGE (Figure 2) was used to find the percentage of unbound proteins in the supernatant. The least sample loss (30 %) was found at 80 % EtOH. Higher concentrations (90 % of EtOH) led to bead aggregation making them unusable. As shown in Figure 3, we also examined acetonitrile (ACN) concentration from 70 % to 80 % and found more unbound proteins than EtOH, suggesting acetonitrile is less efficient for binding. The effect of pH on binding was assessed by adding formic acid to adjust pH from 8 down to 5 (Figure 3). The optimal pH for protein binding to the beads was 8. This optimized pH value may explain why type II hair cuticular keratins (KRT 81– 86, neutral or basic19) bind more to beads than type I hair cuticular keratins (KRT 31 – 38, acidic18) according to the SDS-PAGE image shown in Figure 2. For the number of beads to use, we started with 20:1 (total bead-to-protein ratio) and later discovered that adding more beads (30:1, 40:1, and 50:1) did not further increase binding efficiency (Figure 4). However, it was difficult to work with fewer beads (e.g., 20:1) when digesting small amounts of proteins due to pipetting difficulties. Thus, we kept the total bead-to-protein ratio at 40:1 throughout this study. In addition, there was no effect if we changed the mixing ratio of the two types of beads (Figure 4).
Figure 2.
Binding Condition Optimization for the SP3 Method for Human Hair Samples Using Ethanol
Figure 2. Initial optimization of the SP3 method was performed with extracted hair proteins. We first tested the binding condition by varying the EtOH concentration from 55 % to 80 % and collected the supernatant after incubating with the beads for 20 min. SPS-PAGE was used to check the percentage of unbound proteins in the supernatant. The least sample loss (30 %) was found to be at 80 % EtOH. Increasing EtOH concentration facilitated type II hair cuticular keratins to bind to the beads while not changing the binding of type I hair cuticular keratins18 might be due to a basic condition (pH 8) of the extraction buffer, since type II hair cuticular keratins are neutral to basic.19
Figure 3.
pH and ACN Optimization for Binding Proteins to Beads in the SP3 Method for Human Hair Samples
Figure 3. Examination of effects of pH on binding by adding formic acid to adjust pH in EtOH at 80 % and ACN at different aqueous concentrations. Supernatant was collected after incubating with the beads for 20 min. SPS-PAGE was used to check the unbound proteins in the supernatant. EtOH pH 8 was optimal.
Figure 4.
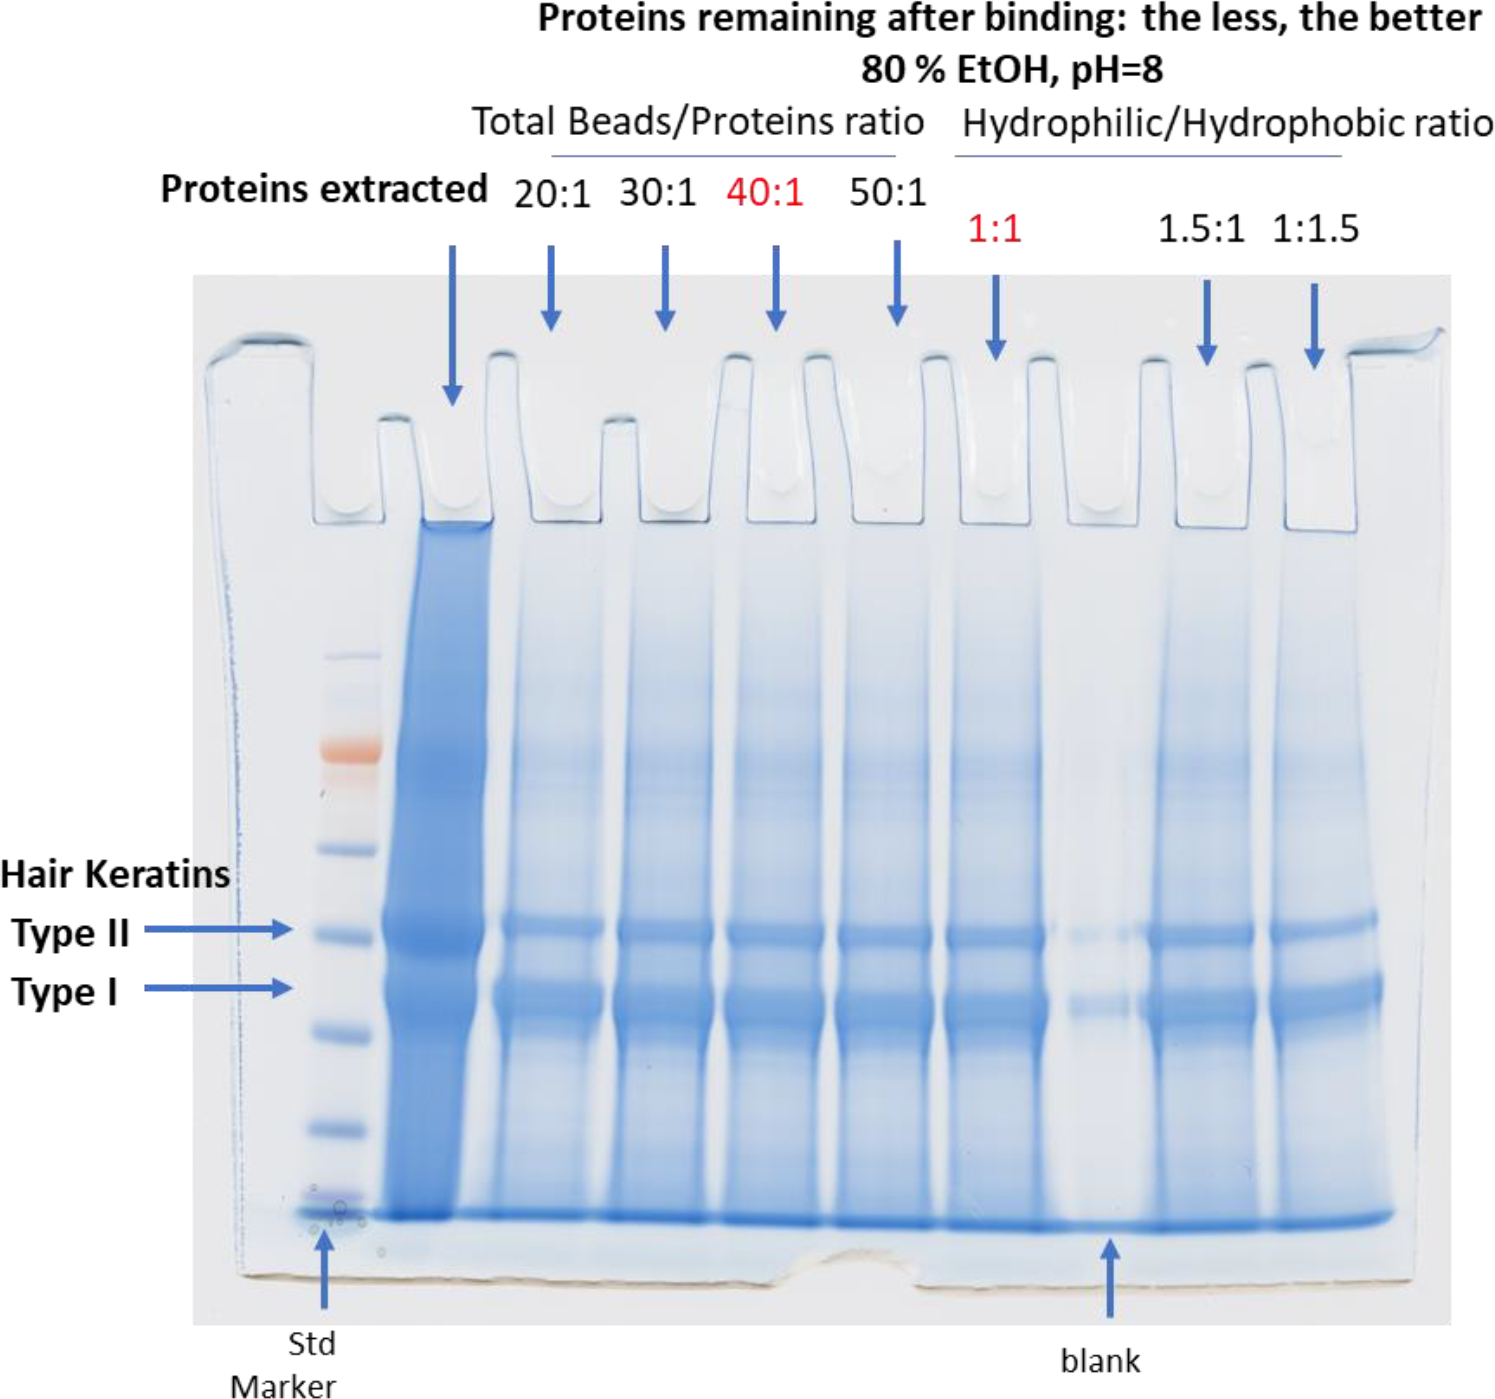
Optimizing the Number of Beads Needed for the SP3 Method for Human Hair Samples.
Figure 4. Optimization studies of number of beads for total bead-to-protein ratio starting at 20:1 with EtOH at 80 % and pH 8. Supernatant was collected after incubating beads for 20 min. SPS-PAGE was used to check the unbound proteins in the supernatant. Adding more beads (30:1, 40:1, and 50:1) did not further increase the binding efficiency. Changing the mixing ratio of two types of beads (hydrophilic/hydrophobic = 1:1, 1.5:1, or 1:1.5) also had no effect on binding.
Reproducibility of the Optimized SP3 Method
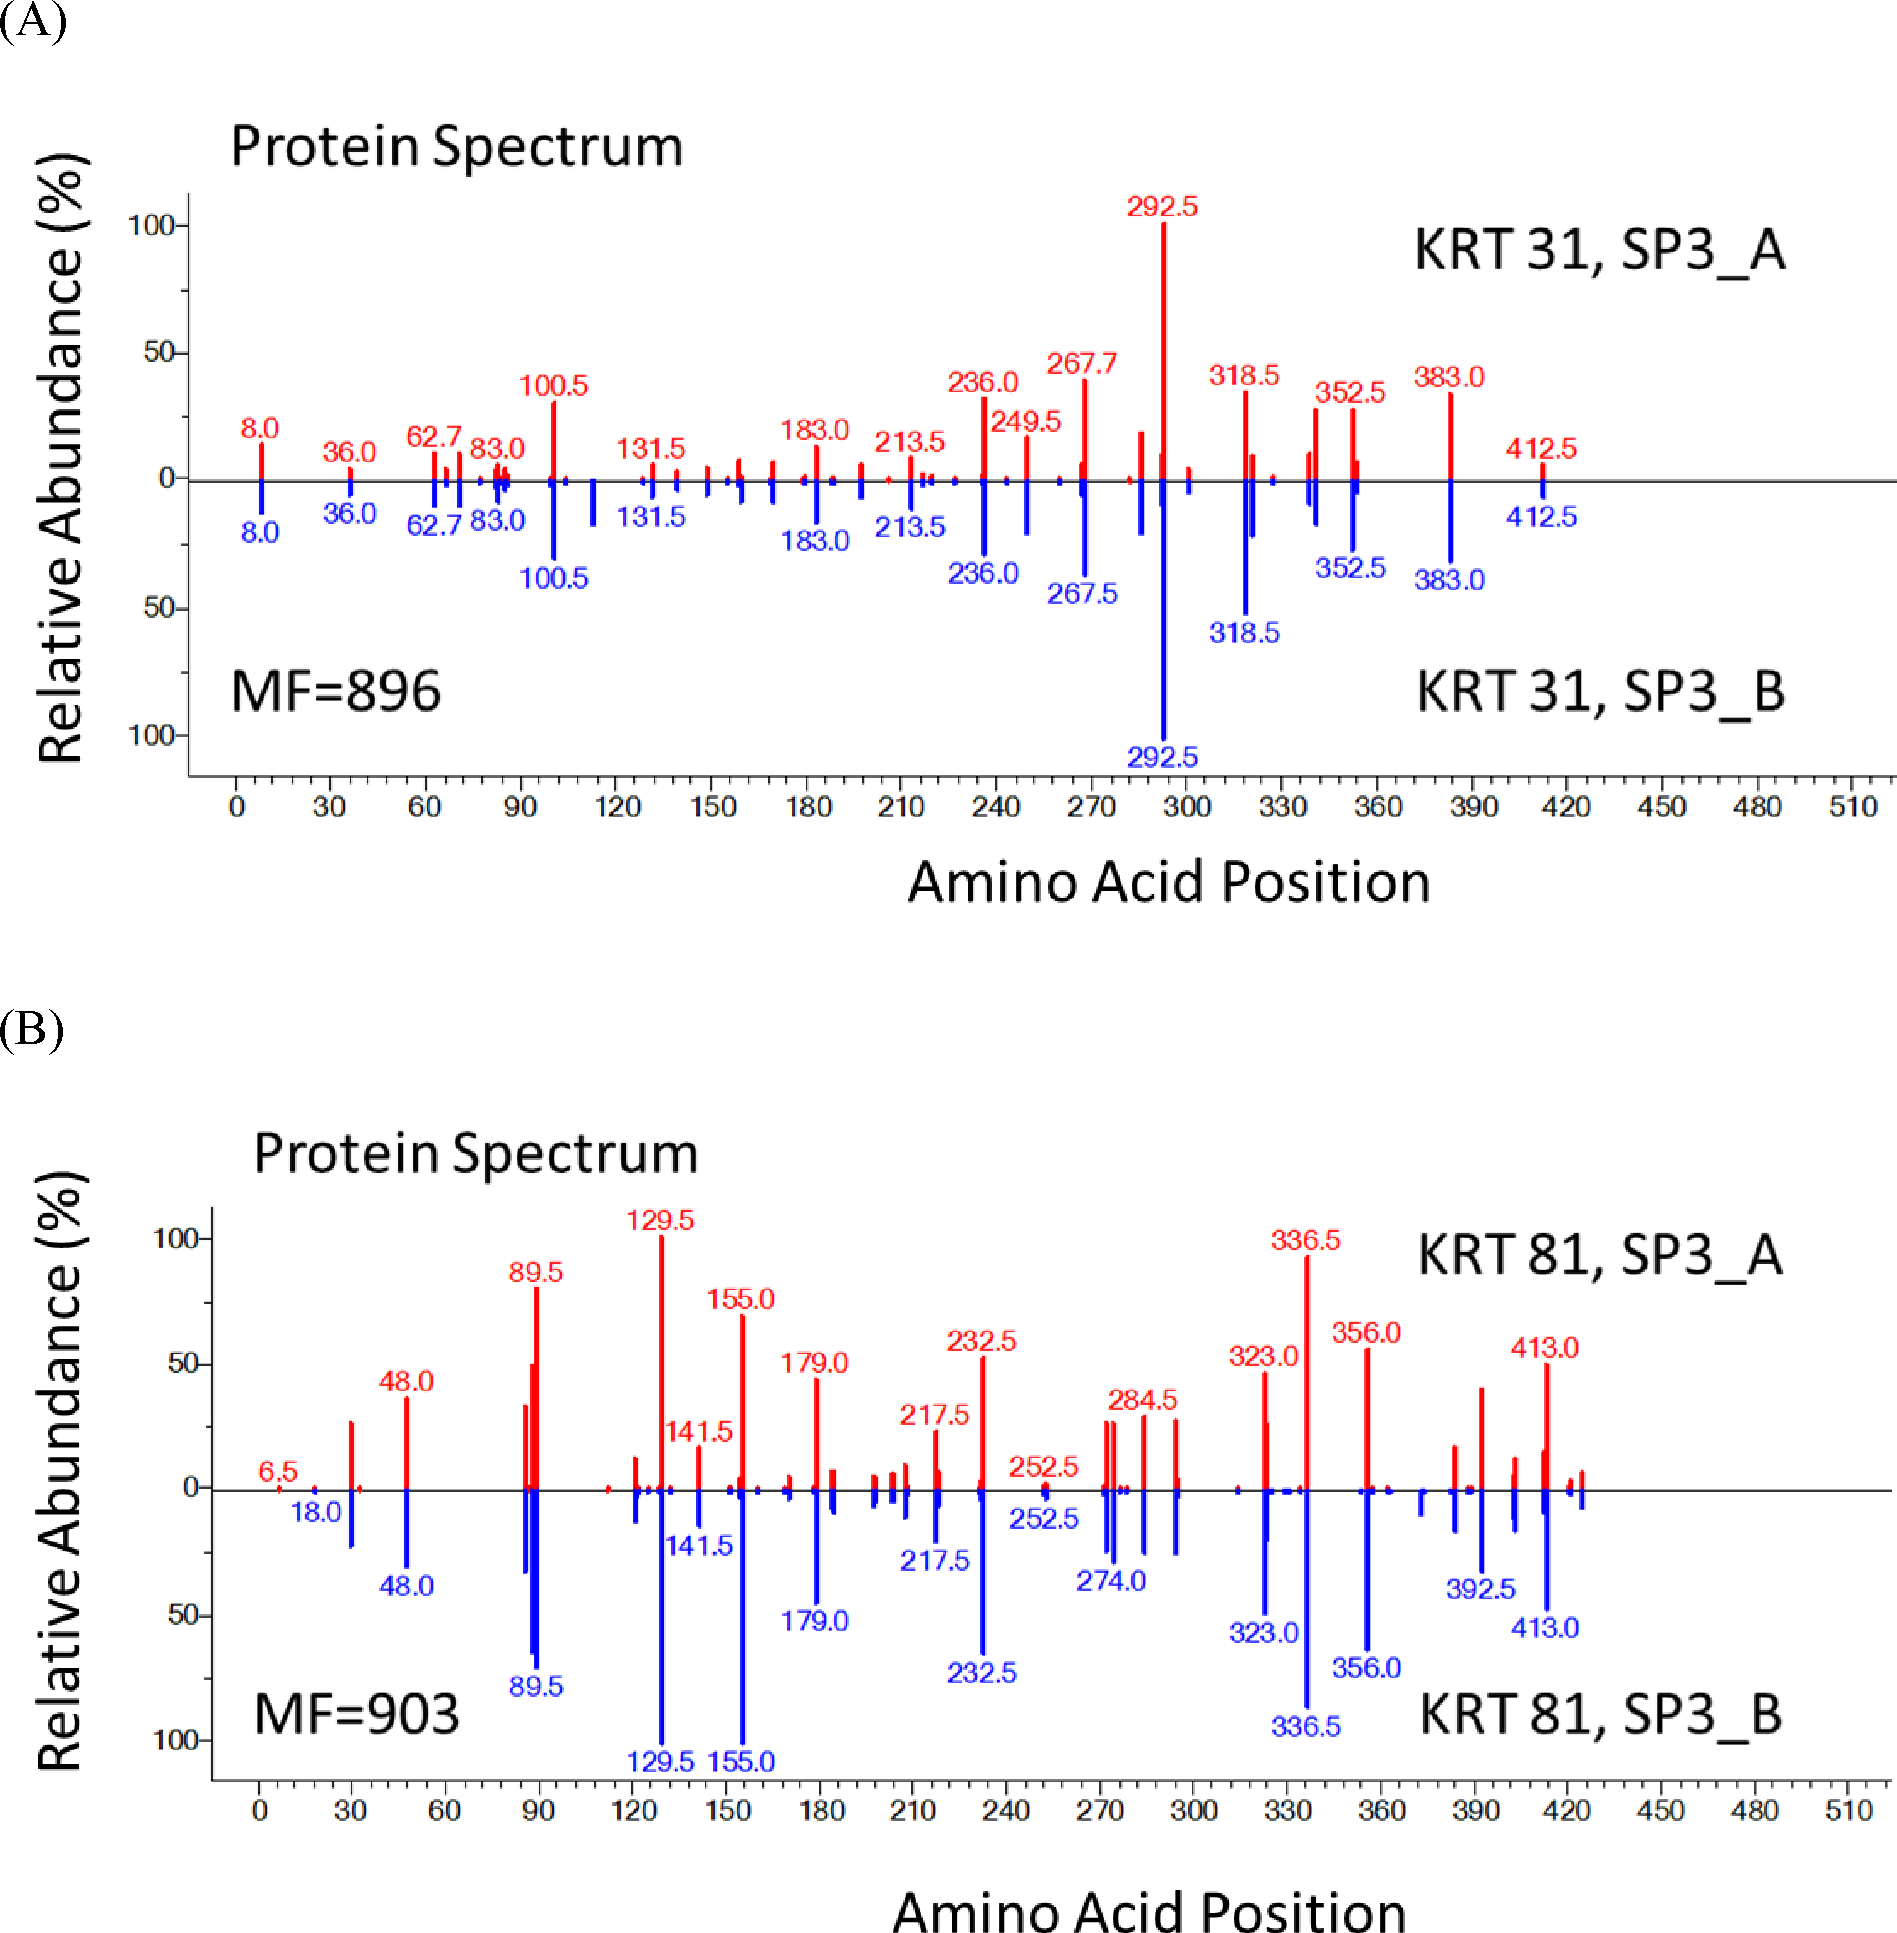
High reproducibility is challenging in proteome analysis due to well-known complexity and sources of variability. We next examined reproducibility of the optimized SP3 method. In Figure 5, SP3_A and SP3_B are results of two independent applications of the method on different strands of hair. As demonstrated in Figure 5, we developed a novel means of showing reproducibility that involves comparison on “protein spectra” where each peak corresponds to a different peptide sequence and its height to its relative abundance. The identified peptides for a protein are indicated by their positions on the x-axis, with their relative abundances measured by their XICs (extracted ion chromatograms) on the y-axis. This representation allows the comparison of any two runs (2 samples, 2 methods, 2 experimental repeats,…etc.) conveniently and can be displayed in NIST MS Search, which is well-established for displaying and comparing our library mass spectra.16 To examine the reproducibility of the optimized SP3 method, we used KRT31 as an example protein for type I cuticular KRT (Figure 5A) and KRT81 as an example protein for type II cuticular KRT (Figure 5B) to display their protein spectra between SP3_A and SP3_B. Both comparisons (Figure 5A and 5B) obtained high match factor (MF) around 900 (out of a perfect 999 match), indicating the reproducibility of the optimized SP3 method was high.
Figure 5.
Protein Spectra Showing Reproducibility of the SP3 Method
Figure 5. Protein spectra show the high level of reproducibility of the SP3 method. Each vertical line represents an identified peptide. x-axis is the position in a protein; y-axis is the abundance. SP3_A and SP3_B were repeats. KRT 31 (Figure 5A) is an example of type I cuticular KRT proteins; KRT 81 (Figure 5B) was used for the type II cuticular KRTs. MF near 900 in both cases indicates very high reproducibility. Numbers above peaks represent the position in the protein of the peptide’s middle amino acid (0.5 occurs for peptides with odd numbers of residues). If two peptides had the same position, the position would be incremented by 0.2. Specific peptides are listed in Supplementary Table S1.
We tested the reproducibility of the optimized SP3 method in this section, and we also compared it to other in-solution methods to demonstrate its improvement on sequence coverage due to most of the peptides identified with greater uniformity of abundances between replicates, which will be discussed in “Improved Sequence Coverage of the Optimized SP3 Method” section later.
Method Comparison for Hair Proteins, KRTs, and KRTAPs
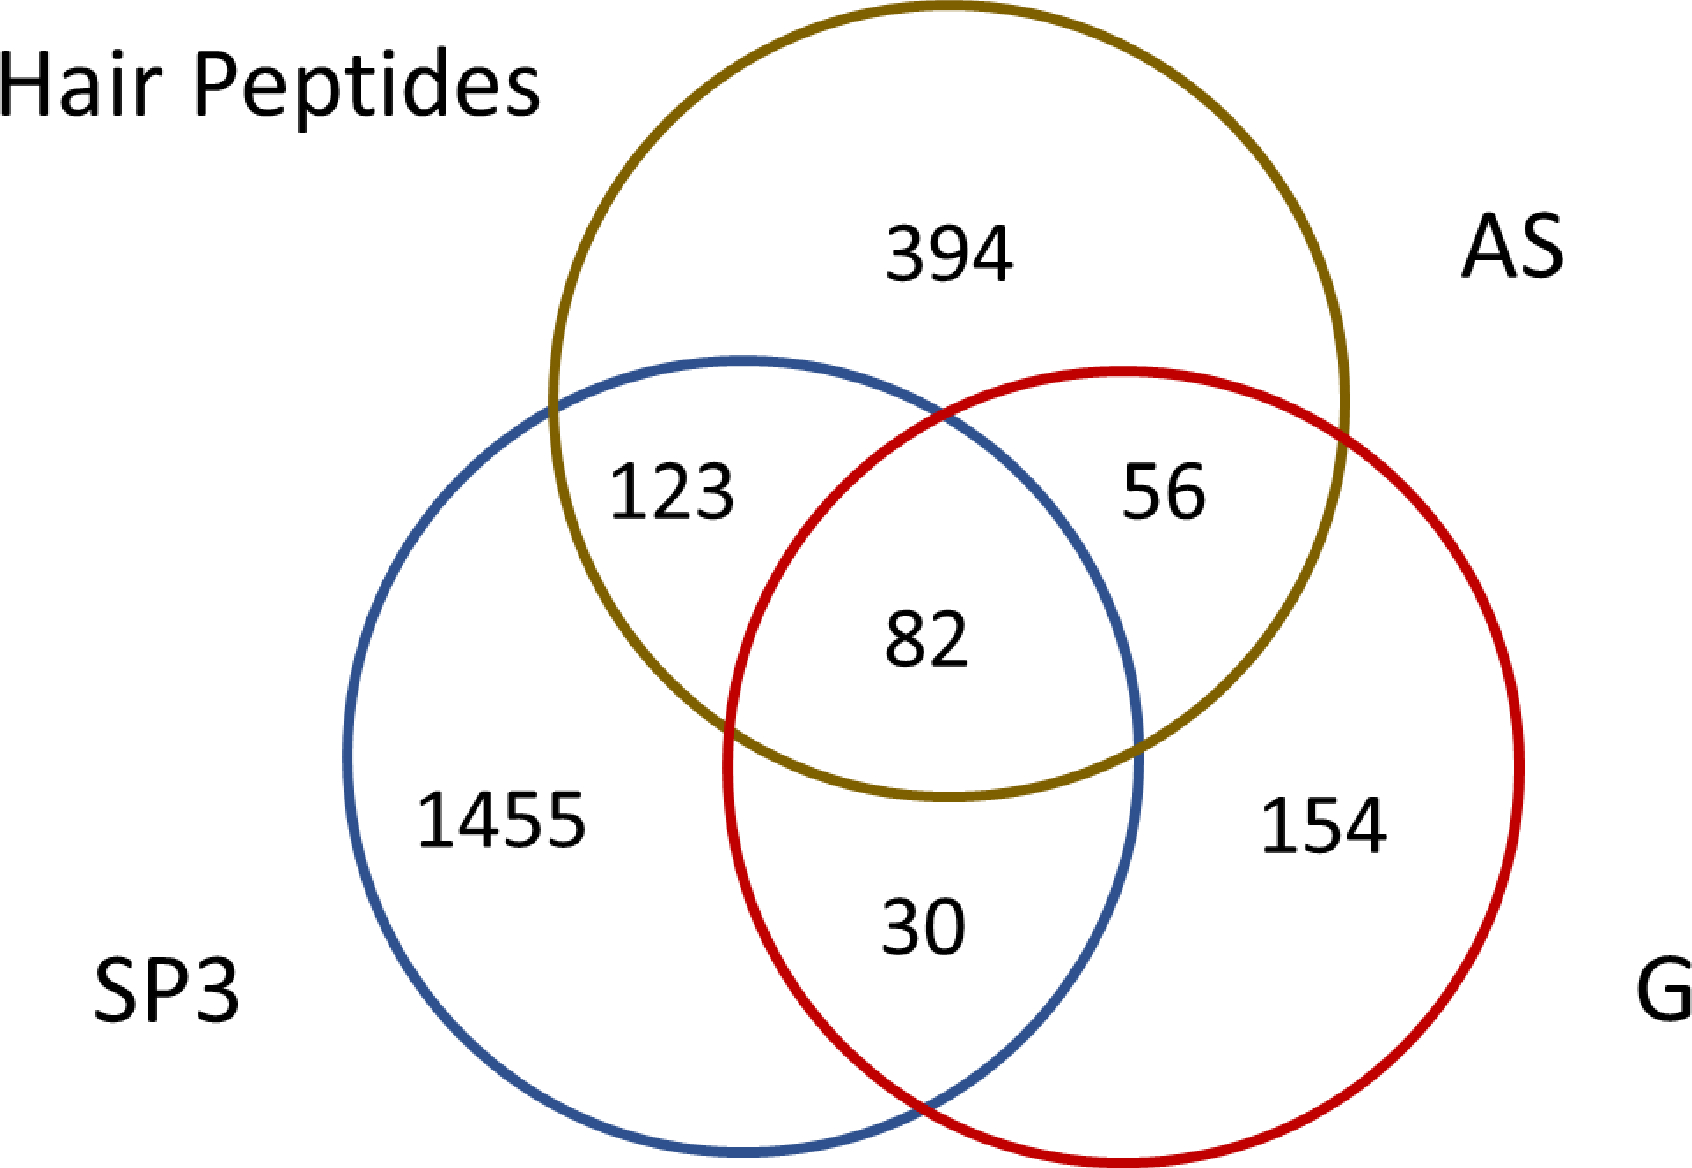
We compared the optimized SP3 method to several other in-solution sample preparation methods as listed in Table 1. The DE combined with the optimized SP3 method found more hair KRTs and KRTAPs from the hair proteome using the AM donor different single 5 cm-long hair strand as the starting material for each experiment (Table 1). Detailed lists of protein and peptide identifications by each method can be found in Supplementary Table S1. A Venn diagram (Figure 6) showed the DE combined with the optimized SP3 method also found significantly more peptides than the AS-based and G-based methods. A possible reason was because more hair proteins had been extracted by the DE method due to the strong detergent lithium dodecyl sulfate (LDS) used in the sample loading buffer, while both AS-based and G-based methods used mild protein solubilization reagents (AS and G) as described in the METHOD section. Our previous study3 also showed that the strong detergents (like LDS or SDS) worked better on protein extraction from hair samples than mild reagents (like urea) due to heavy cross-linking and the poor solubility of hair proteins (mainly KRTs and KRTAPs). However, the fact that there were unique peptides identified by each method (Figure 6) suggests different sample preparation methods provide both confirmatory and complementary evidence for peptide identification.
Table 1.
Method Comparison of Human Hair Proteins, KRTs, and KRTAPs
| Method | Hair Proteins | Hair KRTs and KRTAPs (Cytoskeleton KRTs, Cuticular KRTs, and KRTAPs) | Hair Cuticular KRTs | Hair KRTAPs | ||||||||
|---|---|---|---|---|---|---|---|---|---|---|---|---|
| Protein | Peptide | PSM | Protein | Peptide | PSM | Protein | Peptide | PSM | Protein | Peptide | PSM | |
| SP3_A | 185 | 1847 | 12838 | 52 | 1660 | 12566 | 14 | 1068 | 10751 | 28 | 520 | 1633 |
| SP3_B | 153 | 1686 | 12510 | 50 | 1553 | 12301 | 13 | 1008 | 10607 | 26 | 477 | 1552 |
| AS_A | 150 | 768 | 5390 | 45 | 541 | 4592 | 13 | 426 | 4196 | 24 | 90 | 321 |
| AS_B | 119 | 516 | 3017 | 26 | 366 | 2679 | 8 | 78 | 361 | 1 | 1 | 1 |
| AS_C | 225 | 876 | 4503 | 30 | 385 | 2901 | 12 | 187 | 1606 | 2 | 2 | 6 |
| G_A | 49 | 403 | 1371 | 34 | 387 | 1344 | 9 | 242 | 903 | 22 | 140 | 424 |
| G_B | 58 | 689 | 2237 | 37 | 663 | 2191 | 9 | 413 | 1510 | 25 | 243 | 665 |
Figure 6.
a Venn Diagram to Show the Identification of Peptides by the Different Methods
Figure 6. Identification of peptides by three different methods. SP3 represents the peptides found by the DE combined with the optimized SP3 method; AS represents the peptides found by the AS-based method; G represents the peptides found by the G-based method. The detailed peptide list for each method can be found in Supplementary Table S1.
In Table 1, SP3_A and SP3_B are repeat studies of the present method. For the main components of the hair proteome, which consists of 15 hair cuticular KRTs, both studies found most of them (SP3_A: 14; SP3_B: 13) with a large number of identified peptides (SP3_A: 1,068; SP3_B: 1,008) and PSMs (SP3_A: 10,751; SP3_B: 10,607). This was also the case for other hair KRTs (cytoskeleton KRTs) and KRTAPs (in Table 1, under “Hair KRTs & KRTAPs” category, showed the combined numbers of identified hair cytoskeleton KRTs, cuticular KRTs, and KRTAPs with their peptides and PSMs). We found that in the two experiments using AS followed by TCEP, the identification of KRTAPs was especially poor (AS_B: 1; AS_C: 2). Since we only used 10 mmol/L TCEP for reducing, we examined the possibility that this was too low in view of the cross-linking in the hair sample. However, increasing TCEP concentration to 30 mmol/L and 50 mmol/L, didn’t lead to an increase in KRTAP identifications (data not shown). On the other hand, we observed that AS at higher temperature (AS_C) led to more identifications of hair proteins other than KRTs and KRTAPs. For further comparison of DTT and TCEP as the tested reducing agents, DTT (AS_A) found more hair cuticular KRTs than TCEP (AS_A: 13; AS_B: 8) with substantially higher numbers of peptides (AS_A: 426; AS_B: 78) and PSMs (AS_A: 4,196; AS_B: 361) as shown in Table 1. We also tried increasing temperature as described in the METHOD section and observed only moderate improvement of protein/peptide identification (Table 1) in the tested AS-based method (AS_C) or G-based method (G_B).
Not surprisingly, the most abundant proteins found by all methods were mostly hair KRTs and KRTAPs (combined percentages: SP3_A: 97.88 %; SP3_B:98.33 %; AS_A: 85.19 %; AS_B: 88.80 %; AS_C: 64.42 %; G_A: 98.03 %; G_B: 97.94 %), suggesting no significant bias in KRT and KRTAP selectivity (except AS_C; see above). In conclusion, among the tested methods, DE combined with the optimized SP3 method worked the best and AS-based method worked better than G-based method regarding protein/peptide identification from human hair. Relative abundances, expressed as the percentage of spectral counts (i.e., PSMs), for each protein in the hair proteome identified by each method is given in Supplementary Table S1.
Improved Sequence Coverage of the Optimized SP3 Method
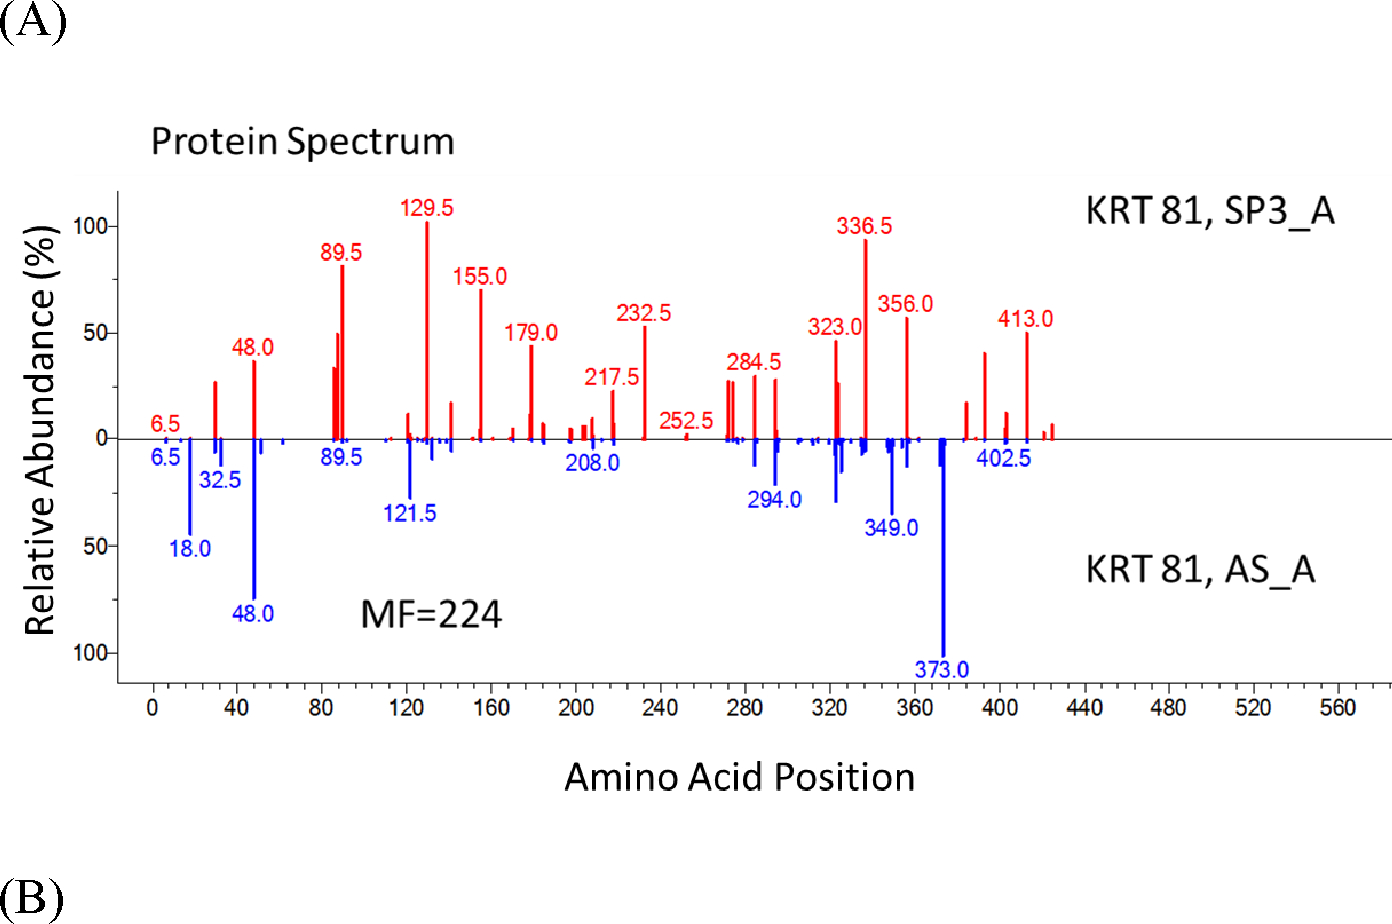
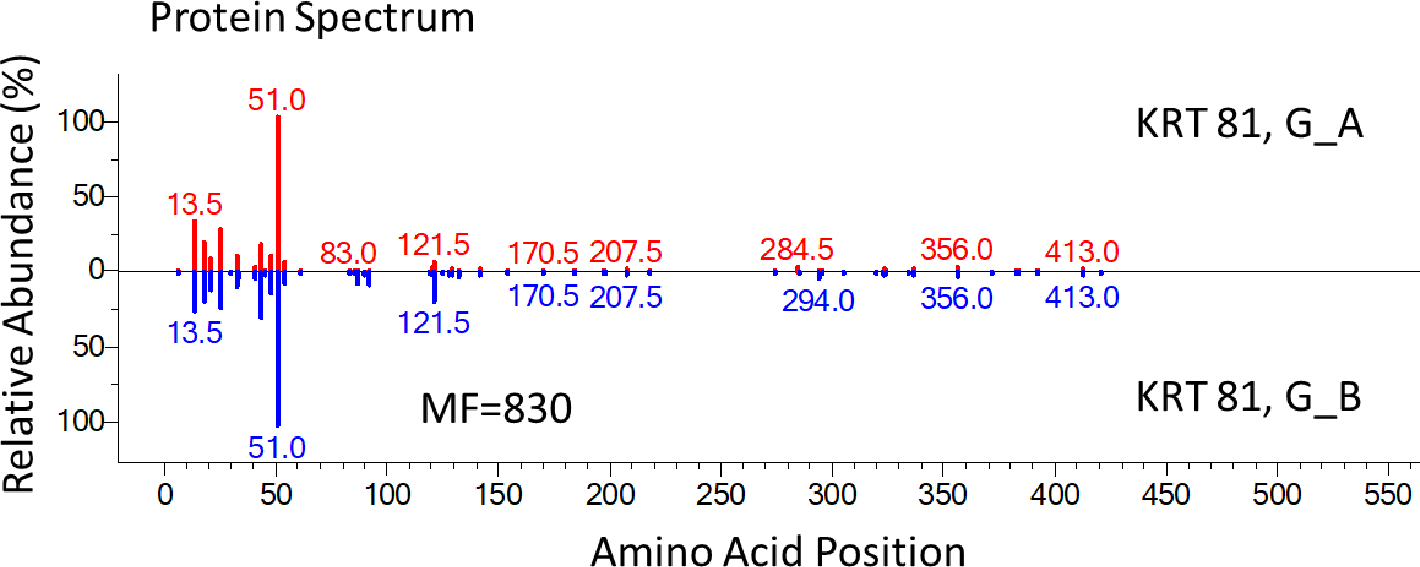
Using the abundant KRT 81 protein, we compare sequence coverages for each method in Figure 7. Clearly, DE combined with the optimized SP3 method provided the highest sequence coverage (about 90 %) with higher peptide abundances for most of the identified peptides of KRT 81 (Figure 7 A – C). The greater uniformity of abundances in SP3_A compared to other methods in Figure 7 is noteworthy because the protein extraction was more efficient using the DE combined with the optimized SP3 method. Both common and unique identifications of peptides by each method (Figure 7 A – C) once again suggests different sample preparation methods provide both confirmatory and complementary evidence in peptide identifications.
Figure 7.

Protein Spectra Showing Improved Sequence Coverage of the SP3 Method
Figure 7. Protein spectra show the improved sequence coverage of the SP3 method. Each vertical line represents an identified peptide. x-axis is the position in a protein; y-axis is the abundance. SP3_A was compared to other in-solution methods [(A) AS_A; (B) AS_B; (C) G_A]. We also made comparison for two AS-based methods (D) AS_B and AS_C and two G-based methods (E) G_A and G_B. KRT 81 was used as the example protein. Numbers above peaks represent the position in the protein of the peptide’s middle amino acid (0.5 occurs for peptides with odd numbers of residues). If two peptides had the same position, the position would be incremented by 0.2. Specific peptides are listed in Supplementary Table S1.
Another interesting observation from Figure 7 was the reproducibility of other tested in-solution methods (like AS_B vs. AS_C or G_A vs. G_B) was quite good (Figure 7 D, E with MF over 800, although still less than 900s for the SP3 replicates shown in Figure 5) although coverage was somewhat lower (about 60 %) for KRT 81 with lower spectral counts, hence lower abundances for most of the identified peptides. The same trend was observed for other hair cuticular keratins.
Improved GVP Identification
GVPs derived from human hair proteins have been studied as alternative evidence for human identification in forensics.10,11,12 As an application of the current workflow, the abundance of several example GVPs were shown in Table 2 to demonstrate improved GVP identification and quantification in the optimized SP3 method.
Table 2.
Abundance (Peak Area) and Numbers of PSMs of Identified GVPs in Different In-Solution Digestion Methods
| Method | DNVELENLR 2+ KRT31_A82V | QVVSSSEQLQSYQVEIIELRR 3+ KRT31_A270V | VSAMYSSSPCK 2+_1(10C, CAM) KRT35_S36P | VSAMYSSSPCKLPSLSPVAR 3+_2(4,M, Oxi) (10, C, CAM) KRT35_S36P | DLNMDCMVAEIK 2+_1(6,C,CAM) KRT83_I279M | TYVIAASTMSVCSSDVGR 2+_1(12, C, CAM) KRTAP10-8_H26R | ||||||
|---|---|---|---|---|---|---|---|---|---|---|---|---|
| Abundance | PSM | Abundance | PSM | Abundance | PSM | Abundance | PSM | Abundance | PSM | Abundance | PSM | |
| 4.87E+09 | 8 | 3.42E+09 | 30 | 1.10E+08 | 4 | - | - | 7.39E+08 | 7 | - | - | |
| SP3_A | 6.49E+09 | 11 | 3.50E+09 | 33 | 1.13E+08 | 2 | - | - | 6.91E+08 | 5 | - | - |
| AS_A | 8.77E+07 | 7 | - | - | - | - | 3.86E+08 | 7 | - | - | 1.21E+07 | 1 |
| AS_B | 5.28E+07 | 3 | - | - | - | - | - | - | - | - | - | - |
| AS_C | 9.42E+07 | 1 | - | - | - | - | - | - | - | - | - | - |
| G_A | 3.34E+07 | 3 | - | - | - | - | 2.01E+07 | 2 | - | |||
| G_B | 3.85E+07 | 1 | - | - | - | - | 4.28E+07 | 2 | - | - | - | - |
As shown in Table 2, we found that, although the first example GVP (DNVELENLIR, 2+, KRT31_A82V; at amino acid position 82 of type I cuticular KRT31, alanine was changed to valine; the mutated site is highlighted in red) was identified in every tested method, the optimized SP3 method had the highest abundances (SP3_A: 4.87E+09; SP3_B: 6.49E+09). The abundance of each peptide was taken from XIC peak area. SP3 also showed the highest PSM numbers (SP3_A: 8; SP3_B: 11). This finding applied to four of six listed GVPs in Table 2: other tested methods either couldn’t find the GVPs or found them with lower abundances. We also tried increasing the temperature for the sample preparation (AS_C and G_B) and found it slightly increased the abundance of identified GVP(s).
There were exceptions like the example GVP listed in the last column of Table 2 (TYVIAASTMSVCSSDVGR, 2+, KRTAP10-8_H26R; at amino acid 26 of KRTAP10-8, histidine was changed to arginine) that was only found by the AS-based method (AS_A) indicating a complementary nature in GVP discovery using different methods, consistent with our previous report.3
Sometimes a single amino acid polymorphism (SAP) site can be identified by different peptides that cover this particular site as the example shown in Table 2: VSAMYSSSPCK and VSAMYSSSPCKLPSLSPVAR both indicated the same SAP site (KRT35_S36P). The shorter peptide was found by SP3 and the longer peptide that contains one missed cleavage site was found by several other tested methods (AS_A, G_A, and G_B). The fact that different peptides and/or different methods covered the same SAP site increased the confidence of the identification of a particular mutation.
Among the methods tested, the optimized SP3 method found most of GVPs with higher abundances and higher numbers of PSMs. We concluded that the DE combined with the optimized SP3 method improved GVP identification and quantification, especially for hair cuticular keratins.
Comparison of In-solution and In-gel Digestion
To compare in-gel with in-solution methods we processed a raw file for one representative gel fraction, fraction number 6 (F06) that enriched type II hair cuticular keratins, as done in our previous study.3 The same data analysis workflow was followed, as described above, and we compared the results of F06 to SP3_A. The in-solution analysis found somewhat more hair proteins (SP3_A: 185; F06: 127), KRTs (SP3_A: 52; F06: 43), hair cuticular KRTs (SP3_A: 14; F06: 13), and KRTAPs (SP3_A: 28; F06: 19).
Regarding GVP identification, in-solution SP3 also found the highest numbers of GVPs (SP3_A: 83; SP3_B: 74; F06: 52; AS_A: 38; AS_B: 12; AS_C: 8; G_A: 16; G_B: 14). The fact that F06 still found more GVPs (as well as reference peptides) than other tested in-solution digestion methods indicated the protein extraction was more efficient using the current method. DE was simple and fast (only one step and 30 min). However, in-gel digestion used in the previous study following the DE method was time-consuming and laborious. Now the optimized SP3, when used for downstream sample preparation following DE, provides a faster, simpler, and more efficient alternative to purify extracted hair proteins, separate them from chemical reagents in the SDS-PAGE loading buffer, and perform enzyme digestion in a clean environment conveniently and effectively.
SUMMARY AND CONCLUSIONS
The DE method simplifies protein extraction from trace-amount human hair samples and when coupled with an optimized SP3 method further simplifies sample preparation for enzyme digestion while also increasing method sensitivity. SDS-PAGE remains useful to examine specific bands by in-gel digestion. Compared to in-gel digestion methods, preparation time for the current method is about three times faster and can require significantly less instrument time depending on the number of gel slices processed. At the same time, this method identifies significantly more proteins and peptides. Consistent with this finding, for proteins of interest, the SP3 method showed significantly higher sequence coverage with higher abundances of the identified peptides. Overall, we presented an enhanced hair peptide discovery workflow by coupling the sensitive DE method to an optimized SP3 protocol, which has led to superior outcome in identifying both reference and variant peptides in the human hair and is expected to have general applicability to other types of samples such as the human skin.
Supplementary Material
ACKNOWLEDGMENTS
We acknowledge support from the NIST Special Programs Office forensics program as part of a Trace Evidence Research Program.
ABBREVIATIONS:
- NIST
National Institute of Standards and Technology
- NCBI
National Center for Biotechnology Information
- SPO
Special Program Office
- HSRB
Human Subjects Review Board
- DE
Direct extraction
- LDS
Lithium dodecyl sulfate
- SDS
Sodium dodecyl sulfate
- DTT
Dithiothreitol
- TCEP
(tris(2-carboxyethyl)phosphine)
- IAA
Iodoacetamide
- SDS-PAGE
Sodium dodecyl sulfate - Polyacrylamide gel electrophoresis
- LC-MS/MS
Liquid chromatography-tandem mass spectrometry
- SP3
Single-pot, solid-phase-enhanced sample preparation
- EtOH
Ethanol
- ACN
Acetonitrile
- AM
Asian male donor
- GN
Gene Name
- KRT
Keratin
- KRTAP
Keratin-associated protein
- AA
Amino Acid
- MW
Molecular Weight
- MW Std marker
Molecular Weight standard marker
- PD
Proteome Discoverer
- F
MSFragger
- S
Sequest
- AS
Anionic surfactant
- G
Guanidine
- XIC
Extracted ion chromatogram
- PSM
Peptide-spectrum match
- MF
Match factor
- SAP
Single amino acid polymorphism
- GVP
Genetically Variant Peptide
- FASTA
a text-based format for representing protein sequences
Footnotes
NIST COMMERCIAL DISCLAIMER
Certain equipment, instruments, software, or materials are identified in this paper in order to specify the experimental procedure adequately. Such identification is not intended to imply recommendation or endorsement of any product or service by NIST, nor is it intended to imply that the materials or equipment identified are necessarily the best available for the purpose.
SUPPORTING INFORMATION:
Supplementary Table S1. Comparison of the identified hair proteins and peptides for the SP3 and other tested methods.
REFERENCES
- (1).Wong SY; Lee CC; Ashrafzadeh A; Junit SM; Abrahim N; Hashim OH A High-Yield Two-Hour Protocol for Extraction of Human Hair Shaft Proteins. PLoS One. 2016, 11(10), e0164993. [DOI] [PMC free article] [PubMed] [Google Scholar]
- (2).Lee YJ; Rice RH; Lee YM Proteome analysis of human hair shaft: from protein identification to posttranslational modification. Mol Cell Proteomics. 2006, 5, 789–800. [DOI] [PubMed] [Google Scholar]
- (3).Zhang Z; Burke MC; Wallace WE; Sheetlin SL; Mirokhin YA; Tchekhovskoi DV; Stein SE Sensitive Method for the Confident Identification of Genetically Variant Peptides in Human Hair Keratin. J Forensic Sci 2020, 65(2), 406–420. [DOI] [PMC free article] [PubMed] [Google Scholar]
- (4).Hughes CS; Moggridge S; Müller T; Sorensen PH; Morin GB; Krijgsveld J Single-pot, solid-phase-enhanced sample preparation for proteomics experiments. Nat Protoc. 2019, 14(1), 68–85. [DOI] [PubMed] [Google Scholar]
- (5).Virant-Klun I; Leicht S; Hughes C & Krijgsveld J Identification of maturation-specific proteins by single cell proteomics of human oocytes. Mol. Cell. Proteomics 2016, 15(8), 2616–2627. [DOI] [PMC free article] [PubMed] [Google Scholar]
- (6).Sielaff M; Kuharev J; Bohn T; Hahlbrock J, Bopp T; Tenzer S; Distler U Evaluation of FASP, SP3, and iST protocols for proteomic sample preparation in the low microgram range. J. Proteome Res. 2017, 16(11), 4060–4072. [DOI] [PubMed] [Google Scholar]
- (7).Tien JF; Mazloomian A; Cheng SG; Hughes CS; Chow CCT; Canapi LT; Oloumi A; Trigo-Gonzalez G; Bashashati A; Xu J; Chang VC; Shah SP; Aparicio S; Morin GB CDK12 regulates alternative last exon mRNA splicing and promotes breast cancer cell invasion. Nucleic Acids Res. 2017, 45(11), 6698–6716. [DOI] [PMC free article] [PubMed] [Google Scholar]
- (8).Höhne M; Frese CK; Grahammer F; Dafinger C; Ciarimboli G; Butt L; Binz J; Hackl MJ; Rahmatollahi M; Kann M; Schneider S; Altintas MM; Schermer B; Reinheckel T; Göbel H; Reiser J; Huber TB; Kramann R; Seeger-Nukpezah T; Liebau MC; Beck BB; Benzing T; Beyer A; Rinschen MM Single nephron proteomes connect morphology and function in proteinuric kidney disease. Kidney Int. 2018, 93(6), 1308–1319. [DOI] [PubMed] [Google Scholar]
- (9).Hughes CS; McConechy MK; Cochrane DR; Nazeran T; Karnezis AN; Huntsman DG; Morin GB Quantitative profiling of single formalin fixed tumour sections: proteomics for translational research. Sci. Rep. 2016, 6, 34949. [DOI] [PMC free article] [PubMed] [Google Scholar]
- (10).Parker GJ; Leppert T; Anex DS; Hilmer JK; Matsunami N; Baird L; Stevens J; Parsawar K; Durbin-Johnson BP; Rocke DM; Nelson C; Fairbanks DJ; Wilson AS; Rice RH; Woodward SR; Bothner B; Hart BR; Leppert M Demonstration of Protein-Based Human Identification Using the Hair Shaft Proteome. PLoS One. 2016, 11(9), e0160653. [DOI] [PMC free article] [PubMed] [Google Scholar]
- (11).Goecker ZC; Salemi MR; Karim N; Phinney BS; Rice RH; Parker GJ Optimal processing for proteomic genotyping of single human hairs. Forensic Sci Int Genet. 2020, 47, 102314. [DOI] [PubMed] [Google Scholar]
- (12).Wu J; Liu J; Ji A; Ding D; Wang G; Liu Y; Zhang L; Feng L; Ye J Deep coverage proteome analysis of hair shaft for forensic individual identification. Forensic Sci Int Genet. 2022, 60, 102742. [DOI] [PubMed] [Google Scholar]
- (13).BioMuta - single-nucleotide variations (SNVs) in cancer. https://hive.biochemistry.gwu.edu/biomuta (accessed December 20, 2021). [Google Scholar]
- (14).Eng JK; McCormack AL; Yates JR An approach to correlate tandem mass spectral data of peptides with amino acid sequences in a protein database. J. Am. Soc. Mass Spectrom. 1994, 5, 976–989. [DOI] [PubMed] [Google Scholar]
- (15).Kong AT; Leprevost FV; Avtonomov DM; Mellacheruvu D & Nesvizhskii AI MSFragger: ultrafast and comprehensive peptide identification in mass spectrometry–based proteomics. Nat Methods. 2017, 14(5), 513–520. [DOI] [PMC free article] [PubMed] [Google Scholar]
- (16).Wallace WE; Moorthy AS NIST Mass Spectrometry Data Center standard reference libraries and software tools: Application to seized drug analysis. J Forensic Sci. 2023, 68(5), 1484–1493. [DOI] [PMC free article] [PubMed] [Google Scholar]
- (17).Sheetlin SL; Mirokhin YA; Wang G; Yang X; Remoroza CA; Liu Y; Yan X; Tchekhovskoi DV; Goecker ZC; Burke MC; Stein SE Creating a data analysis pipeline for producing high-quality glycopeptide mass spectral libraries. Proceedings of the 71st ASMS Conference on Mass Spectrometry and Allied Topics, 2023, 312698. [Google Scholar]
- (18).Langbein L; Rogers MA; Winter H; Praetzel S; Beckhaus U; Rackwitz HR; Schweizer J The catalog of human hair keratins. I. Expression of the nine type I members in the hair follicle. J Biol Chem. 1999, 274(28), 19874–19884. [DOI] [PubMed] [Google Scholar]
- (19).Langbein L; Rogers MA; Winter H; Praetzel S; Schweizer J The catalog of human hair keratins. II. Expression of the six type II members in the hair follicle and the combined catalog of human type I and II keratins. J Biol Chem. 2001, 276(37), 35123–35132. [DOI] [PubMed] [Google Scholar]
Associated Data
This section collects any data citations, data availability statements, or supplementary materials included in this article.