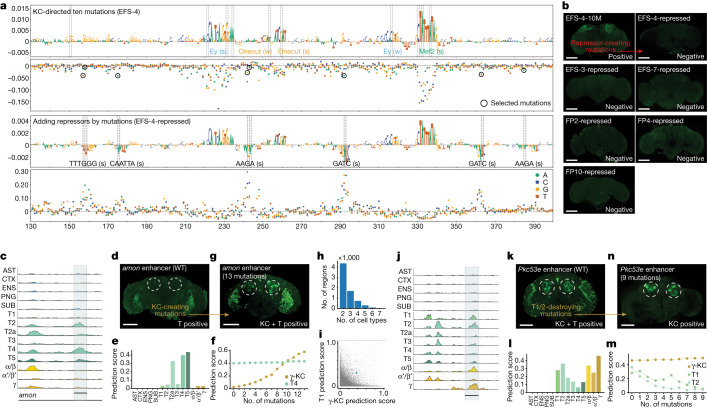
Fig. 3. Spatial expansion and restriction of enhancer activity.
a, Nucleotide contribution score and delta prediction score for in silico saturation mutagenesis of the EFS-4 enhancer after ten mutations (first and second row) and after adding repressors (third and fourth row). Dashed line shows the position of the mutations. Black circles, selected mutations to generate repressor sites. Motif annotation is indicated with strong (s) or weak (w) motif instances. b, In vivo enhancer activity of enhancers before (top-left) and after adding repressor sites. c, Chromatin accessibility profile near the amon gene. d, In vivo enhancer activity of the amon enhancer. e, The amon enhancer prediction scores for each cell type. f, Prediction scores for the γ-KC and T4 classes after each mutational step. g, In vivo enhancer activity of the amon enhancer after 13 mutations. The amon enhancer conserved exactly the same pattern of activity for T4 following incorporation of the KC code. h, Number of regions that score high (>0.3) for several cell types. i, Comparison between γ-KC and T1 prediction score for the accessible regions in fly brain (n = 95,931). The selected region with high γ-KC and T1 prediction is highlighted with a blue dot. j, Chromatin accessibility profile of this region (Pkc53e) in several cell types. k, In vivo enhancer activity of the Pkc53e enhancer. l, Pkc53e enhancer prediction scores for each cell type. m, Prediction scores for the γ-KC, T1 and T2 classes after each mutational step. n, In vivo enhancer activity of the multi cell-type enhancer after nine mutations.In b,d,g,k,n dashed circles show the expected location of KC. Scale bars, 100 µm. AST, astrocytes; CTX, cortex glia; ENS, ensheathing glia; PNG, perineurial glia; SUB, subperineurial glia; T1–T5, T1–T5 neurons; α/β,α/β-KC; α′/β′, α′/β′-KC; γ, γ-KC.

