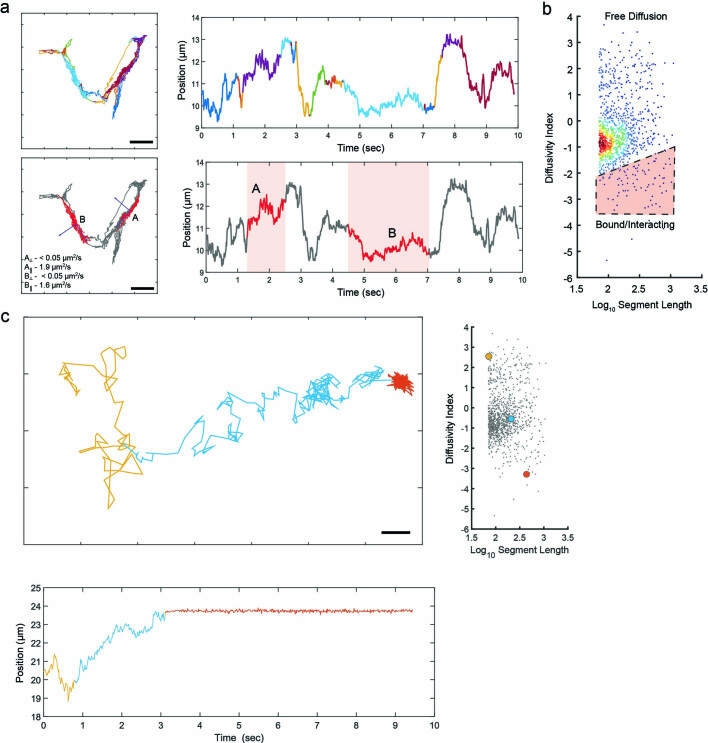
Extended Data Fig. 4. Latent states can be inferred from trajectory segments with similar mobility profiles.
a, Latent states determined in a single freely diffusing VAPB molecule within ER tubules (not shown). Two states with sufficient steps for analysis are highlighted in the lower panels, showing that diagonalization of the force and diffusion tensors reveals the native axis of the ER tubule (eiganvectors shown in blue). Diffusion in the perpendicular direction (around the tubule) is negligible, but diffusion along the long axis is discernible and consistent with literature values68. b, Segments of individual trajectories of VAPB can be characterized by the diffusivity index (see Supplementary Text), with bound states showing lower indices. A scatter plot of diffusivity index vs. segment length is shown, the red gate indicates segments considered to be interacting. c, A single VAPB trajectory with three discernible states. Segments of the trajectory defined to be in each state are colour coded in the xy-projection of the trajectory (upper) and in a time projection (lower). The diffusivity index for each trajectory is shown against the full set of analyzed VAPB trajectory segments in the scatter plot on the right, for context. Scale Bars: 500 nm.

