

Abstract
Keloids are characterized by excessive extracellular collagen and exaggerated scarring. Large-volume lesions can be functionally debilitating, therapeutically intractable, and psychologically devastating. A key barrier to translational momentum for novel antikeloid agents is the lack of a faithful high-content screen. We devised, to our knowledge, a previously unreported phenotype-based assay that measures secreted collagen by keloidal fibroblasts in tissue hypoxic conditions (1% oxygen). Four keloidal fibroblasts and 1 normal dermal fibroblast line were exposed to 199 kinase inhibitors. Of 199 kinase inhibitors, 41 (21%) and 71 (36%) increased and decreased the norm (mean collagen inhibition normalized to viability) by more than 10%, respectively. The most collagen suppressive agents were CGP60474 (norm = 0.36), KIN001-244 (norm = 0.55), and RAF265 (norm = 0.58). The top candidate, CGP60474, consistently abolished collagens I and VII production, exhibited minimal global toxicity, and induced a fivefold increase in phosphorylated extracellular signal–regulated kinase. This proof-of-concept high-content screen can identify drugs that appear to target critical keloidal pathophysiology—collagen secretion.
Keywords: Drug screen, Fibroblasts, High-content screen, Keloids
Introduction
Keloids are benign cutaneous tumors characterized clinically by exuberant scar formation and pathologically by excessive and disorganized deposition of collagens I and III (Gauglitz et al, 2011). To date, treatments for keloids include procedural approaches (eg, surgery, lasers, radiation, and cryotherapy), injectable drugs (eg, corticosteroids, 5-fluorouracil, and verapamil), topical adjuncts (eg, silicon, imiquimod), or a combination thereof (eg, laser-assisted topical drug delivery) (Frech et al, 2023). Although many of these can mitigate the clinical appearance of keloids, none are explicitly directed at the central phenotype, which is excessive collagen production and secretion.
One barrier to developing a more robust therapeutic pipeline for keloids is the lack of biologically meaningful endpoints. For instance, cellular viability—a critical measure for cancer cell lines—is unlikely to yield appropriate compounds in non-neoplastic tumors such as keloids. Furthermore, standard assay conditions such as 20% oxygen may not be consonant with in vivo drug effects because the dermal tissue oxygen concentration is reported to be 1–4% (Wang et al, 2003). Several groups have documented the expression of HIF1-a in human keloidal tissue, suggesting that the in situ ambient oxygen might be even less (Kang et al, 2020; Lei et al, 2019; Qiu et al, 2023; Zhang et al, 2006). Taken together, there is a clear need to devise a screen in tissue conditions using secreted collagen as the phenotypic endpoint and 1% oxygen to hypoxia. Our initial screen uncovered a collagen I/VII–suppressive drug, CGP60474, a pan–cyclin-dependent kinase (CDK) inhibitor that potently depletes Col1a1 and Col7a1 production with little effect on global viability. These results uncover candidates for anticollagen agents and suggest a different approach to assay design that can be optimized to identify drugs that target specific phenotypes.
Results
Previous reports (Kang et al, 2020; Lei et al, 2019; Qiu et al, 2023; Zhang et al, 2006) have suggested that keloid tumors likely exist in a state of relative hypoxia, which is at odds with standard cell culture incubators (ie, 20% oxygen). A high-content screen (Figure 1) that can profile drug effects in tissue conditions (ie, hypoxia) was developed. Although repeated viability measurements for 5 keloid fibroblast (KF) lines were comparable between 20% oxygen and 1% oxygen (Figure 2a), ELISA measurements (anti-Col1a1) revealed a trend toward greater extracellular Col1a1 secretion in 1% than in 20% oxygen. However, this was not observed with all the KFs and was not globally significant (Figure 2b). Thus, in the time frame of our screen, there was minimal variation in the baseline viability of cells between 20 and 1% oxygen in the absence of drugs.
Figure 1.

Study schema. Primary human fibroblast and human keloid fibroblast lines were plated into 96-well plates 1 day before drug treatment. One hundred ninety-nine kinase inhibitors from the HMS LINCS collection were added to replicate 96-well plates. One plate each was placed in 20% oxygen or 1% oxygen incubators concurrently. Twenty-four hours after drug addition, the supernatants were removed and assayed for Col1a1 by anti-Col1a1 ELISA, whereas Cell-TiterGo was used to determine viability. The percentage CI for each drug is calculated as the drug COL1A1 levels relative to the average COL1A1 levels from multiple DMSO wells in that specific drug plate (ie, Drugcol1a1 ÷ DMSOaverage col1a1) × 100. The percentage viability is defined as the drug viability levels to the average viability from multiple DMSO wells in that specific drug plate (ie, Drugviability ÷ DMSOaverage viability) × 100. The CInorm is an approximation of the amount of collagen suppression per cell (ie, divided by viability): (drugcol1a1 ÷ DMSOaverage col1a1)/(drugviability ÷ DMSOaverage viability). The mean normalized CI index (denoted as norm) is the average of the CInorm from all the cell lines. The most suppressive agent (CGP60474) was then subjected to secondary validation with confocal, dose–response curves, phosphokinome, and western blot analyses. O2 denotes oxygen. CI, collagen inhibition; CInorm, normalized collagen inhibition index; HMS, Havard Medical School.
Figure 2.

Effects of hypoxia on relative viability and collagen I secretion. Differences in viability (RLU by CellTiter-Glo) and extracellular collagen I (pg/ml by ELISA) between 20 and 1% oxygen levels. Data obtained from drug-free DMSO wells from independent replicate studies at 48 hours after plating. For viability, each green circle represents a comparison of 20% oxygen with 1% oxygen for a single DMSO control well: KF4 (n = 4 replicates), KF5 (n = 3 replicates), KF3/KF1/KF6 (n = 2 replicates), and BJ (n = 1). For collagen, each red square represents a comparison of 20% oxygen with 1% oxygen for a single DMSO control well: KF4 (n = 3 replicates), KF5 (n = 2 replicates), and KF3/KF1/KF6 (n = 1 each). O2 denotes oxygen. RLU, Relative Luminescence Units.
Little is known about the effectiveness of drugs on human fibroblasts in hypoxic conditions. When BJ fibroblasts, KF5, and KF6 lines were exposed to 199 kinase inhibitors at either 20 or 1% oxygen (Figure 3a and Supplementary Table S1), a total of 36.7, 50.8, and 69.3% of the drugs, respectively, exhibited >10% differential viability between the 2 oxygen concentrations. Figure 3c tabulates the top 10 drugs that were most (left red panel) and least (right blue panel) devitalizing in 1% oxygen compared with those in 20% oxygen. Thus, standard in vitro culture conditions (ie, atmospheric 20% oxygen) may not generally reflect the biological activity of these drugs in vivo (ie, closer to 1–4% oxygen). Given the biological implausibility of 20% oxygen in keloidal tissue, we performed downstream drug interrogation in 1% oxygen.
Figure 3.

Effect of oxygen concentration on viability in response to kinase inhibitors. (a) Ranked differences in DMSO-normalized cell viability (for BJ, KF5, and KF6 cell lines) between 20 and 1% oxygen in response to 199 protein kinase inhibitors. Y-axis was calculated using the formula: (drugviability@20% oxygen ÷ DMSOaverage viability@20% oxygen) – (Drugviability@1% oxygen ÷ DMSOaverage viability @1% oxygen). Red dots represent drugs that are more effective in 1% oxygen by >10%. Blue dots represent drugs that are less effective in 1% oxygen by >10%. Data are presented in Supplementary Table S1. (b) Mean differences (for BJ, KF5, and KF6) in DMSO-normalized viability for all drugs. The red, pink, and light blue lines represent the cubic fitted functions for the mean, 95% upper CI, and 95% lower CI, respectively. (c) Tables showing the top 10 drugs that had the most (left panel) and least (right panel) activity in 1% versus 20%. Raw counts, normalized values, and relative normalized viabilities for each drug are in Supplementary Table S1. O2 denotes oxygen. CI, confidence interval.
To better target the keloid phenotype without collateral toxicity, we sought compounds that minimally affected cellular viability while maximally diminishing extracellular collagen. We therefore assayed for viability and extracellular Col1a1 separately. Figure 4a shows the percentage change in viability plotted against the percentage change in extracellular Col1a1 (both against DMSO control in 1% oxygen) for BJ fibroblasts and 4 KF lines: KF1, KF4, KF5, and KF6. Because the amount of collagen produced and secreted can fluctuate with cell death or proliferation, we estimated the amount of collagen suppression on a cellular basis by calculating the ratio of percentage collagen inhibition to percentage viability (eg, normalized collagen inhibition [CInorm]). Figure 4b shows the mean normalized collagen inhibition (denoted as norm; ie, average CInorms for BJ, KF1, KF4, KF5, and KF6) calculated for each drug (orange circles). Of 199 kinase inhibitors, 41 (21%) and 71 (36%) increased and decreased the norm by more than 10%, respectively (Supplementary Table S2). The top 10 most collagen-suppressive drugs ranked from the lowest norm are listed in Figure 4c, with the top 5 being CGP60474 ( norm = 0.36 ± 0.25), KIN001-244 ( norm = 0.54 ± 0.36), RAF265 ( norm = 0.58 ± 0.37), omipalisib ( norm = 0.60 ± 0.21), and sapanisertib (INK128; norm = 0.62 ± 0.34). Among the top most collagen-inducing drugs (Supplementary Table S2) were SB216763 ( norm = 1.58 ± 0.75), NVP-BHG712 ( norm = 1.49 ± 0.75), R406 ( norm = 1.47 ± 0.55), PF573228 ( norm = 1.44 ± 0.74), and vandetanib ( norm = 1.42 ± 0.90). Because CGP60474 was the most potent ( norm = 0.36) and consistently suppressive agent (BJ, CInorm = 0.80; KF1, CInorm = 0.37; KF4, CInorm = 0.39; KF5, CInorm = 0.10; and KF6, CInorm = 0.16), we chose this compound for subsequent analyses.
Figure 4.

Screen of 199 kinase inhibitors on normal and KFs. (a) BJ fibroblasts and 4 KFs were treated with kinase inhibitor drug panel at 1% oxygen. Relative viability was measured with CellTiter-Glo and normalized to DMSO. Extracellular COL1A1 was measured using ELISA and normalized to DMSO. Each blue dot represents the percentage viability (drugviability ÷ DMSOaverage viability [Y-axis]) graphed against the percentage collagen inhibition (drugcol1a1 ÷ DMSOaverage col1a1 [X-axis]) for a single drug. The experiment was replicated 5 times each using a different cell line once. (b) The mean CInorm (norm; ie, the average CInorm for BJ, KF1, KF4, KF5, and KF6; orange line) is ranked from most suppressive (left side) to most inductive (right side). The SDs for each drug across the 5 biological replicates (ie, the 5 cell lines) are shown as blue bars. (c) Table showing the top 10 most COL1A1-suppressive and collagen-inducive drugs ranked by norm. Akt, protein kinase B; KF, keloid fibroblast; MET, MAPK/extracellular signal–regulated kinase; PI3K, phosphoinositide 3-kinase.
To determine whether the drop in extracellular collagen by CGP60474 was due to a reduction in synthesis or secretion, we subjected BJ fibroblasts and 4 KFs (KF1, KF4, KF5, and KF6) to the drug. We observed individual cellular effects by confocal immunofluorescence microscopy (Figure 5a). CGP60474 demonstrated uniform depletion of intracellular collagen I in all KF lines, suggesting that Col1a1 production is likely suppressed. After 24 hours of drug exposure, dose–response curves (at 1% oxygen) for KF5 and KF6 showed the half-maximal inhibitory concentration for Col1a1 to be ∼300 nM, whereas the viability was largely unaffected (Figure 5b), suggesting that CGP60474 had minimal toxic effects, at least in the short term. To determine whether CGP60474 had a similar effect on other dermal collagens, we also examined collagen VII and observed comparable anti-Col7a1 activity (Figure 5c).
Figure 5.

Cellular screen for CGP60474. (a) Confocal microscopy shows loss of intracellular COL1A1 (green) in the BJ fibroblast and 5 KF lines after exposure to 1 μM CGP60474 for 24 hrs. DAPI stain is shown in blue. Bar = 20 μm (b) Dose–response curves for CGP60474 in 2 KF lines showing normalized (to DMSO) viability and extracellular COL1A1. (c) Effect of 1 μM CGP60474 on both Col1a1 and Col7a1 in KF-1762, KF1, KF4, and KF6 showing suppression of both collagens. hr, hour; KF, keloid fibroblast.
Little is known about the mechanism of CGP60474's activity. The published structure of CGP60474 is shown in Figure 6a. The Target Affinity Spectrum (TAS) is a bioinformatic approach that summarizes all the available known information about a compound and its targets (Moret et al, 2019). The TAS vector combines published dose–response data, gene expression profiles, and curated annotations from the literature. By TAS, the leading targets were Cdk1, Cdk2, and Dyrk1a (Supplementary Table S3 and Figure 6b). The KINOMEscan is a phage-based in vitro competition assay where an output range of 100% of control indicates identical competition as DMSO (eg, no test drug binding), and 1% of control reflects tight drug binding. KINOMEscan results at 1 (very tight binding), 5, and 35% (less tight binding) are shown in Figure 6c. For CGP60474, the drug selectively binds the CMGC class of protein kinases, with Clk2, Cdk16, extracellular signal–regulated kinase (Erk)8, Clk1, Ick, Dyrk1b, Hipk1, and Mak being the top 8 binding partners (Supplementary Table S4 and Figure 6c). These are consistent with reported in vitro assays of CGP60474 (Cdk2, Cdk5, Cdk9, Cdk1 half-maximal inhibitory concentrations = 3, 10, 13, and 26 nM, respectively) (Jorda et al, 2018). Other CDK1/2/9 inhibitors in our screen did not replicate CGP60474’s dramatic anti-Col1a1 effect (Supplementary Table S2) (SNS-032 norm = 0.79 ± 0.29, AT7519 norm = 0.78 ± 0.11, alvocidib norm = 0.85 ± 0.25, PHA-793887 norm = 1.27 ± 0.38, AZD5438 norm = 1.30 ± 0.64, and KIN001-270 norm = 1.37 ± 0.49). Thus, among CDK inhibitors, CGP60474's collagen-suppressive effect appears to be distinct from and selective among those of other CDK inhibitors.
Figure 6.

CGP60474 structure and function. (a) Structure of CGP60474 (b) targets as assayed by Target Affinity Spectrum (original results at https://lincs.hms.harvard.edu/db/sm/10025-101-1/?sort=classmin). (c) KINOMEscan results for CGP60474 (original data at https://lincs.hms.harvard.edu/db/datasets/20054/). Dendrogram mapping for hits is at cutoffs of 1, 5, and 35% of DMSO. Also shown are tabulations of rank, percentage control, and target identity of hits. Target Affinity Spectrum and KINOMEscan platforms are summarized in the Methods and available in detail at the webpages listed earlier. Primary data are available in Supplementary Tables S3 and 4. ERK, extracellular signal–regulated kinase; CDK, cyclin-dependent kinase.
To broadly examine CGP60474’s impact on intracellular signaling, we subjected KF-1762, KF5, and KF6 to 1 μM CGP60474 in 1% oxygen and performed phosphokinase profiling. An unexpected finding was the uniform activation of phosphokinase signaling by CGP60474 without any notable phosphoprotein inhibition (representative blot for KF-1762 shown in Figure 7a). Densitometric quantitation (Figure 7b) showed that the most substantial changes were in phosphorylated Erk (p-Erk)T202/Y204,T185/Y187; phosphorylated Hsp27S78/S82; and, to a lesser extent, phosphorylated Gsk-3α/βS21/S9, with mean fold increases of 3.99× (P = .0073, unpaired t-test), 2.58× (P = .038), and 1.33× (P = not significant). Given the magnitude and consistent effects of CGP60474 on p-Erk, we further examined the effect of the drug on p-Erk.
Figure 7.

CGP60474 and MAPK signaling. (a) Representative phosphokinome array for KF-1762 (Proteome Profiler—Human Phospho-Kinase Array—(R&D Systems, ARY003C) showing most upregulated phosphoproteins (p-ErkT202/Y204,T185/Y187, p-Hsp27S78/S82, p-Gsk-3α/βS21/S9). (b) Normalized (to background) and relative (to DMSO) densitometry units for the p-ErkT202/Y204,T185/Y187, p-Hsp27S78/S82, and p-Gsk-3α/βS21/S9 based on 3 independent phosphokinome arrays. (c) Western blots showing levels of COL1A1, p-ERK, total ERK, and GAPDH in KF-1762 and KF5 at 20 and 1% oxygen. ERK, extracellular signal–regulated kinase; KF, keloid fibroblast; p-ERK, phosphorylated extracellular signal–regulated kinase; p-Gsk, phosphorylated Gsk; p-Hsp27, phosphorylated Hsp27.
As shown in Figure 7c, CGP60474 appears to upregulate p-Erk but reduce total Erk levels simultaneously. Both effects were abolished by a selective MAPK/ERK kinase (Mek) inhibitor—trametinib—suggesting that the CGP60474 site of action is proximal to Mek. Although trametinib alone (Figure 7c, top blot strip, lanes 3) increased collagen production in KF-1762, it had a more modest effect in KF5. In neither line did trametinib rescue the collagen depletion caused by CGP60474 (Figure 7c, top blot strip, lanes 4). Of note, trametinib was also included in our screen and had an overall inductive effect on collagen ( norm = 1.34 ± 0.31). As a group, Mek/Erk inhibitors significantly increased Col1a1 production (Supplementary Table S2) (average norm = 1.13 ± 0.19) compared with non–MEK/ERK inhibitors (average norm = 0.96 ± 0.19; Δ = −0.168, 95% confidence interval = −0.319 to −0.0172, P = .029, unpaired t-test) (Figure 8). Taken together, CGP60474 appears to concomitantly suppress collagen production and activate the MAPK pathway in an MEK-dependent fashion.
Figure 8.
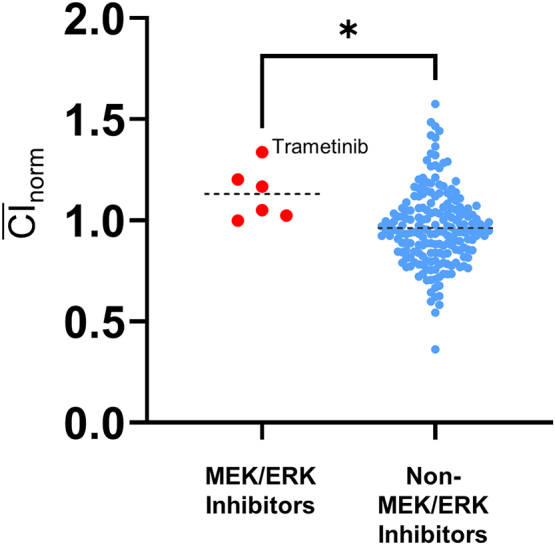
Anti–collagen I activity with Mek/Erk kinase inhibitors. Mean CInorms between Mek/Erk inhibitors and non-Mek/Erk inhibitors (Supplementary Table S2). ∗P < .05. Trametinib exhibited the greatest collagen-inductive effect among all Mek/Erk inhibitors (norm = 1.34 ± 0.31). Erk, extracellular signal–regulated kinase; Mek, MAPK/extracellular signal–regulated kinase.
Finally, CGP60474 has also been reported to reduce IL-6 secretion in mouse macrophages and attenuate lipopolysaccharide-induced endotoxemia (Han et al, 2018). Moreover, IL-6 has been shown to play putative but critical roles in keloidogenesis, both in cellular and functional studies (Ghazizadeh, 2007; Ghazizadeh et al, 2007; Kurachi et al, 2021; McCauley et al, 1992; Uitto, 2007; Xue et al, 2000) and in small studies showing associations between IL-6 polymorphisms and keloid development (Abdu Allah et al, 2019; Tosa et al, 2016; Zhu et al, 2017). Thus, one working hypothesis is that the CGP60474 effects are mediated through IL-6. Except for KF4, we observed consistent decreases in secreted IL-6 among KFs treated with CGP60474 (Figure 9a). Relative to DMSO, there was a mean IL-6 decrease of −53.3% (1 μM) and −30.1% (3 μM) in 20% oxygen and −8.4% (1 μM) and −30.7% (3 μM) in 1% oxygen. However, adding either IL-6 or anti−IL-6 receptor had minimal effects on Col1a1 levels (Figure 9b). Furthermore, neither rescued the collagen depletion induced by CGP60474. Thus, it is unlikely that the anticollagenic effects of CGP60474 are due solely to the reduction in IL-6 levels.
Figure 9.

CGP60474 and IL-6. (a) Various primary KFs (different color circles) were treated with 1 and 3 μM CGP60474 for 24 hrs in either 20 oxygen or 1% oxygen (raw data are in Supplementary Table S5). Levels of secreted IL-6 (pg/ml) were assayed by ELISA (human IL-6/IL-6 ELISA Kit PicoKine). Except for KF4, in general, there were decreases in secreted IL-6. (b) Effect of adding IL-6 (100 nM) and anti–IL-6R (3 μg) on COL1A1, p-ERK, and total ERK in KF6. Erk, extracellular signal–regulated kinase; hr, hour; IL-6R, IL-6 receptor; KF, keloid fibroblast; p-Erk, phosphorylated extracellular signal–regulated kinase; RLU, Relative Luminescence Units.
Discussion
Current strategies for keloid mitigation have focused mainly on procedural approaches and met with limited success. Keloidal tissue is characterized by excessive accumulation of extracellular collagen, which partly defines its pathological phenotype. Unlike cancer therapeutic screens, where cytotoxicity is often the measurable endpoint, fibroblast destruction is not necessarily desirable for translational development. To this end, we devised a proof-of-concept phenotype-based drug screen whereby collagen production is mitigated without significant short-term cellular injury. To our knowledge, this represents a previously unreported high-content screen that uses primary KFs, targets the keloidal tissue phenotype (ie, secreted collagen), and attempts to simulate native hypoxic conditions.
Our high-content screen was designed to assay drug behavior within the context of tissue oxygenation. Because extant data suggest that dermal oxygen levels reside around 1–4%, we constructed the screen in hypoxia. Interestingly, we show differential viability effects from the drugs between 20 and 1% oxygen (Figure 3). Such variations underscore potential discrepancies between the in vitro pharmacophenotype and clinical response of any given agent. Our screens also utilized primary KFs, which should more accurately reflect keloidal physiology. However, one caveat is that the KFs were initially cultivated and established at 20% oxygen and may thus have undergone some irreversible reprogramming or selection already.
It has been reported that KFs exist in a state of hypoxic alarm, with constitutively higher levels of Hif1a expression both in vitro and in vivo (Kang et al, 2020; Wu et al, 2004; Zhang et al, 2003). Compared with normal fibroblasts, Wang et al (2021) reported that even in normoxic conditions, KFs exhibit a higher degree of glycolysis, glycolytic reserve, glycolytic capacity, and nonglycolytic acidification while attenuating important mitochondrial functions such as adenosine triphosphate production, spare respiratory capacity, maximal respiration, nonmitochondrial respiration, and coupling efficiency. Similarly, Vincent et al (2008) documented higher hexokinase, Gapdh, and lactate dehydrogenase activities in KFs than in normal fibroblasts. The increased use of glycolysis rather than oxidative phosphorylation is reminiscent of tumor physiology where cancer cells, under conditions of oxygen deprivation, will experience the Warburg effect (Bhattacharya et al, 2016). Apropos to our study, the shift toward glycolysis has been shown to affect pharmacologic response in a variety of systems by mechanisms including augmented glucose entry, upregulation of glycolytic enzymes leading to inhibition of mitochondrial apoptosis (Jang et al, 2013; Mathupala et al, 2010), generation of cancer stem cells (Heddleston et al, 2010), increased starvation stress signaling, and activation of autophagy (Altman and Rathmell, 2012). One of the key regulators of the glycolytic transition is the phosphoinositide 3-kinase/protein kinase B/mTOR pathway (Jaworska et al, 2023). Although speculative, it is interesting to note that several drugs that targeted phosphoinositide 3-kinase and mTOR appeared to be associated with much less viability in 1% than in 20% oxygen (Figure 3c).
Through our screen, we discovered a previously unreported and potent collagen I and VII suppressor, CGP60474, which appears to elicit little change in short-term viability. Because proliferation and apoptosis assays were not performed, there is the distinct possibility that CGP60474 may affect proliferation, which may be offset by apoptosis or other mechanisms of cell death. Although the collagen-suppressive effects of CGP60474 appear particularly dramatic, the inhibitor itself is not specific. A somewhat surprising finding is the paradoxical activation of many signaling molecules by CGP60474, especially MAPK. As the upregulation of p-ERK and the depletion of collagen by CGP60474 can both be reversed by MEK inhibition, these findings are consistent with previous studies that show inhibition of collagen I/III expression in fibroblasts upon specific activation of Erk1/2 (Reunanen et al, 2000). However, the reciprocal relationship between MAPK and collagen synthesis is likely cell specific. For instance, collagen I expression in osteoblastic cells after exposure to Tgfβ and Bmp2 paralleled and required MAPK signaling (Palcy and Goltzman, 1999). Similarly, the induction of α(1)-procollagen mRNA expression by Igf-1 in hepatic stellate cells was completely abrogated by the Mek inhibitor, PD98059 (Svegliati-Baroni et al, 1999). Interestingly, roscovitine, a selective Cdk2/5 inhibitor, can also activate the MAPK pathway (Whittaker et al, 2004) and inhibit collagen and fibronectin expression in normal and scleroderma fibroblasts (Steinman et al, 2012). However, Steinman et al (2012) did not notice an induction of p-Erk in response to roscovitine and suggested that roscovitine’s effects were mediated through Cdk2 or Cdk9 rather than through MAPK. However, in our screen, none of the other Cdk inhibitors reproduced CGP60474's effects. Our data, along with those published, suggest that MAPK activation in dermal fibroblasts contributes to the downregulation of collagen I, although the precise mechanism of action is not known.
There are several limitations to our study. First, given the multiple KF lines and the many drugs screened, we could not test drug effects on other extracellular matrix components, including various substrates such as additional collagens, glycosaminoglycans, and other fiber-forming proteins (eg, fibronectin). These are currently being built into our second-generation content screen. Second, we chose a fixed 1% oxygen environment for our hypoxic input. We may not be capturing the range of ambient oxygenation because actual tissue levels likely fluctuate between anatomic site and degree of vasodilatation. Third, although we identified MAPK signal flux as a possible mediator of CGP60474 effects, the compound’s exact target(s) in keloid cells under hypoxic conditions are unknown. Fourth, the lack of a faithful animal keloid model precludes rapid in vivo validation of CGP60474 and other candidate antifibrotic drugs (Supp, 2019). One option is to include Food and Drug Administration–approved agents in future keloid therapeutic screens in hopes of more rapid translation into humans. In addition, effective compounds could also be tested in other murine models of sclerosing disorders (Artlett, 2014). Finally, although collagens I/VII are predominant collagens in the human dermis, the effects of CGP60474 on other extracellular matrix constituents are unknown. Future studies will characterize the CGP60474 and related agents on global expression patterns.
Although keloids are often considered a major cosmetic concern, significant functional and psychosocial burdens are associated with these lesions (Bijlard et al, 2017). In this study, we created a phenotypically based assay and identified CGP60474 as a previously unreported inhibitor capable of suppressing collagen I synthesis >80% with little detectable effects on aggregate cellular viability. In time, multidimensional screens that integrate precise phenotypic and molecular information could lead to better drug designs, preclinical development, and clinical translation.
Materials and Methods
Cell lines
Primary KF lines 1, 3, 4, 5, and 6 (KFs 1, 3, 4, 5, and 6) were isolated from specimens of keloids excised from Korean patients and were gifts from Mi Ryung Roh (Department of Dermatology, Gangnam Severance Hospital, Yonsei University College of Medicine, Seoul, South Korea). Both BJ fibroblasts (CRL-2522TM) and human KF line KEL FIBCRL-1762 (KF-1762) were purchased from the ATCC. The KEL FIBCRL-1762 line from the ATCC is a cell line exhibiting fibroblast-like morphology isolated from the keloid of a Black, female patient aged 35 years.
Cell culture and treatments
KF1, KF3, KF4, KF5, and KF6 were cultured in a mixture of DMEM (Gibco BRL) and Ham's nutrient mixture F12 (Gibco BRL) medium, by a 3:1 ratio. The supplements included 10% fetal bovine serum (Hyclone), 100 U/ml of penicillin, 100 mg/ml streptomycin, 1 × 10⁻¹⁰ M cholera toxin, 0.4 μg/ml hydrocortisone, 5 μg/ml insulin, 5 μg/ml transferrin, and 2 × 10-11 M triiodothyronine. BJ cells were cultured in ATCC-formulated Eagle's Minimum Essential Medium (30-2003) with 10% fetal bovine serum (S11150, Atlanta Biological). KF-1762 cells were cultured in DMEM (Gibco BRL), 10% fetal bovine serum (Hyclone), and 100 U/ml of penicillin. Cells were maintained in incubators at 37 °C and exposed to normoxia (20% oxygen, 5% CO2) or hypoxia (1% oxygen, 5% CO2).
Western blot analysis
Whole-cell lysates were prepared with RIPA buffer (BP-115, Boston BioProducts), including complete Protease Inhibitor Cocktail (11697498001, Sigma-Aldrich). Protein was fractionated by precast 4–20% precast SDS-PAGE (456-1096, Bio-Rad Laboratories) and transferred to nitrocellulose membranes (1620115, Bio-Rad Laboratories). Membranes were incubated with primary antibody (anti-COL1A1, NB600-408, Novus Biologicals; anti-COLA1, 3995, Cell Signaling Technology; anti–p-Erk, 9101, Cell Signaling Technology; anti-Erk, 4695, Cell Signaling Technology, anti-GAPDH, ab8245, Abcam) overnight at 4 °C and secondary antibody (anti-rabbit IgG, horse radish peroxidase–linked antibody number 7074s, Cell Signaling Technology; anti-mouse IgG, horse radish peroxidase–linked antibody number 7076s, Cell Signaling Technology) for 2 hours at room temperature. The western blot signal was elaborated with chemiluminescence ECL substrate (170-5061, Bio-Rad Laboratories).
Immunofluorescence
Cells were seeded on coverslips and cultured for 24 hours and then fixed with 4% polyformaldehyde (BM-155, Boston BioProducts) for 15 minutes, blocked with 5% goat serum for 30 minutes, and incubated with primary antibody (anti-Col1a1-[E6A8E], number 39952, Cell Signaling Technology) overnight at 4 °C. The next day, the secondary antibody (Rabbit Alexa Fluro -488, Thermo Fisher Scientific) was added for 2 hours at room temperature. DAPI was Prolong Gold Antifade Reagent with DAPI (number P36935). All images were then obtained using Zeiss Axiovert microscope and confocal microscope.
Drug screen
The 199 kinase inhibitors (Supplementary Table S1) were a subset of compounds from the Harvard Medical School Library of Integrated Network-based Cellular Signatures (https://lincs.hms.harvard.edu/). BJ and keloid cells (2000–3000 cells per well) were plated in 96-well plates (Clear bottom, white polystyrene TC-treated microplates, number 3903, Corning) and incubated for 48 hours either in 20% oxygen or 1% oxygen before the addition of drugs. The media was then removed, and drugs (final concentration of 1 μM drug) along with fresh media were added to the cells for another 24 hours at either 20% oxygen or 1% oxygen. Cell viability was then assessed using CellTiter-Glo Luminescent Cell Viability Assay (Promega). For the secondary screen, drugs were purchased from commercial vendors: CGP60474-(number E2642, Selleck), trametinib-GSK1120212, (number S4484, Selleck), anti–IL-6 receptor (Tocilizumab biosimilar MCA 6106, Bio-Rad Laboratories).
Collagen secretion and IL-6 secretion
The BJ and keloid cells (2000–3000 cells per well) were plated and incubated for 48 hours. After 48 hours, the media was removed. Fresh media with drug (final concentration of 1 μM drug-CGP60474 and different concentrations of trametinib and anti–IL-6 receptor) was added and incubated. After 24 hours of drug treatment, the supernatant was removed and saved at −80 oC. Collagen I secretion (Col1a1) and IL-6 secretion were measured using ELISA after optimization by Human Procollagen I alpha 1/Col1a1 PicoKine ELISA Kit and Human IL-6/Interleukin-6 ELISA Kit PicoKine from Boster Bio (Pleasanton, CA).
Drug screen analysis
The 199 drugs were screened in 4 plates. The average of the DMSO wells within each plate was used as the blank control for both the viability and the Col1a1 ELISA within each plate. For each drug (D) added,
% viability Dviability = (Draw viability [Cell Titer Glo]/average DMSOraw viability [Cell Titer Glo]) × 100
% collagen inhibition DCI = (Draw col1a1 [ELISA]/average DMSOraw col1a1 [ELISA]) × 100 collagen inhibition normalized (CInorm) to viability = DCI/Dviability
For each drug across all cell lines, mean CI = ∑ CInorm/N cell lines
CGP60474 data
Structural analysis for the compound is described on the Havard Medical School LINCS webpage (https://lincs.hms.harvard.edu/db/sm/10025-101-1/?sort=classmin). Briefly, as described on the website (https://lincs.hms.harvard.edu/db/datasets/20000/), the TAS is a vector of binding assertions on the basis of dose–response affinity constants, 1-dose percentage inhibition data, and manual literature curation. For assay protocol, to compare compounds on the basis of on all known targets and known nontargets, we sought a means to summarize all available target data on a compound, including dose–response data, profiling data, and curated annotations from the literature (eg, "drug X was found to not inhibit ..." or "was equipotent for ..."). The resulting TAS vectors summarize binding information from multiple assay formats weighted for the degree of evidence for high-affinity binding and also for nonbinding (Kd > 10 μM). TAS vectors contain several best-guess weighting parameters and are therefore less precise than selectivity scores, but they provide a more complete picture of available data. For the LINCS library, TAS vectors varied in length from a median of 10 features for probe compounds (range = 1–394) and 15 for approved drugs (range = 1–420) (Wilcoxon rank-sum test P = .07). In no cases did a TAS include assertions for all 545 human kinases let alone for all ∼3000 members of the druggable genome, which illustrates the sparseness of target annotation. TAS similarities for all compound pairs were calculated using a weighted Jaccard similarity metric. The data are shown in Supplementary Table S3.
The KINOMscan image and data are available online and in Supplementary Table S4 (https://lincs.hms.harvard.edu/db/datasets/20054/). To avoid over or understringency, we chose the 5% cutoff level. As described on the webpage, “The KINOMEscan assay platform is based on a competition binding assay that is run for a compound of interest against each of a panel of 317 to 456 kinases. The assay has three components: a kinase-tagged phage, a test compound, and an immobilized ligand that the compound competes with to displace the kinase. The amount of kinase bound to the immobilized ligand is determined using quantitative PCR of the DNA tag. Results for each kinase are reported as ‘Percent of control,’ where the control is DMSO and where a 100% result means no inhibition of kinase binding to the ligand in the presence of the compound and where low percent results mean strong inhibition. The KINOMEscan data are presented graphically on TREEspot Kinase Dendrograms (http://www.kinomescan.com/Tools---Resources/Study-Reports---Data-Analysis). For this study, HMS LINCS investigators have graphed results for kinases classified as 35 ‘percent of control’ (in the presence of the compound, the kinase is 35% as active for binding ligand in the presence of DMSO), 5 ‘percent of control’ and 1 ‘percent of control.’ Details can be found in Fabian et al (2005).
Phosphorylated kinase array and phosphorylated RTK array
Proteome Profiler Human Phospho-Kinase Array Kit (ARY003C) and Proteome Profiler Human Phospho-RTK Array Kit (ARY001B) were purchased from R&D Systems (Minneapolis, MN). Sample collection, storage, array preparation, array procedure, and data analysis were performed per the manufacturer’s guidelines.
Data availability statement
Primary data are provided in supplementary tables.
ORCIDs
Anpuchchelvi Rajadurai: http://orcid.org/0000-0003-4255-0476
Hensin Tsao: http://orcid.org/0000-0002-2204-2071
Conflict of Interest
The authors state no conflict of interest.
Acknowledgments
This work was supported by the Department of Defense (FA9550-20-1-0063).
Author Contributions
Conceptualization: AR, HT; Funding Acquisition: HT; Investigation: AR, HT; Methodology: AR, HT; Resources: AR, HT; Supervision: HT; Writing – Original Draft Preparation: HT; Writing – Review and Editing: AR, HT
accepted manuscript published online XXX; corrected proof published online XXX
Footnotes
Cite this article as: JID Innovations 2023.100248
Supplementary Materials
References
- Abdu Allah AMK, Mohammed KI, Farag AGA, Hagag MM, Essam M, Tayel NR. Interleukin-6 serum level and gene polymorphism in keloid patients. Cell Mol Biol (Noisy-Le-Grand) 2019;65:43–48. [PubMed]
- Altman B.J., Rathmell J.C. Metabolic stress in autophagy and cell death pathways. Cold Spring Harb Perspect Biol. 2012;4:a008763. doi: 10.1101/cshperspect.a008763. [DOI] [PMC free article] [PubMed] [Google Scholar]
- Artlett C.M. Animal models of systemic sclerosis: their utility and limitations. Open Access Rheumatol. 2014;6:65–81. doi: 10.2147/OARRR.S50009. [DOI] [PMC free article] [PubMed] [Google Scholar]
- Bhattacharya B., Mohd Omar M.F., Soong R. The Warburg effect and drug resistance. Br J Pharmacol. 2016;173:970–979. doi: 10.1111/bph.13422. [DOI] [PMC free article] [PubMed] [Google Scholar]
- Bijlard E., Kouwenberg C.A., Timman R., Hovius S.E., Busschbach J.J., Mureau M.A. Burden of keloid disease: a cross-sectional health-related quality of life assessment. Acta Derm Venereol. 2017;97:225–229. doi: 10.2340/00015555-2498. [DOI] [PubMed] [Google Scholar]
- Fabian M.A., Biggs W.H., 3rd, Treiber D.K., Atteridge C.E., Azimioara M.D., Benedetti M.G., et al. A small molecule-kinase interaction map for clinical kinase inhibitors. Nat Biotechnol. 2005;23:329–336. doi: 10.1038/nbt1068. [DOI] [PubMed] [Google Scholar]
- Frech F.S., Hernandez L., Urbonas R., Zaken G.A., Dreyfuss I., Nouri K. Hypertrophic scars and keloids: advances in treatment and review of established therapies. Am J Clin Dermatol. 2023;24:225–245. doi: 10.1007/s40257-022-00744-6. [DOI] [PubMed] [Google Scholar]
- Gauglitz G.G., Korting H.C., Pavicic T., Ruzicka T., Jeschke M.G. Hypertrophic scarring and keloids: pathomechanisms and current and emerging treatment strategies. Mol Med. 2011;17:113–125. doi: 10.2119/molmed.2009.00153. [DOI] [PMC free article] [PubMed] [Google Scholar]
- Ghazizadeh M. Essential role of IL-6 signaling pathway in keloid pathogenesis. J Nippon Med Sch. 2007;74:11–22. doi: 10.1272/jnms.74.11. [DOI] [PubMed] [Google Scholar]
- Ghazizadeh M., Tosa M., Shimizu H., Hyakusoku H., Kawanami O. Functional implications of the IL-6 signaling pathway in keloid pathogenesis. J Invest Dermatol. 2007;127:98–105. doi: 10.1038/sj.jid.5700564. [DOI] [PubMed] [Google Scholar]
- Han H.W., Hahn S., Jeong H.Y., Jee J.H., Nam M.O., Kim H.K., et al. Lincs L1000 dataset-based repositioning of CGP-60474 as a highly potent anti-endotoxemic agent. Sci Rep. 2018;8 doi: 10.1038/s41598-018-33039-0. [DOI] [PMC free article] [PubMed] [Google Scholar]
- Heddleston J.M., Li Z., Lathia J.D., Bao S., Hjelmeland A.B., Rich J.N. Hypoxia inducible factors in cancer stem cells. Br J Cancer. 2010;102:789–795. doi: 10.1038/sj.bjc.6605551. [DOI] [PMC free article] [PubMed] [Google Scholar]
- Jang M., Kim S.S., Lee J. Cancer cell metabolism: implications for therapeutic targets. Exp Mol Med. 2013;45:e45. doi: 10.1038/emm.2013.85. [DOI] [PMC free article] [PubMed] [Google Scholar]
- Jaworska M., Szczudło J., Pietrzyk A., Shah J., Trojan S.E., Ostrowska B., et al. The Warburg effect: a score for many instruments in the concert of cancer and cancer niche cells. Pharmacol Rep. 2023;75:876–890. doi: 10.1007/s43440-023-00504-1. [DOI] [PMC free article] [PubMed] [Google Scholar]
- Jorda R., Hendrychová D., Voller J., Řezníčková E., Gucký T., Kryštof V. How selective are pharmacological inhibitors of cell-cycle-regulating cyclin-dependent kinases? J Med Chem. 2018;61:9105–9120. doi: 10.1021/acs.jmedchem.8b00049. [DOI] [PubMed] [Google Scholar]
- Kang Y., Roh M.R., Rajadurai S., Rajadurai A., Kumar R., Njauw C.N., et al. Hypoxia and HIF-1alpha regulate collagen production in keloids. J Invest Dermatol. 2020;140:2157–2165. doi: 10.1016/j.jid.2020.01.036. [DOI] [PubMed] [Google Scholar]
- Kurachi I., Kurita E., Takushima A., Suga H. Human CD206+ macrophages show antifibrotic effects on human fibroblasts through an IL-6-dependent mechanism in vitro. Plast Reconstr Surg. 2021;147:231e. doi: 10.1097/PRS.0000000000007563. –9e. [DOI] [PubMed] [Google Scholar]
- Lei R., Li J., Liu F., Li W., Zhang S., Wang Y., et al. HIF-1alpha promotes the keloid development through the activation of TGF-β/Smad and TLR4/MyD88/NF-kB pathways. Cell Cycle. 2019;18:3239–3250. doi: 10.1080/15384101.2019.1670508. [DOI] [PMC free article] [PubMed] [Google Scholar]
- Mathupala S.P., Ko Y.H., Pedersen P.L. The pivotal roles of mitochondria in cancer: Warburg and beyond and encouraging prospects for effective therapies. Biochim Biophys Acta. 2010;1797:1225–1230. doi: 10.1016/j.bbabio.2010.03.025. [DOI] [PMC free article] [PubMed] [Google Scholar]
- McCauley R.L., Chopra V., Li Y.Y., Herndon D.N., Robson M.C. Altered cytokine production in black patients with keloids. J Clin Immunol. 1992;12:300–308. doi: 10.1007/BF00918154. [DOI] [PubMed] [Google Scholar]
- Moret N., Clark N.A., Hafner M., Wang Y., Lounkine E., Medvedovic M., et al. Cheminformatics tools for analyzing and designing optimized small-molecule collections and libraries. Cell Chem Biol. 2019;26:765–777.e3. doi: 10.1016/j.chembiol.2019.02.018. [DOI] [PMC free article] [PubMed] [Google Scholar]
- Palcy S., Goltzman D. Protein kinase signalling pathways involved in the up-regulation of the rat alpha1(I) collagen gene by transforming growth factor beta1 and bone morphogenetic protein 2 in osteoblastic cells. Biochem J. 1999;343:21–27. [PMC free article] [PubMed] [Google Scholar]
- Qiu Z.K., Zhang M.Z., Zhang W.C., Li Z.J., Si L.B., Long X., et al. Role of HIF-1alpha in pathogenic mechanisms of keloids. J Cosmet Dermatol. 2023;22:1436–1448. doi: 10.1111/jocd.15601. [DOI] [PubMed] [Google Scholar]
- Reunanen N., Foschi M., Han J., Kahari V.M. Activation of extracellular signal-regulated kinase 1/2 inhibits type I collagen expression by human skin fibroblasts. J Biol Chem. 2000;275:34634–34639. doi: 10.1074/jbc.C000175200. [DOI] [PubMed] [Google Scholar]
- Steinman R.A., Robinson A.R., Feghali-Bostwick C.A. Antifibrotic effects of roscovitine in normal and scleroderma fibroblasts. PLoS One. 2012;7 doi: 10.1371/journal.pone.0048560. [DOI] [PMC free article] [PubMed] [Google Scholar]
- Supp D.M. Animal models for studies of keloid scarring. Adv Wound Care (New Rochelle) 2019;8:77–89. doi: 10.1089/wound.2018.0828. [DOI] [PMC free article] [PubMed] [Google Scholar]
- Svegliati-Baroni G., Ridolfi F., Di Sario A., Casini A., Marucci L., Gaggiotti G., et al. Insulin and insulin-like growth factor-1 stimulate proliferation and type I collagen accumulation by human hepatic stellate cells: differential effects on signal transduction pathways. Hepatology. 1999;29:1743–1751. doi: 10.1002/hep.510290632. [DOI] [PubMed] [Google Scholar]
- Tosa M., Watanabe A., Ghazizadeh M. IL-6 polymorphism and susceptibility to keloid formation in a Japanese population. J Invest Dermatol. 2016;136:1069–1072. doi: 10.1016/j.jid.2016.01.019. [DOI] [PubMed] [Google Scholar]
- Uitto J. IL-6 signaling pathway in keloids: a target for pharmacologic intervention? J Invest Dermatol. 2007;127:6–8. doi: 10.1038/sj.jid.5700604. [DOI] [PubMed] [Google Scholar]
- Vincent A.S., Phan T.T., Mukhopadhyay A., Lim H.Y., Halliwell B., Wong K.P. Human skin keloid fibroblasts display bioenergetics of cancer cells. J Invest Dermatol. 2008;128:702–709. doi: 10.1038/sj.jid.5701107. [DOI] [PubMed] [Google Scholar]
- Wang Q., Wang P., Qin Z., Yang X., Pan B., Nie F., et al. Altered glucose metabolism and cell function in keloid fibroblasts under hypoxia. Redox Biol. 2021;38 doi: 10.1016/j.redox.2020.101815. [DOI] [PMC free article] [PubMed] [Google Scholar]
- Wang W., Winlove C.P., Michel C.C. Oxygen partial pressure in outer layers of skin of human finger nail folds. J Physiol. 2003;549:855–863. doi: 10.1113/jphysiol.2002.037994. [DOI] [PMC free article] [PubMed] [Google Scholar]
- Whittaker S.R., Walton M.I., Garrett M.D., Workman P. The cyclin-dependent kinase inhibitor CYC202 (R-roscovitine) inhibits retinoblastoma protein phosphorylation, causes loss of cyclin D1, and activates the mitogen-activated protein kinase pathway. Cancer Res. 2004;64:262–272. doi: 10.1158/0008-5472.can-03-0110. [DOI] [PubMed] [Google Scholar]
- Wu Y., Zhang Q., Ann D.K., Akhondzadeh A., Duong H.S., Messadi D.V., et al. Increased vascular endothelial growth factor may account for elevated level of plasminogen activator inhibitor-1 via activating ERK1/2 in keloid fibroblasts. Am J Physiol Cell Physiol. 2004;286:C905–C912. doi: 10.1152/ajpcell.00200.2003. [DOI] [PubMed] [Google Scholar]
- Xue H., McCauley R.L., Zhang W. Elevated interleukin-6 expression in keloid fibroblasts. J Surg Res. 2000;89:74–77. doi: 10.1006/jsre.1999.5805. [DOI] [PubMed] [Google Scholar]
- Zhang Q., Oh C.K., Messadi D.V., Duong H.S., Kelly A.P., Soo C., et al. Hypoxia-induced HIF-1 alpha accumulation is augmented in a co-culture of keloid fibroblasts and human mast cells: involvement of ERK1/2 and PI-3K/Akt. Exp Cell Res. 2006;312:145–155. doi: 10.1016/j.yexcr.2005.10.006. [DOI] [PubMed] [Google Scholar]
- Zhang Q., Wu Y., Ann D.K., Messadi D.V., Tuan T.L., Kelly A.P., et al. Mechanisms of hypoxic regulation of plasminogen activator inhibitor-1 gene expression in keloid fibroblasts. J Invest Dermatol. 2003;121:1005–1012. doi: 10.1046/j.1523-1747.2003.12564.x. [DOI] [PubMed] [Google Scholar]
- Zhu X.J., Li W.Z., Li H., Fu C.Q., Liu J. Association of interleukin-6 gene polymorphisms and circulating levels with keloid scars in a Chinese Han population. Genet Mol Res. 2017;16 doi: 10.4238/gmr16029110. [DOI] [PubMed] [Google Scholar]
Associated Data
This section collects any data citations, data availability statements, or supplementary materials included in this article.
Supplementary Materials
Data Availability Statement
Primary data are provided in supplementary tables.