Abstract
This paper focuses on the impact of solid barriers located upwind of a highway in reducing vehicle related concentrations that occur downwind of the roadway, compared to a highway without barriers. Measurements made in the United States Environmental Protection Agency’s meteorological wind tunnel show that the mitigating impact of an upwind barrier is comparable to that of a downwind barrier. Upwind barriers lead to reductions in pollution concentrations by drawing emissions in from the highway towards the barrier. The emissions are then entrained into the flow above the recirculation zone and dispersed vertically as they are advected downwind. This upwind transport of vehicle emissions leads to concentrations at the center of the roadways that are roughly 200-300% higher than those measured on roadways with downwind barriers. This difference between on-road concentrations indicates that although both types of barriers mitigate the impact of vehicle emissions downwind of a roadway, the upwind barrier may create adverse air quality impacts for the people on the road.
We have formulated a semiempirical dispersion model that incorporates the physics revealed by the wind tunnel measurements. This model improves upon a model proposed by Ahangar et al. (2017) by adjusting the wind speed to get a more realistic plume dispersion just downwind of the upwind barrier and also by providing vertical profiles of concentrations in addition to ground-level concentrations. The upwind barrier model proposed in this paper and the downwind barrier model described in Francisco et al. (2022) have been incorporated into AERMOD (version 21112) as a nonregulatory option, including the new two-barrier option when modeling both barriers on the same roadway.
Keywords: solid barrier, mobile sources, wind tunnel, dispersion modeling, AERMOD
1. Introduction
Air quality modeling studies have associated traffic-related air pollution with an increased risk of adverse health effects in people exposed to mobile emissions within 200 meters of highways (Brandt et al. 2014; Chen et al. 2019). Though these studies were performed without regard to the presence of roadside barriers, the effects of exposure to near-road pollutant are contrasted with those of regional pollutants; they also detail the association of near-road pollutants with health effects such as childhood asthma and obesity. Traffic-related emissions consist of various pollutants such as nitrogen oxides, hydrocarbons, and particulate matter (HEI 2010). The level of these pollutants downwind of a roadway can be redistributed using different approaches, including with the use of roadside noise barriers. The inclusion of roadside barriers, which are already present along major urban highways, is one important approach to possible near-field exposure mitigation, and dispersion models have been developed to account for the mitigating effects induced by barriers located downwind of a roadway (Heist et al. 2009; Schulte et al. 2014). It is important to note that reductions in roadside concentrations due to the presence of barriers is not caused by a reduction in vehicle emissions and is limited to the vicinity of the structure (such as neighborhoods or schools immediately downwind of the road) where the primary emissions from the road are lifted and mixed by the flow distortion and turbulence from the barrier.
Solid roadway barriers are designed to reduce the impact of traffic noise on residents located close to roads. Tracer studies (Finn et al. 2010) and wind tunnel experiments (Heist et al. 2009) indicate that these barriers placed on the downwind side of a highway can also lead to significant reductions in downwind concentrations of emissions from a highway relative to those in the absence of the barrier. This reduction is caused by two related processes: 1) lifting of the pollutant above the barrier by the flow redirected upwards by the barrier, and 2) enhancement of vertical dispersion by turbulence in the wake of the barrier. The results presented in this paper show that barriers located upwind of a highway can also reduce concentrations through different mechanisms described below.
The mitigating impact of upwind barriers has been examined in a previous study by Ahangar et al. (2017) which focused on ground-level concentrations (i.e., concentrations at the surface). In an analysis of some early results from the wind tunnel experiments described in their paper, they showed that the upwind barrier reduced downwind concentrations by drawing emissions from the highway into the recirculating flow behind the upwind barrier. The upwind barrier pulls the emissions from the highway and then ejects it upwards enhancing vertical spread and thus reducing the downwind concentrations relative to those in the absence of the barrier. Ahangar et al. (2017) proposed a semi-empirical dispersion model that incorporated the effects seen in these early experiments.
This paper presents novel results that extend previous work on the effects of solid roadside barriers on downwind concentrations by examining both ground-level concentration as well as vertical profiles of concentrations downwind of roadside barriers. These new wind tunnel observations examine the effects of barriers on near-road concentrations using barriers either 4.5 m or 6 m tall (at full-scale) and placed either upwind or downwind of the modeled highway. These new upwind barrier cases are part of a larger wind tunnel study that was conducted at the United States Environmental Protection Agency (US EPA) and the downwind barrier cases were recently published (Francisco et al. 2022). The upwind barrier cases also allow comparison of the magnitude of the mitigating effect of the upwind barrier with that of the downwind barrier.
The newly updated barrier algorithm described in this paper has been integrated into the EPA’s AERMOD dispersion modeling system, version 21112 (US EPA 2021). Within AERMOD, RLINE source types were designed to model the dispersion of pollutants from roadways (Snyder et al. 2013). An extension of the RLINE source type (called RLINEXT) includes the parameterization for the upwind barrier algorithm as an experimental option not yet approved for regulatory applications.
2. Wind tunnel experiments
There is a long history of the use of wind tunnel studies to support the development of atmospheric dispersion model algorithms (e.g., Robins, 2003; Perry et al., 2016). Unlike field studies, wind tunnels allow control of the variations in source characteristics, approach boundary layers, and other complexities that are critical to the development of dispersion models. The results presented in this paper are based on experiments conducted at the US EPA’s Fluid Modeling Facility (Snyder 1979). The meteorological wind tunnel has a test section, where the model is placed, with dimensions of 3.65 m width, 2.1 m height, and 18.3 m length. The wind tunnel experiments were designed to examine the impact of solid roadside barriers in reducing downwind concentrations associated with highway emissions. Here we focus on the roles of barrier height and location in reducing concentrations downwind of the roadway that occur in the absence of barriers.
2.1. Wind tunnel model
The atmospheric boundary layer typical of a suburban region where solid roadside barriers are common was simulated by installing boundary layer generating hardware in the wind tunnel to produce a deep boundary layer with appropriate characteristics. The boundary layer generating hardware consisted of Irwin spires at the entrance of the test section to initialize the flow (Irwin 1981), followed by square-edged surface roughness to further develop and maintain the flow characteristics. Detailed descriptions of this hardware set-up can be found in Perry et al. (2016). Measurements used to characterize the flow were performed using laser Doppler velocimetry (LDV). The free-stream velocity of the wind tunnel was maintained at 4.7 m/s through the experiments corresponding to a boundary layer height of 200 m (equivalent full-scale value), and an analysis of the measurements indicated that a friction velocity (u*) of 0.25 m/s best fit the observed turbulence shear stress and the slope of the logarithmic velocity profile while a surface roughness height (z0) of 0.27 m (equivalent full-scale value) provided the needed velocity profile intercept. The displacement height was determined to be zero as a result of the sparse nature of the roughness tabs. Reynolds number independence of the flow was determined by repeating a subset of profiles and cases at a free-stream wind speed 50% higher than that used for the experiment. The result mean flow, turbulence levels and concentration values, when scaled appropriately by the free-stream velocity were found to be independent of the Reynolds number (see Francisco et al. 2022 for more information).
The wind tunnel boundary layer used here was characteristic of suburban or light industrial areas with near-neutral atmospheric conditions (close to the low end of the range of urban areas provided by Grimmond and Oke, 1999 described as “Low height and density”). It is expected that the flow displacement and wind-driven mechanical turbulence induced by barriers will simulate the enhancement of local dispersion of roadway emissions and thus provide for mitigation of near-road exposures seen in the real-world, except under extremely convective and stable conditions. While all the experiments reported here were for cases where the approach wind was perpendicular to the roadway (and the barrier), the mitigating effects for oblique wind angles are expected to be similar for long roadway sections.
2.2. Wind tunnel cases
In the testing section of the wind tunnel, three separately fed brass tubes were placed in a single line to simulate a single lane of traffic. Based on the model scale of 1:150, each of these source tubes in the wind tunnel (91 cm long) were installed perpendicular to the wind direction and had a length of 136.5 m at full scale (Fig. 1), and therefore a single line source was 409.5 m long (full-scale). The source tubes were thin-walled, hollow, and square with an exterior dimension of 0.6 cm by 0.6 cm. Tracer gas was emitted from 0.1 cm holes in the bottom of the tubes, spaced evenly along the length of the tubes every centimeter. The source tube along with tabs, positioned upwind of each tracer port on the upwind side of the tubes (0.3 cm wide and protruding 0.5 cm below the tube), promote both vertical and horizontal initial mixing of the tracer that would be induced by a stream of vehicles moving along a roadway. The tracer gas was a mixture of air and high-purity ethane (C2H6; minimum purity 99.5 mole percent). The choice of ethane as the tracer gas (molecular weight 30.07 g/mol) ensures the emitted gas is neutrally buoyant since it is nearly equivalent in density to that of dry air (28.97 g/mol). The mass flow rate of air and ethane were 12.6 g/min and 1.875 g/min, respectively.
Fig. 1.
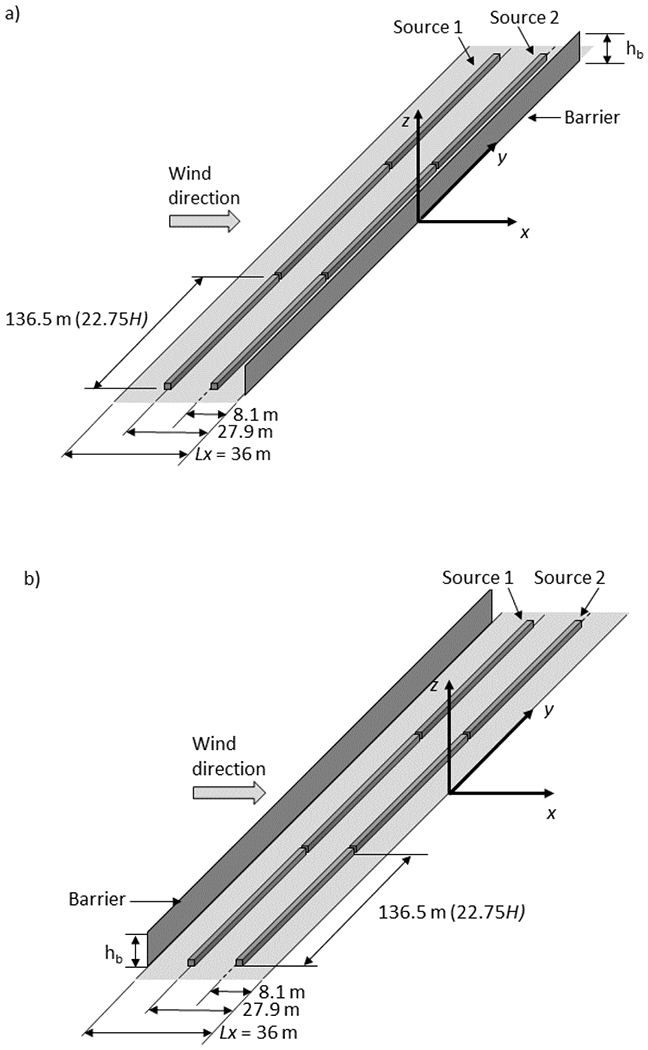
Wind tunnel setup showing the full-scale dimensions of two fixed line sources and a solid barrier, which are all perpendicular to the x-axis. The model scale is 1:150. Wind flows in the positive x direction. The origin is located at the downwind edge of the roadway; the y-axis is aligned with the downwind edge of the roadway. The No Barrier case uses this same setup but without a barrier present. a) The Downwind Barrier cases have a barrier located at x/H = 0. b) The Upwind Barrier cases have a barrier located at the upwind edge of the roadway (x/H = −6). Adapted from Francisco et al. (2022)
The coordinate system origin used in the experiments was located on the wind tunnel floor at the center of the downwind edge of the roadway, with positive x in the wind flow direction, y along the roadway, and z upward from ground-level (Fig. 1). The experiments used a continuous tracer release from two line sources (i.e., two modeled lanes of traffic) parallel to the y-axis at full-scale equivalent locations of x = −27.9 m and x = −8.1 m. For the barrier cases, a solid barrier was constructed from a vertical steel plate (0.1 cm thick) and was placed parallel to the line sources (409.5 m long, full scale). For the Downwind Barrier case, the barrier was located along the downwind edge of the roadway at x = 0 (Fig. 1a), and for the Upwind Barrier case, the barrier was located along the upwind edge of the roadway at a full-scale equivalent of x = −36 m (Fig. 1b). A No Barrier case with no barrier was also included for comparison with the barrier cases.
The barrier height (hb) is either 4.5 m or 6 m (full-scale equivalent), which represent the heights of typical roadside barriers. H, set to 6 m (a nominal barrier height), is the length scale used to normalize the downwind distance. Note that this scaling length is distinct from the actual barrier height, hb. The line sources and barrier each measured 68.25H long. The blockage created by the barriers within the cross-section of the wind tunnel was less than 2% by area, significantly less than the rule-of-thumb value of 5% recommended by Snyder (1981) to minimize effects of free-stream accelerations. See Francisco et al. (2022) for more details as these cases were measured during the same wind tunnel experiment.
2.3. Wind tunnel measurement methods
Brass tubes deployed in groups of six on sampling rakes were used to collect the tracer samples of concentration profiles along the x-axis. Tracer samples were pumped from the brass sampling tubes through hydrocarbon analyzers (HCAs) with flame ionization detectors (Rosemount Model 400A). The HCAs were sampled at 20 Hz over a two-minute period to calculate mean concentrations. Tracer gas buildup within the laboratory was monitored and was treated as a background concentration that was subtracted from the measured concentrations.
Vertical concentration profiles were measured from z/H = 0 to z/H = 6 with a vertical spacing of z/H = 0.125 (0.75 m full scale). Nine vertical profiles were measured downwind of the roadway (x/H = 0.125,1,2,4,7,12,17,27, and 37). All measurements were taken at y = 0 (see Fig. 1). The measured concentrations were non-dimensionalized as:
| (1) |
where C is the tracer concentration (g/m3), Ur is the wind speed (2.98 m/s) at a reference height of 20 cm (30 m full scale), Lx is the width of the roadway in the flow direction (24 cm, 36 m full scale), Ly is the length of the roadway in the y-direction (273 cm, 409.5 m full scale), and Q is the emission rate of the tracer (1.875 g/min). The 36 m wide roadway was chosen to represent a 6-lane highway with 3.75 m wide travel lanes and shoulders and a 6 m wide median.
2.4. Wind tunnel results
Fig. 2 shows the mean velocity (arrows) and turbulence (contours) patterns induced by the 6-m barrier located at x/H = 0. The recirculation region, also referred to as the mixed-wake region in this paper, extends from the surface to a height equal to or higher than the barrier and from barrier downwind to the point on the ground where the velocity changes sign from negative (toward the barrier) to positive. Interpolation of the mean velocity along the ground indicates a recirculation region extends from the lee of the barrier to downwind distances between x/H = 4 and x/H =7. If a roadway were to be located downwind of the barrier, a lane of traffic may be positioned within the recirculation region and the flow of its emissions would be affected by the local direction of the winds within it. The flow in this region enhances the vertical dispersion of the plume. It also induces vertical mixing of the momentum. The portion of the plume that is entrained into this near wake region is then advected downwind at a lower velocity than that with no barrier present.
Fig. 2.
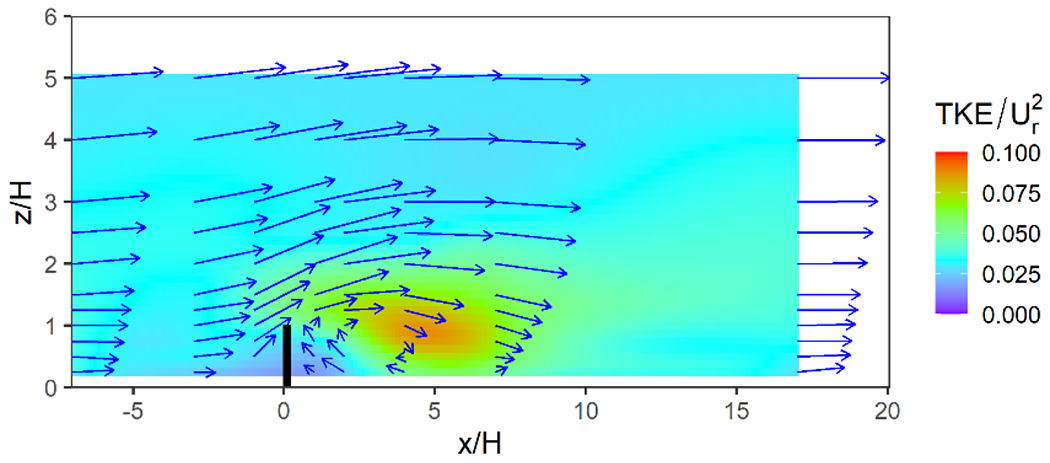
Mean velocity vectors (blue arrows) in the x-z plane for a 6 m tall barrier (vertical black bar) located at x/H = 0. Colored contours show the turbulent kinetic energy . LDV data used to construct the figure were measured at x/H = −7, −3, −1,1,2,4,7, and 17
Vertical profiles of nondimensional concentrations are plotted in Fig. 3 to study the effects of barrier height and location on pollutant concentrations downwind of a roadway. For the no barrier case (‘0 m’ in the legend), the highest concentrations are observed near the ground at z/H = 0.25, where the emissions are released. The presence of a barrier, located either upwind or downwind of the road, results in reductions in the concentrations (compared to the No Barrier case) from the ground level up to a height of about H/2. For the roadway configurations studied (Fig. 1), the magnitude of the reductions associated with the upwind and downwind barriers are similar. Note that the downwind barrier induces a well-mixed region up to the top of the barrier, and the concentration then increases over a small vertical distance before decreasing with height. On the other hand, the concentration profile associated with the upwind barrier shows a decrease with height with a relatively flat region below barrier height. However, the upwind barrier does induce a well-mixed region below the barrier height on the road at x/H = −5.875 immediately downwind of the upwind barrier.
Fig. 3.
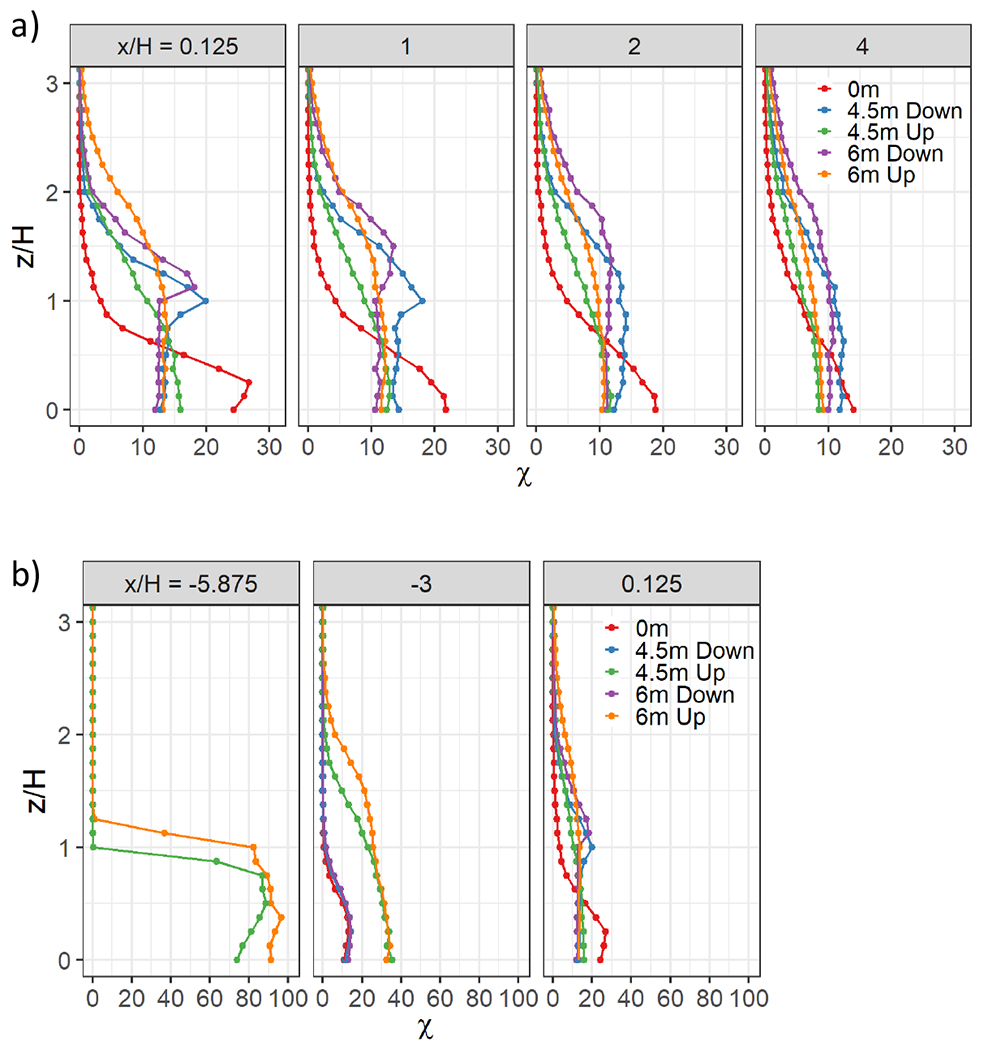
a) Profiles of concentrations (χ) as a function of height (z/H), both normalized, for the No Barrier case (0 m), and Barrier cases with the barrier located at either the upwind edge (Up) or downwind edge (Down) of the roadway and with either a 4.5 m or 6 m barrier height. Each plot shows a downwind distance from the downwind edge of the roadway (x/H). Dots show the measured concentrations in the wind tunnel, and then a connecting line is drawn to highlight the shape of the vertical plume. When present, the downwind barrier is located at x/H = 0 and the upwind barrier is located at x/H = −6. Note that H = 6 m (length scale). b) Plots showing receptor locations at x/H = −5.875, −3, and 0.125, which are close to the upwind edge of the roadway, center of the roadway, and just downwind of the downwind edge of the roadway, respectively. Also note that the scale range on the x-axis differs from Fig. 3a to accommodate the higher values observed over the roadway
In Fig. 4a, the No Barrier case shows concentrations increasing across the roadway, which extends from x/H = −6 to x/H = 0, as the wind moves past both sources and reaches a peak at the downwind edge of the roadway. Note that in these figures, only “breathing level” concentrations are shown, that is, concentrations measured or modeled for heights below 2 m, which for the current cases equates to z/H = 0,0.125, and 0.25. (We acknowledge people may breathe in air at heights greater than 2 m above the surface, however, the highest concentrations are within this range of 0-2 m which is the focus of these plots.)
Fig. 4.
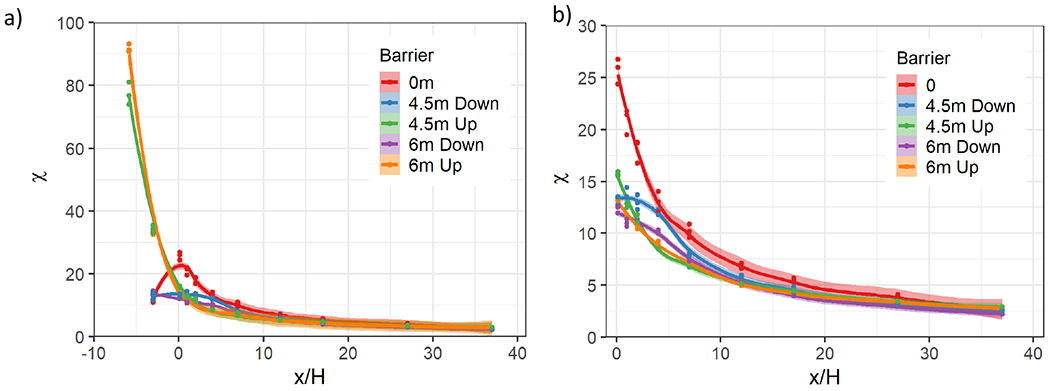
a) Concentration (χ) vs. downwind distance (x/H), both normalized, for receptor heights within the breathing level. Cases shown are the No Barrier case (0 m), and Barrier cases with the barrier located at either the upwind edge (Up) or downwind edge (Down) of the roadway and with either a 4.5 m or 6 m barrier height. When present, the downwind barrier is located at x/H = 0 and the upwind barrier is located at x/H = −6. Dots show the measured concentrations in the wind tunnel within the breathing level, and the spread of these observations are shown by the shading of the smoothed lines (95% confidence interval). Note that H = 6 m (length scale). b) Plot omitting the receptor locations at x/H = −5.875, −3, −0.125, which are close to the upwind edge of the roadway, center of the roadway, and close to the downwind edge of the roadway, respectively
In contrast, the Upwind Barrier cases show highest concentrations at x/H = −5.875 which is upwind of the source, close to the barrier. This suggests that the recirculation region created by the upwind barrier sweeps the emissions toward the upwind barrier, resulting in elevated concentrations confined over the roadway while also mitigating the concentrations downwind. These over roadway concentrations are high relative to other cases measured because the slow backward movement of air in the recirculation region reduces dilution of the source emissions relative to that of the No Barrier case. Concentrations at the center of the roadway (x/H = −3) are roughly 200-300% higher for the Upwind Barrier cases compared to the Downwind Barrier cases (Fig. 4a). This enhancement of concentrations is caused by the reverse flow within the recirculation region pushing concentrations up against the lee side of the upwind barrier. Similar to the upwind barrier, the downwind barrier also has a significant effect in mitigating the downwind concentrations (Fig. 4b).
In the next section, we propose a dispersion model that accounts for the observed effects discussed in the preceding sections.
3. Upwind barrier algorithm
Ahangar et al. (2017) developed a semiempirical dispersion model algorithm that accounts for the flow and dispersion effects induced by an upwind barrier based on an earlier wind tunnel experiment (Heist et al. 2009). The algorithm captured two major effects observed in the wind tunnel results. First, when a source is located within the recirculating flow that occurs downwind of a barrier, the emissions from that source are swept upwind toward the barrier and disperse as if released from the location of the barrier. In the algorithm described in Ahangar et al. (2017), the plume is released from the barrier location at a height equal to half the barrier height. In addition, the wind tunnel data revealed that the turbulence levels downwind of the barrier are higher than in the approach flow, causing the plume to disperse more rapidly than a plume within an unobstructed flow. The algorithm captures this effect by increasing the magnitude of the friction velocity (u*), which is then used to parameterize the growth rate of the plume.
The original upwind barrier algorithm was developed by considering only ground-level concentrations; however, an examination of the vertical distribution of the plume using the new wind tunnel experiments described in Section 2 suggests a few modifications to the algorithm to better represent these observations. These modifications are threefold: a change in the recirculation region length, an increase in the release height, and an attenuation of the plume wind speed to capture the reduced wind speeds in the region immediately downwind of the barrier. The length of the recirculation region downwind of a single barrier was adjusted to 6.5 hb to better capture the upwind sweep of the roadway emissions for both barrier heights in the current study (Fig. 5a). For cases with barriers on both sides of the roadway, the length of the recirculation region for the upwind barrier was left unchanged from the value of 4 hb used in the Ahangar model (Fig. 5b). The source height was increased to a height of z/H = 0.75 (increased from the value of z/H = 0.5 used in Ahangar et al. 2017) to improve the simulation of the vertical profiles of concentrations measured downwind of the barrier in the wind tunnel.
Fig. 5.
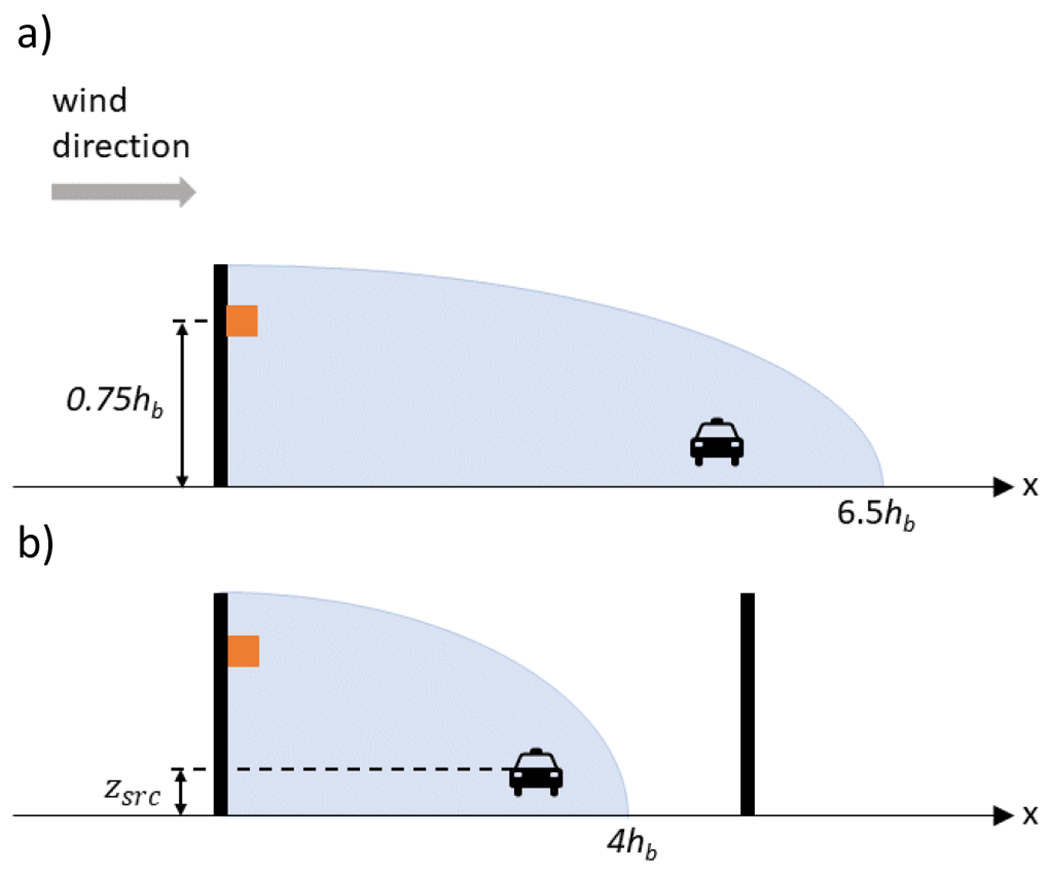
Diagram showing the proposed recirculation region (shaded region) for a one-barrier case (top) and a two-barrier case (bottom). The recirculation region extends from the upwind barrier location (black bar) to a downwind distance of a) 6.5 hb for the one-barrier case and b) 4 hb for the two-barrier case. For both cases, the original source height (car icon) is denoted as zsrc. If the original source is within the recirculation region, the source is moved to the location of the upwind barrier and to a source height of 0.75hb (orange square)
In the original algorithm the wind speed used to advect the plume, i.e., the effective wind speed (Ueff), was calculated at the height of the center of mass of the plume, as it was for the RLINE and RLINEXT source options of AERMOD (Snyder et al. 2013; Venkatram et al. 2013). However, Ueff was calculated with the enhanced value of u* that results from the presence the barrier: the value of u* is enhanced compared to that of the approach flow by multiplying by a factor , where is the surface roughness length downwind of the barrier and is estimated to be hb/9 (Venkatram and Schulte 2018). The enhanced friction velocity also increases the magnitude of the Obukhov length.
The third modification to the original upwind barrier algorithm is to the calculation of Ueff in the region immediately downwind of the barrier. The value of Ueff is multiplied by an attenuation factor FUeff to better reflect the reduced wind speeds in the wake of the barrier. Measurements of wind speed, U, in the wake of the barrier, normalized with the approach wind speed at barrier height, Uhb, show that wind speeds are near zero just downwind of the barrier location and increase with downwind distance (Fig. 6) approaching a value of 1 beyond x/hb = 20. Since the plume itself is being swept upwind into this region and modeled as dispersing from this point, changes in plume wind speed are parameterized to reflect this gradual increase in speed starting from the barrier. The behavior observed in Fig. 6 is parameterized using the factor FUeff as:
| (2) |
Fig. 6.
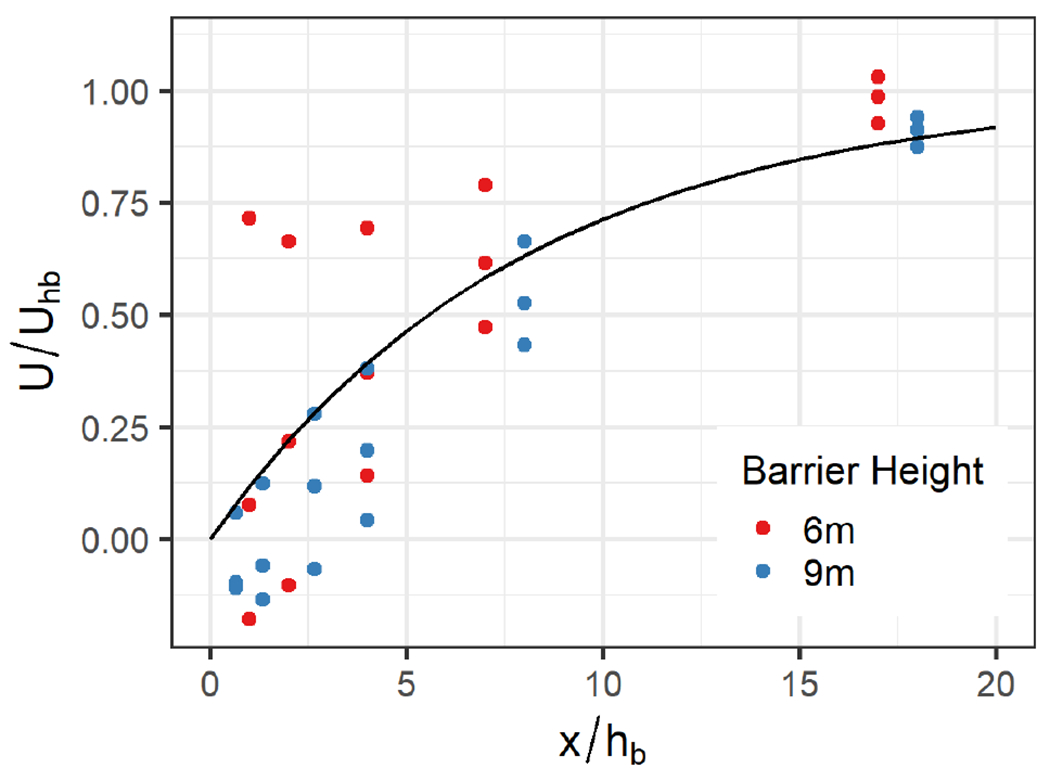
Measurements of normalized wind speed (U/Uhb) between z/H = 0.75 and 1.25 as a function of downwind distance from the barrier (x/hb). Two barrier cases are shown, one with a barrier height of 6 m (red) and another with a height of 9 m (blue). Fueff is shown as the black line
The model that treats the impact of the downwind barrier is described in Francisco et al. (2022). It turns out that we can combine the models for the downwind barrier and the upwind barrier into a single model that describes dispersion of roadway emissions in the presence of both barriers. If a second barrier is present (two-barrier case), the recirculation region extends from the upwind barrier location to a downwind distance of 4hb as described in Ahangar et al. (2017). As expected, the presence of both upwind and downwind barriers leads to concentration reduction that is larger than those associated with one barrier, located upwind or downwind. The magnitude of the reduction depends on a number of factors, which include the heights of the barriers, the spacing between them, and the governing micrometeorology.
4. Results and discussion
4.1. Air dispersion modeling
The upwind barrier algorithm described in section 3 was implemented in version 21112 of AERMOD, a steady-state dispersion modeling system (US EPA 2021). The results in this section include the update to the downwind barrier algorithm as described in Francisco et al. (2022), which was also implemented in this version of AERMOD for the RLINEXT source type (an extension of the RLINE source type). RLINE and RLINEXT sources model the air quality impact of highways by treating vehicle emissions as originating from line sources along the center lines of highway lanes. Monin-Obukhov similarity theory is used to profile the winds and turbulence (Cimorelli et al. 2005; Perry et al. 2005). Vertical dispersion is modeled using plume spreads based on current understanding of dispersion from sources located on the ground (Venkatram et al. 2013). The vertical concentration profile is taken to be Gaussian.
The RLINEXT source option is currently a nonregulatory option within AERMOD and is still under development. RLINEXT contains algorithms for modeling barriers located near a roadway and was used to simulate the barrier cases described in section 2.1. See the Appendix for details on the model setup.
4.2. Effect of barrier height and location
In the following discussion, comparisons will be made between the effects of the upwind and downwind barriers and the ability of the algorithms to capture those effects. The Downwind Barrier cases and algorithm are fully discussed in Francisco et al. 2022. Fig. 7 compares vertical concentration profiles from the improved upwind and downwind barrier algorithms (orange lines) with corresponding measurements from the wind tunnel (black dots) for all cases and downwind distances up to x/H = 7. Also shown are the profiles from the original Ahangar et al. (2017) algorithms (purple dashed lines). The updates in the upwind barrier algorithms as outlined in section 3 and for the downwind barrier described in Francisco et al. (2022) bring the model predictions closer to the wind tunnel observations. Both the upwind and downwind barriers show a similar reduction in ground-level concentrations relative to the No Barrier case. The upwind barrier profiles have a distinct shape that differs from the downwind barrier profiles. The profiles for the downwind barrier exhibit uniform concentrations from the ground to a height of z/H = 1.25 and a Gaussian shape above this height.
Fig. 7.
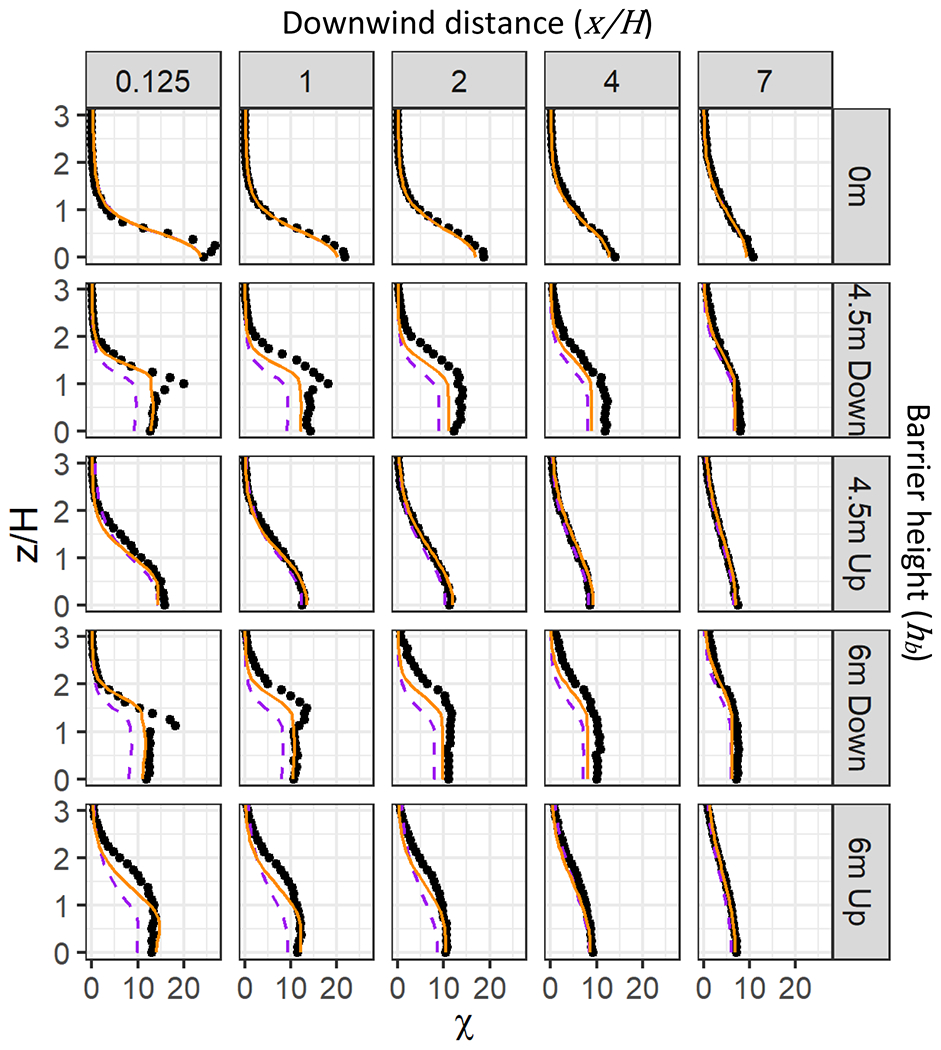
Profiles of concentrations (χ) as a function of height (z/H), both normalized. Shown are the No Barrier case (0 m), and Barrier cases with a barrier located at either the upwind edge (Up) or downwind edge (Down) of the roadway and with a barrier height of either 4.5 m or 6 m. Each panel shows a downwind distance from the downwind edge of the roadway (x/H). When present, the downwind barrier is located at x/H = 0 and the upwind barrier is located at x/H = −6. Wind tunnel observations are shown with black dots, AERMOD model results are shown with orange solid lines, and the previous version of the barrier algorithms are shown with purple dashed lines. Note that H = 6 m (length scale)
The profiles for the upwind barrier do not have a distinctive elevated peak in concentrations and show a Gaussian shape with a deeper vertical plume than the No Barrier case. The upwind barrier algorithm captures both the overall profile shape and ground-level concentrations. For the Downwind Barrier cases, the downwind barrier algorithm captures the shape of the profiles but exhibits an underprediction that may be due to an overestimation in wind speed for those cases (see further discussion on Downwind Barrier cases in Francisco et al. 2022).
Fig. 8 compares concentrations from the wind tunnel with corresponding model results measured from the ground level up to a height of z/H = 6 for all locations downwind of the roadway. The geometric mean (MG) and geometric standard deviation (SG) of the ratios of the measured to the modeled values, defined in Venkatram (2008), were used to measure model performance. The ideal value for both MG and SG is 1.0 where MG is a measure of bias in the model estimate and SG is a measure of uncertainty in the model prediction. FAC2, the proportion of model estimates (Cp) within a factor of 2 of the wind tunnel measurements (C0), specifically , was also calculated to evaluate model performance. In computing these statistics, only concentrations above the level of quantification (χ = 0.001) were included (Chang and Hanna 2004; Pirhalla et al. 2022).
Fig. 8.
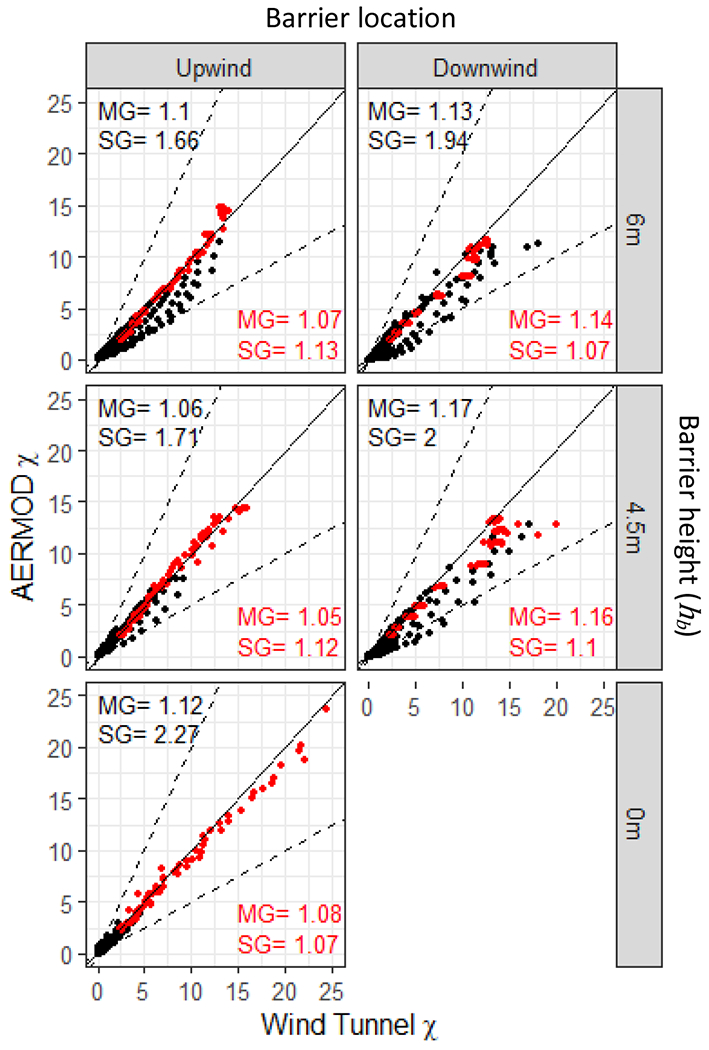
Comparing normalized concentration (χ) between AERMOD model results and wind tunnel observations. Shown are the No Barrier case (0 m), and Barrier cases with a barrier located at either the upwind edge (Upwind) or downwind edge (Downwind) of the roadway and with a barrier height of either 4.5 m or 6 m. Concentration values are shown as dots with red dots for locations from ground level (z/H = 0) to 6 m (z/H = 1). Dashed lines signify the FAC2 for concentration values. The geometric mean (MG) and geometric standard deviation (SG) statistics are shown for each case and are calculated with all data points (black) and also for the subset of ground-level to 6-m data points (red)
Concentrations at heights below 6 m are shown in red since these heights are most common for human exposure (including the typical breathing level and many low-rise buildings). For these locations (z/H ≤ 1), all the measurements are within a factor of 2 of the model estimates: FAC2 = 1. For the No Barrier case (hb = 0), modeled results are in good agreement with the observations, indicated by an MG of 1.08 and an SG of 1.07. For the Upwind Barrier cases, the model yielded MG values of 1.05 and 1.07 for barrier heights of 4.5 m and 6 m, respectively. For the Downwind Barrier cases, the values of MG are 1.16 and 1.14 for barrier heights of 4.5 m and 6 m, respectively. For all cases, the model estimates are biased lower than the measurements as indicated by values of MG greater than 1.
Fig. 9 shows breathing-level concentrations as a ratio of Barrier concentrations to No Barrier concentrations (χBarrier/χNoBarrier), where values below 1.0 indicate a reduction in concentrations due to the presence of a barrier. All barriers, either on the upwind or downwind edge of the roadway, yield reductions in breathing-level concentrations relative to the No Barrier case, with the greatest reductions at the downwind edge of the roadway. Upwind of the receptor location at x/H = 37, the concentration ratios do not return to 1.0, which show the lasting effect the barrier has on downwind concentrations. The value at the x/H = 37 receptor is a ratio of two small concentrations and produces scatter around the concentration ratio of 1.0, which may explain why the value is greater than 1.0 for some cases. At the downwind edge of the roadway (x/H = 0.125), the average observed concentration ratio (χBarrier/χNoBarrier) equals 0.613, 0.514, 0.514, and 0.480 for 4.5 m upwind, 4.5 m downwind, 6 m upwind, and 6 m downwind barriers, respectively. While both the upwind and downwind barriers produce similar reductions in concentrations, there is a slightly greater reduction in concentrations with the downwind barriers compared to the upwind barriers. The 6-m barriers have a higher mitigation effect than the 4.5-m barriers. The model captures the general trend of concentration reductions by showing the greatest reductions at the downwind edge of the roadway for the 6-m barrier compared to the 4.5-m barrier.
Fig. 9.
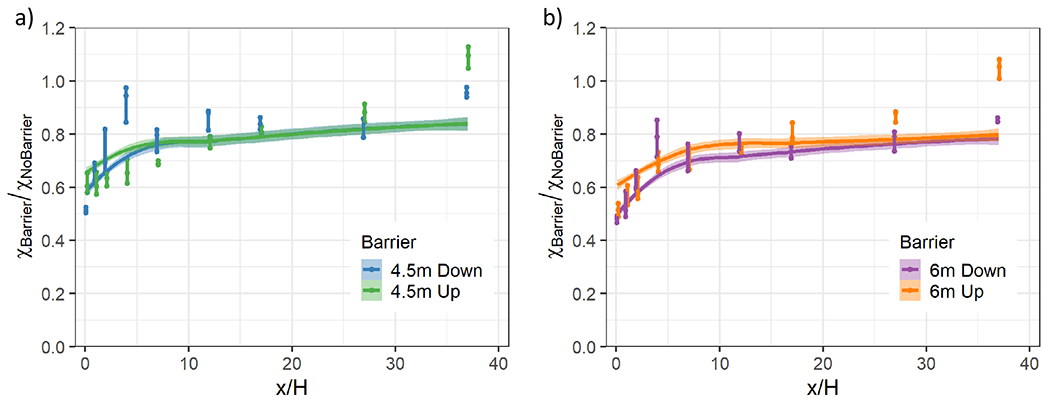
Normalized concentration ratios (XBarrier/XNoBarrier) vs. downwind distance from the barrier (x/H) for receptor heights within the breathing level for Barrier cases with the barrier located at either the upwind edge (Up) or downwind edge (Down) of the roadway and with either a 4.5 m or 6 m barrier height. When present, the downwind barrier is located at x/H = 0 and the upwind barrier is located at x/H = −6. Wind tunnel observations (dots) and AERMOD model results (lines with shading indicating the 95% confidence interval) are shown. At each x/H location, the three wind tunnel observations within the breathing level are connected with a vertical line and also slightly displaced along x/H to minimize overlapping other data points
5. Summary and conclusions
This paper focuses on the impact of solid barriers located upwind of a highway in reducing vehicle related concentrations that occur downwind of the roadway as compared to a highway without barriers. Measurements made in the US EPA meteorological wind tunnel and described in this paper show that the mitigating impact on ground-level concentrations of an upwind barrier is comparable to that of a downwind barrier. Field studies (Finn et al. 2010) and wind tunnel experiments (Heist et al. 2009) demonstrated that downwind barriers reduce the impact of highway emissions by lifting the emitted plumes over the barrier and then dispersing them vertically. Upwind barriers lead to reductions in concentrations through a different two-step mechanism: 1) The recirculation region in the lee of the upwind barrier first draws in emissions from the highway towards the barrier. 2) At the barrier, these emissions are transported vertically before they are entrained into the flow directed away from the barrier, and then dispersed vertically. The upwind barrier displaces part of the emissions from the road towards the upwind barrier, thus increasing the distance between downwind receptors and emissions. All barriers, either on the upwind or downwind edge of the roadway, yield reductions in breathing-level concentrations (due to traffic-related emissions) relative to the No Barrier case, with the greatest reductions at the downwind edge of the roadway.
The different flow patterns induced by the upwind and downwind barriers result in significant differences in concentration patterns on the road. Concentrations at the center of the roadways (x/H = − 3) with an upwind barrier are roughly 200-300% higher than those measured on roadways with a downwind barrier (Fig. 4a). This is related to the reverse flow within the recirculation region pushing concentrations towards the upwind barrier. The mean of the on-road concentrations on a road with a downwind barrier is not much different than that on a road without any barriers. This difference between on-road concentrations measured on roads with either upwind or downwind barriers indicates that although both types of barriers mitigate the impact of vehicle emissions downwind of the road, the upwind barrier may have adverse impacts on the air quality on the road.
We have updated a semi-empirical dispersion model that incorporates the physics revealed by wind tunnel measurements that produce these concentration reductions. This updated algorithm improves upon an algorithm proposed by Ahangar et al. (2017). The model presented here not only describes ground-level concentrations, as in Ahangar et al. (2017), but also provides good descriptions of the vertical profiles of concentrations for downwind distances up to 37H. However, the proposed algorithms are not designed to estimate on-road concentrations. The upwind barrier model proposed in this paper as well as the downwind barrier algorithm described in Francisco et al. (2022) have been incorporated into AERMOD (version 21112) as a nonregulatory option.
Several additional factors warrant further study including the effect of atmospheric stability and wind direction, particularly for winds nearly parallel to the roadway. We expect the barrier disturbance to the flow and turbulence in the near-field to predominate over other effects such as surface roughness and atmospheric stability, at least for the less extreme cases of those conditions. In addition, we expect that the proposed recirculation region would generally represent a wide range of conditions since the disturbance to the near-field flow is dominated by the presence of the barrier. However, for some more extreme cases (near parallel winds, or highly stable or convective conditions), there may be some significant variation. Barrier edge effects are complex and are another area requiring further investigation. Future field and laboratory studies should be designed to investigate these phenomena.
6. Disclaimer
The US Environmental Protection Agency, through its Office of Research and Development, funded and directed the research described herein. It has been subjected to the Agency’s review and has been approved for publication. Note that approval does not signify that the contents necessarily reflect the views of the Agency. Mention of trade names, products, or services does not convey official US EPA approval, endorsement, or recommendation. This project was supported in part by an appointment to the Research Participation Program at the ORD/CEMM, US EPA, administered by the Oak Ridge Institute for Science and Education through an interagency agreement between the US Department of Energy and US EPA.
9. Appendix
Air dispersion model description
US EPA’s AERMOD air dispersion modeling system (version 21112) was used to simulate the cases described in section 2.2. The RLINEXT source option, currently a nonregulatory option, was used in the AERMOD input file by using the RBARRIER keyword. The surface meteorology (.sfc) and vertical profile (.pfl) input files were developed from the wind tunnel velocity profiles (experiment described in section 2). The same .sfc and .pfl input files were used for all cases. The wind tunnel experiments were steady-state simulations, so AERMOD was set up to model a neutrally buoyant atmospheric boundary layer with 1 hour of meteorological conditions: a reference wind speed of 2.65 m/s at a reference height of 18 m, roughness length of 0.27 m, friction velocity value of 0.25 m/s, and Obukhov length of 1800 m (characteristic of neutrally stable atmospheric conditions).
To represent the wind tunnel line source, a road width of 1 m was used for all cases to represent the 0.6 cm (0.9 m full-scale) wide source in the wind tunnel set-up. The initial horizontal dispersion coefficient σy0 is a function of the width of the roadway, but since the road is perpendicular the wind, this parameter has very little effect on the results. The two line sources and barrier (if present) were adequately long so that there were no edge effects in the simulations. The original source height (zsrc) and initial vertical dispersion coefficient (σz0) were set by matching the wind tunnel observations and model results, considering a small range of reasonable input values, for the No Barrier case; therefore, σz0 of 0.5 m and zsrc of 1.5 m were used for all cases. The line-source emission rate was set at 0.5 g/m/s for each line source to form a combined Q/Ly (the emission rate per unit length) of 1 g/m/s.
Concentrations were simulated at heights from z/H = 0 to z/H = 6 with a vertical spacing of 0.75 m, and at nine locations along the x-axis downwind of the barrier at x/H = 0.125,1,2,4,7,12,17,27, and 37.
7. Data Availability
The data that support the findings of this study are openly available in “EPA ScienceHub” repository at http://doi.org/10.23719/1527771.
8. References
- Ahangar FE, Heist DK, Perry S, Venkatram A (2017) Reduction of air pollution levels downwind of a road with an upwind noise barrier. Atmos. Environ 155: 1–10. 10.1016/j.atmosenv.2017.02.001 [DOI] [PMC free article] [PubMed] [Google Scholar]
- Brandt S, Perez L, Künzli N, Lurmann F, Wilson J, Pastor M, McConnell R (2014) Cost of near-roadway and regional air pollution–attributable childhood asthma in Los Angeles County. J. Allergy Clin. Immunol 134: 1028–1035. 10.1016/jjaci.2014.09.029 [DOI] [PMC free article] [PubMed] [Google Scholar]
- Chang JC, Hanna SR (2004) Air quality model performance evaluation. Meteorol. Atmos. Phys 87: 167–196. 10.1007/s00703-003-0070-7 [DOI] [Google Scholar]
- Chen Z, Newgard CB, Kim JS, Ilkayeva O, Alderete TL, Thomas DC, Berhane K, Breton C, Chatzi L, Bastain TM, McConnell R, Avol E, Lurmann F, Muehlbauer MJ, Hauser ER, Gilliland FD (2019) Near-roadway air pollution exposure and altered fatty acid oxidation among adolescents and young adults – The interplay with obesity. Environ. Int 130: 104935. 10.1016/j.envint.2019.104935 [DOI] [PMC free article] [PubMed] [Google Scholar]
- Cimorelli AJ, Perry SG, Venkatram A, Weil JC, Paine RJ, Wilson RB, Lee RF, Peters WD, Brode RW (2005) AERMOD: a dispersion model for industrial source applications. Part I: general model formulation and boundary layer characterization. J. Appl. Meteorol 44: 682–693. 10.1175/JAM2227.1 [DOI] [Google Scholar]
- Finn D, Clawson KL, Carter RG, Rich JD, Eckman RM, Perry SG, Isakov V, Heist DK (2010) Tracer studies to characterize the effects of roadside noise barriers on near-road pollutant dispersion under varying atmospheric stability conditions. Atmos. Environ 44: 204–214. 10.1016/j.atmosenv.2009.10.012 [DOI] [Google Scholar]
- Francisco DM, Heist DK, Venkatram A, Brouwer LH, Perry SG (2022) Observations and parameterization of the effects of barrier height and source-to-barrier distance on concentrations downwind of a roadway. Atmos. Pollut. Res, 13: 101385. 10.1016/j.apr.2022.101385 [DOI] [PMC free article] [PubMed] [Google Scholar]
- Health Effects Institute (HEI) (2010) Traffic-Related Air Pollution: A Critical Review of the Literature on Emissions, Exposure, and Health Effects. HEI Special Report 17, Health Effects Institute, Boston, MA [Google Scholar]
- Heist DK, Perry SG, Brixey LA (2009) A wind tunnel study of the effect of roadway configurations on the dispersion of traffic-related pollution. Atmos. Environ 43: 5101–5111. 10.1016/j.atmosenv.2009.06.034 [DOI] [Google Scholar]
- Irwin HPAH (1981) The design of spires for wind simulation. J. Wind Eng. Ind. Aerodyn 7: 361–366. 10.1016/0167-6105(81)90058-1 [DOI] [Google Scholar]
- Perry SG, Cimorelli AJ, Paine RJ, Brode RW, Weil JC, Venkatram A, Wilson RB, Lee RF, Peters WD (2005) AERMOD: a dispersion model for industrial source applications. Part II: model performance against 17 field study databases. J. Appl. Meteorol. Climatol 44: 694–708. 10.1175/JAM2228.! [DOI] [Google Scholar]
- Perry SG, Heist DK, Brouwer LH, Monbureau EM, Brixey LA (2016) Characterization of pollutant dispersion near elongated buildings based on wind tunnel simulations. Atmos. Environ 142: 286–295. 10.1016/j.atmosenv.2016.07.052 [DOI] [Google Scholar]
- Pirhalla MA, Heist DK, Perry SG, Tang W, Brouwer LH (2021) Simulations of dispersion through an irregular urban building array. Atmos. Environ 258: 118500. 10.1016/j.atmosenv.2021.118500 [DOI] [PMC free article] [PubMed] [Google Scholar]
- Robins A (2003) Wind tunnel dispersion modelling some recent and not so recent achievements. J. Wind. Eng. Ind. Aerodyn 91, 1777–1790. 10.1016/j.jweia.2003.09.025 [DOI] [Google Scholar]
- Schulte N, Snyder M, Isakov V, Heist D, Venkatram A (2014) Effects of solid barriers on dispersion of roadway emissions. Atmos. Environ 97: 286–295. 10.1016/j.atmosenv.2014.08.026 [DOI] [Google Scholar]
- Snyder MG, Venkatram A, Heist DK, Perry SG, Petersen WB, Isakov V (2013) RLINE: a line source dispersion model for near-surface releases. Atmos. Environ 77: 748–756. 10.1016/j.atmosenv.2013.05.074 [DOI] [Google Scholar]
- Snyder WH (1979) The EPA Meteorological Wind Tunnel: Its Design, Construction, and Operating Characteristics. US Environmental Protection Agency, Research Triangle Park, NC. Report No. EPA-600/4-79-051 [Google Scholar]
- Snyder WH (1981) Guideline for Fluid Modeling of Atmospheric Diffusion. Report No. EPA-600/8-81-612 009. U.S. Environmental Protection Agency, Research Triangle Park, NC. [Google Scholar]
- United States Environmental Protection Agency (US EPA) (2021) User’s Guide for the AMS/EPA Regulatory Model (AERMOD). Report No. EPA-454/B-21-001, April 2021. US EPA, Office of Air Quality Planning and Standards, RTP, NC. https://www.epa.gov/scram/air-quality-dispersion-modeling-preferred-and-recommended-models#aermod [Google Scholar]
- Venkatram A (2008) Computing and displaying model performance statistics. Atmos. Environ 42: 6862–6868. 10.1016/j.atmosenv.2008.04.043 [DOI] [Google Scholar]
- Venkatram A, Schulte N (2018) Urban Transportation and Air Pollution. Elsevier, New York, pp. 89 and 145 [Google Scholar]
- Venkatram A, Snyder MG, Heist DK, Perry SG, Petersen WB, Isakov V (2013) Re-formulation of plume spread for near-surface dispersion. Atmos. Environ 77: 846–855. 10.1016/j.atmosenv.2013.05.073 [DOI] [Google Scholar]
Associated Data
This section collects any data citations, data availability statements, or supplementary materials included in this article.
Data Availability Statement
The data that support the findings of this study are openly available in “EPA ScienceHub” repository at http://doi.org/10.23719/1527771.


