

Abstract

This study reports for the first time the adsorption capacity of a novel adsorbent Croton bonplandianus Baill. biochar. Its adsorption capacity was further enhanced by loading magnetic composites on it, which makes it an efficient medium for the adsorption of dyes. Two azo dyes, Basic Brown 1 (BB1) and Basic Orange 2 (BO2), were studied for their effective adsorption from aqueous media. A comprehensive characterization was performed by using scanning electron microscopy (SEM) and Fourier transform infrared spectroscopy (FTIR) to study the properties of Fe2O3-loaded C. bonplandianus Baill. biochar (FO-CBPBB). A series of batch experiments were conducted to optimize various parameters (pH, contact time, adsorbent amount, initial BB1 and BO2 concentrations, and temperature) for the maximum adsorption of BB1 and BO2 on the FO-CBPBB adsorbent. The percentage of BB1 and BO2 dyes that adsorb to FO-CBPBB under the best experimental circumstances (pH of solution 7, contact time 80 min, temperature of solution 40 °C, initial BB1 and BO2 dye concentrations 80 mg L–1, and adsorbent dose 1 g L–1) was 93 and 95%, respectively. The best adsorption of BB1 and BO2 was accomplished by optimizing the effects of several factors, including the starting dye concentration, contact time, and temperature, based on the central composite design. The Freundlich and Langmuir isotherm models were used to examine the equilibrium data. The Langmuir isotherm with the greatest adsorption capacity and R2 value effectively captured the experimental results. When kinetic parameters were investigated, it was found that pseudo-second-order was appropriate, reflecting the fact that the dye–adsorbent interaction was the rate-controlling factor in this study. The sorption process was endothermic and spontaneous, as shown by the thermodynamic variables. Based on the interaction between the adsorbent and azo dyes, it was concluded that the adsorption process was electrostatic in nature. Adsorbents that have been synthesized can effectively remove azo dyes from wastewater. Excellent regeneration efficiency was exhibited by FO-CBPBB, which makes it an eco-friendly and cost-effective alternative to other costly techniques applied for water purification.
Introduction
Socioeconomic development has been positively impacted by industrial operations, such as the manufacture of paint, textiles, printing, petrochemicals, and cosmetics. However, a significant portion of the contamination of water bodies is caused by the discharge of wastewater enriched with organic compounds from various industrial activities.1−4 Due to their hazardous properties and high volume, the wastewater generated during the textile production process has resulted in significant contamination.5 Dyes are highly toxic and colored and are the principal pollutant in the effluent from the textile industry.6 The great resilience of residual dyes to light, heat, and oxidative chemicals makes it challenging for them to break down in textile effluent. Popular azo dyes with negative effects on both human health and living things include Basic Brown 1 (BB1) and Basic Orange 2 (BO2).7 To purify wastewater before it is released into the environment, BB1 and BO2 must be adsorbed. To remove BB1 and BO2 as well as other colors, numerous techniques including coagulation, oxidation, biological, and physicochemical procedures have been developed.8−12
Nevertheless, low-cost techniques for eliminating BB1, BO2, and other dyes from aquatic environments can be created and used. Adsorption holds the most potential among these methods because of its simplicity, low cost, and lack of toxicity. Although it is a common and commercially available adsorbent, activated carbon is expensive.12−15 Recent investigations on the adsorption capacity of different contaminants from an aqueous solution have used biosorbents made from several types of biomass.16 Several techniques have been used to modify biosorbents to increase their adsorption capacity. Due to their effective adsorption capacity, magnetic nanoparticles have become a favorable substitute in biosorbent modification.17,18 These adsorbents are simple to synthesize, economically affordable, and eco-friendly. Furthermore, mixtures produced by adsorption techniques can be easily removed from them.19,20 However, the greatest obstacle in employing these magnetic nanoparticles is their high cost when used. Therefore, these products can be used in conjunction with biochar to address this problem. Croton bonplandianus Baill., a well-liked plant in Southeast Asia and the subcontinent, has expanded in size significantly. C. bonplandianus is a weed that grows in rice or sugar cane fields, abandoned railway tracks, and broad open ravines.21 This plant is indigenous to Bangladesh, South America, South Western Brazil, North Argentina, South Bolivia, Paraguay, India, and Pakistan. It has mostly been utilized as a medication for various health-related conditions. Parts of Africa and India, among other places, use C. bonplandianus in traditional medicine. It is thought to offer therapeutic benefits for treating ailments like diarrhea, dysentery, and skin disorders.22
To the best of the researcher’s knowledge, there is no study that has already been done on utilizing Fe3O4-loaded C. bonplandianus biochar to remove BB1 and BO2. To treat BB1 and BO2 from an aqueous solution, this work created a novel adsorbent by altering the bonplandianus bail biochar with Fe3O4. The adsorption capacity of biochar can be improved by adding nanomaterials to the mixture. Structures, morphology, and chemical linkages were all examined appropriately. To assess the effectiveness of the novel adsorbent, the outcomes of adsorption isotherms and kinetics were recorded. Hence, the purposes of this study were to manufacture magnetic Fe3O4 nanoparticle-loaded C. bonplandianus biochar and to evaluate the ability of the Fe3O4 nanoparticle-loaded C. bonplandianus biochar to adsorb BB1 and BO2 from aqueous solutions. Batch adsorption tests were carried out in a variety of operational settings (initial pH values, contact times, adsorbent dosages, temperature, and initial BB1 and BO2 concentrations). The evaluation of the adsorption processes also included the use of adsorption isotherms and kinetics. Previous research on the adsorption of dyes focused on the impact of certain variables while holding the other constants. This method, nevertheless, does not capture the overall impact of all of the factors. To obtain the ideal levels, this method is time-consuming and needs more tests and products, which might lead to complications in the experiment. By jointly optimizing the process parameters using a statistical experimental design, such as the response surface methodology (RSM), these constraints could be alleviated. In this regard, the initial BB1 and BO2 concentration (Ci), contact time, and temperature were among the numerous parameters that were optimized using central composite design (CCD) in conjunction with RSM.
Results and Discussion
Characterization of Adsorbent
SEM and FTIR were used to characterize the adsorbent with regard to surface topography and composition. Figure 1 displays the FTIR spectra of the virgin MBC, the BB1-loaded MBC, and the BO2-loaded MBC. The FTIR spectra of the sorbent, which were obtained in the wavenumber range of 4000–550 cm–1, are presented in Figure 1 below. These spectra demonstrate the principal functional groups present in the MBC, BB1-loaded MBC, and BO2-loaded MBC. Here, broad band in the range of 3100–3600 cm–1 is found to be possible due to the existence of the OH and N–H groups. Since the breadth of the −OH group band in this region indicates the existence of hydrogen bonds in these compounds, this is caused by the stretching vibration of the −OH hydroxyl functional groups, comprising hydrogen bonds.23 The C–H band can be seen in the range of 2500–3000 cm–1.24 The 1550–1750 cm–1 bands indicated the presence of carboxylic groups on FO-CBPBB by indicating C=O. The Fe–O of iron oxide is what causes the peak to appear at 572 cm–1 in the MBC spectrum. Indirectly, this demonstrated that Fe3O4 was present in the MBC.25 The peaks in the range of 900–1000 cm–1 are bending vibrations of the C=C.26 The CH bending vibration demonstrated stable binding and was significant in the adsorption process. After adsorption, the existence of the C=C stretching vibration caused the intensity of the spectra to increase. The removal efficiency of BB1 and BO2 was impacted by the hydroxyl and carboxylic groups. In comparison to the spectrum of virgin MBC, BB1-loaded MBC underwent some alterations in some bands. The Fe–O peak at 572 cm–1 is shifted in the BB1-loaded MBC’s spectrum. This shift of the peak in the case of loaded biochar is due to the dye–adsorbent interaction. When dyes are loaded on the magnetic adsorbent, these interact with the iron functional groups present on the surface, and this developed interaction causes a change in the position of the peak. This shift is a confirmation of a strong interaction between iron-loaded biochar and dye molecules. Overall, the variations seen between the MBC, BB1-loaded MBC, and BO2-loaded MBC FTIR spectra are indicative of their various functional groups. For example, C–O–C is in charge of Fe3O4 loading onto BC to create MBC and functional groups like the aromatic C=C and C=O; −OH, −CH3, and −CH=CH2 are in charge of BB1 and BO2 adsorptions onto MBC.
Figure 1.

FTIR of (a) virgin Fe3O4-impregnated C. bonplandianus biochar FO-CBPBB, (b) BB1-loaded FO-CBPBB, and (c) BO2-loaded FO-CBPBB.
Before and after the adsorption process, the SEM micrograph of C. bonplandianus biochar impregnated with Fe3O4 was captured at different resolutions. It was discovered that the FO-morphology CBPBBs before adsorption (Figure 2a) differed from the FO-morphology CBPBBs after BB1 and BO2 adsorptions (Figure 2b,c). The Fe3O4-impregnated C. bonplandianus biochar has a rough and porous surface (Figure 2a). Because of the chemical modification of the surface, the Fe3O4-impregnated C. bonplandianus biochar may be seen to have a rough surface following adsorption with BB1 and BO2. In contrast to a smooth surface, the sorbent’s rough, protruding surface makes it feasible for a multilayer and intensive adsorption to take place. There were different sizes of these cavities as clear in the SEM images, which are responsible for the attachment of dye molecules and functional groups on the surface to enhance the adsorption process.27 The SEM findings are consistent with the provided data.
Figure 2.

Scanning electron micrographs of MBC (a) before dye adsorption, (b) after BB1 dye adsorption, and (c) after BO2 dye adsorption.
BET Analysis
The Brunauer–Emmett–Teller (BET) method is used to calculate the surface area and pore size of the adsorbent by measuring the adsorption and desorption capacities of the N2 gas as shown in Figure 3. N2 isotherm shows a pore size distribution curve with a 15.4 cm2 g–1 pore diameter of 5.1 nm, and pore volume was found to be 0.005 cm2 g–1. A type (IV) hysteresis loop (as per the IUPAC classification) can be seen in the case of MBC in Figure 3, which is characteristic of mesoporous adsorbents. In this case, the adsorption volume quickly increases at low relative pressures due to contact of the adsorbate molecules with the higher energetic section followed by the interaction with the less energetic section. Moreover, it also shows the potential for multilayer adsorption of the adsorbate on the adsorbent. The mesoporous nature, elevation in the surface area, and reduction in the pore size in MBC make it a potential biomaterial for BB1 and NO2 dye adsorptions.
Figure 3.

N2 adsorption–desorption curve for pore size determination.
Point of Zero Charge (PZC)
The point of zero charge is considered to be the value of pH at which the adsorbent surface bears zero charges. It was determined by the method of salt addition. In this regard, a range of pH from 2 to 11 was selected to check the PZC. Ten flasks with 50 mL of 0.1 M NaOH solution in each were taken. The pH level of these solutions was adjusted by using a solution of 0.1 M HCl in the range from 2 to 11. In all of these flasks, 0.1 g of adsorbent was added and fitted for agitation for 24 h at 30 °C. After a fixed time interval, each solution was filtered and the final pH was measured
A plot of ΔpH versus pH is given in Figure 4, which gives the point of zero charge for the adsorbent. Below, this pH adsorbent contains a positive charge on its surface, and above this value, a negative charge dominates at the surface of the adsorbent. In the present study, PZC was obtained at 6.5 pH; above this level of pH, these composites bear a negative charge and show electrostatic attraction for the positively charged dye molecules. Results of pH change also depict that the adsorbent shows the efficient removal at a higher range of pH.
Figure 4.

Point of zero charge (PZC) determined for composites.
Effect of Various Parameters on Dye Adsorption by Fe3O4-Impregnated C. bonplandianus Biochar
Dye Concentration
Dye concentration has a significant influence on the adsorption capacity of an adsorbent. With varying dye concentrations (20–100 mg L–1), 0.5 g of FO-CBPBB was reported to remove BB1 and BO2 dyes. At a dye concentration of 80 mg L–1, a significant removal efficiency of the dye was observed (Figure 5). The fact that the BB1 and BO2 dye removal efficiencies were high at high concentrations may be due to more dye molecules interacting with the active sites on the FO-CBPBB. The saturation of FO-active CBPBB’s spaces, a decrease in the number of adsorbent sites that are vacant, or an increase in the electrostatic force that repels dye solution from FO-surface CBPBBs could all contribute to a reduction in the adsorption capacity when dye concentration is further increased.
Figure 5.

Impact of initial concentration (20–100 ppm of dyes) (a), contact time (20–100 min) (b), pH (3–12) (c), adsorbent dosage (0.5–2.0 g) (d), and temperature (20–50 °C) (e) on BB1 and BO2 removing efficiencies by CBPBB (blue color) and FO-CBPBB (green color).
Contact Time
An essential component that is crucial to the kinetics of the adsorption process is the exposure time of the FO-CBPBB and dye interaction. The increase in the contact time improved the color clearance percentage (Figure 5). The elimination of BB1 and BO2 dyes was more noticeable in the earlier stages of the method compared to that of the final stage, which may be related to the availability of free sites on the Fe3O4-impregnated C. bonplandianus biochar. It was thought that the adsorption process reached equilibrium after 80 min because there had been no further appreciable change in the adsorption capacity. To determine equilibrium time, the effect of exposure time on BB1 and BO2 removal efficiencies was estimated. After 80 min, BB1 and BO2 dye adsorptions of 93 and 95%, respectively, were noted for 80 mg L–1 BB1 and BO2 dye. The adsorption process’ equilibrium period of 80 min was chosen since there was no substantial increase in dye adsorption after that point.
pH
The value of pH is a key factor in the dye’s ability to adhere to FO-CBPBB. The pH value had an impact on the level of ionization, the surface charge of the adsorbent, and the kind of dye solution.28,29 Electrostatic interactions among the functional groups on the FO-CBPBB surface and the dye solution are controlled by pH. The shift in the pH value from 3 to 12 was used to investigate the impact of pH on the elimination of BB1 and BO2 dyes from an aqueous solution. At pH value 7, FO-CBPBB indicated maximum adsorption of 95% of the 80 mg L–1 of BB1 dye and 93% of the 80 mg L–1 of BO2 dye (Figure 5). BB1 and BO2 elimination was reported to be increased with increasing pH value up to 7 or 8, with a further increase in pH value, and there was no significant increase in BB1 and BO2 elimination. At a low pH value, the surface of the adsorbent is positively charged due to protonated functional groups present on its surface. This positively charged surface develops electrostatic forces with the negatively charged dyes and adsorption potential increases. At the basic pH range, the surface of the adsorbent bears a negative charge so the adsorption potential decreases.
Adsorbent Dose
Adsorption capacity may be impacted by the amount of adsorbent. As FO-CBPBB was boosted from 0.5 to 2.0 g, Basic Brown 1 and Basic Orange 2 dye adsorption were increased from 80 to 93% and 82 to 95%, respectively. Due to the increased surface area and functional groups available for adsorption, the active sites make it easier for BB1 and BO2 to attach to adsorption sites, and a higher dye removal efficiency was found with a higher biochar quantity. Using 1.0 g of FO-CBPBB, the highest percentage of BB1 and BO2 dye removal was observed. There was no further significant increase in the removal efficiency after 1.0 g of adsorbent (Figure 5).
Temperature
The effects of Basic Brown 1 and Basic Orange 2 dyes on FO-CBPBB were examined at temperatures of 20, 30, 40, and 50 °C. At 40 °C, BB1 and BO2 dyes showed 93 and 95% adsorptions, respectively. At 40 °C, the maximum removal efficiency of BB1 and BO2 was noted (Figure 5). The transfer process and the adsorption kinetics of dyes are both impacted by the temperature, which is a significant parameter. Due to the increased availability of sites on the surface, the removal efficiency of BB1 and BO2 later increased at high temperatures. The adsorption process was endothermic, according to the results.
Adsorption Isotherm
The adsorption isotherm showed that at a constant temperature, BB1 and BO2 molecules dispersed between the liquid and solid states in equilibrium. The isotherm model offers important details regarding the sorption mechanism, surface properties, and FO-CBPBB capability. By using Langmuir and Freundlich models, the isotherm results of BB1 and BO2 dye sorption on FO-CBPBB were examined (Table 1 and Figure 6). The Freundlich model states that adsorption happens at nonuniform surfaces, in contrast to the Langmuir isotherm model’s premise that monolayer adsorption occurs at homogeneous active sites on the adsorbent structure.30,31 The Freundlich isotherm displayed the best-fit model in this experiment because it had a higher correlation coefficient (R2 = 0.95) than Langmuir. By different factors, it can be demonstrated that C. bonplandianus biochar treated with Fe3O4 has nonuniform surfaces on which BB1 and BO2 dyes adsorb.
Table 1. Isotherm Constants for Basic Brown 1 (BB1) and Basic Orange 2 (BO2) Dye Adsorption by Fe3O4-Impregnated C. bonplandianus Biochar.
| isotherm | equation | dye | parameters | value |
|---|---|---|---|---|
| Langmuir |  |
BB1 | qm (mg/g) | 0.320238 |
| KL (L/mg) | –1.36819 | |||
| R2 | 0.55757 | |||
| BO2 | qm (mg/g) | 0.034131 | ||
| KL (L/mg) | –0.00503 | |||
| R2 | 0.82415 | |||
| Freundlich |  |
BB1 | 1/n | 1.98564 |
| KF (mg/g) | 0.10940 | |||
| R2 | 0.9012 | |||
| BO2 | 1/n | 25.02735 | ||
| KF (mg/g) | 0.15035 | |||
| R2 | 0.95432 |
Figure 6.

(a) Freundlich isotherm for BB1 dye adsorption by FO-CBPBB on the initial concentration 20–100 ppm, (b) Freundlich isotherm for BO2 dye adsorption by FO-CBPBB on the initial concentration 20–100 ppm, (c) Langmuir isotherm for BB1 dye adsorption by FO-CBPBB on the initial concentration 20–100 ppm, (d) Langmuir isotherm for BO2 dye adsorption by FO–CBPBB on the initial concentration 20–100 ppm, and (e) graph between Qe and Ce for BB1.
Here, KF is the Freundlich adsorption constant, which describes the adsorption capacity of any sample on the surface of the adsorbent. Similarly, 1/n describes the adsorption intensity of the adsorption system. An increasing value of KF and 1/n is an indicator of a better adsorption efficiency for a particular adsorbent. Similarly, in the Langmuir adsorption isotherm, KL is the Langmuir adsorption constant, which describes the binding energy of a molecule with adsorbent. A negative value of KL is an indicator of the fact that adding a high amount of adsorbent mass will not favor the adsorption process. While qm is the maximum adsorption capacity in mg/g of the adsorbent.
Adsorption Kinetic Models
Information about adsorption effectiveness and reaction direction can be found in kinetic research. To confirm the adsorption of BB1 and BO2 dyes by FO-CBPBB, kinetic models were applied. For the pseudo-first- and second-order models of the BB1 and BO2 dyes, the coefficient of determination (R2) was, respectively, 0.64, 0.54, and 0.99, 0.989. The pseudo-second-order kinetic model was found to be successfully applied to the present work with a strong correlation coefficient value (Table 2 and Figure 7). According to this model, attractive forces developed between the adsorbent and dye molecule are rate-limiting steps in the adsorption process.32,33 Results showed that the uptake between the BB1 and BO2 molecules and the FO-CBPBB surface influenced the sorption process. The BB1 and BO2 dye adsorptions by FO-CBPBB indicated that the pseudo-second-order model was best-fitted with a high R2 value.
Table 2. Kinetic Variables for Basic Brown 1 (BB1) and Basic Orange 2 (BO2) Dye Adsorption on Fe3O4-Impregnated C. bonplandianus Biochar.
| isotherm | equation | dye | parameters | value |
|---|---|---|---|---|
| pseudo-first-order | In(qe – qt) = In qe–k1t | BB1 | k1 (min–1) | –0.0003 |
| qe (mg/g) | 1.69443 | |||
| R2 | 0.64507 | |||
| BO2 | k1 (min–1) | –0.00045 | ||
| qe (mg/g) | 2.31989 | |||
| R2 | 0.56228 | |||
| pseudo-second-order | t/qt = 1/k2qe + t/qe | BB1 | K2 (g/mg min) | 0.03915 |
| qe (mg/g) | 7.30833 | |||
| R2 | 0.99378 | |||
| BO2 | K2 (g/mg min) | 0.030523 | ||
| qe (mg/g) | 7.689941 | |||
| R2 | 0.98971 |
Figure 7.

(a) Pseudo-first-order model for BB1 dye adsorption by FO-CBPBB on contact time 20–100 min. (b) Pseudo-first-order model for BO2 dye adsorption by FO-CBPBB on contact time 20–100 min. (c) Pseudo-second-order model for BB1 dye adsorption by FO-CBPBB on contact time 20–100 min. (d) Pseudo-second-order model for BO2 dye adsorption by FO-CBPBB on contact time 20–100 min. (e) Graph between Qt and time for BB1.
Thermodynamic Analysis
The change in free energy (G), enthalpy (H), and entropy (S) was examined for BB1 and BO2 adsorptions on C. bonplandianus biochar that had been impregnated with Fe3O4
ΔH0 and ΔS0 values were determined. At 20, 30, 40, and 50 C, sorption tests were performed (Table 3 and Figure 8). The positive value of “ΔG0” at various temperatures indicated that the sorption of the BB1 and BO2 dyes on FO-CBPBB was nonspontaneous and endothermic. The endothermic nature of the process was proven by the positive values of ΔH0 (49.4 kJ mol–1) and ΔH0 (59.07 kJ mol–1) for BB1 and BO2, respectively.34 The increase in the solid-state adsorbate content was indicated by the positive values of ΔS0 (157.3 J K–1 mol–1) and ΔS0 (190.3 J K–1 mol–1).35 In sorption, increased impermanence near the confluence of solid and liquid was observed. The adsorption process’s unpredictability and stability are both reflected in the positive value of ΔS0.36 The endothermic process was compatible with our findings recorded in isotherm tests, and the results showed that BB1 and BO2 dye adsorptions on FO-CBPBB were nonspontaneous.
Table 3. Thermodynamic Variables for Basic Brown 1 (BB1) and Basic Orange 2 (BO2) Dye Adsorptions by Fe3O4-Impregnated C. bonplandianus Biochar.
| dye | temperature (°C) | ΔG0 (kJ mol–1) | ΔH0 (kJ mol–1) | ΔS0 (J K–1 mol–1) |
|---|---|---|---|---|
| BB1 | 20 | 3.247 | 49.386 | 157.326 |
| 30 | 2.106 | |||
| 40 | –0.545 | |||
| 50 | –1.088 | |||
| BO2 | 20 | 3.247 | 59.0701 | 190.253 |
| 30 | 2.106 | |||
| 40 | –1.6702 | |||
| 50 | –1.795 |
Figure 8.

(a) Effect of temperature (293–323 K) on BB1 dye removal by FO-CBPBB, (b) effect of temperature (293–323 K) on BO2 dye removal by FO-CBPBB, and (c) graph between Qe and temperature for BB1.
Response Surface Methodology for Dye Optimization
Table 4 shows the experimental range and levels of different variables for BB1 and BO2 dye adsorptions. Table 5 shows the expected and actual results for BB1 and BO2 calculated by the central composite design. For the regression and graphic analysis of the collected data, Minitab software was employed. ANOVA is also used to assess the sum of squares, mean squares, F-values, and p-values. The outcomes are reorganized in Table 6 for BB1 and Table 7 for BO2. A model with a high F-value and a low p-value (<0.05) is regarded as significant in statistics.37 In light of this, it can be said that the coefficients for the linear effects of all three factors— initial concentration Ci (X1), time (X2), and temperature (X3)—are very significant for BB1 (Table 6) and BO2 (Table 7), all with p-values of 0.05 or less.
Table 4. Levels of Different Variables and Experimental Range for Basic Brown 1 (BB1) and Basic Orange 2 (BO2) Dye Adsorptions.
| variables | symbol | low level (−1) | high level (+1) |
|---|---|---|---|
| initial concentration (ppm) | X1 | 20 | 100 |
| time (min) | X2 | 20 | 100 |
| temperature (°C) | X3 | 20 | 50 |
Table 5. Central Composite Design of Three Different Parameters with Experimental and Predicted Percentage Yield.
| initial conc. (ppm) X1 | time (min) X2 | temp. (°C) X3 | sorption experimental for BB1 (%) | sorption predicted by RSM for BB1 (%) | sorption experimental for BO2 (%) | sorption predicted by RSM for BO2 (%) |
|---|---|---|---|---|---|---|
| 60.00 | 60.00 | 35.00 | 78.50 | 82.15 | 88.75 | 86.16 |
| 36.21 | 83.78 | 43.91 | 87.47 | 89.85 | 92.40 | 90.30 |
| 60.00 | 20.00 | 35.00 | 85.86 | 86.10 | 83.10 | 84.70 |
| 60.00 | 60.00 | 35.00 | 79.11 | 82.15 | 79.50 | 86.10 |
| 83.80 | 36.20 | 26.08 | 81.85 | 83.50 | 90.10 | 89.20 |
| 36.20 | 36.20 | 43.90 | 83.62 | 84.10 | 88.60 | 89.50 |
| 20.00 | 100.0 | 50.00 | 82.50 | 81.81 | 84.20 | 83.10 |
| 100.00 | 60.00 | 35.00 | 84.23 | 86.85 | 88.70 | 90.80 |
| 20.00 | 100.0 | 20.00 | 79.25 | 76.40 | 82.50 | 80.20 |
| 60.00 | 60.00 | 20.00 | 61.25 | 63.54 | 74.50 | 76.50 |
| 36.20 | 83.80 | 26.08 | 79.25 | 81.30 | 89.25 | 88.80 |
| 60.00 | 100.0 | 35.00 | 87.95 | 89.35 | 89.25 | 88.85 |
| 60.00 | 60.00 | 50.00 | 92.58 | 90.40 | 93.80 | 91.70 |
| 83.80 | 83.80 | 26.08 | 86.25 | 84.30 | 95.70 | 96.90 |
| 36.200 | 36.20 | 26.08 | 81.25 | 83.30 | 83.20 | 81.18 |
| 83.78 | 83.78 | 43.91 | 93.75 | 91.50 | 96.60 | 94.80 |
| 83.78 | 36.20 | 43.91 | 90.12 | 89.30 | 90.20 | 89.10 |
| 20.00 | 60.00 | 35.00 | 57.25 | 61.06 | 60.50 | 62.30 |
| 60.00 | 60.00 | 60.23 | 81.51 | 85.65 | 85.60 | 86.90 |
| 20.00 | 20.00 | 50.00 | 65.42 | 60.27 | 70.20 | 67.30 |
Table 6. Analysis of Variance of RSM for Basic Brown 1 (BB1).
| source | DF | adjusted sum of square | adjusted mean square | F-value | p-value | R2 | R2-adj | R2-pre |
|---|---|---|---|---|---|---|---|---|
| model | 9 | 3202.74 | 355.86 | 15.83 | 0.0001 | 91.44% | 88.04% | 83.31% |
| linear | 3 | 2708.21 | 902.74 | 40.16 | 0.0001 | |||
| X1 | 1 | 803.21 | 803.21 | 35.73 | 0.0001 | |||
| X2 | 1 | 1314.88 | 1314.88 | 58.5 | 0.0001 | |||
| X3 | 1 | 590.12 | 590.12 | 26.25 | 0.0001 | |||
| X1X1 | 1 | 120.87 | 120.87 | 5.38 | 0.0430 | |||
| X2X2 | 1 | 155.68 | 155.68 | 6.93 | 0.0250 | |||
| X3X3 | 1 | 102.72 | 102.72 | 4.57 | 0.0500 | |||
| X1X2 | 1 | 107.75 | 107.75 | 4.79 | 0.0500 | |||
| X1X3 | 1 | 10.72 | 10.720 | 0.48 | 0.5060 | |||
| X2X3 | 1 | 58.86 | 58.860 | 2.62 | 0.1370 | |||
| error | 10 | 224.77 | 22.480 | |||||
| lack of fit | 5 | 136.43 | 27.290 | 1.54 | 0.3230 | |||
| pure error | 5 | 88.34 | 17.670 | |||||
| total | 19 | 3427.52 |
Table 7. Analysis of Variance of RSM for Basic Orange 2 (BO2).
| source | DF | adjusted sum of square | adjusted mean square | F-value | P-value | R2 | R2-adj | R2-pre |
|---|---|---|---|---|---|---|---|---|
| model | 9 | 3102.74 | 385.86 | 16.83 | 0.0001 | 95.4% | 91.2% | 86.1% |
| linear | 3 | 2809.21 | 802.4 | 36.16 | 0.0001 | |||
| X1 | 1 | 786.21 | 786.21 | 33.73 | 0.0001 | |||
| X2 | 1 | 1214.8 | 1214.8 | 54.5 | 0.0001 | |||
| X3 | 1 | 640.12 | 640.12 | 29.25 | 0.0001 | |||
| X1X1 | 1 | 140.70 | 140.70 | 8.38 | 0.0380 | |||
| X2X2 | 1 | 185.80 | 185.8 0 | 9.93 | 0.0220 | |||
| X3X3 | 1 | 102.72 | 102.72 | 4.57 | 0.0580 | |||
| X1X2 | 1 | 115.50 | 115.75 | 5.7 | 0.0510 | |||
| X1X3 | 1 | 12.20 | 12.2 0 | 0.55 | 0.5100 | |||
| X2X3 | 1 | 65.60 | 65.6 0 | 3.62 | 0.1310 | |||
| error | 10 | 176.0 | 17.10 | |||||
| lack of fit | 5 | 39.00 | 7.000 | 1.1 | 0.2300 | |||
| pure error | 5 | 136.2 | 27.30 | |||||
| total | 19 | 686.4 |
In RSM, the interaction effect of all parameters is well described as compared with the individual effect of these parameters (Figure 9). As one parameter affects the other, their interaction properly defines the adsorption capacity of dyes from an industrial effluent more properly. All factors were found to be significant in the interaction effect, as a low value for p was obtained. The correlation coefficient R2 and adjusted coefficient R2-adj are used to assess how well models fit data.38,39
Figure 9.

3D surface plot of adsorption (%) of Basic Brown 1 (BB1) against (a) initial conc. and time, (b) temperature and initial conc., (c) time and temperature and adsorption (%) of Basic Orange 2 (BO2) against (d) the initial conc. and time, (e) temperature and initial conc., and (f) time and temperature.
The response surface model is suitable for forecasting the effectiveness of BB1 elimination according to the high values of R2 = 0.91 and R2-adj = 0.88. The expected correlation coefficient R2 = 0.83 agrees with the adjusted correlation coefficient. Additionally, Table 6’s F- and p-values demonstrate the model’s statistical significance. The response surface model is also suitable, as evidenced by the high values of R2 = 0.95, R2-adj = 0.91, and R2-pred = 0.86 for BO2 (Table 7).
Residual Normal Probability Plot
The normal probability plot between the actual and expected values of BB1 (Figure 10) and BO2 (Figure 11) elimination demonstrates the model’s accuracy. The normal distribution of the experimental data is one of the key hypotheses for the statistical analysis of such data.40 The typical likelihood of studentized residuals is depicted in Figures 10 and 11. If the experimental data are linear, the residual distribution will be normal.41 The experimental points are regularly distributed, devoid of outliers, and spaced along the normal line between them (Figures 10 and 11).Regression equation for BB1
Regression equation for BO2
Figure 10.

Residual plots for the percent sorption of Basic Brown 1 (BB1).
Figure 11.

Residual plots for the adsorption (%) of Basic Orange 2 (BO2).
Process Optimization
The RSM model identified that the maximum adsorption occurs around the following parameters: dye concentration Ci of 80 mg L–1, contact period of 80 min, and temperature of 40 °C. The maximum BB1 and BO2 adsorptions from the aqueous solution by adsorption approach 93 and 95% under these best circumstances. To ensure that the model was adequate, the optimum parameters underwent experimental verification. The difference in percentage between the actual and expected values is quite low, which supports the response surface optimization’s conclusion42 and shows that the proposed model is suitable for obtaining the ideal values for the factors under study.
Regeneration Analysis
The recyclability of the adsorbent is a crucial factor in determining the overall cost of the adsorption process, which prevents secondary contamination. Regeneration is a crucial metric for assessing an adsorbent’s effectiveness. Since the Basic Brown 1 and Basic Orange 2 dye solutions include both positive and negative functional groups, the desorption of dyes from the surface of the biochar requires both basic and acidic conditions. In an acidic environment, the dye molecules with negative functional groups connect to H+ in the solution, which then desorbs from the adsorbent surface. The dye molecules with positive functional groups were also adsorbed in basic media.43 Thus, the dye-loaded adsorbent was first washed with 1 N HCl in the current analysis to achieve maximal recovery, and then the same biochar was washed with 1 N NaOH. As in batch experiments, a maximum of 92% BB1 and 95% BO2 dye removal was seen with 80 mg L–1 of adsorbate concentration and 1.0 g of adsorbent. This combination was selected for the regeneration analysis. As a result, the regenerated adsorbent can be used again to absorb the BB1 and BO2 dyes. After the desorption, the adsorbent was recollected and dried in an oven at 70 °C. The adsorption capacity of the recollected adsorbent was then determined, and the results are shown in Figure 12. A decrease in adsorption (%) was observed by the use of a recollected adsorbent due to the presence of fewer adsorption sites on the adsorbent where the adsorption of the dye molecules could not be reversed during desorption treatment (Figure 12).
Figure 12.

Adsorption percentage of the regeneration of the adsorbent.
Comparison with Reported Work
Different methods used for the adsorption of dye pollutants from aqueous media are chemical oxidation, coagulation, reverse osmosis, photodegradation, aerobic degradation, and electrolytic extraction. The drawbacks of these methods are high operational costs, large sludge production, and only expert handles. The adsorption is easily operated, cost-effective to use, easily available, free of explosive processes, environmentally safe, easily available, efficient, and possibly recycled. Activated carbon is capable of adsorbing various dyes but is quite expensive. This problem is overcome by the use of biochar, which is also carbon-rich but easy to obtain. Biochar could be obtained from agricultural waste material, which is abundantly grown along the roadside and easily available. The adsorption capacity of biochar was increased by loading Fe3O4 on biochar (Figure 5a,b). Impregnation of nanoparticles, i.e., Fe3O4, on biochar increases the number of active sites and surface area of the adsorbent, which are the material characteristics responsible for the difference in the performance of the adsorbent and could be used to enhance the dye removal efficiency from wastewater. The Fe3O4-loaded biochar shows 93 and 95% removing efficiencies for BB1 and BO2 and an equilibrium adsorption capacity of 74 and 76 mg g–1, respectively. This material leads to an advance in BB1 and BO2 dye adsorptions and performs better than alternatives as given in Table 8.
Table 8. Comparison of Reported Data with the Present Work.
| adsorbate | adsorbents | sorption (%) or adsorption capacity (mg g–1) | reference |
|---|---|---|---|
| Basic Brown 1 (BB1) | magnetically modified spent grain | 72.4 mg g–1 | (44) |
| (Co, Ni)3O4/Al2O3 cocatalyst | 92.4% | (45) | |
| Alcaligenes faecalis ZD02 | 88% | (46) | |
| rubber wood sawdust | 35 mg g–1 | (47) | |
| present study | 93% or 74 mg g–1 | ||
| Basic Orange 2 (BO2) | Escherichia coli’s bacterial strains | 89.88% | (48) |
| Zn2Al-layered double hydroxide prepared from zinc ash | 42.5 mg g–1 | (49) | |
| chitosan/Al2O3-HA composite beads | 23.26 mg g–1 | (50) | |
| tin-pillared interlayer clay (Sn-PILC) | 80% | (51) | |
| whey protein nanofibrils and nanoclay | 93% | (52) | |
| present study | 95% or 76 mg g–1 |
Adsorption Mechanism
The adsorbent shows efficient adsorption behavior toward the basic pH range as shown in Figure 13. The adsorption looks electrostatic as adsorbents bear a negative charge at high pH and the dyes used in this study are azo dyes, which have a positive charge due to the NH3 functional group present on their surface. These opposite charges develop attractive forces to attach dyes on the surface of the adsorbent in an efficient way.
Figure 13.

Adsorption mechanism of dyes on the surface of the adsorbent.
Conclusions
The ability of BB1 and BO2 to adsorb onto the Fe3O4-modified biochar made from C. bonplandianus was examined in this work. It is unquestionably possible for C. bonplandianus biochar (FO-CBPBB) to be an effective adsorbent for removing BB1 and BO2 from aquatic settings. This work has made it clear that BB1 and BO2 may adhere to FO-CBPBB at pH 7 in the solution. At 80 min of contact time, 1 g L–1 of adsorbent, 40 °C for the solution temperature, and 80 mg L–1 of BB1 and BO2 at the beginning, the maximum removing efficiencies of FO-CBPBB for BB1 and BO2 were 93 and 95%, respectively. The adsorption equilibrium data were described using pseudo-first-order and pseudo-second-order kinetic models, as well as Freundlich and Langmuir isotherm models. The finest models for describing the isothermal adsorption equilibrium were those of Freundlich. Also, the findings of the experiments demonstrate that the strong correlation coefficients of the pseudo-second-order kinetic model suit the kinetic data. The outcome of this work offers an efficient technique for removing organic pollutants from water based on an adsorbent made from agricultural waste. Overall, the study found a promising substance for the adsorption of fundamental dyes from wastewater, i.e., Fe3O4-modified biochar from the C. bonplandianus.
Materials and Methods
Chemicals
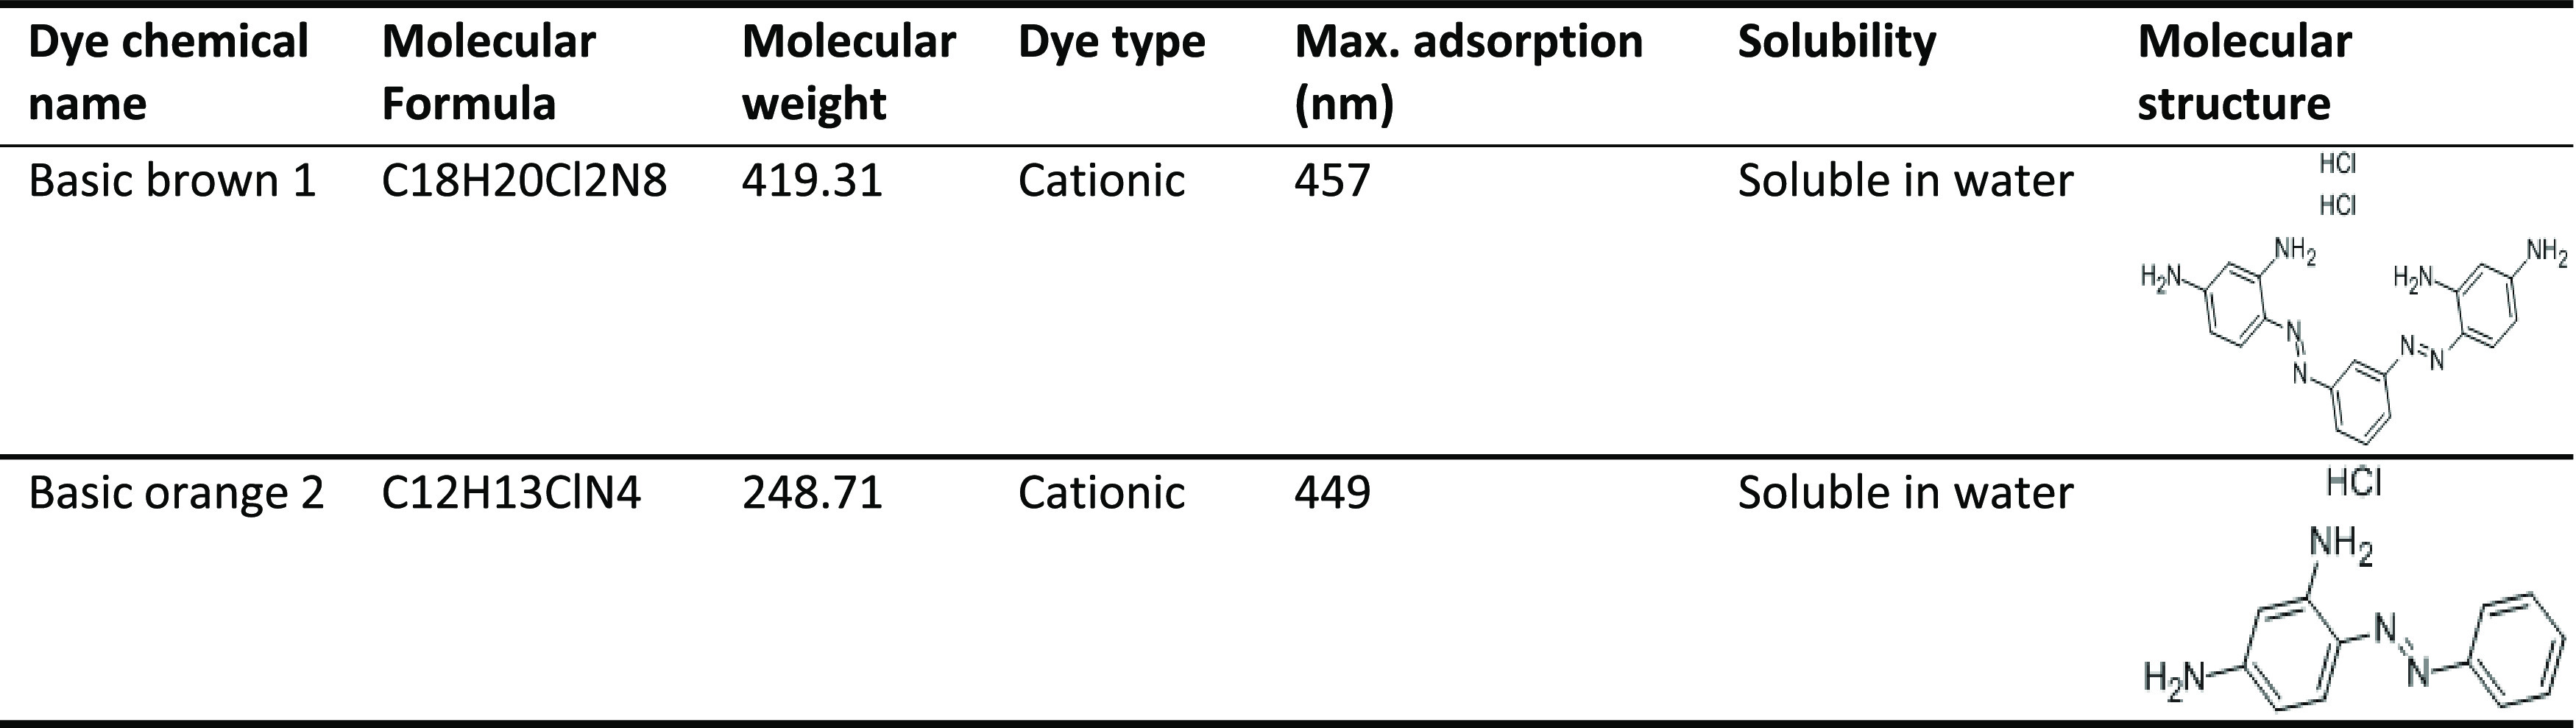
C. bonplandianus Baill. was taken from the Sargodha area of Pakistan and washed three times with distilled water. Merck provided all of the chemicals, comprising FeCl2·4H2O, FeCl3·6H2O, and an ammonia solution (25%) (Darmstadt, Germany). Merck was used to acquire Basic Brown 1 and Basic Orange 2. Table 9 illustrates the characteristics of Basic Brown 1 and Basic Orange 2.
Table 9. Description of Dyes Used as Sorbates and Their Characteristics.
Preparing C. bonplandianus Biochar
The C. bonplandianus powdered biomass was placed in lid crucibles and slowly pyrolyzed for 2 h at 450 °C in the absence of oxygen to produce biochar. The crucibles were then allowed to cool while being kept at ambient temperature. The produced biochar was identified as C. bonplandianus biochar (CBPBB).
Preparation of Magnetic Fe3O4 Nanoparticle C. bonplandianus Biochar
Fe3O4 magnetic nanoparticles loaded on C. bonplandianus biochar (FO-CBPBB) were synthesized by a chemical reaction in different steps, including suspension, mixing, agitation, precipitation, filtration, and heating. Initially, 150 mL of deionized water was added to a solution containing FeCl3·6H2O, FeCl2·4H2O (molar proportion: 2:1), and CBPBB at a mass ratio of 1:1, and the mixture was constantly swirled to ensure thorough mixing. Following that, the pH was increased to 10–11 by gradually adding 0.1 M NaOH solution. The suspension was stirred on an orbital shaker for 1 h and held at room temperature for 12 h. After that, it underwent filtration, washing with distilled water and ethanol, and then dried in an oven at 100 °C for 12 h. The name FO-CBPBB (Fe3O4-loaded C. bonplandianus biochar) was given to this nanomaterial-loaded biochar. The scheme of synthesis of the adsorbent is given in Figure 14.
Figure 14.

Scheme of synthesis for the Fe2O3-loaded biochar.
Preparation of Dye Stock Solution
Basic Brown 1 and Basic Orange 2 were purchased from Merck. Sterilized double-deionized water was used to create Basic Brown 1 dye (1000 mg L–1) and Basic Orange 2 dye (1000 mg L–1) stock solutions, which were then utilized to create various concentrations, such as 20, 40, 60, 80, and 100 ppm. The UV–vis spectrophotometer was used to test the dye’s adsorption.
Characterization of Fe3O4-Impregnated C. bonplandianus Biochar
Functional groups present on C. bonplandianus biochar impregnated with Fe3O4 before and after Basic Brown 1 dye and Basic Orange 2 azo dye adsorptions were examined by Fourier transform infrared spectroscopy in wavenumber (400–4000 cm–1) using the KBr pellet technique. Scanning electron microscopy (SEM) was utilized to study the outer surfaces of Fe3O4-impregnated C. bonplandianus biochar (FO-CBPBB) before and after Basic Brown 1 dye and Basic Orange 2 azo dye adsorptions.
Batch Adsorption Experiments
To assess the FO-CBPBB adsorbent’s ability to bind to BB1 and BO2 dyes, adsorption tests were performed using the batch method. Various experimental variables were examined to determine their effects on BB1 and BO2 adsorptions, including initial BB1 and BO2 dye concentrations (20–100 mg L–1), pH (3–12), contact period (20–100 min), FO-CBPBB adsorbent concentration (0.5–2.0 g), and solution temperature (20–50 °C). A shaker stirred the contained flasks at 120 rpm. Sodium hydroxide (0.1 M) and hydrochloric acid (0.1 M) were employed to adjust the pH of the solution. Whatman No. 1 filter paper was then used to filter the solutions. Using UV–vis spectroscopy at the ideal wavelengths of 457 and 449 nm (corresponding to the greatest adsorption capacity), the remaining BB1 and BO2 dyes in the filtered solutions were examined. Equation 1 was used to compute the adsorption capacity of the adsorbent FO-CBPB for BB1 and BO2 dyes. Equation 2 was used in the calculations to assess the efficiency of removing the BB1 and BO2 dyes
| 1 |
| 2 |
where m is the mass of the FO-CBPBB adsorbent (g), V is the dye solution’s volume, Ci is the initial dye concentration (mg L–1), Ce is the residual dye concentration after adsorption (mg L–1), and qe is the amount of dye adsorbed by the adsorbent (mg g–1).
Adsorption Isotherms, Kinetics, and Thermodynamics
Adsorption isotherms can be used to explain the adsorption phenomena that occur on an adsorbent’s surface. To analyze the experimental results for this study, Freundlich and Langmuir adsorption isotherms were used. Similar to this, kinetic studies were also carried out, followed by the application of pseudo-first- and second-order kinetics to the data, and the investigation of thermodynamic parameters was also carried out.
Response Surface Methodology (RSM)
RSM is a series of statistical and mathematical approaches for analyzing and assessing the interaction effect of various variables obtained from the fit of empirical models to the experimental data.53 In this study, the three different variables i.e., starting concentration of BB1 and BO2, contact time, and temperature, were all evaluated, utilizing the RSM under the CCD technique. To assess how much the adsorption yield amounts would affect the optimization process, these variables were set at two levels. The independent variables have a low (1) and high (+1) level and are coded in the range (1, +1). There are 20 experimental runs for three variables.54
Statistical Analysis
To determine the level of significance of a factor, the analysis of variance (ANOVA) approach is used.55
Acknowledgments
The authors are highly thankful to the Institute of Chemistry, University of Sargodha, Pakistan, for the provision of research facilities for the present resented research work.
Author Contributions
Conceptualization, A.A., F.B., S.N., E.A.A., M.M., B.F.A.A., and A.D. Data curation, A.A. Formal analysis, A.A., F.B., S.N., E.A.A., M.M., B.F.A.A., and A.D. Funding acquisition, B.F.A.A. and A.D. Investigation, A.A. Methodology, F.B. Project administration, F.B. and A.D. Resources, A.A., F.B., S.N., E.A.A., M.M., B.F.A.A., and A.D. Software, A.A., F.B., S.N., E.A.A., M.M., B.F.A.A., and A.D. Supervision, F.B. Validation, A.A., F.B., S.N., E.A.A., M.M., B.F.A.A., and A.D. Visualization, A.A., F.B., S.N., E.A.A., M.M., B.F.A.A., and A.D. Writing—original draft, A.A. Writing—review and editing, A.A., F.B., S.N., E.A.A., M.M., B.F.A.A., and A.D. All authors have read and agreed to the published version of the manuscript.
The authors declare no competing financial interest.
References
- Antanasković A.; Lopičić Z.; Pehlivan E.; Adamović V.; Šoštarić T.; Milojković J.; Milivojević M. Thermochemical conversion of non-edible fruit waste for dye removal from wastewater. Biomass Convers. Biorefin. 2023, 10.1007/s13399-023-04083-2. [DOI] [Google Scholar]
- Akter M.; Rahman F. B. A.; Abedin M. Z.; Kabir S. F. Adsorption characteristics of banana peel in the removal of dyes from textile effluent. Textiles 2021, 1 (2), 361–375. 10.3390/textiles1020018. [DOI] [Google Scholar]
- GadelHak Y.; El-Azazy M.; Shibl M. F.; Mahmoud R. K. Cost estimation of synthesis and utilization of nano-adsorbents on the laboratory and industrial scales: A detailed review. Sci. Total Environ. 2023, 875, 162629 10.1016/j.scitotenv.2023.162629. [DOI] [PubMed] [Google Scholar]
- Eleryan A.; Hassaan M. A.; Aigbe U. O.; Ukhurebor K. E.; Onyancha R. B.; El-Nemr M. A.; Ragab S.; Hossain I.; El Nemr A. Kinetic and isotherm studies of Acid Orange 7 dye absorption using sulfonated mandarin biochar treated with TETA. Biomass Convers. Biorefin. 2023, 10.1007/s13399-023-04089-w. [DOI] [Google Scholar]
- Fernandes N. C.; Brito L. B.; Costa G. G.; Taveira S. F.; Cunha-Filho M. S. S.; Oliveira G. A. R.; Marreto R. N. Removal of azo dye using Fenton and Fenton-like processes: Evaluation of process factors by Box–Behnken design and ecotoxicity tests. Chem.–Biol. Interact. 2018, 291, 47–54. 10.1016/j.cbi.2018.06.003. [DOI] [PubMed] [Google Scholar]
- Gupta V. Application of low-cost adsorbents for dye removal–a review. J. Environ. Manage. 2009, 90 (8), 2313–2342. 10.1016/j.jenvman.2008.11.017. [DOI] [PubMed] [Google Scholar]
- Hameed B. Grass waste: A novel sorbent for the removal of basic dye from aqueous solution. J. Hazard. Mater. 2009, 166 (1), 233–238. 10.1016/j.jhazmat.2008.11.019. [DOI] [PubMed] [Google Scholar]
- Hameed B. H. Spent tea leaves: a new non-conventional and low-cost adsorbent for removal of basic dye from aqueous solutions. J. Hazard. Mater. 2009, 161 (2–3), 753–759. 10.1016/j.jhazmat.2008.04.019. [DOI] [PubMed] [Google Scholar]
- Hien N. T.; Nguyen L. H.; Van H. T.; Nguyen T. D.; Nguyen T. H. V.; Chu T. H. H.; Nguyen T. V.; Trinh V. T.; Vu X. H.; Vu X. H.; Aziz K. H. H. Heterogeneous catalyst ozonation of Direct Black 22 from aqueous solution in the presence of metal slags originating from industrial solid wastes. Sep. Purif. Technol. 2020, 233, 115961 10.1016/j.seppur.2019.115961. [DOI] [Google Scholar]
- Joshi S.; Garg V. K.; Kataria N.; Kadirvelu K. Applications of Fe3O4@ AC nanoparticles for dye removal from simulated wastewater. Chemosphere 2019, 236, 124280 10.1016/j.chemosphere.2019.07.011. [DOI] [PubMed] [Google Scholar]
- Kataria N.; Garg V. K.; Jain M.; Kadirvelu K. Preparation, characterization and potential use of flower shaped Zinc oxide nanoparticles (ZON) for the adsorption of Victoria Blue B dye from aqueous solution. Adv. Powder Technol. 2016, 27 (4), 1180–1188. 10.1016/j.apt.2016.04.001. [DOI] [Google Scholar]
- Mishra S.; Maiti A. Optimization of process parameters to enhance the bio-decolorization of Reactive Red 21 by Pseudomonas aeruginosa 23N1. Int. J. Environ. Sci. Technol. 2019, 16, 6685–6698. 10.1007/s13762-018-2023-1. [DOI] [Google Scholar]
- Nguyen V. H.; Van H. T.; Nguyen V. Q.; Dam X. V.; Hoang L. P.; Ha L. T. Magnetic Fe3O4 nanoparticle biochar derived from pomelo peel for reactive Red 21 adsorption from aqueous solution. J. Chem. 2020, 2020, 3080612 10.1155/2020/3080612. [DOI] [Google Scholar]
- Ranjithkumar V.; Sangeetha S.; Vairam S. Synthesis of magnetically activated carbon/α-Fe2O3 nanocomposite and its application in the removal of acid yellow 17 dye from water. J. Hazard. Mater. 2014, 273, 127–135. 10.1016/j.jhazmat.2014.03.034. [DOI] [PubMed] [Google Scholar]
- Regti A.; Laamari M. R.; Stiriba S. E.; Haddad M. E. Removal of Basic Blue 41 dyes using Persea americana-activated carbon prepared by phosphoric acid action. Int. J. Ind. Chem. 2017, 8, 187–195. 10.1007/s40090-016-0090-z. [DOI] [Google Scholar]
- Saini J.; Garg V.; Gupta R. Removal of methylene blue from aqueous solution by Fe3O4@ Ag/SiO2 nanospheres: synthesis, characterization, and adsorption performance. J. Mol. Liq. 2018, 250, 413–422. 10.1016/j.molliq.2017.11.180. [DOI] [Google Scholar]
- Saini J.; Garg V. K.; Gupta R. K.; Kataria N. Removal of Orange G and Rhodamine B dyes from aqueous system using hydrothermally synthesized zinc oxide loaded activated carbon (ZnO-AC). J. Environ. Chem. Eng. 2017, 5 (1), 884–892. 10.1016/j.jece.2017.01.012. [DOI] [Google Scholar]
- Salleh M. A. M.; Mahmoud D. K.; Karim W. A. W. A.; Idris A. Cationic and anionic dye adsorption by agricultural solid wastes: a comprehensive review. Desalination 2011, 280 (1–3), 1–13. 10.1016/j.desal.2011.07.019. [DOI] [Google Scholar]
- Tie J.; Zheng Z.; Li G.; Geng N.; Chang G.; Yu L.; Ji Y.; Shi L.; Chang Y.; Hu L. Removal of an anionic azo dye direct black 19 from water using white mustard seed (Semen sinapis) protein as a natural coagulant. J. Water Reuse Desalin. 2019, 9 (4), 442–451. 10.2166/wrd.2019.018. [DOI] [Google Scholar]
- Mazhar S.; Ditta A.; Bulgariu L.; Ahmad I.; Ahmed M.; Nadiri A. A. Sequential Treatment of Paper and Pulp Industrial Wastewater: Prediction of Water Quality Parameters by Mamdani Fuzzy Logic Model and Phytotoxicity Assessment. Chemosphere 2019, 227, 256–268. 10.1016/j.chemosphere.2019.04.022. [DOI] [PubMed] [Google Scholar]
- Nasir E.; Ali S. I.. et al. Flora of Pakistan Agricultural Research Council: Islamabad; 1991.
- Ghosh T.; Biswas M.; Roy P.; Guin C. A review of traditional and pharmacological uses of Croton bonplandianum with special reference to the phytochemical aspect. Eur. J. Med. Plants 2018, 22, 1–10. 10.9734/EJMP/2018/40697. [DOI] [Google Scholar]
- Colthup N. B.; Daly L. H.; Wiberley S. E.. Vibrational and Rotational Spectra. In Introduction to Infrared and Raman Spectroscopy; Wiley, 1990; pp 1–73. [Google Scholar]
- Nakamoto K.Infrared and Raman Spectra of Inorganic and Coordination Compounds, Part B: Applications in Coordination, Organometallic, and Bioinorganic Chemistry; John Wiley & Sons, 2009. [Google Scholar]
- Silverstein R. M.; Bassler G. C. Spectrometric identification of organic compounds. J. Chem. Educ. 1962, 39 (11), 546. 10.1021/ed039p546. [DOI] [Google Scholar]
- Sun P.; Hui C.; Azim Khan R.; Du J.; Zhang Q.; Zhao Y. H. Efficient removal of crystal violet using Fe3O4-coated biochar: the role of the Fe3O4 nanoparticles and modeling study their adsorption behavior. Sci. Rep. 2015, 5 (1), 12638 10.1038/srep12638. [DOI] [PMC free article] [PubMed] [Google Scholar]
- Yuan Y.; Zhang C.; Zhao C.; Wang B.; Wang X.; Gao B.; Wang S.; Rinklebe J. One-step preparation of a novel graphitic biochar/Cu0/Fe3O4 composite using CO2-ambiance pyrolysis to activate peroxy-disulfate for dye degradation. J. Environ. Sci. 2023, 125, 26–36. 10.1016/j.jes.2021.10.030. [DOI] [PubMed] [Google Scholar]
- Wei F.; Zhu Y.; He T.; Zhu S.; Wang T.; Yao C.; Yu C.; Huang P.; Li Y.; Zhao Q.; Song W. Insights into the pH-Dependent Adsorption Behavior of Ionic Dyes on Phosphoric Acid-Activated Biochar. ACS Omega 2022, 7 (50), 46288–46302. 10.1021/acsomega.2c04799. [DOI] [PMC free article] [PubMed] [Google Scholar]
- Hasan M.; Al Biruni M. T.; Azad S.; Ahmed T. Adsorptive removal of dye from textile wastewater employing Moringa oleifera leaves biochar as a natural biosorbent. Biomass Convers. Biorefin. 2022, 10.1007/s13399-022-03196-4. [DOI] [Google Scholar]
- Fakhar N.; Khan S. A.; Khan T. A.; Siddiqi W. A. Efficiency of iron modified Pyrus pyrifolia peels biochar as a novel adsorbent for methylene blue dye abatement from aqueous phase: equilibrium and kinetic studies. Int. J. Phytorem. 2022, 24 (11), 1173–1183. 10.1080/15226514.2021.2021848. [DOI] [PubMed] [Google Scholar]
- Weidner E.; Karbassiyazdi E.; Altaee A.; Jesionowski T.; Ciesielczyk F. Hybrid metal oxide/biochar materials for wastewater treatment technology: a review. ACS Omega 2022, 7 (31), 27062–27078. 10.1021/acsomega.2c02909. [DOI] [PMC free article] [PubMed] [Google Scholar]
- Gupta M.; Savla N.; Pandit C.; Pandit S.; Gupta P. K.; Pant M.; Khilari S.; Kumar Y.; Agarwal D.; Nair R. R.; Thomas D.; Thakur V. K. Use of biomass-derived biochar in wastewater treatment and power production: A promising solution for a sustainable environment. Sci. Total Environ. 2022, 825, 153892 10.1016/j.scitotenv.2022.153892. [DOI] [PubMed] [Google Scholar]
- Issaka E.; Fapohunda F. O.; Amu-Darko J. N. O.; Yeboah L.; Yakubu S.; Varjani S.; Ali N.; Bilal M. Biochar-based composites for remediation of polluted wastewater and soil environments: Challenges and prospects. Chemosphere 2022, 297, 134163 10.1016/j.chemosphere.2022.134163. [DOI] [PubMed] [Google Scholar]
- Foo K. Y.; Hameed B. H. Insights into the modeling of adsorption isotherm systems. Chem. Eng. J. 2010, 156 (1), 2–10. 10.1016/j.cej.2009.09.013. [DOI] [Google Scholar]
- Batool F.; Qadir R.; Adeeb F.; Kanwal S.; Abdelrahman E. A.; Noreen S.; Albalawi B. F. A.; Mustaqeem M.; Imtiaz M.; Ditta A.; Gondal H. Y. Biosorption potential of Arachis hypogaea derived biochar for Cd and Ni as evidenced through kinetic, isothermal, and thermodynamics modeling. ACS Omega 2023, 8 (43), 40128–40139. 10.1021/acsomega.3c02986. [DOI] [PMC free article] [PubMed] [Google Scholar]
- Barasarathi J.; Abdullah P. S.; Uche E. C. Application of magnetic carbon nanocomposite from agro-waste for the removal of pollutants from water and wastewater. Chemosphere 2022, 305, 135384 10.1016/j.chemosphere.2022.135384. [DOI] [PubMed] [Google Scholar]
- Hou D.; Goei R.; Wang X.; Wang P.; Lim T. T. Preparation of carbon-sensitized and Fe–Er codoped TiO2 with response surface methodology for bisphenol A photocatalytic degradation under visible-light irradiation. Appl. Catal., B 2012, 126, 121–133. 10.1016/j.apcatb.2012.07.012. [DOI] [Google Scholar]
- Kanwal S.; Naeem H. K.; Batool F.; Mirza A.; Abdelrahman E. A.; Sharif G.; Maqsood F.; Mustaqeem M.; Ditta A. Adsorption potential of orange rind-based nanosorbents for the removal of cadmium (II) and chromium (VI) from contaminated water. Environ. Sci. Pollut. Res. 2023, 30, 110658–110673. 10.1007/s11356-023-30164-w. [DOI] [PubMed] [Google Scholar]
- Chatterjee S.; Kumar A.; Basu S.; Dutta S. Application of response surface methodology for methylene blue dye removal from aqueous solution using low-cost adsorbent. Chem. Eng. J. 2012, 181–182, 289–299. 10.1016/j.cej.2011.11.081. [DOI] [Google Scholar]
- Asfaram A.; Ghaedi M.; Yousefi F.; Dastkhoon M. Experimental design, and modeling of ultrasound-assisted simultaneous adsorption of cationic dyes onto ZnS: Mn-NPs-AC from the binary mixture. Ultrason. Sonochem. 2016, 33, 77–89. 10.1016/j.ultsonch.2016.04.016. [DOI] [PubMed] [Google Scholar]
- Dastkhoon M.; Ghaedi M.; Asfaram A.; Goudarzi A.; Langroodi S. M.; Tyagi I.; Agarwal S.; Gupta V. K. Ultrasound assisted adsorption of malachite green dye onto ZnS: Cu-NP-AC: equilibrium isotherms and kinetic studies–response surface optimization. Sep. Purif. Technol. 2015, 156, 780–788. 10.1016/j.seppur.2015.11.001. [DOI] [Google Scholar]
- Danso-Boateng E.; Fitzsimmons M.; Ross A. B.; Mariner T. Response Surface Modelling of Methylene Blue Adsorption onto Seaweed, Coconut Shell, and Oak Wood Hydrochars. Water 2023, 15 (5), 977. 10.3390/w15050977. [DOI] [Google Scholar]
- Murtaza G.; Ditta A.; Ahmed Z.; Usman M.; Faheem M.; Tariq A. Co-biosorption potential of Acacia nilotica bark in removing Ni and amino azo benzene from contaminated wastewater. Desalin. Water Treat. 2021, 233, 261–271. 10.5004/dwt.2021.27514. [DOI] [Google Scholar]
- Safarik I.; Horska K.; Safarikova M. Magnetically modified spent grain for dye removal. J. Cereal Sci. 2011, 53 (1), 78–80. 10.1016/j.jcs.2010.09.010. [DOI] [Google Scholar]
- Mohammad E. J.; Kathim S. H.; Attiah A. J. Removal of Bismarck brown G dye from simulated industrial wastewaters over (Co, Ni) 3O4/Al2O3 co-catalyst. J. Babylon Univ. Pure Appl. Sci. 2017, 25 (2), 504–514. [Google Scholar]
- Saha P.; Rao K. V. B.; Hafza S. Biodegradation and decolorization of two different azo dyes, Reactive Blue 221 and Direct Black 38, and assessment of the degraded dye metabolites. Desalin. Water Treat. 2018, 123, 338–347. 10.5004/dwt.2018.22624. [DOI] [Google Scholar]
- Kumar K. V.; Porkodi K. Equilibrium and thermodynamics of dye removal from aqueous solution by adsorption using rubber wood sawdust. Int. J. Environ. Technol. Manage. 2009, 10 (3–4), 295–307. 10.1504/IJETM.2009.023736. [DOI] [Google Scholar]
- Ikram M.; Naeem M.; Zahoor M.; Hanafiah M. M.; Oyekanmi A. A.; Ullah R.; Farraj D. A. A.; Elshikh M. S.; Zekker I.; Gulfam N. Biological degradation of the azo dye basic orange 2 by Escherichia coli: A sustainable and eco-friendly approach for the treatment of textile wastewater. Water 2022, 14 (13), 2063. 10.3390/w14132063. [DOI] [Google Scholar]
- Tamaş A.; Cozma I.; Cocheci L.; Lupa L.; Rusu G. Adsorption of Orange II Onto Zn2Al–Layered Double Hydroxide Prepared From Zinc Ash. Front. Chem. 2020, 8, 573535 10.3389/fchem.2020.573535. [DOI] [PMC free article] [PubMed] [Google Scholar]
- Li L.; Iqbal J.; Zhu Y.; Wang F.; Zhang F.; Chen W.; Wu T.; Du Y. Chitosan/Al2O3-HA nanocomposite beads for efficient removal of estradiol and chrysoidin from aqueous solution. Int. J. Biol. Macromol. 2020, 145, 686–693. 10.1016/j.ijbiomac.2019.12.223. [DOI] [PubMed] [Google Scholar]
- Raghav L.; Patanjali P.; Patanjali N.; Singh R. Adsorption of malachite green and chrysoidine-Y by Sn-pillared clay. Environ. Qual. Manage. 2023, 32 (3), 181–193. 10.1002/tqem.21888. [DOI] [Google Scholar]
- Aqdam S. R.; Otzen D. E.; Mahmoodi N. M.; Morshedi D. Adsorption of azo dyes by a novel bio-nanocomposite based on whey protein nanofibrils and nano-clay: Equilibrium isotherm and kinetic modeling. J. Colloid Interface Sci. 2021, 602, 490–503. 10.1016/j.jcis.2021.05.174. [DOI] [PubMed] [Google Scholar]
- Arulkumar M.; Sathishkumar P.; Palvannan T. Optimization of Orange G dye adsorption by activated carbon of Thespesia populnea pods using response surface methodology. J. Hazard. Mater. 2011, 186 (1), 827–834. 10.1016/j.jhazmat.2010.11.067. [DOI] [PubMed] [Google Scholar]
- Azargohar R.; Dalai A. Production of activated carbon from Luscar char: experimental and modeling studies. Microporous Mesoporous Mater. 2005, 85 (3), 219–225. 10.1016/j.micromeso.2005.06.018. [DOI] [Google Scholar]
- Guo Q.; Li L.; Cheng Y.; Jiao Y.; Xu C. Laboratory evaluation on the performance of diatomite and glass fiber compound modified asphalt mixture. Mater. Des. 2015, 66, 51–59. 10.1016/j.matdes.2014.10.033. [DOI] [Google Scholar]