Abstract
This study was based on a convenience-sampling questionnaire study of pedigree cat breeding in the UK. Data were collated for the births of 1056 litters from 14 different pedigree breeds and 942 different households. Significant relationships between various outcomes and relevant predictors were assessed by multiple linear regression or logistic regression as appropriate. The overall mean gestation length of 65.1 days varied significantly between the breeds (P<0.0001), and larger litter sizes were associated with shorter gestation lengths (P=0.04). The mean litter size of 4.6 kittens also varied significantly according to breed (P<0.0001). The weight of kittens born alive (overall mean 93.5 g) increased with longer gestation lengths (P=0.0003), decreased with larger litter sizes (P<0.0001) and varied between the breeds (P<0.0001). A total of 8.0% of pregnancies resulted in a caesarean section, with a higher risk associated with smaller litter sizes (P=0.002). Although the frequency of caesarean sections varied from 0 to 18.5% between individual breeds, breed itself was not shown to have a significant independent effect on this likelihood. A mean of 7.2% of all the kittens were stillborn, which varied according to breed (P=0.0003), and the risk of a stillborn kitten increased with litter size (P=0.0001), and with the presence of congenital defects in the litter (P=0.0002). The mean kitten mortality between birth and 8 weeks of age was 9.1%, and the majority of these occurred in the first week of life. Parturition intervals varied widely. The duration of first stage of labour was less than 2 h in 82.9% of cats. The interval between the birth of the first and last kitten was less than 6 h in 85.7%, but more than 48 h in three cats. A maximum of 48 h was recorded between the births of individual kittens in unassisted deliveries.
Although the reproductive endocrinology of the domestic cat has been studied extensively (Olson et al 1984, Tsutsui and Stabenfeldt 1993), few studies have been undertaken of the reproductive patterns in pedigree domestic cats kept as pets. A survey of the Dutch Cat Fancy published in 1999 looked at prevalence of pedigree breeds in the Netherlands, and calculated an average litter size for all breeds of 3.3 kittens per litter, which varied between 2.7 and 4.3 in different breeds (Gerrits et al 1999). Five pedigree breeds were evaluated in a study from Brisbane (Johnston 1987), and in that study the author found differences in litter size between the breeds examined (Burmese, Siamese, Persian, Abyssinian and Chinchilla), and also found that the first litter tended to be smaller than subsequent litters.
Earlier studies include a survey of 29 pedigree breeders in North America, comprising 189 queens (Povey 1978) where some breed-specific factors were analysed; a study of 168 breeding queens in the UK (Jemmett and Evans 1977) where age of puberty, gestation length and seasonal variations in oestrus were evaluated (the first being analysed according to breed); and another study from Australia (Prescott 1973) where litter size, gestation length and oestrus activity were compared between Siamese, Persian and domestic shorthair (DSH) cats. Some other studies have been published that have focused mainly on feline dystocia and/or kitten mortality (Young 1973, Scott and Geissinger 1978, Lawler and Monti 1984, Ekstrand and Linde-Forsberg 1994, Gunn-Moore and Thrusfield 1995).
In the UK, between 1994 and 2003 more than 300,000 pedigree cats were registered with the Governing Council for the Cat Fancy, the most common breeds being Persian (22.4%), British Shorthair (15.2%), Siamese (13.9%), Burmese (9.9%) and Birman (7%). These five breeds along with the Maine Coon, Oriental Shorthair, Ragdoll, Exotic Shorthair, Devon Rex, Tonkinese, Asian shorthair, Abyssinian, Russian Blue, Norwegian Forest, Somali, Cornish Rex, and Balinese breeds comprised more than 98% of all registered pedigree cats in this period (source: www.gccf.org). The purpose of the current study was to use a convenience-sampling questionnaire-based method to undertake a large survey of cat breeders in the UK so that substantial information could be collected from many of these common cat breeds. The questionnaire was designed to provide information on multiple reproductive parameters and their interactions, with particular emphasis on the effects of breed.
Materials and methods
Questionnaire
A questionnaire was designed and distributed by the Feline Advisory Bureau (FAB), via convenience sampling, to breeders of pedigree cats in the UK. The questionnaire was distributed directly by the FAB through inclusion in its journal (distributed to more than 2500 members), and in addition via the Governing Council of the Cat Fancy, various cat breed associations and advertising in the cat ‘lay press’. Voluntary returns were collated by the FAB and entered into a database. Data were requested prospectively, with each questionnaire (see Fig 1) completed containing information relating to a single queen with a single litter of kittens that was born during the 12 months following the first issue of the questionnaire.
Fig 1.
Feline Advisory Bureau cat breeding questionnaire.
Data analysis
Data entered were compiled and analysed by standard methods to derive descriptive statistics. In addition, significance of associations between covariates (potential predictor variables of interest and potential confounders) and outcome was assessed by the use of multiple linear regression and/or logistic regression as appropriate. Continuous outcomes included gestation length (in days), litter size, number of live kittens, and mean weight of kittens (in grams). Binary outcomes included the presence of caesarean section, the presence of one or more kittens with physical defects in a litter, and the presence of one or more stillborn kittens in a litter. Non-normally distributed outcomes were transformed to more normal distributions prior to analysis, the transformation being chosen to minimise skewness. Logistic models were fitted for the binary outcomes and linear models were fitted for the continuous outcomes. For each outcome, breeds with more than 20 cats represented were included in the model, and if breed was not a significant factor it was forced into the model as the effect of breed was a particular emphasis of this study. For the binary outcomes, breeds that did not have both outcome categories were excluded. For breed comparisons, the Burmese (one of the largest groups and a mesocephalic breed without marked conformational variations) was chosen as the reference category for other breeds. Appropriate covariates were considered for each outcome based on previous published studies and observations and models were fitted using a manual forward stepwise approach where covariates were retained if they improved the fit of the model (likelihood ratio χ2 test P<0.05). The overall fit of the logistic regression models was assessed using the Hosmer–Lemeshow test (Hosmer and Lemeshow, 1989). The assumptions of the linear regression models were evaluated using a graphical examination of the residuals.
Analysis was performed using SAS stat and Microsoft Excel. A P value <0.05 was considered significant. ‘Best fit’ lines shown on graphs were estimated using the least squares method.
Results
A total of 1150 usable questionnaires were returned and collated for analysis, although not all questionnaires had complete data. There were a total of 14 breeds for which more than 20 questionnaires were returned and these were analysed further (comprising a total of 1056 questionnaires from different queens and litters); breeds with fewer questionnaires being returned were arbitrarily excluded from the analysis because of the small numbers available. The 1056 questionnaires contained details on a total of 4819 kittens. Although not ideal, due to the similarities between the Devon Rex and Cornish Rex cats (Sayer and Loxton 1999), these breeds were combined to give a single figure for ‘Rex’ cats, allowing a reasonable number of cats for analysis.
Summary, descriptive statistics and multivariate analysis
A summary of the data together with descriptive analysis is shown in Table 1. The information from the 1056 queens and litters were derived from 942 different households. Of these, 70 households provided details on more than one queen and litter they had bred (mean 3.6 per household, median 2, range 2–7). As can be seen, the convenience sampling resulted in questionnaires being returned predominantly from younger queens (mean 2.8 years of age), and for most breeds between 30 and 50% of the queens were primiparous (overall mean 39.6%). The mean age (and standard deviation) of the primiparous queens was 1.5 years (±0.5), compared with 3.6 years (±1.7) for the multiparous queens.
Table 1.
Summary of the breed-specific data collected during the study
| Breed | Number of questionnaires (total=1056) | Mean age of the queen (years) | % of primiparous queens | Mean gestation length (days) | Mean litter size (#) | Mean % of kittens born alive | Mean % alive at 1 week | Mean % alive at 8 weeks | % litters delivered by caesarean | Mean weight of live kittens (grams) | % litters with ≥1 kitten defects |
|---|---|---|---|---|---|---|---|---|---|---|---|
| Persian | 212 | 3.1 | 32.3 | 65 | 3.8 | 89.2 | 77.2 | 74.7 | 6.6 | 92.8 | 9 |
| Burmese | 150 | 3 | 39.6 | 64.3 | 5.7 | 92.7 | 87.6 | 84.2 | 6.7 | 86.2 | 19.7 |
| Siamese | 138 | 2.2 | 42.2 | 66.1 | 4.9 | 91.7 | 85.2 | 82 | 11.6 | 92.4 | 19.1 |
| British Shorthair | 110 | 2.6 | 45.4 | 65.3 | 4.6 | 93.8 | 88.3 | 86.5 | 6.4 | 104.4 | 10.8 |
| Oriental Shorthair | 92 | 2.5 | 37 | 66.2 | 4.7 | 91.8 | 86.2 | 83.3 | 15.2 | 89.8 | 24.4 |
| Birman | 88 | 3.1 | 39.5 | 64.9 | 3.6 | 97.6 | 95.7 | 94.1 | 9.1 | 101 | 7.3 |
| ‘Rex’ | 47 | 2.5 | 50 | 64.7 | 4.2 | 91.5 | 87.4 | 84.1 | 8.5 | 91.4 | 12.8 |
| Asian | 41 | 2.8 | 45 | 64.5 | 6.5 | 95.3 | 93.2 | 92.6 | 2.4 | 84.7 | 18.8 |
| Abyssinian | 40 | 2.9 | 43.6 | 65.8 | 3.9 | 97.8 | 94.1 | 93.5 | 7.5 | 100.1 | 10.5 |
| Korat | 32 | 3.5 | 25 | 63 | 4.6 | 96.9 | 88.3 | 85.3 | 0 | 72.7 | 28.1 |
| Somali | 31 | 3.2 | 43.3 | 65.2 | 3.6 | 94.3 | 89.8 | 85.6 | 6.5 | 90.7 | 9.7 |
| Maine Coon | 27 | 2.2 | 40.7 | 65.5 | 4.6 | 98.6 | 94 | 90.2 | 0 | 116.1 | 15.4 |
| Tonkinese | 27 | 2.4 | 44.4 | 65 | 5.3 | 93.2 | 88.1 | 82.1 | 18.5 | 84.1 | 30.8 |
| Exotic Shorthair | 21 | 2.2 | 52.4 | 64.9 | 4.2 | 87.5 | 86.3 | 81.9 | 4.8 | 97.2 | 4.8 |
| Mean of all queens/litters±SD (range) | 2.8±1.7 (0.8–11.3) | 39.6 | 65.1±2.2 (50–80) | 4.6±1.7 (1–13) | 92.8±16.2 (0–100) | 86.4±23.1 (0–100) | 83.7±25.4 (0–100) | 8 | 93.5±19.8 (30–170) | 14.3 |
SD=standard deviation.
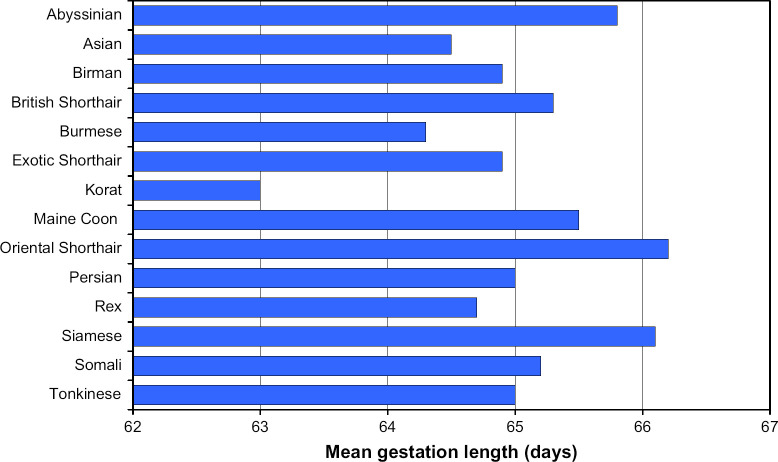
The overall mean gestation length was 65.1 days (Fig 2), with 90.2% of values occurring between 63 and 67 days, and 97.1% between 61 and 69 days. At the extremes, there were only four occasions where gestation lengths below 54 days or above 74 days were recorded. There were two cats with recorded gestation lengths of 50 days – one was an Asian queen with a litter of nine kittens that were all born alive, and one was a Persian queen with a litter of six kittens all of which were dead. There were also two cats with a recorded gestation length of 80 days – both were Persian queens and both had litters of five kittens all of which were dead.
Fig 2.
Mean gestation length analysed by breed.
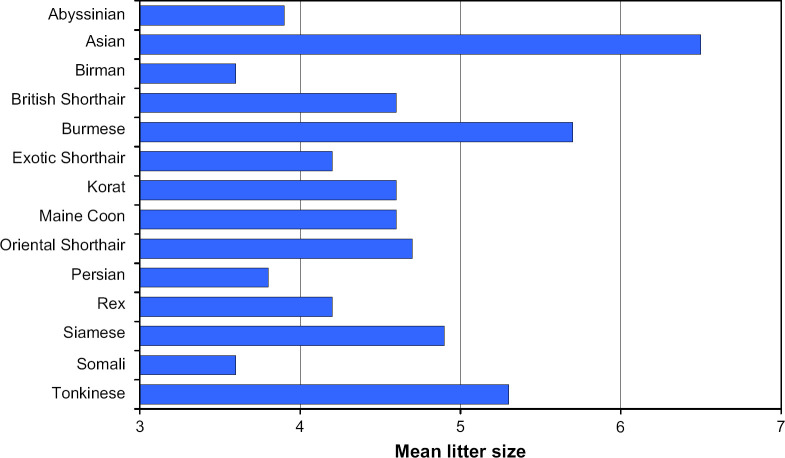
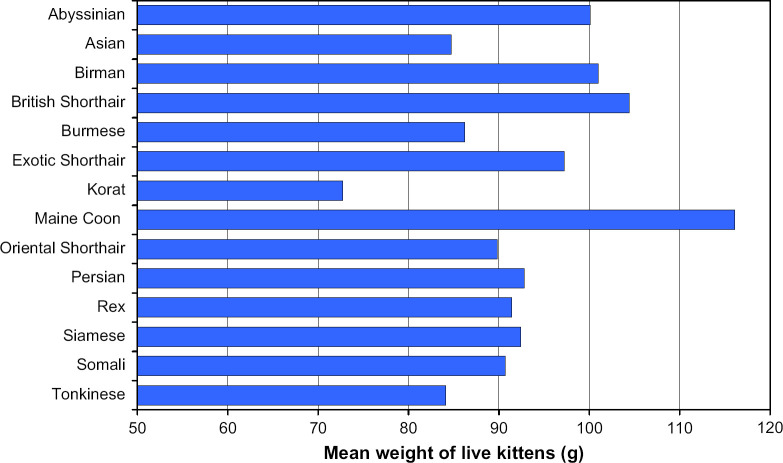
The data on the mean litter size and mean weight of kittens born alive are shown in Figs 3 and 4. Data on the weight of dead kittens in this study were too sparse to include, so only weights of the live kittens were included in the summary, and used for the analyses.
Fig 3.
Mean litter size analysed by breed.
Fig 4.
Mean weight of kittens born alive analysed by breed.
Table 2 shows the various outcomes that were examined using multivariate analysis, and the covariates that were evaluated for each, including those that were found to exert a significant effect. For all the outcomes measured, there was a significant effect of breed with the exception of the likelihood of a caesarean section being performed. In the initial analysis, the Korat and Maine Coon breeds had to be excluded from this analysis as neither of these breeds had any caesarean sections recorded, and the statistical model requires the presence of both outcomes. However, even when these breeds were forced into the model (by including a single litter from each breed delivered by caesarean), breed was still not a significant independent variable. Some of the relationships examined are shown graphically in Figs 5–8.
Table 2.
Summary of the multiple regression models for the outcome variables and covariates
| Outcome | Number of litters evaluated | Covariates (predictor variables of interest and potential confounding variables) | |||||||
|---|---|---|---|---|---|---|---|---|---|
| Queen's age | Queen's parity | Gestation length | Caesarean performed | Litter size | % kittens born alive | Kittens with defects | Breed (compared with Burmese) | ||
| Gestation length | 919 | NS | NS | ✗ | NS | P=0.04; ↓ of 0.1 days/kitten | NS | ✗ | P<0.0001; ↑ : Abyssinian, BSH, OSH, Siamese; ↓ : Korat |
| Litter size | 1037 | NS | NS | ✗ | ✗ | ✗ | ✗ | ✗ | P<0.0001; ↑ : Asian; ↓ : Abyssinian, Birman, BSH, ESH, Korat, Maine Coon, OSH, Persian, Rex, Siamese |
| Number of live kittens | 1036 | NS | NS | NS | ✗ | ✗ | ✗ | NS | P<0.0001; ↑ : Asian; ↓ : Abyssinian, Birman, BSH, ESH |
| Mean weight of live kittens | 510 | NS | NS | P=0.0003; ↑ of 1.4 g/day | ✗ | P<0.0001; ↓ of 2.2 g/kitten | ✗ | NS | P<0.0001; ↑ : Birman, BSH, Maine Coon; ↓ : Korat |
| Probability of caesarean section | 978 | NS | P=0.04; ↓ litters 1–3; ↑ litter 4+ | NS | ✗ | P=0.002; ↑ risk with smaller size | P<0.0001; ↑ risk with more dead kittens | NS | NS |
| Probability of kittens with physical defects | 1038 | NS | NS | ✗ | ✗ | NS | ✗ | ✗ | P=0.0015; ↓ : Birman, Persian |
| Less than 100% alive kittens in the litter | 1037 | NS | NS | NS | ✗ | P=0.0001; ↑ risk with larger size | ✗ | P=0.0002; ↑ risk with defects | P=0.0003; ↓ : Birman, Korat |
=not examined; NS=not significant in analysis;
or
=significant increased or decreased association, respectively, in final models; BSH=British Shorthair; OSH=Oriental Shorthair; ESH=Exotic Shorthair.
Fig 5.
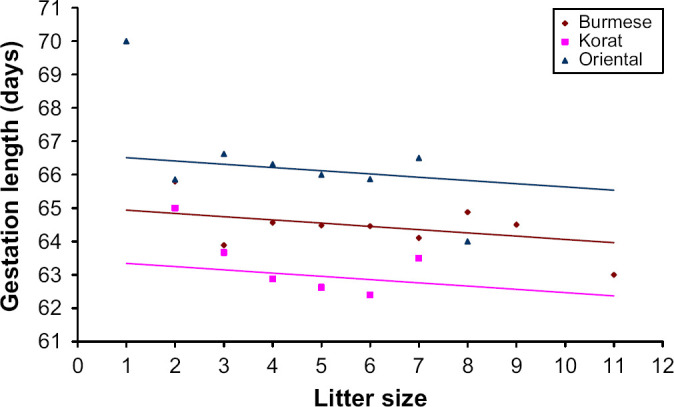
Relationship between length of gestation and litter size, controlling for covariates (Table 2). The graph shows the ‘best fit’ for the data from three representative breeds. The relationship was significant (P=0.04) on average with a decrease of 0.1 days gestation per kitten in the litter.
Fig 8.
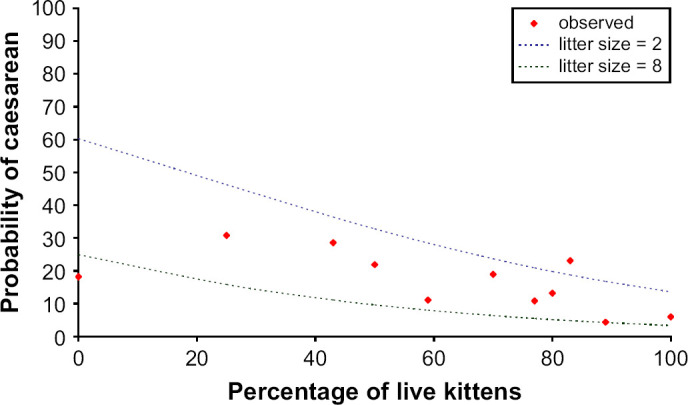
The relationship between the likelihood of a caesarean section, the litter size and the proportion of kittens born alive, controlling for covariates (Table 2). The graph shows the ‘best fit’ for the data derived from two litter sizes. The relationships were significant (P≤0.0002) with an increased likelihood associated with smaller litter sizes and the presence of dead kittens.
Fig 6.
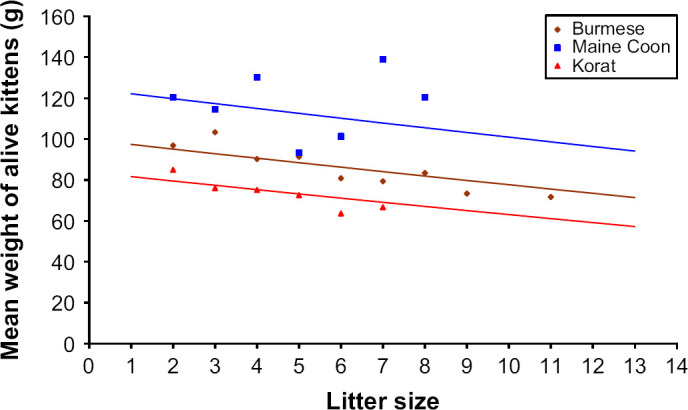
Relationship between mean weight of the kittens born alive and the litter size, controlling for covariates (Table 2). The graph shows the ‘best fit’ for the data from three representative breeds. The relationship was significant (P<0.0001) on average with a decrease of 2.2 g per kitten for each additional kitten in the litter.
Fig 7.
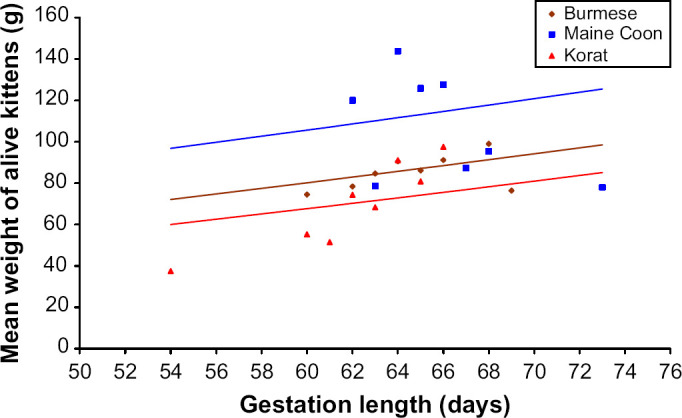
Relationship between the mean weight of kittens born alive and the gestation length, controlling for covariates (Table 2). The graph shows the ‘best fit’ for the data from three representative breeds. The relationship was significant (P=0.0003) on average with an increase in mean weight of 1.4 g per day of gestation.
It is interesting to note that the queen's age did not have a significant effect on any of the outcomes measured, and the queen's parity was only seen to significantly affect the likelihood of a caesarean section being performed (Table 2). However, this latter relationship only just reached a significant level (P=0.04) in the analysis, and given that multiple comparisons have been performed, this apparent relationship could potentially represent a type I statistical error. Nevertheless, it could also be argued that for this type of convenience survey, a less stringent P value may be more appropriate.
Data on parturition
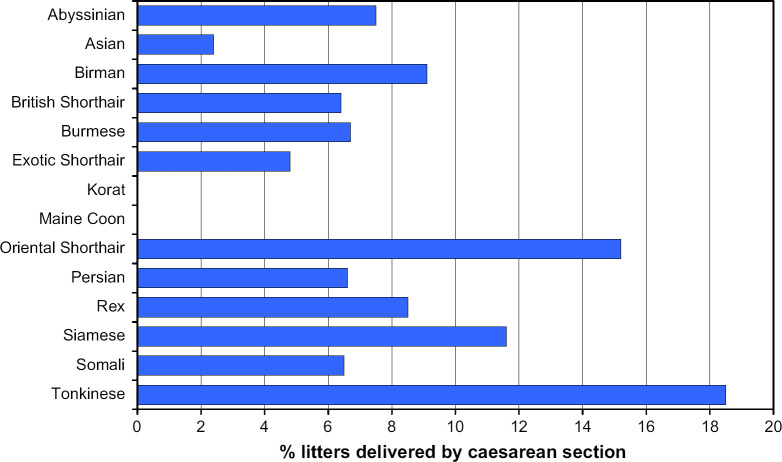
In all there were 154 (14.6%) of the births where owners reported they had sought veterinary intervention, and 85 (8.0%) resulted in a caesarean section being performed (Fig 9). Of the cats that did not have a caesarean section or any other veterinary intervention during the parturition, 901 respondents reported that they were present at the birth of the kittens and were, therefore, potentially able to provide details on the birth intervals evaluated. The data from those cases are summarised in Tables 3–5. The median duration of stage one labour (from onset of first observed contractions to the birth of the first kitten) was 0.5–1 h, with more than 80% of queens taking less than 2 h. The duration of stage two labour (between the birth of the first and last kittens) was very variable. In the majority (Table 4) it was less than 6 h, but in 1.6% it was more than 24 h. The time intervals between the birth of individual kittens was also very variable – information was available on 854 litters, but a total of 1001 different time intervals were recorded due to the variability within individual litters. These data are shown in Table 5 and while it can be seen that most intervals were short (less than 3 h, median less than 1 h) some were much longer with an interval of 48 h being recorded on two separate occasions.
Fig 9.
Proportion of gestations that resulted in a caesarean section analysed by breed. (None of the litters of Korat or Maine Coon cats required a caesarean section.)
Table 3.
Interval recorded between onset of abdominal contractions and birth of the first kitten
| Interval (h) | Number | Percentage |
|---|---|---|
| <0.5 | 161 | 19.1 |
| 0.5–1 | 265 | 31.4 |
| 1–2 | 273 | 32.4 |
| 2–4 | 111 | 13.2 |
| >4 | 33 | 3.9 |
| Total | 843 | 100 |
Table 5.
Interval recorded between the births of individual kittens within litters
| Interval (h) | Number | Percentage |
|---|---|---|
| <1 | 737 | 73.6 |
| 1–3 | 211 | 21.1 |
| 3–6 | 34 | 3.4 |
| 6–12 | 6 | 0.6 |
| 12–24 | 10 | 1.0 |
| 24–48 | 3 | 0.3 |
| Total | 1001 | 100 |
Table 4.
Interval recorded between the birth of the first and last kittens
| Interval (h) | Number | Percentage |
|---|---|---|
| <6 | 735 | 85.7 |
| 6–12 | 92 | 10.7 |
| 12–24 | 17 | 2.0 |
| 24–48 | 11 | 1.3 |
| >48 | 3 | 0.3 |
| Total | 858 | 100 |
Data on kitten survival
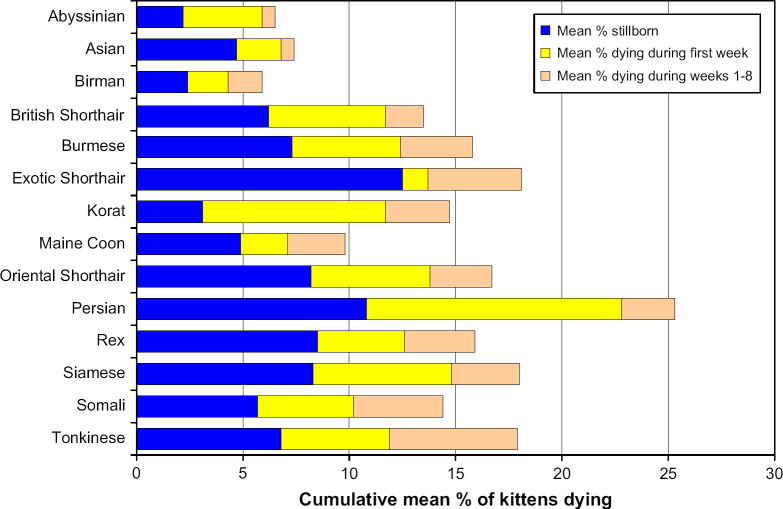
In total there was full information available on the survival of kittens through to 8 weeks of age from 915 litters, and this information is shown in Table 1 and Fig 10.
Fig 10.
Cumulative mean proportion of kittens in each litter dying through to 8 weeks of age analysed by breed.
Discussion
This study suffers from being a convenience-sampling questionnaire, rather than a true randomised cross-sectional study of pedigree cat breeding in the UK. Nevertheless, the use of a convenience-sampling questionnaire did enable collection of a large amount of data and this represents the largest study of its kind that the authors are aware of. Additionally, as the data were collected prospectively over a 12-month period, the accuracy of the data collected was maximised. Despite some drawbacks, the large sample size and the number of different breeds included in this study enabled the collection of valuable data.
The mean gestation period found in this study of 65 days is identical to that reported by Jemmett and Evans (1977) from a study of 104 pregnancies in a variety of pedigree breeds in the UK, and within the 63–66 days reported in a survey conducted in Australia comprising 48 litters of Persian and Siamese cats (Prescott 1973). More recently, Root et al (1995) reported a mean gestation length of 67 days in a colony of 14 research cats, and Lein (1989) reported a mean of 66 days in another cat colony and also suggested that previous reports of an average gestation length of around 63 days might be a result of earlier studies using the last day of mating, rather than the first day, to calculate the gestation length. Prescott (1973) reported that over 94% of the queens in their study had a gestation period of 61–68 days, and similarly Jemmett and Evans (1977) reported 92% within the period of 61–69 days – we found an even higher proportion of over 97% that fell within this time frame. Probably because of the larger nature of the current study, we found a wider range in the gestation length than in the previously cited studies, but not surprisingly, kittens born at the extremes of the range appeared to have a low chance of being viable. The results of multivariate analysis showed that neither the age nor the parity of the queen had any significant effect on the gestation length, whereas an increasing litter size was associated with a shorter gestation period, as has been observed in some other species including dogs (Okkens et al 1993). The breed was also determined to significantly affect gestation length independent of other factors, with Siamese and Oriental Shorthair cats having the longest mean gestations (more than 66 days) and Korats having the shortest (63 days).
In this study, the overall mean litter size of 4.6 kittens was similar or identical to the 4.6 reported by Prescott (1973), the range of 4–5 reported by Jemmett and Evans (1977), and the 4.4 reported in a survey of North American breeders by Scott and Geissinger (1978); although it was somewhat higher than the 3.7 reported by Povey (1978) in a smaller North America survey, and the 3.3 reported by Gerrits et al (1999) in a survey of the Dutch Cat Fancy. Johnston (1987) reported a range in litter size of 1–11 from a number of different breeds, which was similar to the range of 1–13 found in this study. While the queen's parity and age again exerted no significant effect on the litter size, there was an effect of breed. Our study identified Burmese, Siamese and related breeds (Asians and Tonkinese) as having a higher overall mean litter size, whereas Persians, Birmans, Abyssinians and the related Somali breed tended to have lowest mean litter sizes. These findings are in agreement with two studies from Australia and North America (Povey 1978, Johnston 1987) albeit that these studies involved only a limited number of breeds (six and five, respectively). Scott and Geissinger (1978) looked at a total of 23 different pedigree breeds in North America and reported mean litter sizes, but for 14 of the breeds studied data were available only from a limited number of litters (between 2 and 17). However, again similar to the current study, among the breeds with more substantial data they found Siamese, Burmese, Foreign Shorthair and Exotic Shorthair all had relatively larger litter sizes, and Birman cats had a small mean litter size. However, in their study Persian cats were found to have a mean litter size of 4.0 close to their overall mean of 4.4. Although we found no evidence of an effect of age on litter size, Johnston (1987) did find a potential decline in litter size associated with older queens (greater than 6–7 years of age). The numbers in that study were small, but equally there were few relatively older cats (in that age range) within the current study and thus such a relationship may not have been shown by our data. In addition to litter size, we were also able to evaluate the mean weight of the kittens born alive in this study, and in the multivariate analysis both gestation length and litter size independently affected kitten weight, in the way that would be expected. Breed was also independently associated with kitten weight which is illustrated by the fact that although the breeds with the largest average litter size (Asian, Tonkinese and Burmese) produced the lowest mean kitten weights, the converse was not true, and the largest mean kitten weights (Maine Coon, British Shorthair, and Abyssinian) were not from breeds producing the smallest litter sizes.
This study was also able to provide information on parturition from a large number of queens. Little data have been published on this previously, but whereas Root et al (1995) reported an average parturition length of 16 h (range 4 to 42) in seven research colony cats, both Lein (1989) and Gruffydd-Jones (1994) have commented that it is normal for queens to sometimes have intervals between births of kittens of up to 24–48 h. In our data derived from queens that gave birth without assistance, we found that in nearly 86% of cases, the time from the birth of the first to the last kitten was less than 6 h. Parturition took more than 24 h in less than 2% of cases, but there were three occasions where intervals between individual births were 24 h or longer, and in two of these the interval was 48 h. This confirms the previous observations that such intervals can be normal in cats, but also demonstrates that they are very rare. The variability in parturition intervals in queens is noteworthy, however, and emphasised by the results of the current study. Such variability can potentially result in difficulties in distinguishing dystocia and pathological abnormalities from a normal (but relatively prolonged) parturition process.
This study was not designed to evaluate the prevalence or causes of dystocia, and indeed two recent studies have examined this in some detail (Ekstrand and Linde-Forsberg 1994, Gunn-Moore and Thrusfield 1995). Nevertheless, we did collate data on caesarean sections, and found overall that 8.0% of the litters were delivered in this way. This is not dissimilar to the 5.8% of caesareans reported previously in pedigree cats from the UK by Gunn-Moore and Thrusfield (1995) and confirms that dystocia is not uncommon in cats. In both studies by Gunn-Moore and Thrusfield (1995) and Ekstrand and Linde-Forsberg (1994), Siamese or ‘Siamese-type’ cats were reported as having the highest relative risk of dystocia among the pedigree cats they examined, and the results of the current study are consistent with those findings. Nevertheless, our study failed to identify breed as a significant independent variable affecting the likelihood of a caesarean section being performed suggesting non-breed-related factors are more important. We were able to demonstrate a significant association between an increased risk of a caesarean section and cats with smaller litter sizes, and this finding is in keeping with observations in dogs where small litter sizes (1–2 pups) are often associated with primary uterine inertia (Darvelid and Linde-Forsberg 1994). Although the queens' parity was also significantly associated with the likelihood of caesarean, these data are more difficult to interpret, as the apparent decline in risk in multiparous queens could simply relate to selective breeding (avoiding breeding from queens with previous problems). Similarly the relationship between the likelihood of caesarean and the proportion of kittens born alive is difficult to interpret, as it is impossible to distinguish cause from effect in this relationship.
In our study, we found that there was an association between an increased risk of having one or more stillborn kittens and both an increasing litter size and the presence of congenital defects in the kittens. Breed was also significantly associated with this outcome. A weakness of this study is that the actual number of kittens affected by birth defects and the type of defect present were not recorded. Nevertheless, it is highly probable that a proportion of the defects would have been lethal (Young 1973), explaining the observed relationship with stillbirths. The overall prevalence of litters containing one or more kittens with congenital defects was relatively high (14.3%). However, as the vast majority of litters had multiple kittens it can be assumed that the prevalence of defects among the kittens as a whole (and not the litters) was considerably lower than this. Although data were not available to assess this, our finding of 14.3% of litters being affected appears to be in keeping with the 6.8% of individual kittens reported to have congenital defects in a previous large study of pedigree kitten mortality (Scott and Geissinger 1978). A proportion of congenital defects are also likely to be inherited, and this too may explain the significant variation observed between the prevalence of litters with defects in different breeds.
We found an overall mean of 8.2% of kittens being stillborn in this study, a figure that is similar to previous reports for pedigree breeding cats in the UK (5.9%, Jemmett and Evans 1977) and North America (10.2%, Scott and Geissinger 1978; 11.6%, Johnston 1987). Breed exerted a significant effect on the likelihood of having stillborn kittens in a litter and it can be seen (Fig 10) that Exotic Shorthairs and Persians were the breeds with the highest prevalence in this study. In other studies where the influence of breed has been evaluated, Persian cats consistently appear to produce a relatively high proportion of stillborn kittens (12–22%: Prescott 1973, Scott and Geissinger 1978, Johnston 1987) but there is little consistency among the other breeds reported, perhaps reflecting the complex nature and pathogenesis of foetal and kitten mortality (Young 1973, Lawler and Monti 1984). Also in agreement with our data, previous studies of pedigree cats have also shown that the majority of neonatal deaths occur in the first week of life, with a smaller proportion between 1 and 8 weeks of age (Prescott 1973, Scott and Geissinger 1978, Johnston 1987), though interestingly, the mean proportion of kittens still alive at 8 weeks in this study (83.7%) was higher than the 72.7% reported by Johnston (1987) and the 71.4% at 6 weeks reported by Scott and Geissinger (1978), perhaps reflecting improved husbandry conditions and knowledge of feline neonatal diseases. Again, the causes of death in this period will have been diverse and variable (Young 1973, Lawler and Monti 1984, Cave et al 2002), and this study did not attempt to address this issue specifically, but simply report the observed death rates.
This study represents the largest of its kind reported in the veterinary literature and adds considerably to the knowledge-base generated by previous studies, and it also provides quantitative data in areas where it was previously sparse or lacking. However, by its nature this study was relatively broad, and thus further more detailed studies will need to be undertaken to explore some of the relationships that have been established from this work.
Acknowledgements
The authors would like to thank the breeders who kindly participated in this study; the staff of the Feline Advisory Bureau, Dr Vicki Adams and Dr James Wood for their help with the study. Danielle Gunn-Moore was supported by Nestlé-Purina PetCare.
References
- Cave T.A., Thompson H., Reid S.W., Hodgson D.R., Addie D.D. Kitten mortality in the United Kingdom: a retrospective analysis of 274 histopathological examinations (1986 to 2000), Veterinary Record 151, 2002, 497–501. [DOI] [PubMed] [Google Scholar]
- Darvelid A.W., Linde-Forsberg C. Dystocia in the bitch: a retrospective study of 182 cases, Journal of Small Animal Practice 35, 1994, 402–407. [Google Scholar]
- Ekstrand C., Linde-Forsberg C. Dystocia in the cat: a retrospective study of 155 cases, Journal of Small Animal Practice 35, 1994, 459–464. [Google Scholar]
- Gerrits P.O., Huisman T., Knol B.W. Characteristics of pedigree cat breeding in the Netherlands: breeds, population increase and litter size, Tijdschrift voor diergeneeskunde 124, 1999, 145–148. [PubMed] [Google Scholar]
- Gruffydd-Jones T.J. The genital system and paediatrics. Chandler E.A., Gaskell C.J., Gaskell R.M. Feline Medicine and Therapeutics, 2nd edn, 1994, Blackwell Science: Oxford, 269–286. [Google Scholar]
- Gunn-Moore D.A., Thrusfield M.V. Feline dystocia: prevalence and association with cranial conformation and breed, Veterinary Record 136, 1995, 350–353. [DOI] [PubMed] [Google Scholar]
- Hosmer D.W., Lemeshow S. Applied Logistic Regression, 1989, John Wiley: New York. [Google Scholar]
- Jemmett J.E., Evans J.M. A survey of sexual behaviour and reproduction of female cats, Journal of Small Animal Practice 18, 1977, 31–37. [DOI] [PubMed] [Google Scholar]
- Johnston I. Reproductive patterns of pedigree cats, Australian Veterinary Journal 64, 1987, 197–200. [DOI] [PubMed] [Google Scholar]
- Lawler D.F., Monti K.L. Morbidity and mortality in neonatal kittens, American Journal of Veterinary Research 45, 1984, 1455–1459. [PubMed] [Google Scholar]
- Lein D.H. Female reproduction. Sherding R.G. The Cat – Diseases and Clinical Management, 1st edn, 1989, Churchill Livingstone: New York, 1479–1497. [Google Scholar]
- Okkens A.C., Hekerman T.W., deVogel J.W., vanHaaften B. Influence of litter size and breed on variation in length of gestation in the dog, Veterinary Quarterly 15, 1993, 160–161. [DOI] [PubMed] [Google Scholar]
- Olson P.N., Husted P.W., Allen T.A., Nett T.M. Reproductive endocrinology and physiology of the bitch and queen, Veterinary Clinics of North America, Small Animal Practice 14, 1984, 927–946. [DOI] [PubMed] [Google Scholar]
- Povey R.C. Reproduction in the pedigree female cat. A survey of breeders, Canadian Veterinary Journal 19, 1978, 207–213. [PMC free article] [PubMed] [Google Scholar]
- Prescott C.W. Reproduction patterns in the domestic cat, Australian Veterinary Journal 49, 1973, 126–129. [DOI] [PubMed] [Google Scholar]
- Root M.V., Johnston S.D., Olson P.N. Estrous length, pregnancy rate, gestation and parturition lengths, litter size, and juvenile mortality in the domestic cat, Journal of the American Animal Hospital Association 31, 1995, 429–433. [DOI] [PubMed] [Google Scholar]
- Sayer A., Loxton H. Encyclopedia of the Cat, 1999, Octopus Publishing Group: London, 43–44. [Google Scholar]
- Scott F.W., Geissinger C. Kitten mortality survey, Feline Practice 8, 1978, 31–34. [Google Scholar]
- Tsutsui T., Stabenfeldt G.H. Biology of ovarian cycles, pregnancy and pseudopregnancy in the domestic cat, Journal of Reproduction and Fertility (Supplement) 47, 1993, 29–35. [PubMed] [Google Scholar]
- Young C. Preweaning mortality in specific pathogen free kittens, Journal of Small Animal Practice 14, 1973, 391–397. [DOI] [PubMed] [Google Scholar]


