

Abstract
False thrombocytopenia may result from platelet aggregation, especially in feline ethylenediamine tetra-acetic acid (EDTA) blood specimens. Citrate, theophylline, adenosine and dipyridamole (CTAD) was added to 46 feline EDTA specimens to test its anti-aggregation action. Platelet aggregation was estimated from blood films and a complete blood count was performed with a Sysmex XT-2000iV analyser. Platelet aggregation score was >2 in 11/46 EDTA tubes and only in one EDTA + CTAD specimen. The platelet count was higher in all CTAD-supplemented tubes except one, medians measured by cytometry being 225.5 times 109/1 and 249.0 times 109/1 in EDTA and EDTA + CTAD, respectively (P = 0.007). Adding CTAD had statistically and analytically significant but moderate effects on other blood variables, the most intense variations being observed for reticulocytes (about 3% higher in EDTA specimens) and reticulocyte indexes. Addition of CTAD to EDTA when sampling feline blood is a useful option to reduce platelet clumping.
The measurement of platelet concentration is essential for many diagnostic and therapeutic purposes. Its accuracy can be markedly affected by platelet aggregation which generally decreases the count and can thus result in apparent thrombocytopenia, regardless of laboratory method or species.1,2 Platelet clumping is often observed in feline blood specimens, even in normal cats. 3 Furthermore, feline platelet and red blood cell (RBC) sizes often overlap because of the large size of platelets and small size of RBCs in this species.3,4 As a consequence, (i) the platelet count for feline specimens with aggregates is often inaccurate regardless of the laboratory method used; (ii) the mean platelet volume (MPV) and mean corpuscular volume (MCV), white blood cell count (WBC) and differential can also be inaccurate in feline whole blood specimens when impedance-based analysers are used.1,5,6
Although size-overlapping problems can be resolved by flow cytometry technology, the occurrence of platelet aggregates needs to be reduced at the pre-analytical step. The anticoagulant citrate, theophylline, adenosine and dipyridamole (CTAD) has been reported to reduce feline platelet aggregation, 7 and in one study in humans, a combination of ethylenediamine tetra-acetic acid (EDTA) and CTAD was more efficient than CTAD alone at 4°C.8,9 Other reagents have also been used to obtain resting platelets, such as kanamycine10,11 and prostaglandin E1 (PGE1)12–14 but are less easy to handle, whereas CTAD tubes are commercially available. The purpose of this study was thus to compare the degree of aggregation in feline blood sampled on EDTA or EDTA plus CTAD (EDCT), and to see if the addition of CTAD to EDTA altered the results of other blood variables.
Materials and methods
Forty-six blood specimens were selected among specimens collected from cats admitted to different services of the Hospital of the Veterinary School of Toulouse, as part of routine diagnoses or disease monitoring. The only inclusion criteria were that only fresh specimens (<1 h) were used and that the volume of specimen collected was sufficient for the study. Blood tubes were collected from the jugular vein into a 5 ml K3-EDTA vacuum tube (Venoject; Terumo, Europe NV, Leuven, Belgium) with a 0.8 × 40 mm needle (Venosafe Multisample; Terumo, Europe NV, Leuven, Belgium). The tubes were gently homogenised by 10 inversions immediately after collection. Incorrectly filled tubes, or tubes with macroscopic clots, were excluded. Three millilitres of each specimen were then pipetted into a tube containing CTAD (Vacuette; Greiner Bio-one GmbH, Kremsmünster, Austria), which was homogenised by 10 inversions (EDCT tubes) and placed for approximately 20 min on a mechanical mixer (Speci Mix, CT06478, Oxford, USA) before analysis.
A blood film was prepared from each specimen, air-dried and stained (modified May-Grünwald-Giemsa, Aerospray, Wescor), fixed, coverslip-mounted and stored in darkness. To determine the platelet count and degree of platelet aggregation, smears were examined by the same trained veterinarian (FG) under light microscopy (BX60 microscope WH10X/22, Olympus, Japan). The film platelet count (PLT-F) was estimated by calculating the mean number of platelets per oilimmersion field (10 randomly selected fields in the monolayer area) multiplied by a pre-established factor of 15 (109 platelets/l). 15 The degree of aggregation was estimated using the following scoring system 7 : 0 = no aggregate, 1–5 = aggregates of 2–4 platelets, 5–9 platelets, 10–19 platelets, 20–29 platelets and ≥ 30 platelets, respectively. The mean of the 10 values observed on 2 × 5 oil-immersion fields randomly selected on the edge and tail of the film was calculated. Arbitrarily EDTA specimens with a score <2 were considered as not or little aggregated (NLA) and specimens with a score ≥2 were considered as highly aggregated (HA).
A complete automated blood count was performed on each specimen using the Sysmex XT-2000iV (Sysmex, Kobe, Japan). This included WBC, RBC, PLT, haemoglobin (HGB), haematocrit (HCT), MCV, mean corpuscular haemoglobin (MCH), mean corpuscular haemoglobin concentration (MCHC), red blood cell distribution width as coefficient of variation (RDW-CV), red blood cell distribution width as percentage (RDW-CV), reticulocyte percentage (RET %), and count (RET), reticulocyte indexes [low fluorescence ratio (LFR), medium fluorescence ratio (MFR), high fluorescence ratio (HFR), immature reticulocyte fraction (IRF)] and the differential leukocyte count. The PLT and RBC counts were estimated by two different methods: flow cytometry and impedance cell counting (PLT-O, RBC-O and PLT-I, RBC-I) (Table 1). All counts obtained for EDCT tubes were multiplied by a factor (1.12) to compensate for the dilution.
Table 1.
Comparison of platelet count by impedance (PLT-I) and optical (PLT-O) methods with Sysmex XT-2000iV and by evaluation from blood film (PLT-F) according to Norman's platelet aggregation score in feline blood specimens collected in EDTA or EDTA + CTAD (EDCT). (HA and NLA subgroups based on EDTA score of aggregation ≥ 2 and <2, respectively; comparison between the EDTA and EDCT results by Student's t-paired test or Wilcoxon's test according to homogeneity or heterogeneity of variances.)
| Analyte | Group | n | EDTA | EDCT | P | ||
|---|---|---|---|---|---|---|---|
|
|
|
||||||
| Median | Min—max | Median | Min—max | ||||
|
| |||||||
| PLT-I (109/1) | All | 45 | 122.0 | 1.0–345.0 | 166.4 | 3.4–338.4 | 0.057 |
| HA | 11 | 24.0 | 1.0–111.0 | 156.3 | 24.6–338.4 | 0.002 | |
| NLA | 34 | 167.0 | 4.0–345.0 | 178.7 | 3.4–328.3 | 0.004 | |
| PLT-O (109/1) | All | 46 | 225.5 | 8.0–518.0 | 249.0 | 27.9–513.7 | 0.007 |
| HA | 11 | 80.0 | 24.0–242.0 | 240.1 | 134.0–424.3 | <0.001 | |
| NLA | 35 | 262.0 | 8.0–518.0 | 255.7 | 27.9–513.7 | 0.209 | |
| PLT-F (109/1) | All | 46 | 345.0 | 25.5–850.0 | 383.9 | 8.4–1080.4 | 0.022 |
| HA | 11 | 160.0 | 47.5–477.5 | 390.8 | 78.2–764.9 | 0.026 | |
| NLA | 35 | 407.5 | 12.5–850.0 | 376.9 | 8.4–1080.4 | 0.419 | |
The analyser was subjected to a quality control using the manufacturer's control solutions at three levels (Sysmex e-check L1, L2 and L3 levels); imprecision of measurements was evaluated according to CLSI 16 recommendations and is reported in Table 2.
Table 2.
Comparison of blood variable results obtained in feline blood collected in EDTA and EDCT (EDTA + CTAD) tubes (comparison by Student's t-paired or Wilcoxon's test according to homogeneity of variances); number of cases for which the differences were higher than analytical variability and of cases which would have been classified differently according to the limits of the reference interval in Moritz et al. 17
| Variable | EDTA | EDCT | P EDCT vs EDTA | Passing—Bablok equation EDCT = a·EDTA + b | Repeatability CV (%) | n cases > analytical variability | n cases > differently classified according to RI | ||||
|---|---|---|---|---|---|---|---|---|---|---|---|
|
|
|
|
|||||||||
| Median | Min—max | Median | Min—max | r | a | b | |||||
|
| |||||||||||
| RBC-I (1012/l) | 7.87 | 1.74–11.48 | 7.97 | 1.76–11.51 | <0.001 | 1.01[1.00; 1.01] | 0.04[-0.02; 0.09] | 0.5 | 14/46 | 0/46 | |
| RBC-O (1012/l) | 7.29 | 1.55–10.53 | 7.35 | 1.56–10.81 | 0.035 | 1.02M[1.00; 1.04] | -0.06[-0.21; 0.05] | 0.5 | 11/46 | 0/46 | |
| HGB (g/l) | 112.0 | 30.0–162.0 | 112.8 | 30.2–161.9 | 0.161 | 1.00[0.99; 1.01] | 0.50[-0.28; 2.04] | 0.4 | 5/46 | 0/46 | |
| HCT (l/l) | 0.361 | 0.123–0.502 | 0.377 | 0.125–0.523 | <0.001 | 1.05[1.03; 1.06] | -0.04[-0.56; 0.50] | 0.5 | 44/46 | 1/46 | |
| MCV (fl) | 45.0 | 35.1–78.2 | 46.8 | 36.1–78.5 | <0.001 | 1.04[1.01; 1.06] | -0.16[-0.81; 1.07] | 0.2 | 43/46 | 3/46 | |
| MCH (pg) | 13.8 | 10.8–18.4 | 13.9 | 10.4–17.7 | <0.001 | 1.00[1.00; 1.05] | -0.10[-0.75; −0.10] | 0.8 | 2/46 | ND | |
| MCHC (g/l) | 306.0 | 235.0–331.0 | 290.0 | 226.0–314.0 | <0.001 | 0.94[0.89; 1.00] | 3.37[-13.50; 19.27] | 0.8 | 40/46 | ND | |
| RDW-SD (fl) | 30.8 | 27.0–71.8 | 31.1 | 27.0–70.2 | 0.054 | 1.08[1.00; 1.17] | -2.19[-4.90; 0.40] | 0.5 | 23/45 | ND | |
| RDW-CV (%) | 21.8 | 18.2–30.2 | 20.9 | 17.1–28.6 | <0.001 | 0.94[0.89; 1.00] | 0.20[-1.10; 1.44] | 0.4 | 44/46 | ND | |
| Reticulocytes (109/l) | 36.35 | 1.80–269.20 | 34.95 | 1.12–239.41 | 0.010 | 0.86[0.76; 0.97] | 11.82[-24.24; 54.73] | 3.0 | 34/46 | ND | |
| Reticulocytes (%) | 0.53 | 0.08–15.47 | 0.48 | 0.05–13.57 | 0.028 | 0.86[0.75; 0.97] | 0.02[-0.03; 0.07] | 3.2 | 30/46 | ND | |
| LFR (%) | 93.3 | 68.9–100.0 | 93.7 | 61.7–100.0 | 0.192 | 0.87[0.56; 1.25] | 12.89[-23.01; 41.55] | 2.2 | 6/46 | ND | |
| MFR (%) | 5.4 | 0.0–20.8 | 4.7 | 0.0–25.4 | 0.383 | 0.91[0.61; 1.33] | 0.00[-2.22; 1.60] | 8.4 | 29/46 | ND | |
| HFR (%) | 1.5 | 0.0–10.3 | 1.0 | 0.0–12.9 | 0.115 | 1.07[-1.08/3.23] | -0.68[-4.53/3.17] * | 17.4 | 33/46 | ND | |
| IRF (%) | 6.7 | 0.0–31.1 | 6.4 | 0.0–38.3 | 0.192 | 0.87[0.57; 1.26] | 0.26[-2.01; 1.98] | 6.8 | 25/46 | ND | |
| WBC (109/l) | 10.28 | 3.82–79.69 | 10.09 | 3.73–77.26 | <0.001 | 0.97[0.96; 0.99] | -0.02[-0.20; 0.12] | 1.3 | 12/46 | 0/46 | |
| Neutrophils (109/l) | 6.40 | 1.16–38.03 | 5.78 | 0.85–38.46 | <0.001 | 0.99[0.96; 1.01] | -0.07[-0.27; 0.06] | 1.6 | 12/43 | 0/46 | |
| Lymphocytes (109/l) | 1.93 | 0.31–7.35 | 1.56 | 0.26–7.47 | 0.138 | 0.98[0.93; 1.04] | -0.06[-0.16; 0.04] | 5.7 | 10/43 | 0/46 | |
| Monocytes (109/l) | 0.36 | 0.05–6.99 | 0.37 | 0.04–6.06 | 0.333 | 0.99[0.94; 1.03] | 0.00[-0.01; 0.02] | 13.2 | 8/46 | 0/46 | |
| Eosinophils (109/l) | 0.33 | 0.03–2.37 | 0.32 | 0.01–2.38 | 0.013 | 0.98[0.92; 1.03] | -0.01[-0.03; 0.00] | 5.9 | 6/46 | 0/46 | |
r = Spearman's correlation coefficient; a and b are slope and intercept respectively, with 95% confidence interval between brackets. ND = not determined because reference limits are not indicated. CVs were determined with manufacturer's control solution at ‘normal’ level according to CLSI; LFR, MFR, HFR.
Deming's equation because Passing—Bablok's was not computable.
The results obtained with the two anticoagulants were compared by Student's paired t-test when the variances were homogeneous (Fisher's test), and otherwise by Wilcoxon's test. The number of cases when the differences were higher than could be expected from within run imprecision, and the number of cases when the differences could account for a different classification of results, according to recently published feline reference intervals, 17 were also counted. The three different PLT counts (PLT-O, PLT-I and PLT-F) were compared by analysis of variance (ANOVA) for paired measurements and Tukey's test. Calculations were performed with an Excel spreadsheet and Analyse-It (Leeds, UK). As most distributions were significantly different from Gaussian, the results are reported as median and minimum—maximum range between brackets.
Results
All 46 paired feline specimens were analysed. Some results were not given by the analyser, however, due to modifications induced by the cat's illness. For example, some differential counts were incomplete and one PLT-I was excluded because the cat presented microcytosis which had induced an absurd platelet count (∼5.1012/l) with the impedance measurement. The numbers of comparisons used for each variable are reported in Table 1.
The overall degree of aggregation was lower in EDCT than in EDTA specimens, with medians of 0.75 and 0.30, respectively (P≤ 0.0002) (Fig 1). Moreover, the distributions of the aggregation scores for the EDTA tubes were bimodal: 11 specimens had a score higher than 2 and 35 a score lower than 2, with medians of 3.17 and 0.58, respectively (P< 0.0001). In the EDCT specimens, the aggregation scores for the NLA and HA subgroups based on aggregation in EDTA, were not significantly different (P = 0.1428). The aggregation scores were lower in EDCT tubes than in EDTA tubes in the HA and NLA subgroups (P< 0.001 and P = 0.021, respectively).
Fig 1.
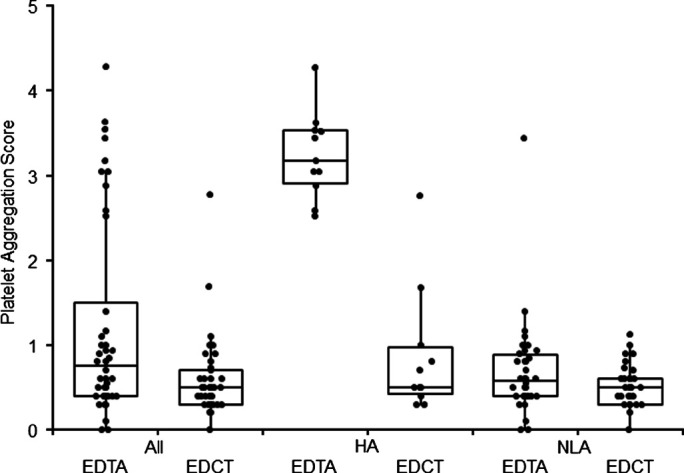
Comparison of platelet aggregation scores in feline specimens according to anticoagulant (EDTA or EDCT = EDTA + CTAD). Boxes represent median and quartiles for the 46 feline blood specimens (All) and in HA (n = 11) and NLA (n = 35) subgroups based on platelet aggregation score ≥2 and <2, respectively, in EDTA specimens.
The PLT counts were lower in EDTA than EDCT tubes with all three methods (Table 1). In the HA subgroup, the platelet count was consistently lower in EDTA specimens than in EDCT specimens, and the platelet counts in EDTA were at least two or three times lower than in EDCT specimens. Eight out of 11 cases in the HA subgroup had much lower counts in EDTA than in EDCT, whichever PLT count method was used. Moreover, the PLT counts differed significantly according to method, irrespective of the aggregation score or anticoagulant used, (ANOVA for repeated series, P< 0.0001), PLT-F being significantly higher than PLT-O, itself higher than PLT-I (Tukey's test, P< 0.05).
No statistically significant difference was observed between results obtained in EDTA and EDCT for HGB, RDW-SD, reticulocyte indexes, and lymphocyte and monocyte counts (Table 2). All other variables showed significant differences, many of which were larger than could be due to analytical variability. However, none of the latter differences had any effect on clinical classification of the results according to the reference limits, except for one and three cases out of 46 for HCT and MCV, respectively (Table 2). RBC-I, RBC-O, HCT, MCV and MCH were higher in EDCT specimens whereas MCHC, RDW-CV, RET%, RET, WBC and neutrophil count were lower in EDCT than in EDTA tubes. Moreover, most correlations were good (r ≤ 0.94) and most Passing—Bablok's equations had slope and intercept values for which the confidence interval contained 1 or 0, respectively (Table 2). However, the correlation of reticulocyte count was weaker (r = 0.91) and correlation of reticulocyte indexes was low.
Discussion
The decision to use CTAD as a platelet clumping inhibitor was based on the commercial availability of this anticoagulant which can easily be used by any practitioner. In this study, we chose to add CTAD to EDTA: (i) as this combination had been shown to be more efficient in preventing human platelet—leukocyte aggregation and platelet activation than CTAD alone at 4°C 9 ; (ii) because this study was performed on specimens submitted for CBC as EDTA tubes (it was thus not possible to test the effects of CTAD alone) and, (iii) even though the addition of CTAD produced an additional dilution factor requiring correction and possibly altering cell morphology. To our knowledge, addition of CTAD to EDTA had not been previously tested in feline haematology and possible effects of addition of CTAD to EDTA on routine blood results could not be inferred from previously reported of CTAD on blood variables. 7
In this study, addition of CTAD to EDTA decreased platelet aggregation in feline specimens. However, this result was obtained in a limited number of cases, as only 11/46 specimens (24%) showed significant platelet clumping in EDTA (classified in the HA subgroup). This low proportion of aggregated specimens could be explained by the fact that the blood specimens were collected by experienced clinicians from a large vessel (the jugular vein) with a vacuum system. These conditions have been reported to limit spontaneous platelet clumping18,19 but no original study could be found. In one case, addition of CTAD failed to prevent platelet aggregation. The tube was from a diseased cat, which had to be re-sampled because macroscopic clots were visible in the first specimen.
The decreased platelet clumping produced by CTAD resulted in higher platelet counts, whatever the technique. However, the results regarding platelet indexes are lacking because MPV, PDW and PCT are not reported by the Sysmex XT-2000iV in feline blood. This is due to the manufacturer's choices of methodology: this analyser calculates the platelet indexes from impedance curves, which are considered not accurate enough in feline blood to validly calculate these variables. With an impedance analyser, the feline plateletcrit has been shown to be higher and MPV lower in the presence of CTAD alone. 7 These results were not confirmed in human specimens but analyses were performed by cytometry, with an ADVIA 120. 9 This discrepancy could be explained; (i) by the different haematology methods used; (ii) the inability of impedance measurements to give reliable results for platelets in cats, because the platelet size distribution curve never reaches baseline within the PLT window in this species. This could justify the manufacturer's choice to not provide platelet indexes obtained by impedance, even if this is a limit of the analyser.
Finally, after having confirmed platelet clumping inhibition by CTAD, it was necessary to assess the possible effects of CTAD addition on other blood variables, which could not be inferred from effects reported on CTAD alone. 7 This study showed that the complete blood counts obtained with EDTA or EDTA plus CTAD were very similar, even though they were often statistically different. Correlation between the two sets of values was weaker for reticulocyte count than for the other variables for which it was ≥0.94. Correlations were low for reticulocyte indexes. To our knowledge, there is no information on the relevance and use of these indexes to diagnose regenerative anaemia in cats. The high rate of ‘analytically significant’ differences largely results from the very good repeatability of this analyser, which makes small differences larger than analytical variability for specimens analysed within the same series.
These results contrast with previous studies which reported that RBC and WBC were lower with CTAD, 7 and that MCV was lower in CTAD and higher in CTAD plus EDTA than in EDTA alone.7,9 These discrepancies could be explained by differences between methods. To our knowledge there is no publication with which our results for reticulocytes and indexes can be compared.
Even though most results for EDTA alone and EDTA plus CTAD were very similar, specific reference intervals should be determined or transferred when available according to international recommendations.20–22
To conclude, adding CTAD to EDTA tubes to determine complete blood counts in felines can be a valid option until specific tubes become available.
Conflict of interest
The Sysmex XT-2000iV analyser used in this study was provided as a free loan by the manufacturer who was not involved in any step or funding of this study.
References
- 1.Norman EJ, Barron RC, Nash AS, Clampitt RB. Prevalence of low automated platelet counts in cats: comparison with prevalence of thrombocytopenia based on blood smear estimation. Vet Clin Pathol 2001; 30: 137–40. [DOI] [PMC free article] [PubMed] [Google Scholar]
- 2.Koplitz SL, Scott MA, Cohn LA. Effects of platelet clumping on platelet concentrations measured by use of impedance or buffy coat analysis in dogs. J Am Vet Med Assoc 2001; 219: 1552–6. [DOI] [PubMed] [Google Scholar]
- 3.Zelmanovic D, Hetherington EJ. Automated analysis of feline platelets in whole blood, including platelet count, mean platelet volume, and activation state. Vet Clin Pathol 1998; 27: 2–9. [DOI] [PubMed] [Google Scholar]
- 4.Weiser MG, Kociba GJ. Platelet concentration and platelet volume distribution in healthy cats. Am J Vet Res 1984; 45: 518–22. [PubMed] [Google Scholar]
- 5.Dawson H, Hoff B, Grift E, Tvedten H, Shoukri M. Validation of the Coulter AcT Diff hematology analyzer for analysis of blood of common domestic animals. Vet Clin Pathol 2000; 29: 132–6. [DOI] [PubMed] [Google Scholar]
- 6.Dewhurst EC, Crawford E, Cue S, Dodkin S, German AJ, Papasouliotis K. Analysis of canine and feline haemograms using the VetScan HMT analyser. J Small Anim Pract 2003; 44: 443–8. [DOI] [PubMed] [Google Scholar]
- 7.Norman EJ, Barron RC, Nash AS, Clampitt RB. Evaluation of a citrate-based anticoagulant with platelet inhibitory activity for feline blood cell Counts. Vet Clin Pathol 2001; 30: 124–32. [DOI] [PubMed] [Google Scholar]
- 8.Mody M, Lazarus AH, Semple JW, Freedman J. Preanalytical requirements for flow cytometric evaluation of platelet activation: choice of anticoagulant. Transfus Med 1999; 9: 147–54. [DOI] [PubMed] [Google Scholar]
- 9.Macey M, Azam U, McCarthy D, et al. Evaluation of the anticoagulants EDTA and citrate, theophylline, adenosine, and dipyridamole (CTAD) for assessing platelet activation on the ADVIA 120 hematology system. Clin Chem 2002; 48: 891–9. [PubMed] [Google Scholar]
- 10.Ahn HL, Jo YI, Choi YS, et al. EDTA-dependent pseudothrombocytopenia confirmed by supplementation of kanamycin; a case report. Korean J Intern Med 2002; 17: 65–8. [DOI] [PMC free article] [PubMed] [Google Scholar]
- 11.Sakurai S, Shiojima I, Tanigawa T, Nakahara K. Aminoglycosides prevent and dissociate the aggregation of platelets in patients with EDTA-dependent pseudothrombocytopenia. Br J Haematol 1997; 99: 817–23. [DOI] [PubMed] [Google Scholar]
- 12.Gryglewski RJ, Korbut R, Ocetkiewicz A. De-aggregatory action of prostacyclin in vivo and its enhancement by theophylline. Prostaglandins 1978; 15: 637–44. [DOI] [PubMed] [Google Scholar]
- 13.Welles EG, Bourne C, Tyler JW, Boudreaux MK. Detection of activated feline platelets in platelet-rich plasma by use of fluorescein-labeled antibodies and flow cytometry. Vet Pathol 1994; 31: 553–60. [DOI] [PubMed] [Google Scholar]
- 14.Tvedten H, Johansson P. Feline platelet counting with prostaglandin E1 on the Sysmex XT-2000iV. Vet Clin Pathol 2010; 39: 190–2. [DOI] [PubMed] [Google Scholar]
- 15.Georges JW. Ocular field width and platelet estimates (letter). Vet Clin Pathol 1999; 28: 126. [Google Scholar]
- 16.NCCLS. Document EP5-A2 evaluation of precision performance of quantitative measurement methods; approved guideline. 2nd edn. Wayne, PA: NCCLS, 2004. [Google Scholar]
- 17.Moritz A, Fickenscher Y, Meyer K, Failing K, Weiss DJ. Canine and feline hematology reference values for the ADVIA 120 hematology system. Vet Clin Pathol 2004; 33: 32–8. [DOI] [PubMed] [Google Scholar]
- 18.Mackin A. Platelet disorders. In: August JR, ed. Consultations in feline internal medicine, vol 5: Saint Louis, MI: Elsevier Saunders, 2006; 575–84. [Google Scholar]
- 19.Meinkoth JH, Allison RW. Sample collection and handling: getting accurate results. Vet Clin North Am Small Anim Pract 2007; 37: 203–19. [DOI] [PubMed] [Google Scholar]
- 20.Geffre A, Friedrichs K, Harr K, Concordet D, Trumel C, Braun JP. Reference values: a review. Vet Clin Pathol 2009; 38: 288–98. [DOI] [PubMed] [Google Scholar]
- 21.Geffré A, Concordet D, Trumel C, Braun JP. Validation of pre-existing reference intervals: can the procedure be applied to canine haemostasis? J Vet Diagn Invest 2011; 21: 803–14. [DOI] [PubMed] [Google Scholar]
- 22.CLSI. Defining, establishing, and verifying reference intervals in the clinical laboratory; approved guideline. 3rd edn. Wayne, PA: CLSI, 2008. [Google Scholar]