

In the Abstract, one of the compounds referenced is incorrectly named MMV024937. The correct compound is MMV024397.
Also, in Fig 9, the x axis of panel H is incorrectly labelled as MMV024937. The authors have provided a corrected version here.
Fig 9. Assessing the activity of ETC inhibitors against ELQ-300-resistant T. gondii parasites.
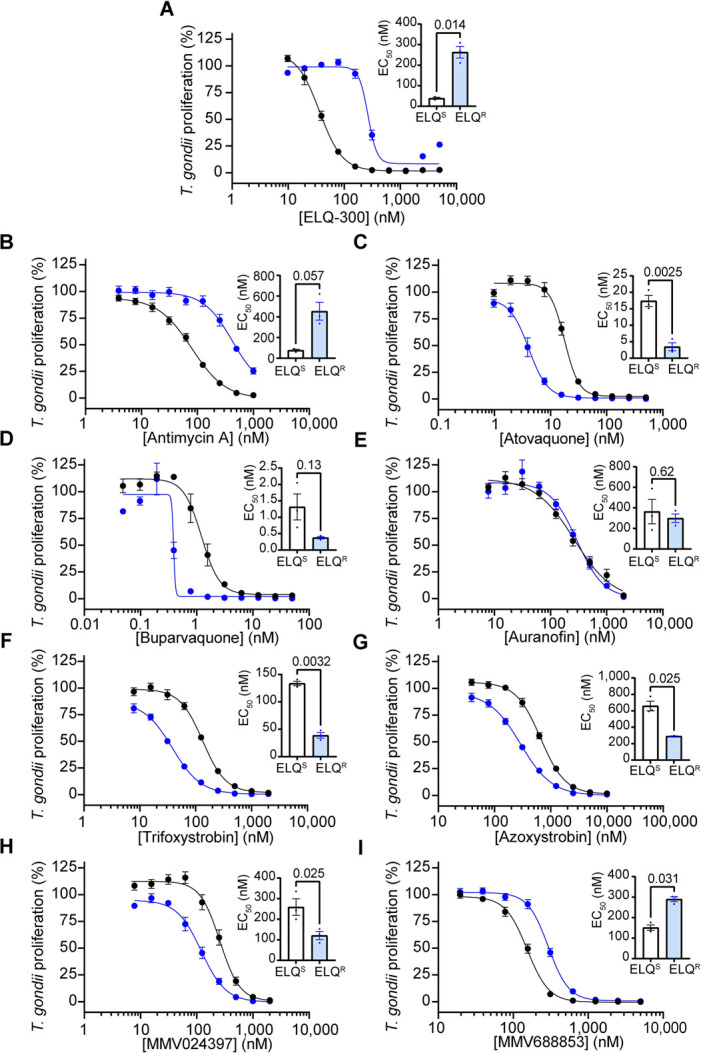
(A-I) Dose-response curves depicting the percent proliferation of ELQ-300-resistant (ELQR, blue) T. gondii parasites, or the corresponding ELQ-300-sensitive parental strain (ELQS, black), in the presence of increasing concentrations of (A) ELQ-300, (B) antimycin A, (C) atovaquone, (D) buparvaquone, (E) auranofin, (F) trifloxystrobin, (G) azoxystrobin, (H) MMV024397, or (I) MMV688853. Values are expressed as a percent of the average fluorescence from a no-drug control at mid-log phase growth in the fluorescence proliferation assay, and represent the mean ± SEM of three independent experiments performed in triplicate; error bars that are not visible are smaller than the symbol. Inset bar graphs depict the EC50 ± SEM (nM) of three independent experiments. Paired t-tests were performed and p-values are shown.
Reference
- 1.Hayward JA, Makota FV, Cihalova D, Leonard RA, Rajendran E, Zwahlen SM, et al. (2023) A screen of drug-like molecules identifies chemically diverse electron transport chain inhibitors in apicomplexan parasites. PLoS Pathog 19(7): e1011517. doi: 10.1371/journal.ppat.1011517 [DOI] [PMC free article] [PubMed] [Google Scholar]