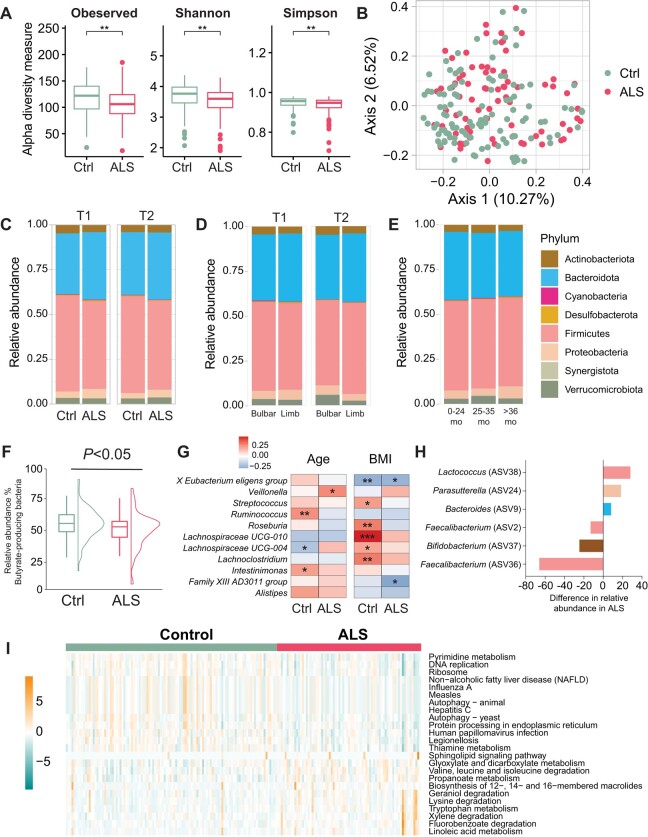
Figure 2.
Microbial structure differs in ALS cases versus controls. (A) At the first time point (T1), intragroup alpha-diversity was significantly lower in amyotrophic lateral sclerosis (ALS) (n = 75) versus control (Ctrl, n = 110) faecal samples, represented by box plots [median by horizontal line; interquartile range (IQR) by box; maximum/minimum by vertical lines]; *P < 0.01 by t-test. (B) At T1, intergroup beta-diversity differed significantly between ALS versus control faecal samples, represented by principal coordinate analysis based on Bray-Curtis dissimilarity analysis; P = 0.005 by ANOVA. (C) Relative abundance of phyla (Actinobacteria, Bacteroidetes, Cyanobacteria, Desulfobacterota, Firmicutes, Proteobacteria, Synergistota, Verrucomicrobiota) shown as stacked bar plots for ALS versus control; at T1 Firmicutes (P = 4.7 × 10¹⁶), Cyanobacteria (P = 0.010), at T2 Firmicutes (P = 7.4 × 10¹⁶), in ALS versus control, by Wilcoxon test. (D) Relative abundance of phyla in faecal samples from ALS cases with bulbar (n = 27) versus limb (n = 47) onset at T1 and T2; at T1 Bacteroidetes (P = 0.022), at T2 Firmicutes (P = 0.0014), in ALS versus control, by Wilcoxon test. (E) Relative abundance of phyla in faecal samples from ALS cases from disease onset to sample collection stratified by 0–24 months (mo; n = 87), 25–35 months (n = 26) and >36 months (n = 26); Synergistota (P = 0.0074) in 0–24 months versus 25–35 months, Synergistota (P = 0.0074) in 25–35 months versus >36 months, by ANOVA. (F) At T1, butyrate-producing bacteria abundance was lower in ALS versus control focal samples, represented by box plots with data distribution; P < 0.05 by Wilcoxon test. (G) At T1, relative abundance of faecal ASVs at the genus level in ALS cases and controls by age (left) and BMI (right) represented by heat map; gradient colour scale represents correlation r-value. *P < 0.05, **P < 0.01, ***P < 0.001 by Spearman’s rank correlation. (H) At T1, genera ASVs driving gut microbial differences in ALS versus control faecal samples, assessed by logistic regression adjusted for age, sex and BMI. (I) At T1, significant biological pathways associated with gut microbial relative abundance in ALS cases versus control faecal samples represented by heat map using KEGG functional annotations; gradient colour scale shows over-represented (positive) and under-represented (negative) pathways in ALS; values scaled by row; significant pathways between groups with adjusted P < 0.05, by Wilcoxon test. BMI = body mass index.

