

Abstract
Objective:
Systemic sclerosis (SSc) is associated with several specific risk factors for fracture due to the complications of the disease and related medications. Here we sought to examine the relationship between SSc-associated clinical features and fracture rate in a large U.S. cohort.
Methods:
Participants with SSc in FORWARD, The National Databank for Rheumatic Diseases, were included (1998 to 2019). Age- and sex-matched individuals with osteoarthritis (OA) from the same database were included as comparators. The primary endpoint was self-reported major osteoporotic fracture. Cox proportional hazard models were used to study the associations between risk factors and fractures.
Results:
The study included 922 individuals, (SSc=154, OA=768). Eighty-seven percent were female, with a mean age of 57.8 years. Fifty-one patients developed at least one fracture during a median of 4.2 years (0.5-22 years) of follow-up. Patients with SSc had more frequent fractures compared to OA comparators [HR 2.38, 95% CI 1.47- 3.83)]. Among patients with SSc, a higher rheumatic disease comorbidity index [HR 1.45 (1.20 – 1.75)] and a higher Health Assessment Questionnaire Disability Index score (HR 3.83 (2.12 – 6.93)) were associated with more fractures. Diabetes [HR 5.89 (2.51-13.82)] and renal disease [HR 2.43 (1.10-5.37)] were independently associated with fracture among SSc patients, relative to SSc patients without these comorbidities.
Conclusions:
Our findings highlight factors associated with fracture among people with SSc. Disability as measured by HAQ-DI, is a particularly strong indicator of fracture rate in SSc. Improving SSc patients’ functional status where possible may lead to better long-term outcomes.
INTRODUCTION
Systemic sclerosis (SSc) is an autoimmune, connective tissue disease characterized by cutaneous fibrosis, progressive microvascular disease, and internal organ dysfunction. Prevention and management of SSc complications are important in minimizing progression to functional loss and disability, both of which negatively impact quality of life and survival [1, 2]. Notably, many SSc complications, (e.g., chronic systemic inflammation, gastrointestinal (GI) malabsorption or malnutrition, low vitamin D levels and renal disease, and restricted physical activity due to contractures and/or weakness) are potential risk factors for osteoporosis and fracture [3, 4]. In addition, several of the medications used to treat manifestations of SSc, such as proton pump inhibitors (PPIs), glucocorticoids, selective serotonin reuptake inhibitors (SSRIs), opioids, and non-steroidal anti-inflammatory drugs (NSAIDs) may also contribute to risk and/or rate of fracture [5–9]. As a result, patients with SSc may have more fractures secondary to both disease-specific complications and exposure to medications used to manage multisystem dysfunction [10].
While a study of patients from France found that SSc is associated with an increased risk of osteoporosis and fracture compared to the general population [4], the risk of fracture in patients with SSc in the U.S., and the relative impact that specific SSc-related comorbidities and other clinical features may have in these patients, remains unclear. Furthermore, the identification of modifiable risk factors for fracture could improve patient quality of life, while secondarily addressing the economic burden associated with osteoporotic fractures [11]. Therefore, the aim of this study was to examine the relationship between clinical risk factors (e.g., medication use and clinical characteristics of SSc) and fractures in SSc patients in a large U.S. cohort (Figure 1) and determine how these factors compare to a group of patients with OA from the same cohort of similar age and sex, but without SSc.
Figure 1.
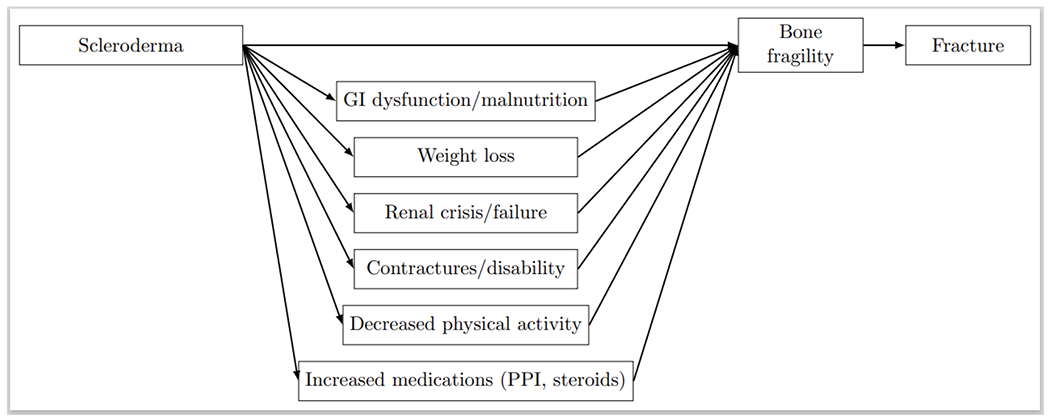
Causal diagram illustrating the relationships between scleroderma and its clinical features, bone fragility, and fracture.
PATIENTS AND METHODS
Patients
Patients were part of an observational study as participants in FORWARD, The National Databank for Rheumatic Diseases, (1998 to 2019). FORWARD is a longitudinal observational patient-driven database, founded as a non-profit research organization in 1998. A primary questionnaire is distributed to patients twice yearly. Over 50,000 patients with more than 100 rheumatic diseases followed by more than 1,500 rheumatologists have completed at least one 6-month questionnaire [12–14]. We hypothesized that patients with SSc would have a higher rate of fracture than OA comparators given their unique clinical characteristics. Patients with SSc and age- and gender-matched patients with physician-diagnosed osteoarthritis (OA) from the same registry were included as comparators. Age matching was done in decades. Though SSc and OA were matched 1:5 when possible (from a pool of about 1:25), the 20s age group did not have sufficient numbers for 1:5 matching, and additional participants with OA in their 30s were matched to compensate. As a result, there were no unmatched patients with SSc. Matching was done without replacement. All participants lived in the U.S. and completed ≥2 semiannual questionnaires. There were 162 (18%) participants (out of 922) with only two follow-up visits, and 305 (33%) with more than ten visits. The vast majority of participants (863 out of 922) responded to the survey at least yearly during the period when they were active. The average time between responses across all patients was 0.56 years, with a median of 0.51 years. Patients with OA were chosen as the control group since they were recruited through the same methods and do not generally share the risk factors for fractures that are enriched among patients with SSc (e.g., severe GI disease, renal disease, glucocorticoid therapy, chronic systemic inflammation, chronic high-dose PPI therapy). Patients diagnosed with both SSc and OA, or patients with either condition and concomitant rheumatic diseases (e.g., rheumatoid arthritis), were excluded. This study was approved by Ascension Via Christi Hospitals Wichita, Inc institutional review board.
Covariates
Our analysis considered a variety of covariates, detailed below, in the multivariable models. Demographic data including age, disease duration, sex, postmenopausal status, race, education, body mass index (BMI), and smoking status were obtained from enrollment and semiannual questionnaires. With the exception of sex and race, these factors were reported by patients at each questionnaire and so in general were varying over time for each patient, including BMI and PPI use.
Age (years) was examined as a categorical variable (20-50 years [referent], 51-64 years, ≥ 65 years). Age at first symptoms (years) was used to calculate disease duration (years) from the date of first symptom to the date of the questionnaire. Sex was defined as a dichotomous variable (male/female). Race and ethnicity, (i.e., White vs. Black vs. Asian or Pacific Islander; non-Hispanic vs. Hispanic) were defined as dichotomous variables (non-Hispanic White vs. other). Post-menopausal status was self-reported by the patient at the time of questionnaire completion. BMI was calculated and reported as both a numerical and categorical variable as described by WHO (kg/m2) (i.e., underweight less than 18.5, normal weight between 18.5 and 25, overweight between 25 and 30, and obese ≥30). Smoking history was studied as a dichotomous variable (past or current smoker vs. never smoker). Other demographic data included education (years) and health insurance (yes/no).
Patients were asked about medical histories. If specific items in the medical history were unanswered by patients they were assumed missing. Clinical data including Rheumatic Disease Comorbidity Index (0-9) [15], HAQ-DI (0-3) [16], diabetes, renal disease, osteoporosis, Fracture Risk Assessment (FRAX) score estimating the probability of major osteoporotic fracture (MOF) or hip fracture within the next 10-years [17], GI disorder, GI scale (0-100), and history of GI symptoms (Table 1) were obtained using self-reported questionnaires. Diabetes was defined as ever having received a diagnosis of type 1 diabetes or type 2 diabetes (yes/no). Renal disease was defined as any history of or treatment for renal or kidney failure, reduced kidney function or elevated creatinine, and/or clinician diagnosed hematuria or proteinuria (yes/no). Osteoporosis was defined as having ever received a diagnosis of osteoporosis from a provider (yes/no). Gastrointestinal disorder was defined as “any history of GI disorder” (yes/no), and included liver disease, gallbladder disease, ulcers, and other stomach problems. Specific GI symptoms included irritable bowel syndrome, indigestion, vomiting, constipation, loss of appetite or peptic ulcer disease. GI scale (0-100), as defined in a previous study, utilized a visual analogue scale (VAS) to assess patient-reported GI symptom severity. A score of 0 indicated that a patient perceived no stomach problems while a score of 100 indicated severe stomach problems in the past week. SSc was defined as having ever received a diagnosis of SSc (yes/no).
Table 1.
Baseline demographic and clinical characteristics of patients with systemic sclerosis and age- and sex-matched osteoarthritis (n=922)
| Patients with Systemic sclerosis (n=154) | Patients with Osteoarthritis (n=768) | P value † | |||||
|---|---|---|---|---|---|---|---|
|
|
|||||||
| Clinical Feature | N | Mean or % | SD | N | Mean or % | SD | |
| Female, % | 154 | 87 | 768 | 87 | 0.991 | ||
| Age, years | 154 | 57.4 | 12.6 | 768 | 57.9 | 11.8 | 0.663 |
| Age distribution, % | 154 | 768 | 0.586 | ||||
| 20-50 | 25.3 | 23.8 | |||||
| 51-64 | 46.1 | 45.3 | |||||
| ≥ 65 | 28.6 | 30.9 | |||||
| Age at diagnosis | 144 | 44.8 | 15.3 | 679 | 45.8 | 13.3 | 0.358 |
| Non-Hispanic White, % | 145 | 81.8 | 730 | 84 | 0.507 | ||
| Post-menopause status, % | 134 | 82.8 | 668 | 79.8 | 0.412 | ||
| Ever smoker, % | 154 | 47.4 | 767 | 42.9 | 0.303 | ||
| Disease duration, years | 144 | 12.4 | 10.7 | 679 | 11.7 | 10.2 | 0.518 |
| BMI, kg/m2 | 143 | 27.8 | 6.2 | 693 | 30.8 | 7.6 | < 0.001 |
| BMI Categories, % | 143 | 693 | < 0.001 | ||||
| Underweight, < 18.5 | 3.25 | 0.91 | |||||
| Normal weight, 18.5 – 25 | 33.8 | 21.1 | |||||
| Overweight, 25-30 | 29.9 | 28.5 | |||||
| Obese, >30 | 33.1 | 49.6 | |||||
| Health Insurance, % | 142 | 96.5 | 678 | 96.2 | 0.796 | ||
| Education, years | 154 | 14 | 2.6 | 768 | 14.2 | 2.4 | 0.618 |
| RDCI (0-9) | 153 | 2.4 | 1.8 | 766 | 1.8 | 1.5 | <0.001 |
| HAQ-DI (0-3) | 146 | 0.9 | 0.6 | 709 | 0.8 | 0.3 | 0.140 |
| Diabetes, % | 153 | 5.2 | 766 | 12.9 | 0.007 | ||
| Renal disease, % | 153 | 16.2 | 766 | 8.0 | 0.004 | ||
| Osteoporosis, % | 154 | 0.6 | 768 | 0.4 | 0.656 | ||
| FRAX MOF score (0-100) | 151 | 8.3 | 6.8 | 752 | 7.0 | 5.2 | 0.046 |
| FRAX hip score (0-100) | 151 | 2.3 | 4.4 | 752 | 1.5 | 2.6 | 0.027 |
| PPI use, % | 144 | 66 | 386 | 27.7 | < 0.001 | ||
| Glucocorticoid use ‡, % | 59 | 291 | < 0.001 | ||||
| None | 77.0 | 93.4 | |||||
| Low. ≤ 7.5 mg/day | 18.2 | 3.9 | |||||
| Medium & High, > 7.5 mg/day | 4.7 | 2.7 | |||||
| SSRI use, % | 148 | 16.9 | 636 | 11.5 | 0.365 | ||
| Osteoporosis medication use, % | 154 | 18.2 | 768 | 27.2 | 0.020 | ||
| GI disorder, % | 153 | 54.6 | 766 | 41.4 | 0.007 | ||
| GI scale (0-100) | 90 | 34.1 | 31.1 | 496 | 19.1 | 24.1 | < 0.001 |
| History of diarrhea | 146 | 28.8 | 722 | 15.8 | < 0.001 | ||
| History of IBS | 139 | 16.5 | 388 | 17.0 | 1.000 | ||
| History of indigestion | 146 | 43.8 | 722 | 30.3 | 0.002 | ||
| History of vomiting | 146 | 14.4 | 720 | 4.2 | < 0.001 | ||
| History of constipation | 146 | 30.8 | 722 | 24.0 | 0.094 | ||
| History of loss of appetite | 147 | 19.7 | 720 | 10.3 | 0.003 | ||
| History of PUD | 146 | 33.6 | 723 | 21.0 | 0.003 | ||
BMI, body mass index; FRAX, Fracture Risk Assessment Tool; GI, Gastrointestinal; HAQ-DI, Health Assessment Questionnaire Disability Index; IBS, irritable bowel syndrome; MOF, major osteoporotic fracture; OP, osteoporosis; PPIs, proton pump inhibitors; PUD, peptic ulcer disease; RDCI, Rheumatic Disease Comorbidity Index; SD, standard deviation; SSRIs, selective serotonin reuptake inhibitors.
Determined by Wilcoxon rank sum for continuous factors, Kruskal Wallis for categorical factors, and Chi-Square or Fisher’s exact for binary factors, where appropriate.
As prednisone does equivalents.
Medication exposure
Medication exposure was recorded at study enrollment and at 6-month intervals using questionnaires. Exposure to PPIs was examined in time-varying doses [omeprazole equivalents and using the following duration-combined categories: not-using (reference), low-dose PPI (20 mg omeprazole-equivalents or less per day), and high-dose PPI (more than 20 mg omeprazole-equivalents per day)]. Cumulative exposure to PPIs was also assessed and was defined as the number of previous surveys where the participants indicated any use of PPI. It was measured using total omeprazole-equivalents in grams of PPI taken during follow up, and was categorized as either “low dose” (<=20mg) or “high dose” (>20 mg).
All medications were time-varying, as participants were queried about their medication use at each follow-up. Glucocorticoid exposure was examined in terms of prednisone-equivalents, using the following categories: no use (reference), low-dose (≤ 7.5 mg/day), and medium-high dose (> 7.5 mg/day). Other medication exposures including patient use of any osteoporosis medication(s), SSRIs, estrogen, opioid analgesia (weak or strong), nonopioid analgesia and/ or anticonvulsant(s) were defined as dichotomous variables (yes/no).
Measures of disease severity and quality of life
Fracture Risk Assessment Tool (FRAX)
Fracture Risk Assessment was determined by modified FRAX score as previously described in the FRAX tool (FRAX) (V.4.1) (http://www.shef.ac.uk/FRAX) [17]. The FRAX tool utilizes clinical risk factors for fracture to estimate the 10-year probability of major osteoporotic fracture or hip fracture incidence. Our FRAX score calculation was modified for the lack of available bone mineral density (BMD) data and unknown familial history of hip fracture as detailed in the referenced prior study [18].
Health Assessment Questionnaire-Disability Index (HAQ-DI)
We utilized a validated self-administered questionnaire [16], which had patients quantify difficulty in performing activities of daily living (ADLs) over the previous week. Physical disability was assessed across 8 components: dressing and grooming, arising, eating, walking, hygiene, reach, grip, and activity. Questionnaires included 2 to 3 questions per component for a total of 20 questions specifically addressing ADLs. Patient response to each question was scored from 0 to 3 [(a) score 0 = without any difficulty; (b) score 1= with some difficulty; (c) score 2= with much difficulty; (d) score 3= unable to do)]. The question with the highest score determined the component score (0 - 3). The Disability Index (DI) was calculated by dividing the total of the component scores by the number of components assessed. HAQ-DI scores range from 0 to 3 with a higher score representing more severe disability (score 0 = no impairment in function/ disability; 3 = maximal impairment in function/ disability).
Rheumatic Disease Comorbidity Index (RDCI)
We used patient-reported data to evaluate the burden of comorbidity across eleven comorbid conditions outlined in previous studies [19, 20]. Conditions included ulcer or stomach problem, hypertension, myocardial infarction, other cardiovascular disease (e.g., heart failure), lung disease, diabetes, depression, cancer, stroke, and fracture (i.e., spine, hip, or leg). The index was calculated based on the presence and severity of co-existing comorbid conditions with impact assessed using 6 outcomes which were weighted as described in previous studies [15, 19]. RDCI ranges from 0 to 9, and assesses quality of life and the anticipated effects of comorbidities on functional disability and mortality. A higher RDCI is predictive of increased physical disability and mortality [15].
Outcomes
The primary outcome was major osteoporotic fracture (i.e., hip which can include pelvis and/or femur, humerus, clinical spine and wrist) [21] among patients with SSc and OA. Fractures of the skull, hands, feet, fingers, and toes [21] were excluded. First fracture during the follow-up period and all subsequent fractures were included in the analysis, such that some participants experienced multiple fractures during follow-up, all of which were incorporated in the analysis. Follow-up time commenced at cohort entry and continued until censoring at death, loss to follow-up, or until August 2019.
Statistical analysis
Baseline characteristics were compared between patients with SSc and OA comparators. We also used responses from the baseline survey to estimate associations with rate of fracture. We included all fractures over the study period. Non-parametric Wilcoxon rank sum tests and Pearson’s Chi-squared tests or Fisher’s exact tests were used to compare continuous and discrete variables respectively. Bivariate/unadjusted and multivariable Cox proportional hazard models were used to investigate the risk factors for fractures or osteoporosis in the SSc and control groups. We examined raw unadjusted associations using Cox proportional hazards for the rate of fractures separately among those with SSc and those with OA as well as in SSc and OA combined. For characteristics that were related to the rate of fracture in either SSc or OA or the combined group at a significance of 0.05, we also examined the association with Cox proportional hazards adjusted for age and BMI. In sensitivity analysis, we adjusted for smoking in addition to age and sex. We replaced the missing baseline values of BMI (missing for n=86, 9%) and glucocorticoid use (missing for n= 572, 62%), and with multiple imputations by chained equations to create multiple-imputed datasets for analysis [22]. We did the same for diabetes (yes/no), PPI use (any versus none), and renal disease. All tests were two-sided and considered statistically significant when p<0.05. All statistical analyses were performed using Stata V.16.0 (Stata, College, Texas, USA).
RESULTS
Clinical characteristics of SSc and OA patients
The study included 922 patients, 154 with SSc and 768 OA comparators. Fifty-one patients developed at least one fracture during a median of 4.2 years of follow-up, with a total of 82 fractures occurring. Of these 82, 55 fractures occurred in the OA patients, while 27 fractures occurred among those with scleroderma. Clinical features of the SSc and OA participants including age, disease duration, sex, post-menopausal status, BMI, RDCI, HAQ-DI scores, FRAX scores and history of diabetes, renal disease, osteoporosis, and GI disease are compared in Table 1. SSc patients had a significantly lower BMI compared to OA comparators (27.8 vs. 30.8; p<0.001). As expected, patients with SSc also had more comorbidities when compared to OA comparators (Table 1). SSc patients had higher RDCI (2.4 vs. 1.8; p<0.001), slightly higher FRAX MOF scores (8.3 % vs.7.0 %; p=0.046) and FRAX hip scores (2.3 vs. 1.5; p=0.027) when compared to OA comparators [FRAX MOF: Moderate risk 10- <20%, high risk >=20, low risk <10; FRAX hip: High risk >= 3%, moderate risk >=2 to <3%]. However, there was no significant difference in baseline HAQ-DI scores (0.9 vs. 0.8; p=0.140) between SSc and OA comparators. Both groups also had similar prevalence of preexisting osteoporosis (0.6% vs 0.4%; p=0.656).
Compared to OA comparators, patients with SSc had a lower prevalence of diabetes (5.2% vs. 12.9%; p=0.007) but were more likely to have a history of renal disease (16.2% vs 8.0%; p=0.004) and GI disorders (54.6% vs. 41.4%; p=0.007). Within GI disease, patients with SSc reported having more GI symptoms (Table 1), including diarrhea (28.8 vs. 15.8; p<0.001), indigestion (43.8 vs. 30.3; p=0.002), vomiting (14.4 vs. 4.2; p<0.001), loss of appetite (19.7 vs. 10.3; p=0.003) and peptic ulcer disease (33.6 vs. 21.0; p=0.003).
Univariate regression analysis
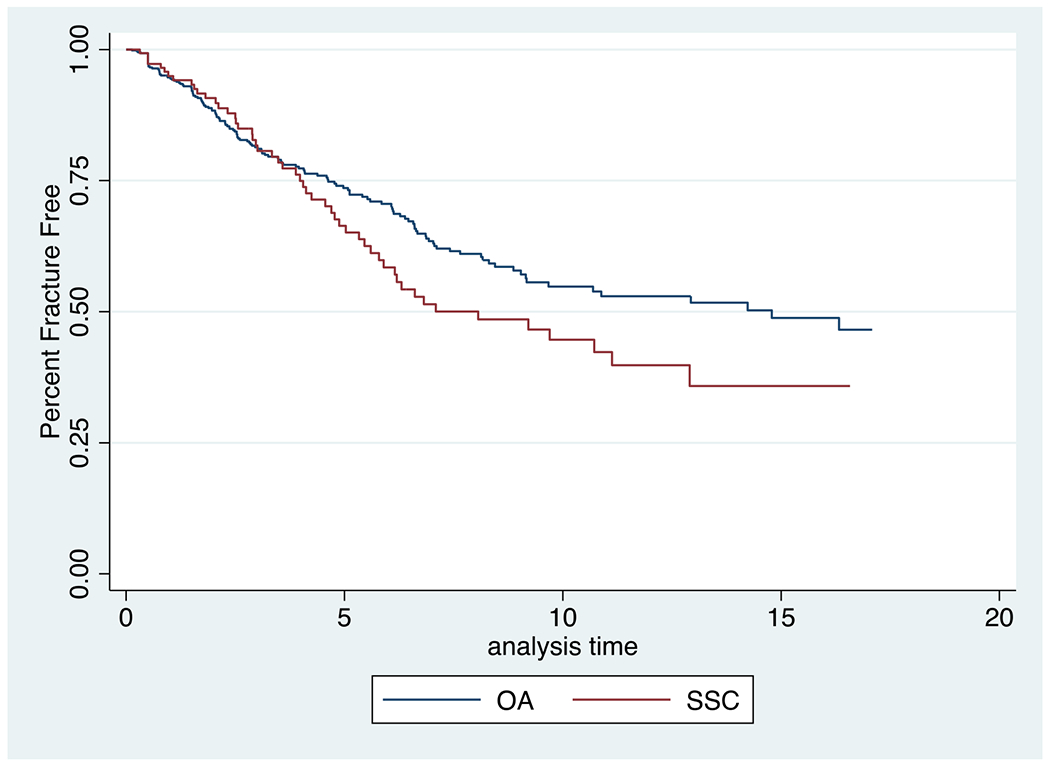
We then sought to measure the strength of the association between distinct clinical factors and fractures in patients with SSc and OA comparators. We examined associations among SSc and OA comparators combined, as well as only among SSc patients, and only among OA comparators. In the univariate analysis (Table 2), among the cohort of SSc and OA comparators, we found that patients with SSc were 2.27 times more likely to have fractures relative to OA comparators [HR 2.27 (1.43 to 3.61)] (Figure 2). No significant differences in association of demographic characteristics with fracture occurrence between patients with SSc and OA comparators were identified (Table 2).
Table 2.
Univariate risk factor analysis of fractures in patients with systemic sclerosis and osteoarthritis
| Variable | Unadjusted Hazard Ratio (95% CI) | P value | Unadjusted Hazard Ratio (95% CI) | P value | Unadjusted Hazard Ratio (95% CI) | P value |
|---|---|---|---|---|---|---|
|
| ||||||
| Whole Cohort (n=922) | Scleroderma Patients Only (n=154) | Osteoarthritis Patients Only (n=768) | ||||
| Demographics | ||||||
| Scleroderma | 2.27 (1.43, 3.61) | 0.001 | - | - | - | - |
| Female | 2.39 (0.97, 5.92) | 0.059 | * | * | 1.48 (0.59, 3.71) | 0.404 |
| Age categories | ||||||
| 20-50 years | Ref | Ref | Ref | |||
| 51-64 years | 1.25 (0.51, 3.06) | 0.626 | * | * | 0.56 (0.21, 1.52) | 0.256 |
| ≥ 65 years | 1.81 (0.76, 4.30) | 0.177 | * | * | 1.17 (0.48, 2.86) | 0.735 |
| Non-Hispanic White | 1.98 (0.72, 5.43) | 0.184 | * | * | 1.25 (0.45, 3.47) | 0.672 |
| Postmenopausal status (vs women only) | 3.63 (0.89, 14.87) | 0.073 | * | * | 2.36 (0.57, 9.78) | 0.237 |
| Ever smoker | 1.37 (0.88, 2.12) | 0.165 | 1.98 (0.92, 4.28) | 0.083 | 1.00 (0.58, 1.74) | 0.999 |
| Disease duration, years | 1.01 (0.99, 1.03) | 0.379 | 1.00 (0.96, 1.05) | 0.862 | 1.01 (0.99, 1.04) | 0.297 |
| BMI categories, kg/m2 | ||||||
| Underweight, <18.5 | 1.33 (0.39, 4.55) | 0.646 | 1.21 (0.26, 5.57) | 0.808 | 0.97 (0.12, 7.74) | 0.976 |
| Normal weight,18.5 - 25 | Ref | Ref | Ref | |||
| Overweight, 25-30 | 1.04 (0.59, 1.83) | 0.884 | 0.52 (0.18, 1.50) | 0.227 | 1.55 (0.75, 3.20) | 0.237 |
| Obese, >30 | 0.78 (0.45, 1.36) | 0.386 | 0.77 (0.32, 1.87) | 0.565 | 0.95 (0.46, 1.98) | 0.899 |
| Comorbidities | ||||||
| RDCI | 1.32 (1.17, 1.48) | < 0.001 | 1.38 (1.15, 1.66) | 0.001 | 1.21 (1.03, 1.43) | 0.018 |
| HAQ-DI | 2.56 (1.84, 3.55) | < 0.001 | 3.16 (1.84, 5.41) | < 0.001 | 2.07 (1.38, 3.12) | < 0.001 |
| Diabetes | 1.73 (1.08, 2.78) | 0.024 | 5.10 (2.29, 11.37) | <0.001 | 1.29 (0.71, 2.34) | 0.406 |
| Renal disease | 1.46 (0.90, 2.37) | 0.121 | 2.32 (1.07, 5.00) | 0.032 | 1.02 (0.53, 1.95) | 0.952 |
| GI disorder | 0.98 (0.61, 1.58) | 0.937 | 1.21 (0.48, 3.03) | 0.682 | 0.83 (0.47, 1.47) | 0.531 |
| GI scale (for 10-point increase) | 0.93 (0.79, 1.09) | 0.349 | 0.79 (0.56, 1.14) | 0.209 | 0.92 (0.76, 1.12) | 0.413 |
| Medications | ||||||
| PPIs | 1.56 (1.00, 2.43) | 0.050 | 0.45 (0.21, 0.99) | 0.046 | 2.00 (1.16, 3.46) | 0.013 |
| PPI cumulative dose † | 1.03 (0.99, 1.07) | 0.106 | 0.95 (0.88, 1.02) | 0.166 | 1.04 (0.99, 1.10) | 0.086 |
| Low dose (≤20 mg) | Ref | Ref | Ref | |||
| High dose (>20 mg) | 0.28 (0.03, 3.22) | 0.310 | * | * | 0.15 (0.01, 2.44) | 0.183 |
| Glucocorticoids | ||||||
| None | Ref | Ref | Ref | |||
| Low, ≤ 7.5 mg/day | 1.37 (0.59, 3.16) | 0.465 | 1.34 (0.53, 3.41) | 0.539 | * | * |
| Medium & High, > 7.5 mg/day | 4.50 (1.80, 11.25) | 0.001 | 2.55 (0.58, 11.19) | 0.215 | 5.03 (1.55, 16.36) | 0.007 |
| Osteoporosis medications | 0.60 (0.08, 4.29) | 0.607 | 0.78 (0.10, 5.79) | 0.804 | * | * |
| SSRIs | 1.23 (0.69, 2.20) | 0.482 | 0.77 (0.18, 3.37) | 0.728 | 1.54 (0.81, 2.94) | 0.190 |
| Estrogen | 0.64 (0.33, 1.24) | 0.181 | 0.27 (0.04, 2.02) | 0.204 | 0.89 (0.43, 1.82) | 0.741 |
| Opioid analgesia | 1.46 (0.92, 2.32) | 0.106 | 0.52 (0.18, 1.52) | 0.232 | 2.11 (1.23, 3.61) | 0.006 |
| Nonopioid analgesia ‡ | 0.60 (0.39, 0.92) | 0.020 | 0.76 (0.34, 1.70) | 0.509 | 0.65 (0.38, 1.11) | 0.113 |
| Anticonvulsants | 0.96 (0.52, 1.79) | 0.908 | 0.92 (0.32, 2.67) | 0.875 | 0.92 (0.43, 1.95) | 0.823 |
BMI, body mass index; GI, Gastrointestinal; HAQ-DI, Health Assessment Questionnaire Disability Index; PPIs, proton pump inhibitors; RDCI, Rheumatic Disease Comorbidity Index; SSRIs, selective serotonin reuptake inhibitors.
As omeprazole dose equivalents, in grams; cumulative PPI use was defined as the number of previous surveys where the participants indicated any use of PPI
Nonsteroidal anti-inflammatory drugs (NSAIDs) and cyclo-oxygenase-2 (COX-2) inhibitors
Not estimable due to low number of fractures within one or more categories.
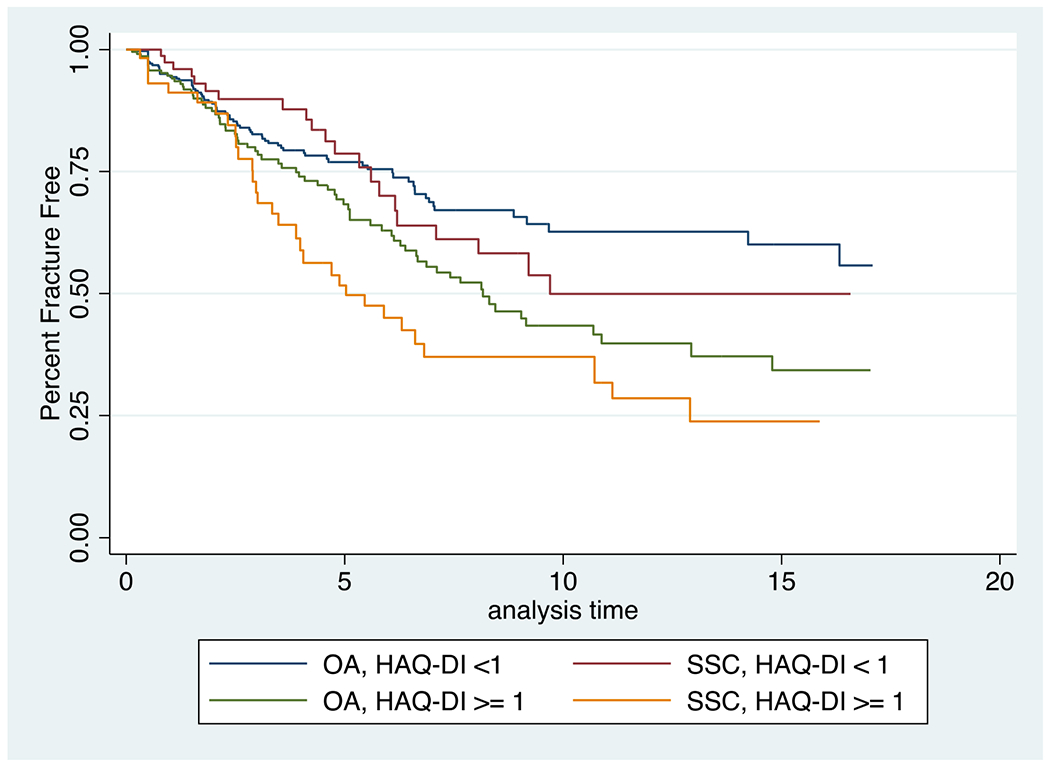
Figure 2.
Kaplan-Meier estimates for the percent fracture free over the duration of the study (years), by HAQ-DI and for systemic sclerosis (SSC) and osteoarthritis (OA) patients
Patients with more comorbidities tended to have more fractures. Among patients with SSc, a higher RDCI, a higher HAQ-DI score (Figure 3), and the presence of diabetes, and the presence of renal disease were all associated with more fractures (Table 2). Among patients with SSc, a 1-point increase in Rheumatic Disease Comorbidity Index was associated with 38% increased rate of fracture [HR1.38 (1.15 to 1.66)], while a 1-point increase in HAQ-DI score was associated with a substantially increased risk of fractures [HR 3.16 (1.84 to 5.41)]. An even greater rate for fracture was seen in patients with both SSc and diabetes. These patients had significantly more fractures when compared to SSc patients without diabetes [HR 5.10 (2.29 to 11.37)]. Interestingly, among OA comparators, there was no significant difference in fractures between those with and without diabetes. A similar finding was observed when evaluating renal disease as a possible risk factor for fracture in patients with SSc and OA comparators. While no significant difference in the rate of fracture was seen in OA comparators when comparing those with and without renal disease, patients with SSc and renal disease had more fractures compared to SSc patients without renal disease [HR 2.32 (1.07 to 5.00)].
Figure 3.
Kaplan-Meier estimates for the percent fracture free over the duration of the study (years), for systemic sclerosis (SSC) and osteoarthritis (OA) patients
Among SSc patients, those taking PPIs had 55% lower rate of fracture [HR 0.45 (0.21 to 0.99)] when compared to SSc patients not on PPIs. Interestingly, this contrasts with the increase in fractures observed among OA comparators on PPIs compared to those not taking PPIs [HR 2.00 (1.16 to 3.46)]. However, there was no significant association with rate of fracture, when considering PPI cumulative dose in both SSc patients and OA comparators (Table 2).
The use of glucocorticoids, osteoporosis medications, SSRIs, estrogen, anticonvulsants, opioid analgesia, or non-opioid analgesia were not significantly associated with rate of fracture among patients with SSc (Table 2). However, among OA comparators, those taking opioid analgesia had more fractures than those not taking opioid analgesia [HR 2.11 (1.23 to 3.61)] and OA comparators on medium and high dose glucocorticoids had more fractures than OA comparators not on these medications [HR 5.03 (1.55 to 16.36)].
Multivariable regression analysis
We then sought to determine whether the associations between clinical features and fracture from the univariable analyses remained after adjusting for clinically relevant covariates and potential confounders. In the multivariable model, we adjusted for age and BMI, and then re-examined the associations between fracture and each of the following variables: sex, scleroderma, GI disease, diabetes, renal disease, medication use, RDCI, and HAQ-DI score (Table 3). We determined that patients with SSc were more likely to have fracture relative to OA comparators [HR 2.38 (1.47 to 3.83)]. Furthermore, among patients with SSc, the associations between a significantly higher rate of fracture in patients with SSc and a higher RDCI, higher HAQ-DI score, and/or the presence of diabetes and renal disease from the unadjusted analysis (Table 2) remained significant in the multivariable analyses (Table 3). In the patients with SSc, a 1-point increase in their RDCI was associated with a 45% increased rate for fracture [HR 1.45 (1.20 to 1.75)] and a 1-point increase in HAQ-DI score was associated with an almost 3-fold increased rate for fracture [HR 3.83 (2.12 to 6.93)]. In patients with SSc, those with diabetes were 5.89 times as likely to have a fracture than those without diabetes [HR 5.89 (2.51 to 13.82)] and those with renal disease were 2.43 times as likely to have fracture compared to SSc patients without renal disease [HR 2.43 (1.10 to 5.37)]. In a sensitivity analysis, we adjusted for smoking in addition to age and sex. We did not see any changes in the results for this sensitivity analysis (Supplemental Table).
Table 3.
Multivariable analysis evaluating risk of fracture in patients with systemic sclerosis and osteoarthritis. All associations were adjusted for age and BMI.
| Variable | Adjusted Hazard† Ratio (95% CI) | P value | Adjusted Hazard† Ratio (95% CI) | P value | Adjusted Hazard† Ratio (95% CI) | P value |
|---|---|---|---|---|---|---|
|
| ||||||
| Whole Cohort (n=922) | Scleroderma Patients Only (n=154) | Osteoarthritis Patients Only (n=768) | ||||
| Demographics | ||||||
| Scleroderma | 2.38 (1.47, 3.83) | <0.001 | - | - | - | - |
| Female | 2.57 (1.04, 6.38) | 0.042 | * | * | 1.69 (0.67, 4.27) | 0.268 |
| Non-Hispanic Caucasians | 1.99 (0.72, 5.49) | 0.184 | * | * | 1.32 (0.47, 3.73) | 0.594 |
| Ever smoked | 1.32 (0.85, 2.05) | 0.222 | 1.73 (0.79, 3.77) | 0.169 | 0.97 (0.56, 1.69) | 0.921 |
| Comorbidities | ||||||
| RDCI | 1.33 (1.18, 1.50) | <0.001 | 1.45 (1.20, 1.75) | <0.001 | 1.23 (1.04, 1.45) | 0.015 |
| HAQ-DI | 2.98 (2.12, 4.19) | <0.001 | 3.83 (2.12, 6.93) | <0.001 | 2.44 (1.58, 3.76) | < 0.001 |
| Gastrointestinal disorder | 1.02 (0.63, 1.65) | 0.930 | 1.38 (0.53, 3.58) | 0.508 | 0.87 (0.49, 1.54) | 0.638 |
| Diabetes | 1.92 (1.17, 3.16) | 0.010 | 5.89 (2.51, 13.82) | <0.001 | * | * |
| Renal disease | 1.43 (0.88, 2.32) | 0.146 | 2.43 (1.10, 5.37) | 0.029 | 1.00 (0.52, 1.92) | 0.996 |
| Medications | ||||||
| PPIs | 0.89 (0.33, 2.36) | 0.795 | 0.60 (0.21, 1.72) | 0.342 | 1.01 (0.26, 3.92) | 0.983 |
| PPI cumulative dose^ | 1.03 (0.99, 1.08) | 0.097 | 0.93 (0.86, 1.01) | 0.100 | 1.04 (0.99, 1.10) | 0.087 |
| Glucocorticoids | ||||||
| None | Ref | Ref | Ref | |||
| Low, ≤ 7.5 mg/day | 1.39 (0.60, 3.22) | 0.444 | 1.53 (0.57, 4.10) | 0.393 | * | * |
| Medium & High, > 7.5 mg/day | 4.71 (1.87, 11.86) | 0.001 | 2.73 (0.60, 12.41) | 0.194 | 5.07 (1.55, 16.63) | 0.007 |
| Estrogen | 0.61 (0.31, 1.20) | 0.152 | 0.25 (0.03, 1.91) | 0.183 | 0.95 (0.46, 1.98) | 0.897 |
| Opioid analgesia | 1.50 (0.94, 2.39) | 0.089 | 0.53 (0.17, 1.61) | 0.263 | 2.15 (1.24, 3.73) | 0.006 |
| Nonopioid analgesia | 0.60 (0.39, 0.93) | 0.023 | 0.77 (0.34, 1.76) | 0.539 | 0.67 (0.39, 1.14) | 0.140 |
HAQ-DI, Health Assessment Questionnaire Disability Index; PPIs, proton pump inhibitors; RDCI, Rheumatic Disease Comorbidity Index
Not estimable due to low number of fractures within one or more categories.
Adjusted for age and BMI in three categories.
Cumulative PPI use was defined as the number of previous surveys where the participants indicated any use of PPI
DISCUSSION
Our study is the first to examine the rate of fracture among patients with SSc in the U.S. by examining a large well-characterized sample of patients with rheumatic diseases. We observed a higher fracture rate in patients with SSc relative to OA comparators. We found that comorbidity burden and higher physical disability were strongly associated with a high fracture rate in both scleroderma and OA. Diabetes and renal disease were also determined to increase fracture rate in patients with SSc even after adjusting for age and BMI. After adjustment, significant disability and comorbidity burden were most strongly associated with fracture in patients with SSc.
Our finding that U.S. patients with SSc are subject to an elevated rate of osteoporotic fracture compared to OA comparators is consistent with previous studies globally [23–25]. For example, a French study by Avouac et. al found that osteoporotic fractures are more prevalent among patients with SSc compared to a healthy control population [4], and Lai et al., identified an almost 2 times higher rate for osteoporotic fracture in patients with SSc compared to the general population [24].
Another important result of our study is the finding that physical disability, a partially modifiable risk factor [26–29], is associated with a high fracture rate in patients with SSc. Musculoskeletal involvement such as joint contracture, myopathy, and arthritis are common features of SSc [30], which can lead to disability and impaired quality of life [1, 23, 31, 32]. Various local and global therapeutic rehabilitation programs (i.e., home exercises [29], manual lymphatic drainage [28], paraffin wax baths [33], connective tissue massage [34], joint manipulation [34], physical and occupational therapy [35, 36], and aerobic exercises [37]) were noted to improve the function of patients with SSc. Specifically, improvements in mobility, flexibility, skin elasticity, aerobic capacity, muscle endurance and decreased edema and stiffness were reported. Interventions targeting hand and upper extremity function may also reduce disability in SSc, and self-stretching programs may improve grip strength [38]. Furthermore, home-based physical exercise regimens were also shown to decrease disability and improve biceps and quadriceps strength [29]. As our study is the first to determine that high HAQ-DI scores are strongly associated with high rate for fracture in patients with SSc, the timing and application of these interventions in high-risk patient subsets should be an important focus of future studies.
Our study also determined that a high comorbidity burden is an important risk factor for fracture in patients with SSc. Patients with high Rheumatic Disease Comorbidity Indices were more likely to have fractures when compared to patients with fewer comorbidities. These data provide additional insight to support the early recognition of SSc patients who have a high risk for fracture. Furthermore, it suggests that the early diagnosis and appropriate management of comorbidities in patients with SSc should be a priority, and that interventions, such as multidisciplinary rehabilitation (i.e., aimed to improve mobility and overall function) [39] may reduce long term fracture risk.
To our knowledge, this is the first study to determine that diabetes is an independent risk factor for fracture in patients with SSc. Prior studies in the general population reported a 2 to 5 times higher risk for fracture in patients with diabetes when compared to those without diabetes [40] and an association between worse fracture outcomes in patients with diabetes when compared to normoglycemic individuals [41]. Given the morbidity, mortality, and economic burden associated with fracture, our finding that diabetes is a risk factor for fracture in patients with SSc warrants further study. Our ability to provide more specific recommendations for risk stratifying SSc patients with diabetes is limited due to lack of data on the severity of diabetes and glycemic control within these participants.
Renal disease is associated with an increased rate of fracture when compared to patients without renal disease in the general population [range HR 1.16 (1.01-1.33) to HR 5.04 (1.38-18.45)] [42–44]. However, previous studies examining risk factors for fracture in patients with SSc have failed to consider or excluded patients with comorbid renal disease [45]. Our study found that patients with SSc and renal disease were significantly more likely to have fracture compared to SSc patients without renal disease [HR 2.43 (1.10 to 5.37)]. This finding is consistent with increased risk for fracture observed among patients with renal disease in the general population [42]. As a result, particular attention should be directed towards monitoring and preventing bone loss in SSc-associated renal disease as an increased risk for fracture exists among these patients.
Interestingly, we found that patients with SSc who take PPIs had a lower rate of fracture when compared to SSc patients not on PPIs. This finding contrasts the association between PPI use and increased fracture risk reported in the general population [8, 46]. However, previous studies have not yet established a causative link between PPI use and fracture. Additional, large, prospective studies are needed to clarify the true risk of PPI use on fracture in the general population and in patients with other conditions such as SSc. We would also recommend interpreting this association with caution as methodological imputations were utilized for missing values on PPI use in a third of our patients.
Our study has several strengths. This is the first study to examine the rate of fracture among patients with SSc in the United States. The FORWARD study includes well-characterized patients with SSc and a built-in comparator group of age and sex-matched OA patients. Importantly, the OA comparators were not significantly distinct from patients with SSc in terms of demographic characteristics, and lacked many of the risk factors for fractures that are enriched among patients with SSc. Additionally, we included and adjusted for age and BMI in patients with SSc to limit possible confounding or unmeasured risk factors not addressed in previous studies. With regards to limitations, fractures were self-reported therefore a possibility exists for selection bias and underreporting events. We did not adjust for the history of fracture before study enrollment as this data was not available to us. Although we had a large sample of well-defined patients, the number of SSc patients and patients with fracture(s) was relatively small, likely limiting our power to identify other important associations. Additionally, the patient questionnaire did not include information regarding the mechanism of fracture (i.e. low vs high energy trauma). Furthermore, given the small number of fractures the effect size may have also been overestimated. Given the matching in decades and the adjustment in very large categories, residual confounding by age is a possibility, and there is always potential for other confounding due to unmeasured factors. There is also the potential that matching skewed the OA population to slightly younger people overall. As disease severity or duration of diabetes or renal disease were not quantified among patients, it is difficult to make any specific recommendations for risk stratification within these subpopulations of affected patients with SSc. We also recognize that our sample was primarily composed of non-Hispanic Caucasian females. More studies are needed to identify if our findings are generalizable to other ethnic groups. Finally, our conclusions are limited in part by incomplete responses from participants (Supplemental Table).
CONCLUSION
Patients with SSc are at a high risk for fracture given their unique risk factors. Among patients with SSc, high comorbidity, high disability, diabetes, and renal disease appear to be independent risk factors for MOF. To our knowledge, this is the first paper to identify disability as a direct, partially modifiable risk factor for fracture in patients with SSc. Disability in SSc, as measured by HAQ-DI, is a particularly strong indicator of future rate of fracture. Routine screening for disability associated with SSc, and integrating interventions aimed at improving patients’ functional status may together lead to improved clinical outcomes in SSc. We therefore suggest that clinicians consider utilizing tools such as the RDCI and HAQ-DI in clinical assessments for the early identification of patients with SSc who are at increased risk for major osteoporotic fracture. Multidimensional therapeutic rehabilitation [36] should be targeted at improving mobility in these patients to limit risk of fracture and fracture-related morbidity and mortality. Future prospective studies are needed to further elucidate the appropriate timing and modalities that are most appropriate for specific patient subgroups.
Supplementary Material
Supplemental Table. Multivariable analysis evaluating risk of fracture in patients with systemic sclerosis and osteoarthritis
SIGNIFICANCE AND INNOVATIONS.
Patients living with systemic sclerosis in the U.S. are at a high risk of fractures given their unique risk factors
Functional disability is a strong, and potentially modifiable factor associated with rate of fracture in patients with systemic sclerosis
A high comorbidity burden is present among patients with fracture(s) and systemic sclerosis
Diabetes and renal disease are specific comorbidities that increase fracture rate in patients with systemic sclerosis
ACKNOWLEDGEMENTS
We thank Drs. Helena Johansson, Mattias Lorentzon, Nicholas C Harvey, Eugene V McCloskey, and John A Kanis for their contributions and expertise related to the FRAX score analysis.
Financial Support:
NIH/NIAMS K23 AR071473, Scleroderma Research Foundation, Rheumatology Research Foundation K23 Supplement, and Jerome L Greene Foundation to ZM.
Footnotes
Declarations of interest disclosures: None.
REFERENCES
- 1.Lóránd V, Czirják L, Minier T. Musculoskeletal involvement in systemic sclerosis. Presse Med. 2014;43(10 Pt 2):e315–328. doi: 10.1016/j.lpm.2014.03.027 [DOI] [PubMed] [Google Scholar]
- 2.Medsger TA, Rodnan GP, Moossy J, Vester JW. Skeletal muscle involvement in progressive systemic sclerosis (scleroderma). Arthritis Rheum. 1968;11(4):554–568. doi: 10.1002/art.1780110405 [DOI] [PubMed] [Google Scholar]
- 3.Loucks J, Pope JE. Osteoporosis in scleroderma. Semin Arthritis Rheum. 2005;34(4):678–682. doi: 10.1016/j.semarthrit.2004.08.006 [DOI] [PubMed] [Google Scholar]
- 4.Avouac J, Koumakis E, Toth E, et al. Increased risk of osteoporosis and fracture in women with systemic sclerosis: a comparative study with rheumatoid arthritis. Arthritis Care Res (Hoboken). 2012;64(12):1871–1878. doi: 10.1002/acr.21761 [DOI] [PubMed] [Google Scholar]
- 5.Bolton JM, Morin SN, Majumdar SR, et al. Association of Mental Disorders and Related Medication Use With Risk for Major Osteoporotic Fractures. JAMA Psychiatry. 2017;74(6):641–648. doi: 10.1001/jamapsychiatry.2017.0449 [DOI] [PMC free article] [PubMed] [Google Scholar]
- 6.Ping F, Wang Y, Wang J, et al. Opioids increase hip fracture risk: a meta-analysis. J Bone Miner Metab. 2017;35(3):289–297. doi: 10.1007/s00774-016-0755-x [DOI] [PubMed] [Google Scholar]
- 7.Souverein PC, Webb DJ, Weil JG, Van Staa TP, Egberts ACG. Use of antiepileptic drugs and risk of fractures: case-control study among patients with epilepsy. Neurology. 2006;66(9):1318–1324. doi: 10.1212/01.wnl.0000210503.89488.88 [DOI] [PubMed] [Google Scholar]
- 8.Yx Y, Jd L, S E, Dc M. Long-term proton pump inhibitor therapy and risk of hip fracture. JAMA. 2006;296(24). doi: 10.1001/jama.296.24.2947 [DOI] [PubMed] [Google Scholar]
- 9.Vestergaard P, Hermann P, Jensen JEB, Eiken P, Mosekilde L. Effects of paracetamol, non-steroidal anti-inflammatory drugs, acetylsalicylic acid, and opioids on bone mineral density and risk of fracture: results of the Danish Osteoporosis Prevention Study (DOPS). Osteoporos Int. 2012;23(4):1255–1265. doi: 10.1007/s00198-011-1692-0 [DOI] [PubMed] [Google Scholar]
- 10.Gale SL, Trinh H, Mathew N, Jahreis A, Lin CJF, Sarsour K. Characterizing Disease Manifestations and Treatment Patterns Among Adults with Systemic Sclerosis: A Retrospective Analysis of a US Healthcare Claims Population. Rheumatol Ther. 2020;7(1):89–99. doi: 10.1007/s40744-019-00181-8 [DOI] [PMC free article] [PubMed] [Google Scholar]
- 11.Williams SA, Chastek B, Sundquist K, et al. Economic burden of osteoporotic fractures in US managed care enrollees. Am J Manag Care. 2020;26(5):e142–e149. doi: 10.37765/ajmc.2020.43156 [DOI] [PubMed] [Google Scholar]
- 12.Michaud K The National Data Bank for Rheumatic Diseases (NDB). Clin Exp Rheumatol. 2016;34(5 Suppl 101):S100–S101. [PubMed] [Google Scholar]
- 13.Wolfe F, Michaud K. A brief introduction to the National Data Bank for Rheumatic Diseases. Clin Exp Rheumatol. 2005;23(5 Suppl 39):S168–S171. [PubMed] [Google Scholar]
- 14.Wolfe F, Michaud K. The National Data Bank for rheumatic diseases: a multi-registry rheumatic disease data bank. Rheumatology (Oxford). 2011;50(1):16–24. doi: 10.1093/rheumatology/keq155 [DOI] [PubMed] [Google Scholar]
- 15.England BR, Sayles H, Mikuls TR, Johnson DS, Michaud K. Validation of the rheumatic disease comorbidity index. Arthritis Care Res (Hoboken). 2015;67(6):865–872. doi: 10.1002/acr.22456 [DOI] [PubMed] [Google Scholar]
- 16.Poole JL, Steen VD. The use of the Health Assessment Questionnaire (HAQ) to determine physical disability in systemic sclerosis. Arthritis Care Res. 1991;4(1):27–31. doi: 10.1002/art.1790040106 [DOI] [PubMed] [Google Scholar]
- 17.FRAX. WHO Fracture Risk Assessment Tool. Available: http://www.shef.ac.uk/FRAX [Google Scholar]
- 18.Ozen G, Pedro S, Wolfe F, Michaud K. Medications associated with fracture risk in patients with rheumatoid arthritis. Ann Rheum Dis. 2019;78(8):1041–1047. doi: 10.1136/annrheumdis-2019-215328 [DOI] [PubMed] [Google Scholar]
- 19.Huang YJ, Chen JS, Luo SF, Kuo CF. Comparison of Indexes to Measure Comorbidity Burden and Predict All-Cause Mortality in Rheumatoid Arthritis. J Clin Med. 2021;10(22):5460. doi: 10.3390/jcm10225460 [DOI] [PMC free article] [PubMed] [Google Scholar]
- 20.Wolfe F, Michaud K, Li T, Katz RS. Chronic conditions and health problems in rheumatic diseases: comparisons with rheumatoid arthritis, noninflammatory rheumatic disorders, systemic lupus erythematosus, and fibromyalgia. J Rheumatol. 2010;37(2):305–315. doi: 10.3899/jrheum.090781 [DOI] [PubMed] [Google Scholar]
- 21.Danila MI, Outman RC, Rahn EJ, et al. Evaluation of a Multimodal, Direct-to-Patient Educational Intervention Targeting Barriers to Osteoporosis Care: A Randomized Clinical Trial. J Bone Miner Res. 2018;33(5):763–772. doi: 10.1002/jbmr.3395 [DOI] [PMC free article] [PubMed] [Google Scholar]
- 22.Rubin DB. Multiple Imputation for Nonresponse in Surveys. In: Multiple Imputation for Nonresponse in Surveys. John Wiley & Sons, Ltd; 1987:i-xxix. doi: 10.1002/9780470316696.fmatter [DOI] [Google Scholar]
- 23.Avouac J, Walker U, Tyndall A, et al. Characteristics of joint involvement and relationships with systemic inflammation in systemic sclerosis: results from the EULAR Scleroderma Trial and Research Group (EUSTAR) database. J Rheumatol. 2010;37(7):1488–1501. doi: 10.3899/jrheum.091165 [DOI] [PubMed] [Google Scholar]
- 24.Lai CC, Wang SH, Chen WS, et al. Increased risk of osteoporotic fractures in patients with systemic sclerosis: a nationwide population-based study. Ann Rheum Dis. 2015;74(7):1347–1352. doi: 10.1136/annrheumdis-2013-204832 [DOI] [PubMed] [Google Scholar]
- 25.Omair MA, Pagnoux C, McDonald-Blumer H, Johnson SR. Low bone density in systemic sclerosis. A systematic review. J Rheumatol. 2013;40(11):1881–1890. doi: 10.3899/jrheum.130032 [DOI] [PubMed] [Google Scholar]
- 26.Mugii N, Hamaguchi Y, Maddali-Bongi S. Clinical significance and usefulness of rehabilitation for systemic sclerosis. Journal of Scleroderma and Related Disorders. 2018;3(1):71–80. doi: 10.1177/2397198317750043 [DOI] [PMC free article] [PubMed] [Google Scholar]
- 27.Schouffoer AA, Ninaber MK, Beaart-van de Voorde LJJ, et al. Randomized comparison of a multidisciplinary team care program with usual care in patients with systemic sclerosis. Arthritis Care Res (Hoboken). 2011;63(6):909–917. doi: 10.1002/acr.20448 [DOI] [PubMed] [Google Scholar]
- 28.Bongi SM, Del Rosso A, Passalacqua M, Miccio S, Cerinic MM. Manual lymph drainage improving upper extremity edema and hand function in patients with systemic sclerosis in edematous phase. Arthritis Care Res (Hoboken). 2011;63(8):1134–1141. doi: 10.1002/acr.20487 [DOI] [PubMed] [Google Scholar]
- 29.Filippetti M, Cazzoletti L, Zamboni F, et al. Effect of a tailored home‐based exercise program in patients with systemic sclerosis: A randomized controlled trial. Scand J Med Sci Sports. 2020;30(9):1675–1684. doi: 10.1111/sms.13702 [DOI] [PMC free article] [PubMed] [Google Scholar]
- 30.Sebastian MR, Eliana OC, Gerardo QL. Osteoarticular manifestations of systemic sclerosis: a systematic review of the literature. Revista Colombiana de Reumatología (English Edition). 2020;27:85–110. doi: 10.1016/j.rcreue.2020.01.001 [DOI] [Google Scholar]
- 31.Ouimet JM, Pope JE, Gutmanis I, Koval J. Work disability in scleroderma is greater than in rheumatoid arthritis and is predicted by high HAQ scores. Open Rheumatol J. 2008;2:44–52. doi: 10.2174/1874312900802010044 [DOI] [PMC free article] [PubMed] [Google Scholar]
- 32.Peytrignet S, Denton CP, Lunt M, et al. Disability, fatigue, pain and their associates in early diffuse cutaneous systemic sclerosis: the European Scleroderma Observational Study. Rheumatology (Oxford). 2018;57(2):370–381. doi: 10.1093/rheumatology/kex410 [DOI] [PMC free article] [PubMed] [Google Scholar]
- 33.Sandqvist G, Akesson A, Eklund M. Evaluation of paraffin bath treatment in patients with systemic sclerosis. Disabil Rehabil. 2004;26(16):981–987. doi: 10.1080/09638280410001702405 [DOI] [PubMed] [Google Scholar]
- 34.Bongi SM, Del Rosso A, Galluccio F, et al. Efficacy of connective tissue massage and Mc Mennell joint manipulation in the rehabilitative treatment of the hands in systemic sclerosis. Clin Rheumatol. 2009;28(10):1167–1173. doi: 10.1007/s10067-009-1216-x [DOI] [PubMed] [Google Scholar]
- 35.Murphy SL, Barber M, Huang S, Sabbagh M, Cutter G, Khanna D. Intensive and app-delivered occupational therapy to improve upper extremity function in early diffuse cutaneous systemic sclerosis: a pilot two-arm trial. Rheumatology (Oxford). 2021;60(11):5002–5011. doi: 10.1093/rheumatology/keab339 [DOI] [PMC free article] [PubMed] [Google Scholar]
- 36.Stefanantoni K, Sciarra I, Iannace N, et al. Occupational therapy integrated with a self-administered stretching program on systemic sclerosis patients with hand involvement. Clin Exp Rheumatol. 2016;34 Suppl 100(5):157–161. [PubMed] [Google Scholar]
- 37.Alexanderson H, Bergegård J, Björnådal L, Nordin A. Intensive aerobic and muscle endurance exercise in patients with systemic sclerosis: a pilot study. BMC Res Notes. 2014;7:86. doi: 10.1186/1756-0500-7-86 [DOI] [PMC free article] [PubMed] [Google Scholar]
- 38.Mugii N, Hasegawa M, Matsushita T, et al. The efficacy of self-administered stretching for finger joint motion in Japanese patients with systemic sclerosis. The Journal of Rheumatology. 2006;33(8):1586–1592. [PubMed] [Google Scholar]
- 39.Mouthon L, Poole J. Physical and occupational therapy. In: Varga J, Denton C, Wigley F, Allanore Y, Kuwana M, eds. Scleroderma. Springer; 2016:603–613. [Google Scholar]
- 40.Weber DR, Haynes K, Leonard MB, Willi SM, Denburg MR. Type 1 diabetes is associated with an increased risk of fracture across the life span: a population-based cohort study using The Health Improvement Network (THIN). Diabetes Care. 2015;38(10):1913–1920. doi: 10.2337/dc15-0783 [DOI] [PMC free article] [PubMed] [Google Scholar]
- 41.Sellmeyer DE, Civitelli R, Hofbauer LC, Khosla S, Lecka-Czernik B, Schwartz AV. Skeletal Metabolism, Fracture Risk, and Fracture Outcomes in Type 1 and Type 2 Diabetes. Diabetes. 2016;65(7):1757–1766. doi: 10.2337/db16-0063 [DOI] [PMC free article] [PubMed] [Google Scholar]
- 42.Nickolas TL, Leonard MB, Shane E. Chronic kidney disease and bone fracture: a growing concern. Kidney Int. 2008;74(6):721–731. doi: 10.1038/ki.2008.264 [DOI] [PMC free article] [PubMed] [Google Scholar]
- 43.Ensrud KE, Lui LY, Taylor BC, et al. Renal function and risk of hip and vertebral fractures in older women. Arch Intern Med. 2007;167(2):133–139. doi: 10.1001/archinte.167.2.133 [DOI] [PubMed] [Google Scholar]
- 44.Jamal SA, Bauer DC, Ensrud KE, et al. Alendronate treatment in women with normal to severely impaired renal function: an analysis of the fracture intervention trial. J Bone Miner Res. 2007;22(4):503–508. doi: 10.1359/jbmr.070112 [DOI] [PubMed] [Google Scholar]
- 45.Chuealee W, Foocharoen C, Mahakkanukrauh A, Suwannaroj S, Pongchaiyakul C, Nanagara R. Prevalence and predictive factors of osteoporosis in Thai systemic sclerosis. Sci Rep. 2021;11(1):9424. doi: 10.1038/s41598-021-88792-6 [DOI] [PMC free article] [PubMed] [Google Scholar]
- 46.Poly TN, Islam MM, Yang HC, Wu CC, Li YC(J). Proton pump inhibitors and risk of hip fracture: a meta-analysis of observational studies. Osteoporos Int. 2019;30(1):103–114. doi: 10.1007/s00198-018-4788-y [DOI] [PubMed] [Google Scholar]
Associated Data
This section collects any data citations, data availability statements, or supplementary materials included in this article.
Supplementary Materials
Supplemental Table. Multivariable analysis evaluating risk of fracture in patients with systemic sclerosis and osteoarthritis