

Abstract
Background
With cancer-associated fibroblasts (CAFs) as the main cell type, the rich myxoid stromal components in chordoma tissues may likely contribute to its development and progression.
Methods
Single-cell RNA sequencing (scRNA-seq), spatial transcriptomics, bulk RNA-seq, and multiplexed quantitative immunofluorescence (QIF) were used to dissect the heterogeneity, spatial distribution, and clinical implication of CAFs in chordoma.
Results
We sequenced here 72 097 single cells from 3 primary and 3 recurrent tumor samples, as well as 3 nucleus pulposus samples as controls using scRNA-seq. We identified a unique cluster of CAF in recurrent tumors that highly expressed hypoxic genes and was functionally enriched in endoplasmic reticulum stress (ERS). Pseudotime trajectory and cell communication analyses showed that this ERS-CAF subpopulation originated from normal fibroblasts and widely interacted with tumoral and immune cells. Analyzing the bulk RNA-seq data from 126 patients, we found that the ERS-CAF signature score was associated with the invasion and poor prognosis of chordoma. By integrating the results of scRNA-seq with spatial transcriptomics, we demonstrated the existence of ERS-CAF in chordoma tissues and revealed that this CAF subtype displayed the most proximity to its surrounding tumor cells. In subsequent QIF validation involving 105 additional patients, we confirmed that ERS-CAF was abundant in the chordoma microenvironment and located close to tumor cells. Furthermore, both ERS-CAF density and its distance to tumor cells were correlated with tumor malignant phenotype and adverse patient outcomes.
Conclusions
These findings depict the CAF landscape for chordoma and may provide insights into the development of novel treatment approaches.
Keywords: chordoma progression, cancer-associated fibroblasts, endoplasmic reticulum stress, scRNA-seq, spatial transcriptomics
Key Points.
ERS-CAF subpopulation played a crucial role in chordoma progression.
ERS-CAF promoted chordoma progression possibly via direct crosstalk with tumor cells.
Importance of the Study.
The rich mucinous stroma in chordoma may likely contribute to its development and progression. Cancer-associated fibroblasts (CAFs) constitute the main cell type in the stromal compartment, but their influence on chordoma biology remains undetermined. Using single-cell RNA sequencing, we here identified a unique cluster of CAF in recurrent chordomas that highly expressed hypoxic genes and was functionally enriched in endoplasmic reticulum stress (ERS). The spatial transcriptomics data confirmed the existence of ERS-CAFs subtype and revealed that this cluster displayed the highest probability of proximity to its surrounding tumor cells. Further bulk RNA-seq (n = 126) and multiplexed quantitative immunofluorescence (n = 105) data validated that the ERS-CAF subtype significantly influenced tumor phenotype and patient survival. Importantly, both ERS-CAF density and its distance to tumor cells in immunofluorescence analyses were correlated with tumor features and clinical outcomes. These data suggest that targeting ERS-CAF may be an effective approach to treat chordoma.
Considered to arise from remnants of the primitive notochord, chordoma is a rare and locally aggressive mesenchymal neoplasm.1 Chordoma has an annual incidence of approximately 0.8 per million and preferentially occurs in the sacrum and skull base regions.2 Chordoma is not sensitive to traditional chemotherapy and the current optimal treatment is initial maximal surgical resection with adjuvant radiation therapy, which provides the best clinical outcome for patients.3 However, due to the infiltrative nature and proximity to key neurovascular structures, radical resection of the tumors is challenging. Therefore, many patients suffer from local tumor recurrence or even metastases after surgery, leading to adverse quality of life and long-term survival.4 Given this dismal fact, it is highly urgent to uncover the molecular biology and thus develop more effective treatment approaches for this disease.
Cancer-associated fibroblasts (CAFs) constitute the main cell type in the stromal compartment, accounting for more than 50% of stromal cells.5 Unlike normal fibroblasts, CAFs are activated in malignant tumors and harbor high expression of α-smooth muscle actin (αSMA) and fibroblast activating protein (FAP).6 Recent studies have demonstrated that the density of CAFs is positively associated with invasion, metastasis, and poor prognosis of many malignant tumors.7 Similarly, our previous work has disclosed that stromal components in chordoma are closely related to tumor invasive phenotype, poor patient survival, and inhibitory immune response within the tumor microenvironments.8 As chordoma is characterized by rich mucinous stroma on histological examination,9 these data altogether suggest an important role for the CAFs composition in determining the biological behavior of this tumor entity. However, although numerous studies have begun to reveal the molecular mechanism underlying chordoma development and progression at present,10 the influence of CAFs on this process remains elusive.
Currently, single-cell RNA sequencing (scRNA-seq) has been widely used to dissect the distinct cell types and the complex profiles of the tumor microenvironment in cancers.11 As a recently established method, spatial transcriptomics (ST) sequencing is able to analyze the cell types and gene expression changes on a structural and spatial level. Combined scRNA and ST sequencing have the advantage of accurately annotating specific cell subsets and revealing their spatial features, which has been applied to study the tissue architecture in pancreatic ductal adenocarcinomas and squamous cell carcinoma.12 In this study, we sought to determine the cell types, spatial distribution, and clinical implication of CAFs in chordoma. We first performed a comprehensive phenotypic investigation of CAFs through scRNA-seq. Then, the CAFs landscape from scRNA-seq was integrated with ST data using the multimodal intersection analysis. Finally, we validated our observations using bulk RNA-seq and multiplexed quantitative immunofluorescence (QIF). Our findings can be helpful for the better understanding of the biological function of CAFs in chordoma progression and may provide insight into the development of novel therapeutic strategies for this rare disease.
Materials and Methods
Patients and Tissue Samples
This study was approved by our hospital ethical committee and informed consent was obtained from all patients. In this study, we included 2 independent cohorts. The first cohort comprised 105 patients (between June 2002 and December 2018) and was partially described in our previous studies.13 Formalin-fixed paraffin-embedded (FFPE) samples from this cohort were used for QIF validation (QIF cohort). Another cohort was composed of 126 patients from other institutes (between January 2002 and December 2019) and FFPE samples were used for bulk RNA-seq assay (RNA-seq cohort). See Supplementary Methods for details.
Sample Preparation and scRNA-seq
Six chordoma samples (including 3 primary and 3 recurrent tumors) and 3 nucleus pulposus specimens were collected for scRNA-seq. Single-cell sequencing was performed as detailed in Supplementary Methods.
Identification of Cell Types and Marker Genes
Clustering and visualization were performed using the R package Seurat 3.1 as detailed in Supplementary Methods.
Identification of Different Expression Genes (DEGs) and Gene Enrichment
After the annotation of each cell type, DEGs between specific clusters were identified, and enrichment analysis was performed as detailed in Supplementary Methods.
Copy Number Variation (CNV) Estimation and Classification of Malignant Cells
To classify malignant cells, we use R package InferCNV function to interrogate the scRNA-seq data as detailed in Supplementary Methods.
Cell Cycle and Stemness Analysis
Cell cycle scores were obtained using the R package AddModuleScore function based on the expression of G2/M and S phase markers. We conducted cell stemness analysis using the scCancer package, which contains OCLR model and the stemness signatures.
Pseudotime Trajectory Analysis of CAFs
To discover the cell-state transitions of CAFs, the Monocle2 (R package, version 2.18.0) was used to establish single-cell trajectories as detailed in Supplementary Methods.
Cell–Cell Interaction Analysis
To evaluate the potential interactions between CAFs and other cell types, we used CellChatDB to investigate cell–cell communication as detailed in Supplementary Methods.
RNA Isolation and Bulk RNA-seq
A total of 126 tumor samples (including 93 primary and 33 recurrent tumors) were retrieved for bulk RNA-seq. See Supplementary Methods for details.
Gene Set Variation Analysis (GSVA)
To further explore the clinical implication of endoplasmic reticulum stress (ERS)-related CAFs, we performed GSVA for bulk RNA-seq data as detailed in Supplementary Methods.
Sample Preparation and Visium Spatial Sequencing
Three fresh tumor specimens (including 2 primary and 1 recurrent tumors) were used for ST sequencing as detailed in Supplementary Methods.
Spatial Transcriptomics Expression Analysis
The Space Ranger v1.2.0 (10 × Genomics) software was used to preprocess the sequencing data. Reads were mapped and aligned using STAR v.2.5.1b. The human GRCh38 genome was used as the reference genome for data alignment. The Seurat package was used to perform the ST expression analysis as detailed in Supplementary Methods.
Spatial Proximity and Neighborhood Analysis
Cluster labels were transferred from scRNA-Seq to ST spots by Seurat package. After spatial cell type annotation, the spatial association of each cell type with ERS-CAF was analyzed. See Supplementary Methods for details.
Construction of CAFs Atlas Via Multimodal Intersection Analysis (MIA)
To integrate single-cell expression profiles with ST data, MIA was performed as previously described as detailed in Supplementary Methods.
Multiplexed Quantitative Immunofluorescence
QIF was conducted with the Opal 7-color Manual IHC Kit (PerkinElmer, Waltham, Massachusetts). Detailed methods for QIF and subsequent analysis are recorded in Supplementary Methods.
Statistical Analyses
Statistical analyses were performed by R version 3.5.1 (R Foundation for Statistical Computing, Vienna, Austria). See Supplementary Methods for details.
Results
Single-Cell Transcriptomic Profile Identifies Functionally Unique CAF Populations in Chordoma Microenvironment
We comprehensively characterized the cell types in chordoma by generating single-cell gene expression profiles of tissues from 6 chordoma patients (including 3 with primary and 3 with recurrent tumors) and 3 matched LDH patients (Supplementary Figure S1). Detailed patient characteristics are shown in Supplementary Table S1. A total of 72 097 cells were acquired, of which 46 987 cells were from chordoma and 25 110 were from NP tissue samples. As shown in Figure 1A–B, a total of 49 cell clusters were identified and annotation of these clusters resulted in the separation of 10 cell types: epithelial-like cells, mononuclear phagocytes (MPs), T cells, endothelial cells, neutrophils, B cells, osteoclasts, fibroblasts, chondrocytes, and mural cells. Remarkably, cells identified as epithelial-like cells, fibroblasts, T cells, and B cells belonged to multiple clusters, indicating that these cell types were heterogeneous (Figure 1B). Compared with the NP tissues, there were many epithelial-like cells in chordoma tissues, especially in recurrent tumors. In addition, both primary and recurrent chordomas showed a decreased proportion of chondrocytes, fibroblasts, and endothelial cells (Figure 1C). The expression of representative genes for the 10 cellular subpopulations is shown in Figure 1D–E. As shown in Supplementary figure 2A–C, the TBXT, a putative marker gene of chordoma, was mainly expressed in epithelial-like cells, indicating that these cells could be chordoma cells. A significantly high CNV level was noted in epithelial-like cells from all tumor samples when nonmalignant myeloid cells used as reference cells (Supplementary Figure S2D). Notably, as antigen presentation-related genes are mainly located on chromosome 6 and that the expression level of these genes is high in myeloid cells, a stronger deletion on this chromosome was therefore observed in epithelial-like cells compared to myeloid cells. Further cell cycle analysis using a cell cycle gene scoring method revealed that most epithelial-like cells and immune cells derived from chordoma samples were in a proliferative state (including G2, M, or S phase; Supplementary Figure 2E–F). These results altogether suggested that epithelial-like cells represented tumor cells.
Figure 1.
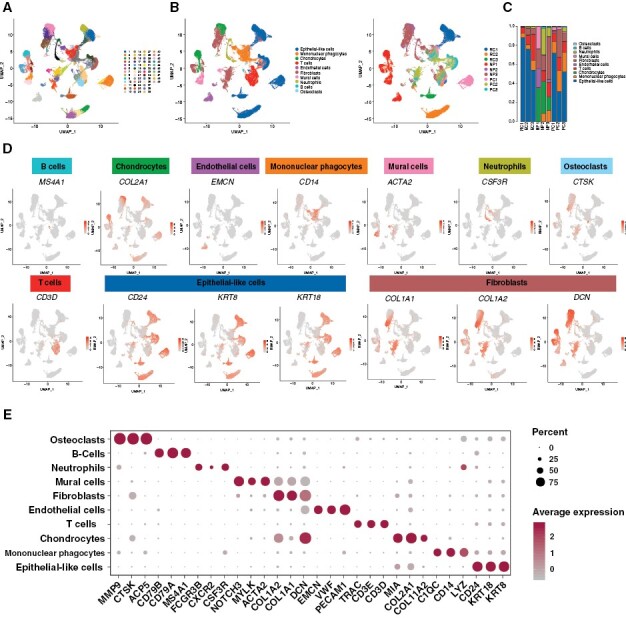
The single-cell atlas of chordoma tissues. Diverse cell types in chordoma delineated by single-cell transcriptomic analyses. (A) UMAP of 49 cell clusters identified from the scRNA-seq data. (B) UMAP of cell subclusters identified from the scRNA-seq data of 6 chordoma tissues and 3 NP tissues (left). The corresponding UMAP of cell subclusters for each sample (right). (C) The proportion of each cell type from each sample. (D) Expression of selected marker genes in the major cell types of chordoma tissues and NP tissues. (E) The cell-type marker genes expression matrix in the 10 cell types isolated from chordoma tissues and NP tissues.
To define the fibroblast subpopulations, we identified 6 main fibroblast subgroups in chordoma and NP tissue samples based on the expression of specific cellular markers (Figure 2A and B). To visualize key differences between the 6 CAF subgroups, we generated a heatmap showing the expression level of the top 10 DEGs in each cluster (Figure 2C). Among the 6 fibroblast subsets, fibroblast-1 and -5 were observed only in chordoma, suggesting that they were chordoma-specific CAFs (Figure 2D). Comparative analyses indicated that there were no significant differences in the stemness and cell cycle scores among CAFs, cancer cells, and normal fibroblasts (Figure 2E). Function enrichment analyses showed that CAFs shared common activities with both fibroblasts and cancer cells (Figure 2F), in agreement with previous observations.14,15 At the transcriptomic level, CAFs highly expressed marker genes both for fibroblasts (such as COL1A1 and COL6A1) and tumor cells (such as SPP1 and RARRES21; Figure 2G). To test the accuracy of UMAP clustering, we tried to remove fibroblasts and CAFs expressing canonical epithelial markers (namely KRT genes) from analyses. We found similar expression patterns of the KRT genes in fibroblasts from each tissue sample, and the cell clustering was generally consistent before and after the removal (Supplementary Figures S3 and S4). The expression of another typical epithelial marker, EPCAM was relatively low in fibroblasts and CAFs (Supplementary Figure S5). In addition, our analyses with the ST data also indicated that CAF could express the KRT genes (including KRT8 and KRT18) in chordoma specimens (Supplementary Figure S6). Further, we selected 26 cases with intact fluorescence signals from the QIF cohort and reanalyzed the distribution of CK19+ CAFs in these samples. Our results showed that CK19+ CAFs existed in 10 (38.5%) tumor samples (Supplementary Figure S7) despite having a low density percentage. Finally, by comprehensive literature searching, we found that the KRT genes could also be expressed by CAFs and fibroblasts.16–20 For example, studies have shown that KRT genes (such as KRT8, KRT18, and KRT19) are expressed in fibroblasts.19,20 Moreover, researchers recently identified a subtype of CAFs (namely apCAFs) expressing KRT19 in pancreatic ductal adenocarcinoma.17 Similarly, Ou et al. revealed the expression of KRT genes (including KRT14, KRT15, and KRT 19) in myCAFs of cervical squamous cell carcinoma tissues.15 Additionally, in breast cancer, it has also been demonstrated that both KRT8 and KRT18 expressions were detected in CD74+ CAFs.16 These data altogether suggest the reliability of our current cell clustering results.
Figure 2.

Identification of CAFs by single-cell RNA-seq. Fibroblast subclustering reveals distinct CAFs populations. (A) Two-dimensional UMAP projection of 6 fibroblast clusters across all samples. (B) UMAP plot of fibroblast specific markers for all fibroblast clusters. (C) Heatmap of top 10 DEGs per cluster for each fibroblast subpopulation. (D) The proportion of each fibroblast population from each sample. (E) UMAP of normal fibroblast clusters, CAFs, and cancer cells (Left); the cell cycle score and stemness score for the 3 cell types (Right). (F) GSVA results of fibroblasts, CAFs, and chordoma cells. (G) Heatmap of DEGs identified in fibroblasts, CAFs, and chordoma cells.
Fibroblasts Clustering Reveals a Unique Subpopulation Associated With Chordoma Progression
To identify CAF subpopulations and clarify their functions, we further conducted a dimensionality reduction analysis of all CAFs (namely fibroblast-1 and -5 cells) in chordoma tissues. We identified 4 CAF subpopulations (including CAF-1, CAF-2, CAF-3, and CAF-4) with CAF-1 and CAF-2 as the main subtypes (Figure 3A), all of them highly expressed putative marker genes of CAFs, including POSTN, THY1, ACTA2, FBLN1, FAP, and PDGFRA (Figure 3B). We also generated a heatmap to visualize the gene expression differences among the 4 CAF clusters (Figure 3C). Analyzing the origin of the CAF subpopulations, we found that CAF cluster 2 existed in recurrent tumors, clusters 3 and 4 existed in primary tumor tissues, and cluster 1 was present in both tumor tissues (Figure 3D). Based on GO enrichment analysis, we observed that CAF cluster 2 was correlated with response to ERS and characterized by high expression of ERS-related and hypoxic genes (HSPA1A, HSPA1B, CCL2, DNAJB1, HSPA6, HIF1A, BAG3, and VEGFA; Figure 3E and F and Supplementary Figure S8). CAF cluster 1 was found to be associated with energy metabolism with high expression of SPP1, RBP4, AGT, SFRP2, and ENPP1 (Figure 3E and G). CAF cluster 3 was related to neutrophils activation and expressed MMP9, ACP5, CKB, TPM1, and SERPINE1 (Figure 3E and H). CAF cluster 4 mainly contributed to skeletal system development with expression of IBSP, IFITM5, DLX5, HHIP, and GADD45B (Figure 3E and I). Noticeably, CAF cluster 4 also had high expression of hypoxia and ERS-related genes, but this result could be biased by the low cell number (only 21 cells assigned) of this CAF subset. Moreover, functional enrichment analysis did not show an association between CAF cluster 4 and response to ERS. These results together suggested that only CAF cluster 2 could be involved in the ERS process. ERS is a condition that occurs when proteins are not properly folded or conformed after a disturbance in the endoplasmic reticulum quality control system, which is reported to be involved in a variety of pathologies.21 As CAF cluster 2 only existed in recurrent tumor tissues and aberrant activation of ERS and hypoxia signaling pathways has emerged as key regulators of tumor progression,22 we speculated that CAF cluster 2 could be likely implicated in chordoma progression.
Figure 3.
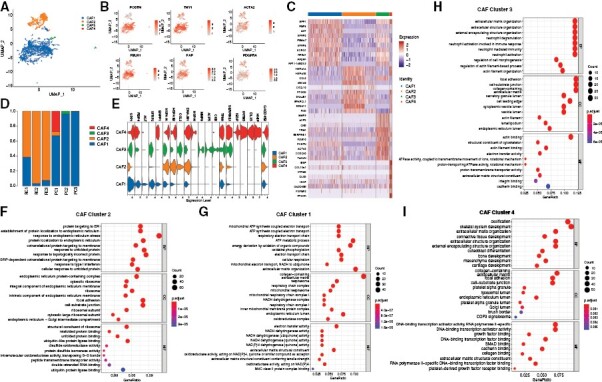
Identification of CAF subtypes. CAF subclustering reveals 4 CAFs subpopulations. (A) Two-dimensional UMAP projection of 4 CAF clusters across chordoma samples. (B) UMAP plot of CAF-specific markers for 4 CAF clusters. (C) Heatmap of top 10 DEGs per cluster for each CAF subpopulation. (D) The proportion of each CAF subpopulation from each chordoma sample. (E) Violin plot showing the expression levels of DEGs per cluster for each CAF subpopulation. (F-I) Gene ontology. (GO) enrichment anlayses of CAF-2 (F), CAF-1 (G), CAF-3 (H), and CAF-4 (I).
Pseudotime Analysis Resolves the Evolutionary Trajectory of CAFs Subpopulations
To elucidate the origins of CAFs, pseudotime trajectory analysis was performed with normal fibroblasts and 4 CAFs subpopulations. As fibroblast-3 and -6 were present only in one NP sample, we selected fibroblast-2 and fibroblast-4 as normal fibroblasts for pseudotime analysis as they were common in NP tissues. Normal fibroblasts were mainly shown at the beginning of the trajectory, while CAF clusters 1 and 2 predominately appeared at the end of the trajectory (Supplementary Figure S9A), indicating that normal fibroblast cells could convert into ERS-CAFs during chordoma progression. Genes in cluster 1 (such as DNAJB1, PPP1R15A, and HSPH1) were activated at the end of the trajectory with predominant BP of protein localization to the endoplasmic reticulum and response to ERS. Genes (NBL1, MXRA8, and CYR61) assigned to cluster 2 were transiently upregulated, but finally downregulated with function enrichment in skeletal system development and morphogenesis. Genes in clusters 3 (ENO1, ADIRF, and MIA) and 6 (MT1E, SCRG1, and BRI3) were gradually downregulated from the beginning and were enriched in mitotic nuclear division and ribonucleoprotein complex biogenesis, respectively. Cluster 4 genes (enriched in T-cell activation) and Cluster 5 genes (enriched in oxidative phosphorylation) were transiently downregulated but finally upregulated, showing two temporary transcriptional waves (such as SPP1, PSMA7, DDIT4 for Cluster 4 and C11orf96, PDLIM3, TMEM158 for cluster 5; Supplementary Figure S9B–D).
GSVA Indicates That ERS-CAF Signature Score is Associated With Chordoma Progression
To verify the pro-tumorigenic effects of ERS-CAF, we performed bulk RNA-seq of 126 samples from chordoma patients (Figure 4A and Supplementary Table 3). The ERS-CAF signature score was calculated for each patient using the gene set representative of this CAF subset, which included the ERS-related genes (such as HSPA1A, HSPA1B, CCL2, and DNAJB1) and CAF-specific markers (such as THY1, FAP, and COL1A1). The relationship between ERS-CAF signature score and clinical data is depicted in Figure 4B. As shown above, the ERS-CAF signature score was significantly correlated with tumor invasion into surrounding muscle (P < 0.0001), tumor grade (P = 0.011), AJCC staging (P = 0.007), and surgical margin (P = 0.002). The ERS-CAF signature was higher in patients with recurrent tumors compared to those with primary tumors (−0.06 ± 0.53 vs. −0.10 ± 0.51), although this difference was not statistically significant (t = −0.404, p = 0.687). For survival analysis, we used an online platform to determine the threshold value for ERS-CAF signature score and patients were divided into high (> cutoff) and low (≤ cutoff) subgroups according to the cutoff point. Kaplan–Meier analyses showed that increased ERS-CAF signature score predicted both unfavorable LRFS and OS (Figure 4C), which remained significant after controlling for important clinical factors in the Cox multivariate regression model (Figure 4D–E). However, no survival difference was seen between male and female patients (Supplementary Figure S10). To further test the accuracy of ERS-CAF signature, we subsequently performed GO and KEGG enrichment analysis from patients with high and low GSVA scores. The DEGs included many upregulated ERS genes and were mainly involved in 2 BP terms, including protein targeting to ER and response to ERS. Importantly, KEGG analysis showed that genes from patients with high signature scores were enriched in multiple signaling pathways related to cancer occurrence and progression (Supplementary Figure S11). These data suggest the reliability of using GSVA signature to reflect ERS-CAF subpopulation in chordoma tissues and highlight the importance of ERS-CAFs in regulating tumor progression.
Figure 4.

Association between ERS-CAF signature scores and chordoma progression. (A) The heatmap shows the expression level of ERS-CAF marker genes among chordoma patients. (B) The heatmap shows the distribution of clinicopathological characteristics and ERS-CAF signature scores among chordoma patients. (C) Kaplan–Meier curves of LRFS and OS of chordoma patients stratified by ERS-CAF signature score. (D–E) Multivariate Cox regression model including factors that were significant in univariate analysis for LRFS (D) and OS (E) of chordoma patients.
ERS-CAF Might Facilitate Chordoma Progression From Diverse Aspects
To infer the possible mechanism of how ERS-CAF subpopulation promotes tumor progression, we used CellChatDB database to dissect the intercellular communications between CAF subsets and other cell types. Our results showed that CAF subpopulations (especially ERS-CAFs and CAF cluster 1) were significantly activated and interacted with a variety of cells (Figure 5A and B). Many ligand–receptor pairs were identified to demonstrate extensive molecular interactions among ERS-CAF and the major cell types in chordoma. For incoming signaling, ERS-CAFs primarily accepted signals from CD46, EFG, SELL, NGF, NRXN, and HH molecules (Figure 5D). For sending signaling, ERS-CAFs mainly produced signals of TENASCIN, IGF, LIFR, NGF, THBS, GDF, and JAM (Figure 5D). Moreover, ERS-CAFs were demonstrated as the core cells in several cell communication networks, including JAM, THBS, and GDF signaling pathways (Figure 5E), all of which have been proven to play important roles in the development and progression of many cancers.23–25 These interactions were partially validated in subsequent Nichnet analysis (Supplementary Figures S12). In addition, we performed the QIF assay on 10 tumor tissue samples to further corroborate the interactive signaling of JAM2 and JAM3 between ERS-CAF and tumor cells. We found that the JAM2/JAM3 signaling was more expressed in areas where tumor cells were located closer to ERS-CAF (Supplementary Figure S13). Taken together, these data imply that ERS-CAFs could promote chordoma progression via various molecular mechanisms.
Figure 5.

Cell communication prediction. (A) Circle plot showing the number of interactions and interaction weight/strength among different cell types. The line thickness is proportional to the number of ligands-receptors pairs. (B) Detailed view of ligands broadcast by each major cell population. (C) Ligand–receptor communication network between CAFs and other major cell types predicted by scRNA-seq data. Right, heatmap of the top ligands expressed by 3 CAF subpopulations. Middle, heatmap of predicted ligand-receptor pairs between CAF subpopulations and different cell types in chordoma. Bottom, expression heatmap of top predicted receptors regulated by CAF subpopulations in different cell types. (D) Heatmap of receiving signal patterns and sending signal patterns of all cell types identified by CellChat analyses. (E) Circle plot showing the inferred JAM, THBS, and GDF signaling networks among different cell types.
Spatial Relationship Between ERS-CAF and Other Cell Types
To further dissect spatial characteristics of ERS-CAF in chordoma tissues, we performed spatial transcriptome sequencing of 3 fresh tumor samples (including 2 primary and 2 recurrent tumors; Figure 6A and G). A strong correlation between the UMIs and marker genes was observed in the ST data (Figure 6B and H), indicating a satisfactory quality. Marker genes of epithelial-like cells (KRT8), mononuclear phagocytes (CD14), T cells (CD3D), endothelial cells (PECAM1), neutrophils (CSF3R), B cells (CD79A), fibroblasts (COL2A1), and mural cells (ACTA2) were detected in ST data (Figure 6C and I). Subsequently, dimension reduction by the UMAP method identified 8 main cell clusters in both primary and recurrent tumor samples (Figure 6D and J). We also observed CAF cluster 1 in primary tumors, while both CAF cluster 1 and ERS-CAF were noted in relapsed tumor specimens (Figure 6D and J). These findings were confirmed by gene expression analysis with CAF markers (Figure 6E and K) and the MIA results (Figure 6F and L). To further interrogate the spatial relationship between ERS-CAF and other main cell types, we used the neighborhood score and the proximity score to characterize the cell type composition surrounding each ERS-CAF spot. Our analyses showed both high neighborhood scores and proximity scores between ERS-CAF and tumor cells (Supplementary Figures S14 and 15), suggesting a high probability of interaction among these 2 cell types. In addition, the stLearn analyses of ST data demonstrated the interactions between ERS-CAF (CAF-2) and chordoma cells (Supplementary Figure S16).
Figure 6.

Spatial distribution of CAF subpopulations.
(A) Spatial transcriptomics (ST) map of primary chordoma tissue. (B) The correlation between the genes and UMIs. (C) Spatial plots showing the marker genes for epithelial-like cells, mononuclear phagocytes, T cells, endothelial cells, neutrophils, B cells, chondrocytes, and mural cells. (D) T-SNE plot showing the ST clusters of primary chordoma tissues. (E) Violin plots showing the expression of CAF marker genes across the ST clusters for primary chordoma. (F) Heatmap showing the distribution of cell types identified by scRNA-seq in ST map. G–L for recurrent chordoma using the same presentation form as primary chordoma.
ERS-CAFs Density and Their Spatial Distance to Tumor Cells are Related to Poor Chordoma Outcomes
To further characterize CAF subsets in the chordoma microenvironment, we performed QIF of 105 tumor samples and assessed the spatial distance of CAFs to tumor cells. Representative images showing distribution of the 3 CAF subtypes in the chordoma tissues are depicted in Supplementary Figure S17A. After automatic quantification, we found that CAF cluster 1 was most abundant in tumor tissues, while CAF cluster 3 harbored the lowest level, and the difference in cell density among the 3 CAF subpopulations was significant (Supplementary Figure S17B and C). Moreover, we also found that ERS-CAFs had the nearest average distance to chordoma cells and possessed the highest effective percentage within 30 μm radii of tumor cells by analyzing the spatial distance (Supplementary Figure S18A–D). Because the effective percentage data for each CAF subtype was collinear, we therefore used LASSO regression to integrate this dataset for subsequent analyses. We calculated the ERS-CAF spatial distance score for each patient by multiplying the effective density percentage by the regression coefficient for each parameter chosen from the LASSO analysis. Our results disclosed that both density and spatial distance score of ERS-CAF subset were significantly correlated with aggressive tumor phenotype (including invasion of surrounding muscle, high pathology grade, and AJCC staging) (Supplementary Figure 19A and Supplementary Tables S4–5). As expected, the CAF-1 density was higher in primary tumors than in recurrent ones (63.09 ± 39.32 cells/106 pixels vs. 48.15 ± 30.29 cells/106 pixels), although this difference was not statistically significant (t = 1.590, p = 0.115). Finally, we discovered that increased ERS-CAF density and spatial distance score were associated with worse LRFS and OS both in univariate and multivariate survival analyses. No difference was observed in terms of OS between male and female patients, while female patients had marginally significantly better LRFS than male patients (Supplementary Figures S8 and S19B and C).
Discussion
The obvious characteristics of rich stroma may be likely related to chordoma progression. Supporting this, our previous retrospective study demonstrated that the tumor-stroma ratio was positively correlated with tumor invasive phenotype, inhibitory immune microenvironment, and poor prognosis of spinal chordoma.8 With CAFs as the major cell type, stromal cell constitutes an important component of the tumor microenvironment.5 To further clarify the effect of stomal components on the biological behavior of chordoma, we used transcriptomics sequencing and multi-color quantitative immunofluorescence techniques to uncover the role of specific CAFs clusters in chordoma progression. We revealed that there were at least 3 CAFs subpopulations in chordoma tissues. Of them, ERS-CAFs mainly existed in the recurrent tumor samples, and highly expressed hypoxic genes HIF1A, VEGFR, and BAG3. Considering that hypoxia and ERS are the critical features among tumorigenesis,21,22 we therefore speculate that the ERS-CAFs may likely contribute to chordoma progression. Further pseudotime trajectory analysis showed that ERS-CAFs derived from normal fibroblasts and interacted with tumor cells and immune cells. The ST data of 3 tumor samples confirmed the existence of ERS-CAFs subtype and indicated that this cluster displayed the highest probability of proximity to tumor cells. The ERS-CAF signature score was associated with tumor phenotype and patient survival in the bulk RNA-seq cohort. Similar results were observed in the QIF cohort and we also confirmed that the ERS-CAFs had the nearest spatial distance to tumor cells. Importantly, the ERS-CAFs spatial distance score also correlated with tumor features and clinical outcomes of patients. These results altogether suggest that the ERS-CAFs in chordoma microenvironment may likely promote disease progression through direct crosstalk with tumor cells.
It has been reported that CAFs can affect the growth, invasion, and metastasis of malignant tumors through various molecular mechanisms, including remodeling ECM, secreting cytokines, and promoting angiogenesis.7 Using combined single-cell and spatial transcriptomics (ST), we found that there are at least 3 different CAF subtypes in chordoma microenvironment: metabolism-related CAF, ERS-CAF, and neutrophil activation-related CAF. Similar to our findings, CAF subtype with immune regulatory activity has been confirmed to be present in pancreatic cancer and breast cancers.26,27 In addition, recent studies also reported that metabolism-related CAF existed in pancreatic ductal adenocarcinoma, which could promote tumor metastasis via activating the aerobic glycolysis signaling.28 For chordoma, Duan et al.29 recently performed scRNA-seq on 6 tumor samples (including 4 skull base and 2 spinal chordomas) and found that there were 6 different fibroblast subsets in chordoma tissues, which is not in agreement with our results. This inconsistency may probably emerge due to the different sample types used. In this study, we first identified the ERS-CAF subpopulation in chordoma samples. It has been suggested that the homeostasis of the endoplasmic reticulum in various cells is disturbed by the microenvironmental changes.30 Malignant tumors are commonly in a persistent ERS state,30 which can abnormally activate downstream signaling and promote tumorigenesis through various molecular mechanisms such as immune escape.21 Our subsequent analysis showed that the ERS-CAF subpopulation was derived from normal fibroblasts and positively related to tumor malignant phenotype and poor patient outcome. Furthermore, the ERS-CAF subpopulation was enriched in genes associated with hypoxia, which represents a prominent feature of the tumor microenvironment that can perturb endoplasmic reticulum homeostasis and induces cellular ERS.31 Taken together, we hypothesize that the presence of a markedly hypoxic microenvironment in progressive chordomas (especially recurrent tumors) elicits a cellular ERS response that can induce a phenotypic shift of normal fibroblasts to ERS-CAF, which in turn promote the malignant behavior of tumor cells and thus accelerate disease progression.
Previous studies have shown that the spatial and temporal dynamics of TME are key factors leading to tumor heterogeneity,32 which is closely related to tumor progression. In support of this, researchers have demonstrated that the density and spatial distance of immune cells in different tissue subregions are significantly correlated with the invasion, metastasis, and clinical outcomes of malignant tumors.33 Similarly, published data have also certified that the spatial heterogeneity of CAFs can significantly influence the survival of cancer patients.34 In line with these outcomes, our analysis showed that ERS-CAFs were closer to tumor cells, and their spatial distance from tumor cells was linked with chordoma aggressiveness and prognosis. These data imply that ERS-CAF probably promotes chordoma progression by directly affecting the biological behavior of tumor cells. More importantly, the spatial heterogeneity of ERS-CAF may be likely involved in the regulation of tumor behavior: the ERS-CAFs located at different spatial distances from tumor cells may have different biological functions, which can affect the growth and invasion of tumors through different modes of action, and eventually lead to tumor progression.
It has been reported that the interaction between different cell types in the tumor microenvironment is associated with the development and progression of cancers.35 Our cell communication analysis based on the curated receptor-ligand pair database showed that ERS-CAF in chordoma microenvironment mainly regulated the biological behavior of tumor cells through JAM2/ITGB1, TNC/SDC4, and THBS1/CD47 signaling axes. Prior studies have confirmed that JAM2 is abnormally activated in CAFs of human breast cancer, which can help contribute to an immunosuppressive environment by retaining CD4+CD25+ T cells.36 Tenascin-C (TNC) is highly expressed in the stromal regions of tumors.37 In breast cancer, researchers have found that TNC can promote tumor progression by immobilizing infiltrating T lymphocytes through interaction with CXCL12.37 THBS family plays an important role in cell adhesion and extracellular matrix formation.38 It has been suggested that several THBS members are highly expressed in CAF of cancers,38 which can change the level of membrane attachment complex to increase the extracellular matrix and thus accelerate tumor progression by mediating ATF6a-dependent ERS.39 In chordoma, whether ERS-CAF affects the malignant behavior of tumors through similar molecular mechanisms needs further experimental verification. Moreover, it should be noted that the CellChatDB database only contains limited information on receptor-ligand pairs, and whether ERS-CAF can promote chordoma progression by other signaling pathways deserves further exploration. In addition, our analysis also unveiled that ERS-CAF could act on immune cells (especially MPs, T cells, and neutrophils) by affecting multiple receptor-ligand molecular signals. These findings require further experimental confirmation and how ERS-CAF interacts with immune cells to affect chordoma behavior also remains to be clarified.
Limitations
The ERS-CAF signature or density was not significantly higher in recurrent tumors than in primary tumors, which may be caused by the small number of recurrent patients included in both the RNA-seq (n = 34) and QIF (n = 20) cohort, thereby leading to a lower statistical power. Future studies involving more recurrent patients are needed to further test the distribution of ERS-CAF signature or density among primary and recurrent chordoma samples. Despite the validation by QIF staining and ST data with stLearn method, the sample size for analysis is small (n = 10 for QIF and n = 3 for ST) and thus the cell-to-cell communication results were still speculative. Further studies using cell functional experiments are required to verify these findings. In addition, the CAF-1 subtype may be implicated in chordomas initial development before recurrence due to its high metabolic activity. Our future study will aim to clarify this issue.
Conclusion
In summary, we performed a comprehensive investigation of the CAF distribution in chordoma microenvironment using transcriptomic sequencing and QIF approaches. Our results revealed that CAF fell into at least 3 broad categories with distinctly spatial features. Of them, the ERS-CAF subpopulation contributed to chordoma progression possibly via direct crosstalk with tumor cells, which was confirmed by bulk RNA-seq and QIF data. Taken together, we defined the spatial heterogeneity of CAF in chordoma and identified a unique ERS-CAF subtype associated with tumor progression. These data may be helpful for the development of novel therapeutic strategies for this disease.
Supplementary Material
Acknowledgements
We thank Alpha X Biotech Co., Ltd., Beijing, China for assistance with Multiplexed Quantitative Immunofluorescence.
Contributor Information
Tao-Lan Zhang, Institute of Clinical Medicine, The First Affiliated Hospital, Hengyang Medical School, University of South China, Hengyang, China; Department of Pharmacy, The First Affiliated Hospital, Hengyang Medical School, University of South China, Hengyang, China.
Chao Xia, Department of Spine Surgery, The First Affiliated Hospital, Hengyang Medical School, University of South China, Hengyang, China.
Bo-Wen Zheng, Institute of Clinical Medicine, The First Affiliated Hospital, Hengyang Medical School, University of South China, Hengyang, China; Musculoskeletal Tumor Center, Peking University People’s Hospital, Peking University, Beijing, China.
Hai-Hong Hu, Institute of Clinical Medicine, The First Affiliated Hospital, Hengyang Medical School, University of South China, Hengyang, China.
Ling-Xiang Jiang, Department of Radiation Oncology, Melvin and Bren Simon Comprehensive Cancer Center, Indiana University School of Medicine, Indianapolis, Indiana, USA.
David Escobar, Department of Cancer Biology, University of Toledo, College of Medicine & Life Sciences, Toledo, Ohio, USA.
Bo-Yv Zheng, Department of Orthopedics Surgery, General Hospital of the Central Theater Command, Wuhan, China.
Tian-Dong Chen, Department of Pathology, The Affiliated Henan Provincial Cancer Hospital, Zhengzhou University, Zhengzhou, China.
Jing Li, Department of Spine Surgery, The Second Xiangya Hospital, Central South University, Changsha, China.
Guo-Hua Lv, Department of Spine Surgery, The Second Xiangya Hospital, Central South University, Changsha, China.
Wei Huang, The First Affiliated Hospital, Health Management Center, Hengyang Medical School, University of South China, Hengyang, China.
Yi-Guo Yan, Department of Spine Surgery, The First Affiliated Hospital, Hengyang Medical School, University of South China, Hengyang, China.
Ming-Xiang Zou, Department of Spine Surgery, The First Affiliated Hospital, Hengyang Medical School, University of South China, Hengyang, China.
Funding
This work was supported by the National Natural Science Foundation of China (82003802 to T.-L.Z. and 82002364 to M.X.Z.), Natural Science Foundation of Hunan Province (2019JJ50542 and 2023JJ50156 to T.L.Z., 2023JJ40596 to C.X., 2023JJ40587 to W.H. and 2021JJ40509 to M.X.Z.), Hunan Provincial Natural Science Foundation for Excellent Youth Scholars (2023JJ20035 to M.X.Z.), Clinical Research 4310 Program of the First Affiliated Hospital of the University of South China (20224310NHYCG04 to T.L.Z.), Project for Clinical Research of Hunan Provincial Health Commission (20201978 to T.L.Z., 20201962 to C.X. and 20201956 to M.X.Z.), Research Foundation of Education Bureau of Hunan Province (22B0441 to W.H.), China Scholarship Council (202106370071 to B.W.Z.), Science and technology innovation Program of Hengyang City (202250045223 to T.L.Z.) and Huxiang Young Talent (2023RC3172 to M.X.Z.).
Conflict of interest statement
The authors declare that they have no competing interests.
Authorship statement
T.L.Z., C.X., B.W.Z., Y.G.Y., and M.X.Z.: contributed to the conception and design of the study. T.L.Z., C.X., H.H.H., L.X.J., B.Y.Z., J.L., G.H.L., W.H., Y.G.Y., and M.X.Z.: did the data analysis and interpretation. T.L.Z., C.X., B.W.Z., D.E., T.D.C., Y.G.Y., and M.X.Z.: contributed to drafting and revision of the manuscript.
Data availability
The sequencing data can be obtained at the Open Archive for Miscellaneous Data (https://ngdc.cncb.ac.cn/omix/) with the accession no.OMIX004303. The Analysis code is available at https://github.com/LabZhangZou/-CAF-subpopulations.
Ethics approval and consent to participate
The study protocol was approved by the Institutional Review Board at The First Affiliated Hospital, University of South China, Hunan, P.R. China. Written informed consent was obtained from each patient for publication of this study.
Consent for publication
Not applicable.
References
- 1. Al Shihabi A, Davarifar A, Nguyen HTL, et al. Personalized chordoma organoids for drug discovery studies. Sci Adv. 2022;8(7):eabl3674. [DOI] [PMC free article] [PubMed] [Google Scholar]
- 2. Gill CM, Fowkes M, Shrivastava RK.. Emerging therapeutic targets in chordomas: a review of the literature in the genomic era. Neurosurgery. 2020;86(2):E118–E123. [DOI] [PubMed] [Google Scholar]
- 3. Kayani B, Hanna SA, Sewell MD, et al. A review of the surgical management of sacral chordoma. Eur J Surg Oncol. 2014;40(11):1412–1420. [DOI] [PubMed] [Google Scholar]
- 4. Zhou J, Sun J, Bai HX, et al. Prognostic factors in patients with spinal chordoma: an integrative analysis of 682 patients. Neurosurgery. 2017;81(5):812–823. [DOI] [PubMed] [Google Scholar]
- 5. Liu T, Han C, Wang S, et al. Cancer-associated fibroblasts: an emerging target of anti-cancer immunotherapy. J Hematol Oncol. 2019;12(1):86. [DOI] [PMC free article] [PubMed] [Google Scholar]
- 6. Park D, Sahai E, Rullan AS.. SnapShot: cancer-associated fibroblasts. Cell. 2020;181(2):486–486.e481. [DOI] [PubMed] [Google Scholar]
- 7. Sahai E, Astsaturov I, Cukierman E, et al. A framework for advancing our understanding of cancer-associated fibroblasts. Nat Rev Cancer. 2020;20(3):174–186. [DOI] [PMC free article] [PubMed] [Google Scholar]
- 8. Zou MX, Zheng BW, Liu FS, et al. The relationship between tumor-stroma ratio, the immune microenvironment, and survival in patients with spinal chordoma. Neurosurgery. 2019;85(6):E1095–E1110. [DOI] [PubMed] [Google Scholar]
- 9. Crapanzano JP, Ali SZ, Ginsberg MS, Zakowski MF.. Chordoma: a cytologic study with histologic and radiologic correlation. Cancer. 2001;93(1):40–51. [PubMed] [Google Scholar]
- 10. Zuccato JA, Patil V, Mansouri S, et al. DNA methylation-based prognostic subtypes of chordoma tumors in tissue and plasma. Neuro Oncol. 2022;24(3):442–454. [DOI] [PMC free article] [PubMed] [Google Scholar]
- 11. Zhang Q, Fei L, Han R, et al. Single-cell transcriptome reveals cellular hierarchies and guides p-EMT-targeted trial in skull base chordoma. Cell Discov. 2022;8(1):94. [DOI] [PMC free article] [PubMed] [Google Scholar]
- 12. Moncada R, Barkley D, Wagner F, et al. Integrating microarray-based spatial transcriptomics and single-cell RNA-seq reveals tissue architecture in pancreatic ductal adenocarcinomas. Nat Biotechnol. 2020;38(3):333–342. [DOI] [PubMed] [Google Scholar]
- 13. Xia C, Huang W, Chen YL, et al. Coexpression of HHLA2 and PD-L1 on tumor cells independently predicts the survival of spinal chordoma patients. Front Immunol. 2022;12:797407. [DOI] [PMC free article] [PubMed] [Google Scholar]
- 14. Kikuchi N, Horiuchi A, Osada R, et al. Nuclear expression of S100A4 is associated with aggressive behavior of epithelial ovarian carcinoma: an important autocrine/paracrine factor in tumor progression. Cancer Sci. 2006;97(10):1061–1069. [DOI] [PMC free article] [PubMed] [Google Scholar]
- 15. Ou Z, Lin S, Qiu J, et al. Single-nucleus RNA sequencing and spatial transcriptomics reveal the immunological microenvironment of cervical squamous cell carcinoma. Adv Sci (Weinh). 2022;9(29):e2203040. [DOI] [PMC free article] [PubMed] [Google Scholar]
- 16. Sebastian A, Hum NR, Martin KA, et al. Single-cell transcriptomic analysis of tumor-derived fibroblasts and normal tissue-resident fibroblasts reveals fibroblast heterogeneity in breast cancer. Cancers (Basel). 2020;12(5):1307. [DOI] [PMC free article] [PubMed] [Google Scholar]
- 17. Elyada E, Bolisetty M, Laise P, et al. Cross-species single-cell analysis of pancreatic ductal adenocarcinoma reveals antigen-presenting cancer-associated fibroblasts. Cancer Discov. 2019;9(8):1102–1123. [DOI] [PMC free article] [PubMed] [Google Scholar]
- 18. Olbrecht S, Busschaert P, Qian J, et al. High-grade serous tubo-ovarian cancer refined with single-cell RNA sequencing: specific cell subtypes influence survival and determine molecular subtype classification. Genome Med. 2021;13(1):111. [DOI] [PMC free article] [PubMed] [Google Scholar]
- 19. Kirkwood PM, Gibson DA, Shaw I, et al. Single-cell RNA sequencing and lineage tracing confirm mesenchyme to epithelial transformation (MET) contributes to repair of the endometrium at menstruation. Elife. 2022;11:e77663. [DOI] [PMC free article] [PubMed] [Google Scholar]
- 20. Traweek ST, Liu J, Battifora H.. Keratin gene expression in non-epithelial tissues. Detection with polymerase chain reaction. Am J Pathol. 1993;142(4):1111–1118. [PMC free article] [PubMed] [Google Scholar]
- 21. Chen X, Cubillos-Ruiz JR.. Endoplasmic reticulum stress signals in the tumour and its microenvironment. Nat Rev Cancer. 2021;21(2):71–88. [DOI] [PMC free article] [PubMed] [Google Scholar]
- 22. Ivan M, Fishel ML, Tudoran OM, et al. Hypoxia signaling: challenges and opportunities for cancer therapy. Semin Cancer Biol. 2022;85:185–195. [DOI] [PMC free article] [PubMed] [Google Scholar]
- 23. Lauko A, Mu Z, Gutmann DH, Naik UP, Lathia JD.. Junctional adhesion molecules in cancer: a paradigm for the diverse functions of cell-cell interactions in tumor progression. Cancer Res. 2020;80(22):4878–4885. [DOI] [PMC free article] [PubMed] [Google Scholar]
- 24. Carpino G, Cardinale V, Di Giamberardino A, et al. Thrombospondin 1 and 2 along with PEDF inhibit angiogenesis and promote lymphangiogenesis in intrahepatic cholangiocarcinoma. J Hepatol. 2021;75(6):1377–1386. [DOI] [PubMed] [Google Scholar]
- 25. Wang Z, He L, Li W, et al. GDF15 induces immunosuppression via CD48 on regulatory T cells in hepatocellular carcinoma. J ImmunoTher Cancer. 2021;9(9):e002787. [DOI] [PMC free article] [PubMed] [Google Scholar]
- 26. Lidström T, Cumming J, Gaur R, et al. Extracellular galectin 4 drives immune evasion and promotes T-cell apoptosis in pancreatic cancer. Cancer Immunol Res. 2023;11(1):72–92. [DOI] [PMC free article] [PubMed] [Google Scholar]
- 27. Wu SZ, Roden DL, Wang C, et al. Stromal cell diversity associated with immune evasion in human triple-negative breast cancer. EMBO J. 2020;39(19):e104063. [DOI] [PMC free article] [PubMed] [Google Scholar]
- 28. Wang Y, Liang Y, Xu H, et al. Single-cell analysis of pancreatic ductal adenocarcinoma identifies a novel fibroblast subtype associated with poor prognosis but better immunotherapy response. Cell Discov. 2021;7(1):36. [DOI] [PMC free article] [PubMed] [Google Scholar]
- 29. Duan W, Zhang B, Li X, et al. Single-cell transcriptome profiling reveals intra-tumoral heterogeneity in human chordomas. Cancer Immunol Immunother. 2022;71(9):2185–2195. [DOI] [PMC free article] [PubMed] [Google Scholar]
- 30. Cubillos-Ruiz JR, Bettigole SE, Glimcher LH.. Tumorigenic and immunosuppressive effects of endoplasmic reticulum stress in cancer. Cell. 2017;168(4):692–706. [DOI] [PMC free article] [PubMed] [Google Scholar]
- 31. Jiang D, Niwa M, Koong AC.. Targeting the IRE1α-XBP1 branch of the unfolded protein response in human diseases. Semin Cancer Biol. 2015;33:48–56. [DOI] [PMC free article] [PubMed] [Google Scholar]
- 32. Wu R, Guo W, Qiu X, et al. Comprehensive analysis of spatial architecture in primary liver cancer. Sci Adv. 2021;7(51):eabg3750. [DOI] [PMC free article] [PubMed] [Google Scholar]
- 33. Gartrell RD, Marks DK, Hart TD, et al. Quantitative analysis of immune infiltrates in primary melanoma. Cancer Immunol Res. 2018;6(4):481–493. [DOI] [PMC free article] [PubMed] [Google Scholar]
- 34. Pellinen T, Paavolainen L, Martín-Bernabé A, et al. Fibroblast subsets in non-small cell lung cancer: associations with survival, mutations, and immune features. J Natl Cancer Inst. 2023;115(1):71–82. [DOI] [PubMed] [Google Scholar]
- 35. Liu Y, He S, Wang XL, et al. Tumour heterogeneity and intercellular networks of nasopharyngeal carcinoma at single cell resolution. Nat Commun. 2021;12(1):741. [DOI] [PMC free article] [PubMed] [Google Scholar]
- 36. Costa A, Kieffer Y, Scholer-Dahirel A, et al. Fibroblast heterogeneity and immunosuppressive environment in human breast cancer. Cancer Cell. 2018;33(3):463–479.e10. [DOI] [PubMed] [Google Scholar]
- 37. Murdamoothoo D, Sun Z, Yilmaz A, et al. Tenascin-C immobilizes infiltrating T lymphocytes through CXCL12 promoting breast cancer progression. EMBO Mol Med. 2021;13(6):e13270. [DOI] [PMC free article] [PubMed] [Google Scholar]
- 38. Vanhoutte D, Schips TG, Vo A, et al. Thbs1 induces lethal cardiac atrophy through PERK-ATF4 regulated autophagy. Nat Commun. 2021;12(1):3928. [DOI] [PMC free article] [PubMed] [Google Scholar]
- 39. Shi Y, Sun L, Zhang R, et al. Thrombospondin 4/integrin α2/HSF1 axis promotes proliferation and cancer stem-like traits of gallbladder cancer by enhancing reciprocal crosstalk between cancer-associated fibroblasts and tumor cells. J Exp Clin Cancer Res. 2021;40(1):14. [DOI] [PMC free article] [PubMed] [Google Scholar]
Associated Data
This section collects any data citations, data availability statements, or supplementary materials included in this article.
Supplementary Materials
Data Availability Statement
The sequencing data can be obtained at the Open Archive for Miscellaneous Data (https://ngdc.cncb.ac.cn/omix/) with the accession no.OMIX004303. The Analysis code is available at https://github.com/LabZhangZou/-CAF-subpopulations.