Abstract
Node-Pore Sensing, NPS, is an extremely versatile and powerful technique for the analysis of cells and the detection of extracellular vesicles (EVs). NPS involves measuring the modulated current pulse caused by a cell transiting a microfluidic channel that has been segmented by a series of inserted nodes. As the current pulse reflects the number of nodes and segments of the channel, NPS can achieve exquisite sensitivity. Thus, when used as a Coulter counter, NPS can measure the sub-micron size increase of antibody-coated colloids to which EVs are specifically bound. By simply inserting between two nodes a “contraction” channel through which cells can squeeze, one can mechanically phenotype cells. We discuss the details of performing these two NPS applications.
Keywords: Node-pore sensing, Resistive-pulse sensing, Tumor marker, Mechano-phenotyping, Extracellular vesicles, Cancer cells
1. Introduction
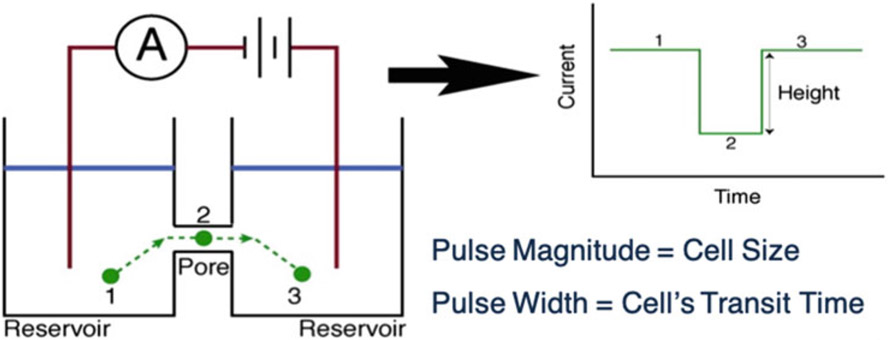
Resistive-pulse sensing (RPS) [1-4] is a fundamental technique to accurately measure the size of particles (e.g., virus, bacteria, cells) and, like its “cousin” flow cytometry, is essential in cell biology and medicine [5-10]. Centered on the Coulter principle [11], RPS involves measuring the current, I, across a fluid-filled pore or aperture (Fig. 1). When an insulating particle traverses the pore, it partially blocks the flow of current, resulting in a current pulse, ΔI/I, whose magnitude and duration correspond to the particle’s size (∣ΔI/I∣ ∝ Vparticle/Vpore, the volume-to-volume ratio of particle to pore [1-4, 12]) and transit time (τ) through the pore, respectively. While its strength lies in its simplicity and accuracy, RPS does have a major limitation: the size of the pore or the aperture through which a particle traverses must be commensurate with that of the particle [5, 7]. A mismatch leads to clogging of the pore or insufficient signal-to-noise ratio (SNR) to detect ΔI/I. Thus, RPS is restricted to measuring cellular populations with narrow size distributions or to pores that are difficult to fabricate or utilize due to sub-micron feature sizes required for sufficient SNR. Coincidence events, in which two or more particles traverse the pore simultaneously, generate complex current pulses that require advanced post-analysis to de-convolve [13, 14]. The difficulty in resolving these events is another limitation of not just RPS but also flow cytometry [15, 16].
Fig. 1.
Coulter principle applied to a microfluidic device. A potential is applied across a microchannel filled with a conductive fluid, such as an aqueous buffer solution. When a particle transits the microchannel, the electric field is partially blocked, increasing the impedance of the microchannel. By measuring the current across the microchannel over time, this transit event can be recorded as a drop in current. Once the particle exits the microchannel, the current once again rises. The amplitude of the current pulse measured corresponds to the size of the particle relative to the microchannel, and the width of the pulse corresponds to the length of the microchannel and the particle’s velocity
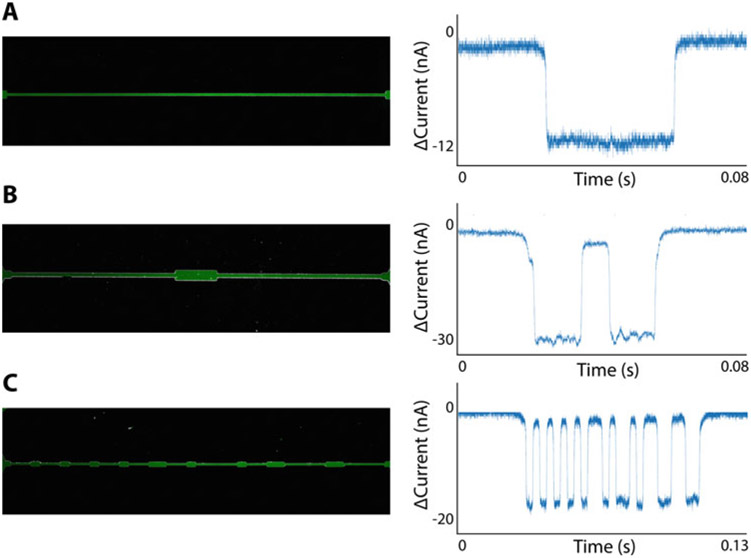
A rich and versatile platform, Node-Pore Sensing (NPS) [17] overcomes the many limitations of RPS and enables a diverse range of biological applications that RPS cannot achieve. Central to NPS is an innovative device geometry in which “nodes” segment a microfluidic channel (i.e., the “pore”) (Fig. 2). Because the amount of current that the particle partially blocks in the channel segment is greater than that in the larger-volume node, the current pulse caused by a particle transiting an NPS channel is modulated, consisting of sub-pulses that reflect the number of nodes and their spacing (Fig. 2). The modulated current pulse can easily be distinguished within the measured noise and analyzed in the spectral domain using a Fast Fourier transform (FFT) [17] or other signal-processing algorithms, such as those used in telecommunications or sonar detection [13, 14]. In general, one can encode specific temporal and/or spatial information by including and spacing as many nodes as desired in order to achieve high sensitivity and dynamic-sensing range. For perspective, the Multisizer 4 Coulter Counter can detect a current pulse corresponding to Vparticle/Vpore ~ 10−5 when a dynamic aperture range of 64,000:1 by volume is employed. In contrast, an evenly spaced, 4-node NPS device (8 μm × 10 μm × 500 μm, H × W × L) can detect a pulse corresponding to Vparticle/Vpore ~ 10−9. Thus, with NPS, measurement is no longer restricted to pores commensurate to the size of the particles measured—a heterogeneous population consisting of particles ranging from nanometers to microns in size can easily be measured using a single NPS device hundreds of microns long and tens of microns in diameter [17].
Fig. 2.
NPS channels and corresponding current pulses. (a) A long, single microchannel produces a single rectangular pulse according to the Coulter principle. (b) When a particle enters a widened node, the current returns to baseline. The overall signal of a particle transiting a single-node NPS device is a pair of rectangular pulses. (c) Modulating the width of an NPS channel allows for the encoding of more complex signals
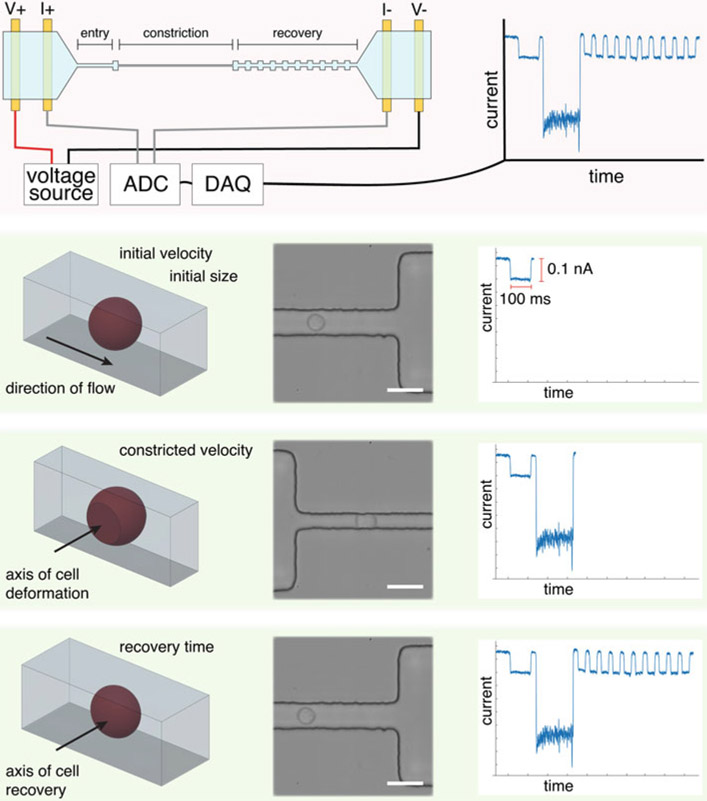
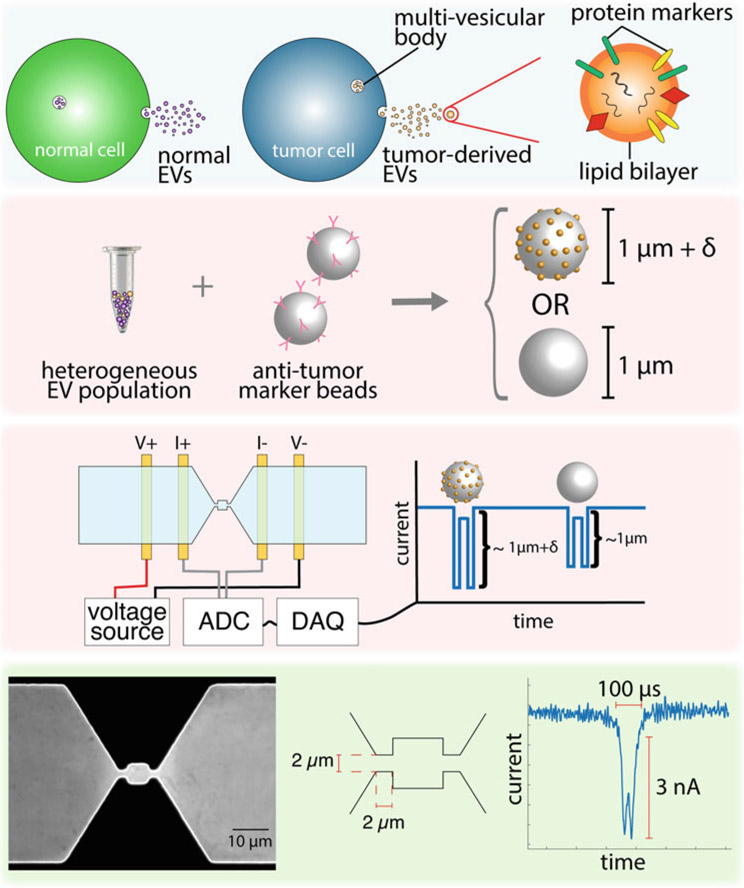
NPS’s applications are numerous and diverse. In its simplest form, it is a Coulter counter that can detect viral particles in human serum without need for extra sample processing steps (e.g., filtration) [17] and can resolve coincidence events in real time [13, 14]. By measuring the size increase of micron-sized, antibody-coated colloids to which extracellular vesicles (EVs) are specifically bound, NPS can detect specific EV subpopulations (exo-NPS), e.g., tumor-derived EVs (Fig. 5). We are currently developing exo-NPS to perform lung-cancer screening, and we outline in the forthcoming sections the basic steps we have undertaken to achieve this goal [18]. If antibodies are incorporated into the segments between the nodes, NPS can perform label-free immunophenotyping of cells (multi-marker NPS screening) [8]. In multi-marker screening, one relies on measuring the transit time of cells as they pass through the different segments of the NPS device. Cells that have a surface epitope that is specific to the antibodies in a particular segment will transit more slowly through that segment versus a control segment due to transient binding. We have demonstrated our ability to screen up to 4 different surface markers simultaneously on a single cell and have used multi-marker NPS screening to perform immunophenotyping of the leukemic blasts of acute myeloid leukemia patients [8]. Finally, if one segment in the channel is narrower than the diameter of the cells to be interrogated, cells must squeeze through the segment in order to transit the entire channel. In this manner, NPS can mechanically phenotype cells (mechano-NPS) (Fig. 4), and we can extract out their diameter, resistance to compressive deformation, transverse deformation, and recovery from deformation, all at the single-cell level [19]. When the segment is both narrow and sinusoidal in shape, NPS can measure the viscoelastic properties of cells (visco-NPS) [20]. We have used mechano-NPS to determine, for the very first time, the effects of chronological age and malignant progression on cell elasticity and recovery from deformation. Moreover, we demonstrated that we could use these parameters to distinguish malignant from non-malignant cells, measure changes in deformability due to the cytoskeleton, and discriminate between sub-lineages and among chronological age groups of normal primary human mammary epithelial cells (HMECs) [19].
Fig. 5.
Schematic of the operating principles of mechano-node-pore sensing (mechano-NPS), including high-speed micrographs and an example current pulse. First, a cell’s initial size and velocity is measured. The cell then enters a narrower section of the microchannel, where it is constricted along the axis perpendicular to the direction of flow. Finally, the cell is released into a wider pore, where it can recover from its deformed shape to a spherical shape over time. This recovery is reflected by the gradual increase in pulse amplitude. High-speed micrographs show a cell throughout each stage of mechano-NPS; scale bars represent 30 μm
Fig. 4.
Schematic of the operating principles of exo-node-pore sensing (exo-NPS). Extracellular vesicles (EVs) originating from specific cells are captured on colloids coated with antibodies for markers presented on the surface of the target EVs. Binding of EVs increases the effective size of the colloids, which is measured using a two-pore NPS device (exo-NPS)
Thus, NPS is an extremely versatile technique. In the following sections, we describe the materials (Subheading 2) and procedures (Subheading 3) common to all NPS devices. We then describe the specific analyses associated with the different classes of NPS devices (Subheading 3). We note that we only focus on exo-NPS and mechano-NPS here, as these are the newest applications to NPS. Details regarding multi-marker NPS can be found in Balakrishnan et al. [8].
2. Materials
2.1. NPS Measurement Platform
2.1.1. Custom Printed Circuit Board (PCB)
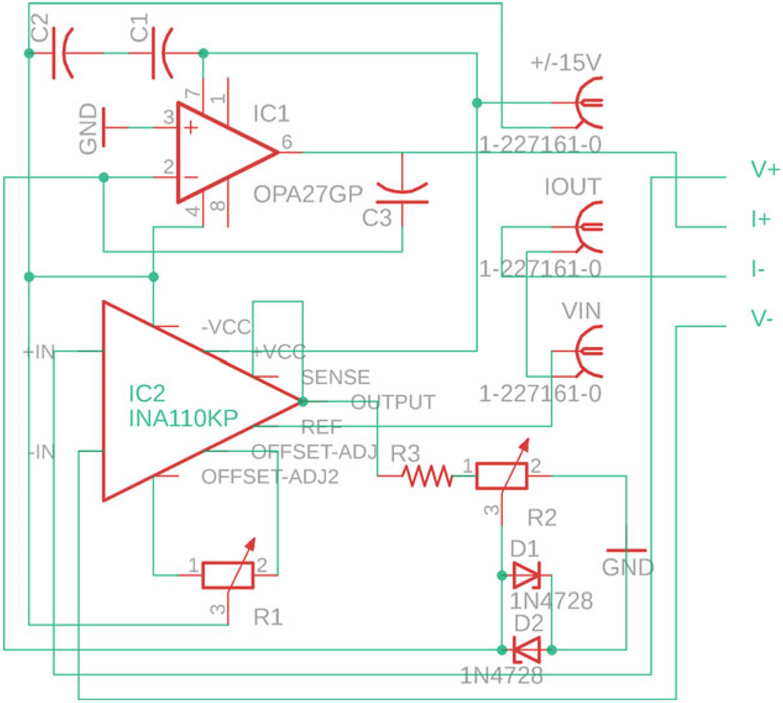
Custom PCB (circuit diagram in Fig. 3).
OPA27GP operational amplifier [IC1 on circuit diagram].
INA110 operational amplifier [IC2 on circuit diagram].
0.33 μF 5% 100 V capacitor (2×) [C1, C2 on circuit diagram].
300 pF 5% 100 V capacitor [C3 on circuit diagram].
100 kΩ 0.5 W trimmer (offset adjust pot) [R1 on circuit diagram].
100 kΩ 0.75 W trimmer (frequency adjust pot) [R2 on circuit diagram].
1 kV diode, general purpose (2×) [D1, D2 on circuit diagram].
PCB BNC connection jack, 50 Ω [±15 V, VIN, IOUT on circuit diagram].
4-position spring piston connector, surface mount (e.g., Preci-Dip 821-S1-004-30-015101).
Fig. 3.
Circuit schematic for custom four-terminal measurement PCB. Refer to Subheading 2.1.1 for a description of required components
2.1.2. Shielded Box and Accessories
BNC cables, shielded, 50 Ω.
Nylon standoffs.
M3 machine screws.
BNC jack-to-jack connection adaptors (Nylon body).
Shielded box to prevent electronic interference.
2.1.3. Equipment and Software
Positive pressure source >3 psi.
Pressure regulator or microfluidic pump (e.g., Elveflow).
MATLAB (r2017b or later).
Windows PC.
NPS suite of MATLAB scripts (Sohn Lab GitHub repository).
DAQ capable of sampling at ≥400 kHz.
BNC cables.
Solder.
Soldering iron.
Spring-loaded clamp to interface with devices.
2.2. NPS Devices
Mylar or quartz/glass masks with desired NPS channel and electrode design (Figs. 4 and 5).
3″ silicon wafers (single-sided polished) (see Note 1).
Glass slides.
Spin coater.
Photoresist (e.g., Shipley S1813 for electrode fabrication; SU-8 for NPS channel fabrication).
UV mask aligner.
Developer (e.g., Microposit MF-321 for electrode fabrication; SU-8 developer for NPS channels).
Thin-film deposition system to deposit titanium, gold, and platinum.
Solvents (acetone, isopropanol, methanol—all CMOS grade).
Polydimethylsiloxane (PDMS, Dow Chemical, 1:10 ratio of crosslinker to base).
Vacuum desiccator.
Hotplate.
Oxygen plasma cleaner.
Wafer dicing saw.
2.3. Consumables
1× Phosphate buffered saline (PBS) solution.
Tween-20.
Colloids (1 μm-diameter paramagnetic, e.g., Dynabeads MyOne T1 Streptavidin) [EV assay only].
Colloids (0.8 μm-diameter, e.g., Bangs Labs PS03004) [EV assay only].
PTFE Tubing (1/16″ OD, 1/32″ ID).
TB syringes.
Biopsy punch (1.2 mm).
20 gauge blunt-tip needles (yellow-tip).
Wash/running buffer: 0.05% Tween-20 + 0.1% BSA in 1× PBS, 0.22 μm filtered [EV assay only] .
2.4. Sample and Sample Preparation
Cells in suspension.
Hemocytometer or automated cell counter.
Cell culture capability (e.g., biosafety cabinet, centrifuge, cell culture reagents such as culture medium, trypsin if using adherent cells, etc.).
3. Methods
We describe first the assembly and operation of the measurement platform common to all NPS applications and then the device design, fabrication, sample preparation, and data processing specific to each NPS application. While Subheadings 3.1 and 3.2 are necessary for all NPS applications, Subheadings 3.3 and 3.4 are independent of one another.
3.1. NPS Device Fabrication
3.1.1. Electrode Fabrication
Pattern S1813 photoresist on 75 mm × 50 mm glass slide using UV mask aligner with the electrode mask.
Sequentially deposit 50 Å Ti, 250 Å Pt, and 250 Å Au on slides using a thin-film deposition system.
Lift off photoresist by soaking for 30 min in acetone.
Rinse with isopropanol then methanol. Dice into individual devices.
3.1.2. SU-8 Master Fabrication (Exo-NPS)
Spin-coat SU-8 2002 to 2 μm thickness and expose using UV mask aligner and quartz/glass mask with appropriate geometry (Fig. 4).
Develop and hard bake according to the SU-8 data sheet.
Spin-coat SU-8 3010 to 20 μm thickness, then align to layer 1 and expose using UV mask aligner and mylar mask with appropriate geometry (Fig. 4).
Develop and hard bake according to the SU-8 data sheet.
Affix wafer to bottom of petri dish using double-sided tape (see Note 2).
3.1.3. SU-8 Master Fabrication (mNPS)
The dimensions of a mechano-NPS microchannel depend on the mean cell diameter, davg, and standard deviation, σ, of the cell population to be measured. davg ± σ can be determined by sampling the population using a Millipore Scepter 2.0 Cell Counter. The height of the SU-8 relief master that will be used to make a mold of the mechano-NPS channel should be >davg + 2σ. The width of the entry and recovery pores should also be >davg + 2σ. The width of the constriction channel should be 0.7davg for an average strain rate of 30%. Node length should be 4davg, and node width should be 6davg.
Spin-coat 3000-series SU-8 to an appropriate film thickness based on measurements made in Subheading 3.1.3, step 1. Bake on a hotplate at a temperature and time according to SU-8 data sheet. Expose SU-8 using UV mask aligner and mylar mask with appropriate geometry (Fig. 5).
Develop and hard bake according to the SU-8 data sheet.
Affix wafer to bottom of petri dish using double-sided tape (see Note 2).
3.1.4. Soft Lithography and Device Assembly
Vigorously mix 20 g PDMS and 2 g PDMS crosslinker.
Pour PDMS onto wafer in petri dish.
Degas PDMS in a vacuum desiccator for 1 h or until no gas bubbles remain.
Bake PDMS at 85 °C on a hotplate for at least 4 h to cross-link fully.
Using a scalpel, cut around outer perimeter of devices and peel PDMS off of wafer.
On a cutting mat, cut out individual devices along border.
Core inlet and outlet holes using a 1.2 mm biopsy punch.
Clean PDMS using scotch tape and place diced device with pre-fabricated electrodes and PDMS face-up in an oxygen plasma cleaner.
Run plasma cleaner for 60 s at a RF power of 30W and O2 flow rate of 5 mL/min.
Within 5 min, carefully align alignment markers on PDMS and electrodes and drop PDMS face-down onto face-up electrode.
Bake at 85 °C on a hotplate for at least 10 min.
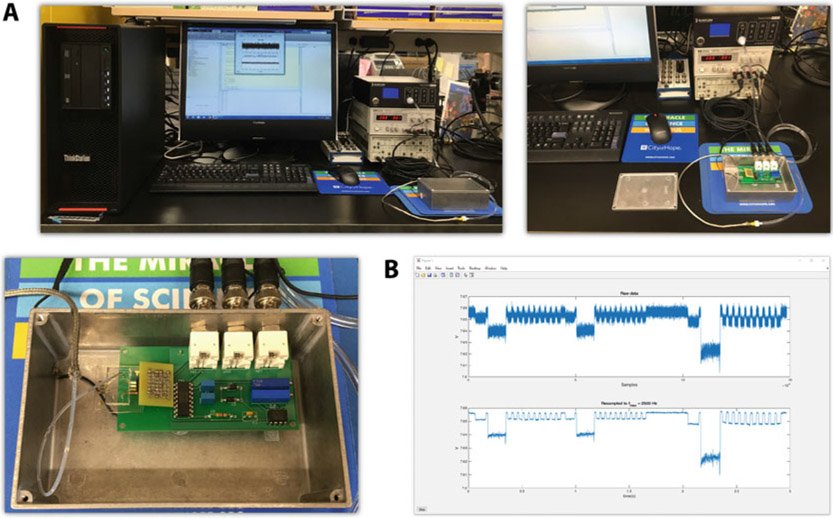
3.2. Assembly and Setup of NPS Measurement Platform (Fig. 6)
Fig. 6.
(a) Photographs of NPS instrumentation in-use (top left), NPS instrumentation with circuit and microfluidic chip visible (top right), and close-up overhead view of electronically insulated box, circuit, and microfluidic chip (bottom left). (b) Example window of custom MATLAB script recording cell transit events through a mechano-NPS device
Solder components to PCB according to the layout in Fig. 3.
Modify the shielded box with through-holes for BNC jack-to-jack connectors and tapped M3 holes to mount the PCB.
Assemble shielded box by installing BNC jack-to-jack connection adaptors in the 0.5″ holes. Mount the PCB in the box using standoffs.
Connect PCB to voltage source and current amplifier and connect current amplifier to DAQ using shielded BNC cables.
Install MATLAB and load “NPS.m” script and dependencies.
Verify that MATLAB communicates with and reads data from instrument (an NPS device filled with PBS can be used for this purpose).
3.3. Node-Pore Sensing for Detection of EVs Displaying Specific Surface Markers (Fig. 4)
Isolate EVs using your choice of method, e.g., Qiagen ExoEasy Maxi kit or Izon qEV size exclusion columns.
If necessary, concentrate EVs to at least 109/mL.
In parallel, functionalize streptavidin-coated 1 μm-diameter paramagnetic colloids with biotinylated antibody for an antigen you wish to use to detect EVs. To functionalize, follow the manufacturer protocol (briefly, wash beads 3× using PBS, then incubate for 30 min with 20 μg antibody per mg of colloids). Use a colloid:EV ratio of approximately 1:100.
Incubate EVs with functionalized colloids in 100 μL isotonic buffer under gentle rocking for 1 h.
Remove unbound EVs by washing three times with “wash/running buffer” using a magnetic rack to retain colloids in solution.
Resuspend EV-decorated colloids in 100 μL “wash/running buffer.”
Add 0.8 μm-diameter colloids at a 1:1 ratio with the number of streptavidin-coated colloids used in Subheading 3.4, step 2.
Cut 25 cm length of PTFE tubing.
Insert blunt-tip 20 ga needle into one end of tubing and attach to 1 mL TB syringe.
Mix well by pipetting the solution against the side of the tube at least 10× immediately prior to loading sample.
Using syringe, draw approx. 30 μL of colloid solution into the tubing (tubing does not need to be completely filled).
Insert filled end of tubing into device inlet. Remove blunt-tip needle from syringe and connect opposite end to pressure regulator or microfluidic pump.
Flow colloid solution through device at 1 psi and begin collecting data at 1 MHz (see Note 3).
Collect data until enough events have been recorded.
Analyze data using MATLAB EV analysis workflow (see readme in Sohn Lab GitHub repository).
3.4. Node-Pore Sensing for Mechanical Phenotyping of Cells (Fig. 5)
Prepare a cell suspension in 1× PBS + 2% fetal bovine serum at a density of 1–5 × 10⁵ cells/mL. Mix thoroughly.
Cut 25 cm length of PTFE tubing.
Insert blunt-tip 20 gauge needle into one end of tubing and attach to 1 mL TB syringe.
Using syringe, draw approx. 10 μL of cell suspension into the tubing (tubing does not need to be completely filled).
Insert filled end of tubing into device inlet. Remove blunt-tip needle from syringe and connect opposite end to pressure regulator or microfluidic pump.
Flow cell suspension through device at an appropriate inlet pressure (0.5–3 psi) (see Note 4).
Adjust input voltage (0.5–2.5 V) and pre-amplifier gain until baseline voltage lies between 5 and 8 V.
Acquire data at an appropriate sampling frequency (50–200 kHz) (see Note 5).
Collect data until enough events have been recorded.
Analyze data using MATLAB mNPS_package analysis pipeline (see readme Sohn Lab GitHub repository).
4. Notes
Wafer can be larger, depending on what the UV mask aligner can accommodate.
It is critical that there is no gap between the wafer and petri dish, or PDMS will fill this space and the wafer will not be adequately supported when cutting out PDMS, leading to the wafer breaking.
A sampling frequency as low as 400 kHz can be used without significant loss of measurement precision.
A higher inlet pressure will increase flow rate and throughput but will usually require a higher sampling frequency. Flowing cells at different inlet pressures will also affect the balance of forces in the channel and may provide different results for mechanical phenotyping.
Oversampling of “slower” signals (at low inlet pressure) can offer improved signal-to-noise ratio by downsampling during post-processing. A sampling frequency of 50 kHz is adequate for inlet pressures between 0.5 and 1.5 psi.
References
- 1.Deblois RW, Bean CP (1970) Counting and sizing of submicron particles by resistive pulse technique. Rev Sci Instrum 41(7):909 [Google Scholar]
- 2.Deblois RW, Bean CP, Wesley RK (1977) Electrokinetic measurements with submicron particles and pores by resistive pulse technique. J Colloid Interface Sci 61:323–335 [Google Scholar]
- 3.Kubitschek HE (1958) Electronic counting and sizing of bacteria. Nature 182 (4630):234–235 [DOI] [PubMed] [Google Scholar]
- 4.Saleh OA, Sohn LL (2001) Quantitative sensing of nanoscale colloids using a microchip Coulter counter. Rev Sci Instrum 72 (12):4449–4451 [Google Scholar]
- 5.Chapman MR, Sohn LL (2011) Label-free resistive-pulse cytometry. Methods Cell Biol 102:127–157. 10.1016/B978-0-12-374912-3.00006-7 [DOI] [PubMed] [Google Scholar]
- 6.Carbonaro A, Mohanty SK, Huang H, Godley LA, Sohn LL (2008) Cell characterization using a protein-functionalized pore. Lab Chip 8(9):1478–1485. 10.1039/b801929k [DOI] [PubMed] [Google Scholar]
- 7.Balakrishnan KR, Anwar G, Chapman MR, Nguyen T, Kesavaraju A, Sohn LL (2013) Node-pore sensing: a robust, high-dynamic range method for detecting biological species. Lab Chip 13(7):1302–1307. 10.1039/c3lc41286e [DOI] [PubMed] [Google Scholar]
- 8.Balakrishnan KR, Whang JC, Hwang R, Hack JH, Godley LA, Sohn LL (2015) Node-pore sensing enables label-free surface-marker profiling of single cells. Anal Chem 87(5):2988–2995. 10.1021/ac504613b [DOI] [PMC free article] [PubMed] [Google Scholar]
- 9.Falcon-Banchs R, Sohn LL, Rivest F (2017) Single-cell label-free profiling. Encyclopedia of analytical chemistry: applications, Theory and Instrumentation. John Wiley & Sons, Ltd., Hoboken, New Jersey [Google Scholar]
- 10.Song Y, Zhang J, Li D (2017) Microfluidic and nanofluidic resistive pulse sensing: a review. Micromachines (Basel) 8(7):204. 10.3390/mi8070204 [DOI] [PMC free article] [PubMed] [Google Scholar]
- 11.Coulter WH, Inventor 1953 [Google Scholar]
- 12.Saleh OA, Sohn LL (2003) An artificial nanopore for molecular sensing. Nano Lett 3(1):37–38 [Google Scholar]
- 13.Kellman M, Rivest F, Pechacek A, Sohn L, Lustig M (2017) Barker-coded node-pore resistive pulse sensing with built-in coincidence correction. Proc IEEE Int Conf Acoust Speech Signal Process 2017:1053–1057. 10.1109/ICASSP.2017.7952317 [DOI] [PMC free article] [PubMed] [Google Scholar]
- 14.Kellman M, Rivest F, Pechacek A, Sohn L, Lustig M (2018) Node-pore coded coincidence correction: Coulter counters, code design, and sparse deconvolution. IEEE Sensors J 18(8):3068–3079. 10.1109/JSEN.2018.2805865 [DOI] [PMC free article] [PubMed] [Google Scholar]
- 15.Keij JF, van Rotterdam A, Groenewegen AC, Stokdijk W, Visser JW (1991) Coincidence in high-speed flow cytometry: models and measurements. Cytometry 12(5):398–404. 10.1002/cyto.990120504 [DOI] [PubMed] [Google Scholar]
- 16.Majumder B, North J, Mavroudis C, Rakhit R, Lowdell MW (2012) Improved accuracy and reproducibility of enumeration of platelet-monocyte complexes through use of doublet-discriminator strategy. Cytometry B Clin Cytom 82(6):353–359. 10.1002/cyto.b.21040 [DOI] [PubMed] [Google Scholar]
- 17.Balakrishnan K, Anwar G, Chapman MR, Ngyuen T, Kesavaraju A, Sohn LL (2013) Node-pore sensing: a robust, high-dynamic range method for detecting biological species. Lab Chip 13(7):1302–1307. 10.1039/C3LC41286E [DOI] [PubMed] [Google Scholar]
- 18.Carey TR, Hall J, Sohn LL (2019) Node-pore sensing device to detect tumor-derived extracellular vesicles. In: Dittrich AH, Delamarche E (eds) The 23rd international conference on miniaturized Systems for Chemistry and Life Sciences. Chemical and Biological Microsystems Society (CBMS), Basel, Switzerland [Google Scholar]
- 19.Kim J, Han S, Lei A, Miyano M, Bloom J, Srivastava V, Stampfer MM, Gartner ZJ, LaBarge MA, Sohn LL (2018) Characterizing cellular mechanical phenotypes with mechano-node-pore sensing. Microsyst Nanoeng 4:17091. 10.1038/micronano.2017.91 [DOI] [PMC free article] [PubMed] [Google Scholar]
- 20.Kim J, Li B, Scheideler OJ, Kim Y, Sohn LL (2019) Visco-node-pore sensing: a microfluidic rheology platform to characterize viscoelastic properties of epithelial cells. iScience 13:214–228. 10.1016/j.isci.2019.02.021 [DOI] [PMC free article] [PubMed] [Google Scholar]


