

Abstract
Objectives
Trends in prevalence and treatments of atherosclerotic cardiovascular disease (ASCVD) remains to be documented, with frequent update of relevant guidelines. We aimed to characterize trends in prevalence of ASCVD, and risk factor control and medications among ASCVD adults.
Methods
We conducted a cross-sectional analysis of data from 55,081 adults in the National Health and Nutrition Examination Surveys (NHANES) 1999–2018.
Results
The age-standardized prevalence of ASCVD did not change significantly from 1999–2002 (7.9 %, 95 % CI 7.1 %–8.7 %) to 2015–2018 (7.5 %, CI 6.8 %–8.3 %) (P for trend =0.18), representing an estimated 19.9 million individuals with ASCVD in 2015–2018. The prevalence of premature ASCVD was 2.0 % (CI, 1.6 %–2.5 %). Over 60.0 % of ASCVD participants were at very-high risk. From 1999–2002 to 2015–2018, the percentage with lipid control (non-high-density lipoprotein cholesterol <100 mg/dL) increased from 7.0 % (CI, 3.5 %–12.3 %) to 26.4 % (CI, 16.2 %–38.9 %). The percentage with blood-pressure control (<130/80 mmHg) increased from 51.2 % (CI, 41.0 %–61.3 %) in 1999–2002 to 57.2 % (CI, 48.4 %–65.6 %) in 2011–2014, but then declined to 52.8 % (CI, 44.4 %–81.3 %) in 2015–2018. The percentage with glycemic control (HbA1c <7.0 %) decreased from 95.0 % (CI, 90.2 %–97.9 %) to 84.0 % (CI, 75.9 %–90.3 %). The percentage who achieved all 3 targets was 18.6 % (CI, 8.2 %–33.8 %) in 2015–2018. The percentage of ASCVD participants who were taking statins increased from 1999–2002 to 2011–2014, but then leveled off. Approximately 60 % of individuals with ASCVD and less than 40 % of those with premature ASCVD were taking statins in 2015–2018. The utilization of blood-pressure-lowering drugs remained largely constant over time, whereas the use of glucose-lowering drugs increased.
Conclusions
Based on NHANES data from US adults, the estimated prevalence of ASCVD remained relatively stable between 1999 and 2018. Substantial undertreatment with stains was found in individuals with ASCVD, and the percentage achieving optimal lipid control was low.
Key words: prevalence, blood pressure, lipid, glucose, medications
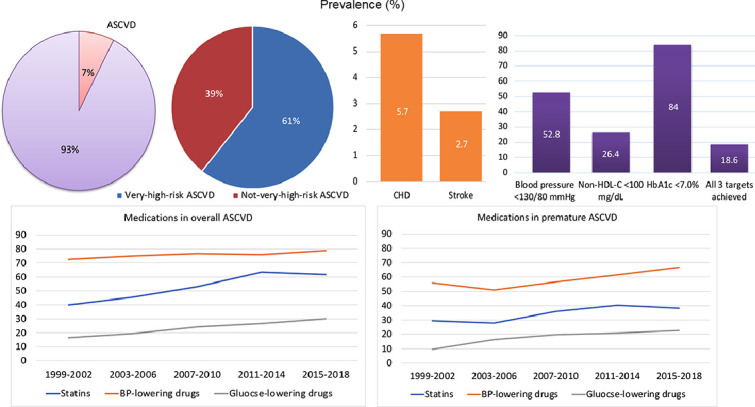
Central Illustration. Prevalence of ASCVD, risk factor control and medications among US adults, 1999–2002 to 2015–2018. The age-standardized prevalence of ASCVD was 7.5 % in 2015–2018, with the prevalence of coronary heart disease (CHD) doubles that of stroke. Among ASCVD adults, 61.0 % were at very-high risk. Blood-pressure, lipid, and glycemic control was achieved in 52.8 %, 26.4 % and 84 % of participants respectively, and 18.6 % of ASCVD participants achieved control of all 3 risk factors in 2015–2018. Trends in medications among US adults with ASCVD and premature ASCVD, 1999–2002 to 2015–2018, showing a lower percentage of medications in participants with premature ASCVD.
1. Introduction
Decades of dedicated efforts in primary and secondary prevention have led to significant declines in cardiovascular (CV) mortality from the 1980s to the 2010s in the United States. Atherosclerotic cardiovascular disease (ASCVD) continues to be the foremost cause of morbidity and mortality [1]. Previous studies have estimated the prevalence of cardiovascular disease, a combination of ASCVD and heart failure [1], but few have documented the prevalence, especially the trends in the prevalence of ASCVD, encompassing coronary heart disease (CHD) and stroke, the top two major contributors to global CV mortality [1]. Over the past decade, there has been a decrease in the prevalence of dyslipidemia and smoking [2]. Concurrently, there has been an increase in the prevalence of obesity and diabetes in United States [3]. The varying temporal changes in these risk factors may impact the overall prevalence of ASCVD.
Additionally, the evolution of risk factor control and medications might have occurred since the last decade due to frequent updates in relevant guidelines. For instance, the 2013 ACC/AHA guideline on blood cholesterol transitioned recommendations from a “low-density lipoprotein cholesterol (LDL-C) target-based” to a “risk-based” approach [4]. Similarly, the 2017 ACC/AHA guideline of high blood pressure (BP) lowered the recommended goal to <130/80 mmHg for all adults on BP-lowering medications [5]. Trends in risk factor control and medications among ASCVD participants, following these guidelines, remain to be determined. The recent 2018 ACC/AHA cholesterol management guideline further categorized patients with ASCVD into those at very-high risk and not-very-high risk [6]. Patients classified as at very-high risk have a threefold greater risk for future ASCVD events [7]. However, the proportion and trends of individuals with very-high-risk ASCVD in the national population of the United States remain unclear.
The objective of this study was to provide nationally representative, contemporary prevalence of ASCVD, describe trends in prevalence, risk factor control and medications, overall and across important subgroups, among adults in the United States from 1999 to 2018.
2. Methods
2.1. Data source and study population
The National Health and Nutrition Examination Surveys (NHANES) is a series of cross-sectional survey conducted every 2-year since 1999 by the National Center for Health Statistics of the Centers for Disease Control and Prevention. Each year, the survey encompasses an approximately 5000-person nationally representative sample [8]. A detailed exposition of the study design and methods has been reported elsewhere [9]. Ethical approval for the NHANES program was obtained from the National Center for Health Statistics Ethics Review Board, and written consent was provided by all participants.
Our study comprised adults aged 20 years or older, excluding pregnant individuals, from 10 consecutive NHANES cycles from 1999-2000 to 2017–2018. ASCVD was ascertained through self-reporting, with participants responding to the questions, “have you ever been told by a doctor or other health care professional that you had stroke, angina, myocardial infarction, or coronary heart disease?” Participants were categorized as having ASCVD if their answer to any of the conditions was “yes”. This widely employed definition has been previously documented [10], [11], [12], [13], [14]. Very-high-risk ASCVD was defined as either multiple major ASCVD events or a singular major ASCVD event coupled with multiple high-risk conditions [15]. Major ASCVD events encompassed recent angina or coronary heart disease (within one year), a history of myocardial infarction, and a history of stroke. High-risk conditions include age ≥65 years, familial hypercholesterolemia, diabetes mellitus, hypertension, chronic kidney disease, persistently elevated LDL-C (≥100 mg/dL) despite maximally tolerated statin therapy and ezetimibe, and a history of congestive heart failure. A sensitivity analysis was also conducted without restricting angina or coronary heart disease to within one year. Premature ASCVD was defined as the occurrence of ASCVD events before 45 years of age.
2.2. Risk factors and outcome measures
BP measurements were acquired using a standardized protocol at a mobile examination center, and the average of all eligible BP readings were calculated. Hypertension was identified by a self-reported history of hypertension, current use of BP-lowering medications, or a mean systolic BP ≥140 mmHg and/or diastolic BP ≥90 mmHg during the examination.
Blood samples were collected during the participant's examination, and laboratory tests on these samples were conducted using standard methods. Extracted data included total cholesterol (TC), high-density lipoprotein cholesterol (HDL-C), LDL-C, triglycerides, glycated hemoglobin (HbA1c), and fasting blood glucose (FBG). Non-HDL-C was calculated as the difference between TC and HDL-C. Diabetes was defined by a self-reported history of diabetes, currently use of glucose-lowering medications, or a FBG ≥126 mg/dL or a HbA1c ≥6.5 %. Hyperlipidemia was defined as a self-reported history of hyperlipidemia or current use of lipid-lowering medications.
Primary BP control was defined as a BP <130/80 mmHg [5], and glycemic control as a HbA1c <7.0 % [16]. The U.S. guideline did not specify target cholesterol levels, but recommended an LDL-C threshold of 70 mg/dL or a non-HDL-C threshold of 100 mg/dL to consider adding nonstatins to statin therapy in ASCVD patients [15]. Therefore, primary lipid control was defined as a non-HDL-C <100 mg/dL. Additionally, we established BP targets of <140/90 mmHg, non-HDL-C targets of <85 and 130 mg/dL [17]. LDL-C was not set as an outcome of lipid control because they were only available in a small subset of participants.
2.3. Medications
The utilization of BP-lowering, glucose-lowering and lipid-lowering medications was assessed through a medication review conducted during a home visit. Participants self-reported medication names, and in some cases, drug containers were presented to the interviewers for verification. Medications were categorized into therapeutic classes using the Multum MediSource Lexicon classification system [18]. BP-lowering medications were categorized as angiotensin-converting enzyme (ACE) inhibitors or angiotensin receptor blockers (ARB), beta blockers, calcium channel blockers (CCB), diuretics, alpha blockers, centrally acting agents, direct vasodilators, renin inhibitors, and others. Glucose-lowering medications were classified as metformin, sulfonylureas, thiazolidinediones (TZD), dipeptidylpeptidase 4 (DPP-4) inhibitors, glucose like peptide-1 (GLP-1) receptor agonists, sodium-glucose co-transporter-2 (SGLT2) inhibitors, insulin, alpha-glucosidase inhibitors, meglitinides, amylin analogs, and others. The study examined the number and classes of BP-lowering and glucose-lowering medications.
2.4. Population subgroups
The analyses were stratified by subgroups based on age (20–44, 45–64, or ≥65 years), sex (male or female), race and ethnicity (non-Hispanic white, non-Hispanic black, Mexican American, other Hispanic, or other/mixed), education (less than high school, high school graduate or general equivalency diploma, some college, or college graduate or higher), body mass index (BMI <25 [normal weight], 25–30 [overweight], or ≥30 [obese]), smoking status (current smoker, former smoker, or never smoked), and family income (income-to-poverty ratio <1.0, 1.0–2.99, 3.0–4.99, or ≥5.0). Race and ethnicity were self-reported, and non-Hispanic Asian was combined with “other race” in the analysis since it became a separate category from other races only after 2011. BMI was calculated as the weight in kilograms divided by height in meters squared. The income to poverty ratio was used to define the socioeconomic status of the family, accounting for household size.
2.5. Statistical analyses
All analyses accounted for the NHANES complex survey design to ensure nationally representative estimates following recommended analytical guidelines, utilizing weights for the interview sample, examination sample, and fasting subsample appropriately [19]. To enhance precision and reduce sampling error, two adjacent 2-year cycles of the continuous NHANES were combined into 4-year intervals [19]. Categorical variables are presented as proportions (95 % CI) and continuous variables as mean (95 % CI). The proportions or means of ASCVD, CV risk factors and risk factor control were separately calculated using data from each of the two 2-year cycles. Stratified analyses with the aforementioned subgroups were conducted. The analyses were age-standardized to the 2000 US Census population with the age categories 20–44 years, 45–64 years, and 65 years or older [20].
The Taylor series (linearization) method was employed to estimate standard errors, and the Korn and Graubard method was used to estimate the 95 % CI for prevalence [21]. Trends over time were analyzed with linear regression models for age- and sex-adjusted means and with logistic regression models for proportions by adding the survey cycle as a continuous variable [22]. Additionally, Joinpoint regression analyses were employed to identify trends in log-transformed age-standardized prevalence between time periods, allowing for 1 joinpoint. The overall trend was initially estimated with no joinpoint and a Monte Carlo permutation test was used to assess the significance of improvement in model fit by adding jointpoints. Factors associated with ASCVD and achieving risk factor control were assessed using multivariate logistic regression models. To increase statistical power, the proportion of risk factor control in subgroups were analyzed by combing all 10 year-cycles. Statistical analyses were performed using Stata software, version 16.0 (StataCorp), Joinpoint Regression Program, version 4.9.1.0 (National Cancer Institute), and data management was conducted with R statistical computing software, version 3.5.2 (R Foundation). All reported P values were based on 2-sided tests, with P <0.05 considered statistically significant.
3. Results
3.1. Participant characteristics
The study involved 55,081 adults for analysis of ASCVD prevalence and 5786 adults with ASCVD for analysis of risk factor control and medications. From 1999 to 2018, the demographic distribution of participants with ASCVD, including age, sex, and risk distributions remained stable. There was an increase in the percentage of ASCVD participants with other/mixed ethnicity, higher education degree and BMI (Table S1).
3.2. Trends in prevalence of ascvd
In 2015–2018, the prevalence of ASCVD among US adults was 7.5 % (95 % CI, 6.8 %–8.3 %), representing an estimated 19.9 million individuals with ASCVD. Approximately 60.0 % of ASCVD participants were classified as at very-high risk. The prevalence of premature ASCVD was 2.0 % (95 % CI, 1.6 %–2.5 %). The prevalence of CHD and stroke was 5.7 % (95 % CI, 5.0 %–6.5 %) and 2.7 % (95 % CI, 2.4 %–3.1 %), respectively. Overall prevalence of ASCVD between 1999 and 2018 was notably higher in older individuals, men, White Americans compared to Mexican Americans and other Hispanic Americans, individuals with lower education levels, those with higher BMI, former and current smoker as opposed to never-smokers, and individuals with lower family income, all following multivariable adjustment (Table 1 and Table S2).
Table 1.
Trends in prevalence of ASCVD among US adults, 1999–2018.
| Adults with ASCVD,% 95 CIa |
||||||
|---|---|---|---|---|---|---|
| Characteristics | 1999–2002 | 2003–2006 | 2007–2010 | 2011–2014 | 2015–2018 | P for trendb |
| No. with ASCVDc | 1090 | 1130 | 1300 | 1069 | 1197 | |
| Overall prevalence | 7.9 (7.1, 8.7) | 8.4 (7.5, 9.3) | 7.7 (7.0, 8.5) | 7.6 (7.0, 8.3) | 7.5 (6.8, 8.3) | 0.18 |
| Age group, yr | ||||||
| 20–44 | 1.5 (1.2, 2.0) | 1.5 (1.0, 2.0) | 1.4 (1.0, 1.9) | 1.7 (1.2, 2.3) | 1.4 (1.0, 1.8) | 0.532 |
| 45–64 | 8.6 (7.1, 10.4) | 8.4 (6.8, 10.1) | 8.2 (7.1, 9.4) | 7.2 (6.3, 8.1) | 8.8 (7.4, 10.3) | 0.648 |
| ≥65 | 24.7 (22.0, 27.5) | 28.4 (25.6, 31.3) | 25.1 (22.2, 28.1) | 25.5 (23.6, 27.5) | 23.0 (20.7, 25.5) | 0.364 |
| Sex | ||||||
| Men | 9.5 (8.3, 10.8) | 9.4 (8.3, 10.6) | 9.4 (8.5, 10.3) | 9.1 (8.2, 10.1) | 9.1 (8.2, 10.2) | 0.026 |
| Women | 6.5 (5.6, 7.4) | 7.6 (6.6, 8.8) | 6.4 (5.5, 7.3) | 6.4 (5.5, 7.4) | 6.1 (5.2, 7.1) | 0.373 |
| Race and ethnicity | ||||||
| Non-Hispanic white | 8.0 (7.1, 9.1) | 8.4 (7.5, 9.5) | 7.6 (6.7, 8.7) | 7.7 (6.8, 8.5) | 7.4 (6.5, 8.4) | 0.088 |
| Non-Hispanic black | 9.0 (7.7, 10.5) | 9.0 (7.8, 10.4) | 8.6 (7.5, 9.9) | 7.8 (6.8, 9.0) | 8.3 (7.2, 9.6) | 0.138 |
| Mexican American | 6.3 (5.3, 7.4) | 7.0 (5.9, 8.3) | 7.2 (5.9, 8.6) | 6.6 (5.3, 8.2) | 5.3 (4.3, 6.6) | 0.836 |
| Other Hispanic | 4.9 (3.1, 7.3) | 3.6 (1.7, 6.5) | 6.4 (5.0, 8.0) | 6.6 (5.1, 8.3) | 7.2 (5.6, 9.2) | 0.084 |
| Other/mixed | 7.7 (4.4, 12.4) | 10.2 (6.2, 15.5) | 7.7 (5.6, 10.4) | 7.2 (5.7, 8.9) | 8.8 (6.5, 11.6) | 0.921 |
| Education level | ||||||
| Less than high school | 10.8 (9.3, 12.4) | 11.4 (9.6, 13.3) | 10.2 (9.1, 11.5) | 9.8 (8.5, 11.2) | 9.4 (7.5, 11.5) | 0.057 |
| High school graduate or GED | 8.3 (7.0, 9.7) | 7.9 (6.4, 9.5) | 8.7 (9.1, 7.3) | 9.5 (8.0, 11.2) | 8.8 (7.4, 10.5) | 0.169 |
| Some college | 7.4 (6.2, 8.8) | 9.1 (8.0, 10.3) | 7.1 (6.2, 8.2) | 6.9 (5.8, 8.2) | 8.1 (7.0, 9.3) | 0.693 |
| College graduate or higher | 5.3 (4.1, 6.7) | 6.0 (4.9, 7.2) | 5.4 (4.5, 6.5) | 5.6 (4.7, 6.6) | 5.2 (4.2, 6.3) | 0.492 |
| BMI range | ||||||
| <25 | 5.8 (4.9, 6.9) | 6.4 (5.4, 7.6) | 6.1 (5.1, 7.2) | 6.4 (5.4, 7.5) | 5.9 (4.9, 7.0) | 0.845 |
| 25–30 | 7.5 (6.5, 8.7) | 8.0 (7.1, 9.1) | 7.1 (6.3, 8.0) | 6.8 (6.0, 7.7) | 6.5 (5.5, 7.6) | 0.062 |
| ≥30 | 9.7 (8.4, 11.2) | 10.1 (8.7, 11.5) | 9.4 (8.3, 10.7) | 9.0 (8.0, 10.0) | 9.0 (8.0, 10.1) | 0.057 |
| Smoking status | ||||||
| Never smoked | 6.3 (5.5, 7.2) | 6.7 (5.8, 7.7) | 6.1 (5.4, 6.9) | 5.8 (5.1, 6.6) | 5.4 (4.8, 6.1) | 0.044 |
| Former smoker | 9.6 (8.3, 11.0) | 9.1 (7.8, 10.6) | 9.5 (8.2, 10.9) | 7.8 (6.7, 8.9) | 9.0 (7.3, 11.0) | 0.211 |
| Current smoker | 9.3 (7.4, 11.5) | 9.7 (7.9, 11.8) | 10.1 (8.7, 11.7) | 12.2 (9.7, 15.1) | 11.6 (9.7, 13.7) | 0.039 |
| Income to poverty ratio | ||||||
| <1.0 | 10.8 (9.0, 12.8) | 12.4 (10.6, 14.5) | 11.9 (10.4, 13.5) | 11.0 (9.4, 12.7) | 10.4 (8.9, 12.1) | 0.389 |
| 1.0–2.99 | 8.8 (7.6, 10.1) | 10.0 (8.8, 11.2) | 8.7 (7.8, 9.7) | 9.7 (8.4, 11.1) | 9.3 (7.9, 10.8) | 0.8 |
| 3.0–4.99 | 6.9 (5.6, 8.4) | 6.5 (4.9, 8.4) | 6.2 (5.1, 7.4) | 6.5 (5.4, 7.7) | 6.1 (4.8, 7.6) | 0.161 |
| ≥5.0 | 6.8 (5.3, 8.6) | 5.9 (4.5, 7.5) | 6.2 (5.0, 7.6) | 4.2 (3.3, 5.3) | 5.4 (4.2, 6.7) | 0.207 |
Abbreviation: ASCVD, atherosclerotic cardiovascular disease; BMI, body mass index; GED, general equivalency diploma.
Estimates were standardized to the 2000 US Census using the age categories 20–44 years, 45–64 years, and 65 years or older.
P values were obtained from the Jointpoint Regression program.
Unweighted number of adults with ASCVD.
The prevalence of ASCVD showed no significant change from 1999-2002 to 2015–2018 (P for trend =0.18). This trend held true for both very-high-risk and not-very-high-risk ASCVD (P for trend =0.44 and 0.15, respectively), as well as for premature ASCVD, CHD and stroke (P for trend =0.19, 0.17 and 0.81, respectively) (Fig. 1). When CHD events were not restricted to within one year, 8.7 % of adults with ASCVD experienced multiple ASCVD events, 61.4 % had one ASCVD event and multiple high-risk conditions, and 9.3 % had one ASCVD event but no high-risk conditions in 2015–2018 (Figure S1). The percentage of ASCVD participants with multiple high-risk conditions or multiple events increased after 2007–2010 (Figure S1). No significant trends were observed in prevalence of ASCVD across cycles when stratified by age group, race and ethnicity, education level, and family income (Table 1). Age-standardized ASCVD prevalence did not significantly change for women, but a decreasing trend was detected in men (P for trend =0.026). The prevalence of ASCVD decreased in participants who never smoked but increased in current smokers from 1999-2002 to 2015–2018 (P for trend =0.044 and 0.039, respectively).
Fig. 1.

Trends in prevalence of ASCVD among US adults, 1999–2002 to 2015–2018. ASCVD, atherosclerotic cardiovascular disease; CHD, coronary heart disease.
3.3. Trends in risk factor control
For analysis of risk factor control, we included 5391 participants with diagnosed ASCVD from the examination sample. Missing data were identified for BP (n = 291 [5.4 %]), HbA1c (n = 285 [5.3 %]), and non-HDL-C (n = 380 [7.0 %]). The age-adjusted mean HbA1c increased from 5.6 % in 1999–2002 to 6.2 % in 2015–2018, along with FBG, waist circumference and BMI (all P for trend <0.001). The age-adjusted mean non-HDL-C decreased from 160.1 mg/dL in 1999–2002 to 128.6 mg/dL in 2015–2018 (P for trend <0.001). Similar decreasing trends were found for TC and triglycerides. There were no statistically significant linear trends in overall BP across year cycles, but mean BP increased after 2010 (Table S3). Participants with premature ASCVD exhibited trends similar to the overall population across these factors but demonstrated higher non-HDL-C levels in the most recent two cycles compared to the general ASCVD population (Table S4).
The percentage of adults achieving BP control of <130/80 mmHg increased from 51.2 % (95 % CI 41.0 %–61.3 %) in 1999–2002 to 57.2 % (95 % CI 48.4 %–65.6 %) in 2011–2014, but then declined to 52.8 % (95 % CI 44.4 %–81.3 %) in 2015–2018 (Fig. 2). The percentage of adults achieving lipid control (non-HDL-C <100 mg/dL) increased from 7.0 % (95 % CI 3.5 %–12.3 %) in 1999–2002 to 26.4 % (95 % CI 16.2 %–38.9 %) in 2015–2018 (P for trend <0.001). The percentage of adults achieving HbA1c <7.0 % decreased from 95.0 % (95 % CI 90.2 %–97.9 %) to 84.0 % (95 % CI 75.9 %–90.3 %) (P for trend <0.001), likely due to a remarkable increase in prevalence of diabetes. The percentage of participants achieving control of all 3 risk factors (HbA1c <7.0 %, BP <130/80 mmHg and non-HDL-C <100 mg/dL) increased from 4.8 % (95 % CI 1.8 %–10.3 %) to 18.6 % (95 % CI 8.2 %–33.8 %) (P for trend <0.001) (Fig. 2, Table S5). Participants with premature ASCVD demonstrated lower percentage of risk factor control in 2015–2018 compared to the general ASCVD population (Table S6).
Fig. 2.

Trends in risk factor control among US adults with ASCVD, 1999–2002 to 2015–2018. ASCVD, atherosclerotic cardiovascular disease.
Subgroup estimates for risk factor control are presented in Table 2, combing data from the entire study period. Older adults were less likely to achieve the primary BP target compared to younger adults (odds ratio [OR], 0.47 [95 % CI, 0.32–0.68]). Women were more likely to achieve glycemic target than men (OR, 2.0 [95 % CI, 1.41–2.82]). Non-Hispanic Black Americans were less likely to achieve the primary BP target compared to non-Hispanic White individuals (OR, 0.63 [95 % CI, 0.53–0.77]), but were more likely to achieve the primary lipid target (OR, 1.61 [95 % CI, 1.17–2.22]). All other races, compared to non-Hispanic White, were less likely to achieve glycemic target. Adults with higher BMI, lower education level, and lower income were less likely to achieve ≥2 of the 3 risk factor targets (Table 2 and Table S7).
Table 2.
Prevalence of achieving risk factor control among US adults with ASCVD, 1999–2018.
| Adults with ASCVD,% (95 % CI)a |
|||||||
|---|---|---|---|---|---|---|---|
| Characteristics | BP <130/80 mmHg | BP <140/90 mmHg | Non-HDL-C <100 mg/dL | Non-HDL-C <130 mg/dL | HbA1c <7.0 % | HbA1c <7 %, BP <130/80 mmHg, non-HDL-C < 100 mg/dL | HbA1c <7 %, BP <130/80 mmHg, non-HDL-C < 130 mg/dL |
| No.b | 5100 | 5100 | 5011 | 5011 | 5106 | 4778 | 4778 |
| Overall prevalence | 55.4 (51.4, 59.3) | 76.9 (74.0, 79.7) | 20.3 (16.6, 24.5) | 46.1 (40.8, 51.4) | 88.4 (84.9, 91.4) | 14.1 (10.4, 18.4) | 27.2 (22.3, 32.7) |
| Age group, yr | |||||||
| 20–44 | 62.6 (55.0, 70.0) | 82.8 (77.2, 87.4) | 20.3 (13.3, 28.9) | 44.1 (34.3, 54.2) | 91.8 (81.9, 96.5) | 17.6 (10.8, 26.2) | 31.6 (22.7, 41.7) |
| 45–64 | 50.0 (46.4, 53.4) | 75.2 (72.2, 78.0) | 15.9 (12.2, 20.2) | 43.3 (38.6, 48.2) | 83.5 (79.5, 87.1) | 9.2 (6.4, 12.7) | 22.2 (17.8, 27.2) |
| ≥65 | 43.9 (41.6, 46.1) | 63.2 (60.9, 65.5) | 28.2 (24.7, 31.9) | 56.7 (53.3, 60.1) | 87.3 (84.6, 89.7) | 12.4 (10.1, 15.1) | 23.3 (20.3, 26.5) |
| Sex | |||||||
| Men | 51.2 (45.8, 56.5) | 77.8 (74.0, 81.4) | 18.7 (13.7, 24.7) | 38.9 (32.1, 46.0) | 85.0 (78.1, 90.3) | 12.5 (7.6, 18.9) | 20.3 (14.6, 27.1) |
| Women | 59.0 (54.4, 63.4) | 75.5 (71.6, 79.1) | 20.5 (14.9, 27.0) | 50.3 (43.1, 57.4) | 91.6 (88.8, 93.9) | 14.5 (9.5, 20.9) | 32.1 (25.0, 40.0) |
| Race and ethnicity | |||||||
| Non-Hispanic white | 57.8 (52.2, 63.4) | 81.1 (77.7, 84.3) | 18.8 (13.8, 24.7) | 44.0 (36.7, 51.6) | 90.7 (85.9, 94.2) | 14.2 (9.3, 20.3) | 27.7 (20.9, 35.3) |
| Non-Hispanic black | 42.0 (36.5, 47.7) | 59.8 (53.8, 65.6) | 27.3 (18.6, 37.5) | 48.5 (38.7, 58.4) | 83.4 (75.1, 89.9) | 15.3 (8.2, 25.2) | 23.8 (15.2, 34.3) |
| Mexican American | 57.7 (49.6, 65.6) | 74.9 (67.0, 81.8) | 21.9 (12.6, 34.0) | 49.7 (36.2, 63.3) | 77.8 (65.2, 87.4) | 13.1 (5.4, 25.3) | 26.6 (15.5, 40.2) |
| Other Hispanic | 59.9 (47.4, 71.6) | 72.7 (58.5, 84.2) | 20.1 (9.3, 35.4) | 42.9 (28.0, 58.9) | 83.8 (70.4, 92.8) | 13.6 (4.2, 30.0) | 25.9 (13.2, 42.4) |
| Other/mixed | 51.8 (38.5, 64.9) | 81.5 (72.6, 88.4) | 19.5 (8.8, 35.0) | 61.9 (41.9, 79.3) | 89.8 (83.2, 94.5) | 5.7 (1.5, 14.5) | 22.7 (8.0, 44.9) |
| Education level | |||||||
| Less than high school | 53.7 (47.2, 60.1) | 73.7 (69.1, 78.0) | 17.8 (11.6, 25.5) | 45.2 (36.6, 54.0) | 89.0 (85.2, 92.2) | 11.2 (5.9, 18.9) | 27.6 (19.3, 37.2) |
| High school graduate or GED | 51.3 (44.2, 58.4) | 75.0 (68.4, 80.8) | 19.9 (13.6, 27.6) | 44.9 (35.9, 54.2) | 86.8 (79.6, 92.2) | 13.6 (7.3, 22.5) | 26.1 (17.7, 35.9) |
| Some college | 55.9 (49.2, 62.5) | 76.8 (71.8, 81.3) | 21.7 (14.8, 30.2) | 47.2 (37.9, 56.6) | 88.4 (81.4, 93.5) | 15.0 (8.0, 24.5) | 27.1 (19.5, 35.9) |
| College graduate or higher | 66.1 (57.2, 74.2) | 86.6 (82.5, 90.1) | 20.9 (11.1, 33.9) | 45.0 (29.1, 61.6) | 89.7 (81.5, 95.2) | 15.4 (6.3, 29.5) | 25.2 (13.2, 40.9) |
| BMI range | |||||||
| <25 | 64.8 (58.5, 70.7) | 79.4 (73.9, 84.1) | 40.4 (28.5, 53.3) | 65.7 (54.7, 75.6) | 95.8 (91.8, 98.2) | 29.5 (18.3, 43.0) | 46.1 (34.2, 58.3) |
| 25–30 | 57.9 (50.2, 65.3) | 78.7 (72.3, 84.1) | 17.1 (11.0, 24.8) | 50.3 (39.1, 61.5) | 93.8 (90.2, 96.4) | 12.5 (7.0, 20.0) | 30.9 (21.1, 42.2) |
| ≥30 | 50.7 (45.4, 55.9) | 75.5 (72.6, 79.1) | 15.5 (11.1, 20.9) | 37.3 (31.2, 43.8) | 81.9 (75.3, 87.4) | 9.5 (5.1, 15.9) | 18.6 (13.2, 25.1) |
| Smoking status | |||||||
| Never smoked | 54.3 (48.6, 60.0) | 77.5 (73.6, 81.0) | 20.2 (13.4, 28.5) | 44.4 (35.3, 53.8) | 87.3 (82.0, 91.5) | 14.3 (8.0, 22.9) | 27.2 (19.1, 36.6) |
| Former smoker | 53.7 (45.3, 61.9) | 75.6 (68.6, 81.8) | 22.9 (13.6, 34.6) | 46.9 (35.0, 59.0) | 82.9 (69.6, 92.1) | 17.6 (8.9, 29.9) | 25.9 (16.1, 37.8) |
| Current smoker | 57.7 (51.5, 63.7) | 77.2 (71.9, 81.9) | 19.0 (12.6, 26.7) | 46.0 (38.4, 53.8) | 92.7 (89.3, 95.3) | 11.9 (6.5, 19.3) | 28.0 (20.8, 36.1) |
| Income to poverty ratio | |||||||
| <1.0 | 56.1 (50.5, 61.6) | 71.4 (66.7, 75.8) | 20.1 (13.8, 27.7) | 44.1 (36.5, 51.9) | 89.4 (85.6, 92.5) | 13.8 (8.0, 21.9) | 25.3 (17.8, 34.1) |
| 1.0–2.99 | 51.1 (44.8, 57.3) | 76.5 (72.2, 80.5) | 21.0 (14.6, 28.6) | 41.0 (33.3, 48.9) | 87.5 (82.4, 91.6) | 14.0 (8.3, 21.7) | 21.7 (15.1, 29.5) |
| 3.0–4.99 | 61.3 (51.8, 70.2) | 81.6 (74.3, 87.6) | 24.5 (10.8, 43.4) | 56.1 (40.2, 71.2) | 91.2 (84.7, 95.6) | 20.7 (7.7, 40.3) | 36.2 (20.7, 54.2) |
| ≥5.0 | 53.9 (38.3, 69.1) | 84.3 (77.7, 89.5) | 11.7 (8.0, 16.2) | 40.5 (25.4, 57.0) | 83.7 (61.6, 95.9) | 7.0 (4.2, 10.8) | 23.7 (13.2, 37.2) |
| Medications | |||||||
| Yes | 47. 3 (42.1, 52.6) | 71.0 (66.0, 75.7) | 27.0 (18.0, 37.6) | 57.2 (44.4, 69.3) | 32.1 (20.5, 45.6) | – | – |
| No | 60.9 (56.0, 65.5) | 82.4 (79.0, 85.5) | 13.4 (9.2, 18.2) | 34.9 (29.1, 41.0) | 97.5 (95.8, 98.7) | – | – |
Abbreviation: ASCVD, atherosclerotic cardiovascular disease; BMI, body mass index; BP, blood pressure; GED, general equivalency diploma; HbA1c, glycated hemoglobin (HbA1c); Non-HDL-C, non-high-density lipoprotein cholesterol.
Prevalence estimates were standardized to the 2000 US Census using the age categories 20–44 years, 45–64 years, and 65 years or older.
Unweighted number of adults with ASCVD.
Compared to ASCVD adults not at very-high risk, very-high-risk adults were less likely to achieve the primary BP target (OR, 0.78 [95 % CI, 0.68–0.90]), glycemic target (OR, 0.64 [95 % CI, 0.46–0.91]), and all 3 risk factor targets (OR, 0.63 [95 % CI, 0.42–0.94]) (Table S8), while achieving the primary lipid target similarly (OR, 1.06 [95 % CI 0.79–1.43]). The trends of risk factor control, absolute values and trends of lipids, BP, glucose and other variables among ASCVD adults, overall and stratified by ASCVD risk, are shown in Table S9 and S10, and Figure S2 and S3. Compared with adults with stroke, those with CHD were more likely to achieve BP and lipid targets, and those with both CHD and stroke were more likely to achieve lipid target (Table S11).
3.4. Trends in medications
The distribution of medications among adults with ASCVD is shown in Fig. 3. The percentage of ASCVD participants taking statins increased from 40.1 % in 1999–2002 to 63.4 % in 2011–2014, but plateaued thereafter (P for trend <0.001). Ezetimibe use rose to 7.0 % in 2007–2010 but declined to 1.6 % in 2015–2018. The frequency of BP-lowering medications remained relatively stable, ranging from 72.6 % to 78.8 % from 1999-2002 to 2015–2018 (P for trend =0.06). The use of ACE inhibitors or ARB and beta-blockers increased over time, while frequencies of diuretics and CCB decreased. The frequency of any glucose-lowering medication increased from 16.6 % in 1999–2002 to 30.1 % in 2015–2018 (P for trend <0.001). The use of metformin, SGLT2 inhibitors or GLP-1, and DPP-4 inhibitors increased, while the use of thiazolidinediones and sulfonylureas decreased since the last decade. Participants with premature ASCVD demonstrated lower percentage of medications compared to the overall ASCVD population (Figure S4). Participants taking statins exhibited a notably higher percentage of lipid control compared to those not taking statins (27.0 % % vs. 13.4 % for non-HDL-C <100 mg/dL). Converse findings were found in participants using BP-lowering and glucose-lowering medications (Table 2), likely attributed to the higher prevalence of hypertension and diabetes among these participants.
Fig. 3.

Trends in medications among US adults with ASCVD, 1999–2002 to 2015–2018. (A) Lipid-lowering medications. (B) Blood-pressure-lowering medications. (C) Glucose-lowering medications. ASCVD, atherosclerotic cardiovascular disease.
There was no significant linear trend in the use of 1, 2, or 3 or more classes of BP-lowering medications (Figure S5). The percentage of adults receiving combination BP-lowering therapy declined after 2007–2010. 50.5 % of individuals were on combination BP-lowering therapy in 2015–2018. The proportion of ASCVD adults taking 1, 2, or 3 or more classes of glucose-lowering medications significantly increased across cycles (Figure S6). 13.5 % of individuals were on combination glucose-lowering medications in 2015–2018.
In adults who did not achieve risk factor control, those with younger age, women, non-Hispanic black, Mexican American, lower BMI and income were less likely to receive statins. Adults with younger age and lower BMI were also less likely to receive BP-lowering treatment than their corresponding comparators (Table S12). Non-Hispanic Black individuals were less likely to receive combination glucose-lowering therapy but were more likely to receive combination BP-lowering therapy when targets were not achieved (Table S12). Adults with stroke were less likely to receive statins and combination BP-lowering therapy than those with CHD (Table S13).
4. Discussion
In this nationally representative serial cross-sectional study involving 55,081 adults, the age-standardized prevalence of ASCVD remained relatively stable from 1999-2002 to 2015–2018, representing an estimated 19.9 million individuals with ASCVD in 2015–2018. The prevalence of premature ASCVD was 2.0 %, and the prevalence of CHD was twice that of stroke. The stability in ASCVD prevalence persisted across various subgroups. After 2010–2014, there were notable declines in BP and glycemic control, while lipid control showed a slight increase. Notably, fewer than 20 % of ASCVD participants achieved control over all 3 risk factors in 2015–2018. According to recent US guideline, 60.0 % of ASCVD participants were categorized as at very-high risk. The percentage of ASCVD participants taking statins leveled off after 2014, and ezetimibe use decreased after 2010. Only 60 % of individuals with ASCVD and less than 40 % of those with premature ASCVD were taking statins in 2015–2018. The percentage using any BP-lowering drugs remained largely constant, while the use of any glucose-lowering drugs increased from 1999-2002 to 2015–2018 (Central Illustration). Disparities in achieving risk factor control and medications were observed across age, racial or ethnic, gender, BMI, education, and income groups.
The study revealed that over 60 % of ASCVD participants were at very-high risk, with ∼10 % experiencing multiple ASCVD events and ∼50 % having one ASCVD event along with multiple high-risk conditions. This percentage slightly exceeded findings from other US-based studies, which reported percentages ranging from 43.0 % to 58.0 % [7,23,24]. Among very-high-risk ASCVD, 17.0 % to 27.0 % experienced multiple ASCVD events [7,[23], [24], [25]]. One potential explanation for the slight disparity could be that other studies only included patients with health insurance [7,23]. Notably, our study provided the first nationally representative estimates of very-high-risk ASCVD, distinguishing it from localized studies. The increase in percentage of participants with multiple ASCVD events or one ASCVD event and multiple high-risk conditions after 2007–2010, when CHD events were not restricted to within 1 year, could be attributed to the persistently elevated prevalence of diabetes [26], chronic kidney disease [27] and obesity [1], along with decreased BP control after 2010 [28].
The relatively stable prevalence of ASCVD in the US contrasts with a remarkable increase in some other countries, such as China. In China, prevalent cases doubled, and age-standardized ASCVD prevalence significantly increased by 15 % from 1990 to 2016 [29]. This discrepancy can be attributed to various factors, including increased population growth and aging, prolonged life expectancy, concurrent declining cardiovascular mortality [29], and a low proportion of ideal cardiovascular health in these countries [30]. It's noteworthy that in the US, CHD remains the most common type of ASCVD, being twice as prevalent as stroke, whereas in China, stroke is more common than CHD [29].
We observed a substantial increase of lipid control among ASCVD adults from 1999-2002 to 2015–2018, with the magnitude of increment decreasing after 2006. The cardiovascular benefits of intensive lipid control in ASCVD patients have been evidenced [31,32] and followed by worldwide recommendations [15,16]. The ESC/EAS guideline recommends a non-HDL-C target of <85 mg/dL in very-high-risk ASCVD participants[16], and only 7.7 % of participants in the US achieved this target. It is noteworthy that as of 2015–2018, only approximately 60 % of individuals with ASCVD are on a statin, indicating significant underutilization considering statins are a cornerstone treatment for all ASCVD participants unless intolerable. Similarly, in a NHANES study involving participants with diabetes and indications for statin therapy, only 51.1 % were receiving statin therapy [33]. Participants with premature ASCVD demonstrated even lower percentage of statin use and risk factor control in 2015–2018 compared to the general ASCVD population. These findings underscore the importance of sustained efforts to enhance the implementation of evidence-based medical care.
BP control declined after 2014, following a steady but slight increase from 1999-2002 to 2010–2014. A similar estimated proportion of adults had controlled BP in 2015–2018 as in 1999–2002. The trends of BP control in ASCVD adults were in line with those observed in the general population with hypertension [28], but the control rate was higher in ASCVD participants. These changes might be attributable to the updates of guideline recommendations on BP definition and control targets. The shift toward less intensive treatment of hypertension, recommended by the eighth Joint National Committee (JNC 8) in late 2013 [34] than JNC 7 [35], might result in reduced BP control with current goals.
Although the proportion of ASCVD participants achieving controls of all 3 risk factors has been increasing, the absolute proportion remains low (<20 %). Recent declines in glycemic and BP control after 2010 to 2014, along with the worsening of other risk factors such as obesity [1], might portend a possible population-level increase in ASCVD-related morbidity and mortality. Indeed, global burden of CVD analyses revealed that age-standardized mortality from ischemic heart disease began to increase since 2014, particularly in parts of the US and United Kingdom [10]. Despite having a 3-fold higher risk of ASCVD events [7], very-high-risk ASCVD adults who achieved risk factor control decreased after 2014. These findings emphasize crucial reminder to both physicians and patients to implement existing effective pharmacologic and lifestyle therapies to this large ASCVD population. The update of various guidelines with more rigorous targets for risk factor control [5,15] should provide some optimism about the future of ASCVD in the US.
Younger adults were significantly less likely to achieve lipid target, likely due to less statin therapy. Although the younger cohort was more likely to achieve BP target (likely due to lower baseline BP), those with unmet target were receiving fewer BP-lowering treatments than their older counterparts. Younger adults with CHD had similar CV mortality [36], and those with stroke had an excess mortality compared to older individuals [37]. The potential loss of lifetime productivity and greater lifetime financial burden in younger adults with ASCVD [38] emphasize the need for early detection and management in these populations.
5. Strengths and limitations
This study has several strengths. NHANES is a large, nationally representative survey with a standardized protocol and rigorous quality control. Our analyses involved a large sample of adults with ASCVD collected from a continuous national survey, allowing for comprehensive analysis of trends in prevalence, risk factor control, and medications over a 20-year period.
However, this study also has limitations. First, analyses were based on self-reported ASCVD, which might cause misclassification or underestimation; however, self-reported CHD, myocardial infarction, and stroke have been reported as reliable [39], [40], [41]. Second, our study's definition of ASCVD did not include transient ischemic attack or peripheral artery disease, but this definition has also been widely used [10], [11], [12], [13], [14] and reflects CVD that causes major global mortality [10]. Third, NHANES did not capture dosages of statins, precluding an analysis of trends in use of high-intensity statins. Fourth, we did not perform adjustment for multiple comparisons, potentially introducing type I error. Fifth, we acknowledge the potential impact of healthcare accessibility on ASCVD prevalence. However, participants without regular access to healthcare are likely to be underrepresented in reporting ASCVD, introducing a potential bias in subgroup analysis based on healthcare access. Therefore, we refrained from presenting these subgroup analysis results.
6. Conclusions
In this nationally representative survey of US adults from 1999 through 2018, the estimated prevalence of ASCVD remained relatively stable. Substantial undertreatment with stains was found in individuals with ASCVD, and the percentage achieving optimal lipid control was low.
CRediT authorship contribution statement
Xiaowen Zhang: Writing – original draft, Software, Methodology, Investigation, Funding acquisition, Formal analysis, Data curation, Conceptualization. Zheng Chen: Methodology, Formal analysis. Aijuan Fang: Writing – review & editing, Investigation, Formal analysis. Lina Kang: Writing – review & editing, Methodology, Investigation. Wei Xu: Supervision, Resources, Data curation. Biao Xu: Supervision, Project administration. Jianzhou Chen: Writing – review & editing, Validation, Resources, Methodology, Investigation, Conceptualization. Xinlin Zhang: Writing – review & editing, Writing – original draft, Validation, Supervision, Methodology, Investigation, Funding acquisition, Formal analysis, Data curation, Conceptualization.
Declaration of competing interest
The authors declare that they have no known competing financial interests or personal relationships that could have appeared to influence the work reported in this paper.
Acknowledgments
Acknowledgements
We thank Jing Zhang from Shanghai Tongren Hospital for his help in data extraction from the NHANES database.
Funding
This work was partly supported by Fundings for Clinical Trials from the Affiliated Drum Tower Hospital, Nanjing University School of Medicine (2022-LCYJ-PY-06 and 2022-YXZX-NFM-02).
Footnotes
Supplementary material associated with this article can be found, in the online version, at doi:10.1016/j.ajpc.2024.100634.
Contributor Information
Jianzhou Chen, Email: njucjz@126.com.
Xinlin Zhang, Email: xinlzhang0807@gmail.com.
Appendix. Supplementary materials
References
- 1.Tsao C.W., Aday A.W., Almarzooq Z.I., et al. Heart disease and stroke statistics-2022 update: a report from the American heart association. Circulation. 2022;145:e153–e639. doi: 10.1161/CIR.0000000000001052. [DOI] [PubMed] [Google Scholar]
- 2.Rosinger A., Carroll M.D., Lacher D., Ogden C. Trends in total cholesterol, triglycerides, and low-density lipoprotein in US adults, 1999-2014. JAMA Cardiol. 2017;2:339–341. doi: 10.1001/jamacardio.2016.4396. [DOI] [PMC free article] [PubMed] [Google Scholar]
- 3.Ogden C.L., Fryar C.D., Martin C.B., et al. Trends in obesity prevalence by race and Hispanic origin-1999-2000 to 2017-2018. JAMA. 2020;324:1208–1210. doi: 10.1001/jama.2020.14590. [DOI] [PMC free article] [PubMed] [Google Scholar]
- 4.Stone N.J., Robinson J.G., Lichtenstein A.H., et al. 2013 ACC/AHA guideline on the treatment of blood cholesterol to reduce atherosclerotic cardiovascular risk in adults: a report of the American college of cardiology/American heart association task force on practice guidelines. Circulation. 2014;129:S1–45. doi: 10.1161/01.cir.0000437738.63853.7a. [DOI] [PubMed] [Google Scholar]
- 5.Whelton P.K., Carey R.M., Aronow W.S., et al. 2017 ACC/AHA/AAPA/ABC/ACPM/AGS/APhA/ASH/ASPC/NMA/PCNA guideline for the prevention, detection, evaluation, and management of high blood pressure in adults: executive summary: a report of the American college of cardiology/American heart association task force on clinical practice guidelines. Circulation. 2018;138:e426–ee83. doi: 10.1161/CIR.0000000000000597. [DOI] [PubMed] [Google Scholar]
- 6.Grundy S.M., Stone N.J., Bailey A.L., et al. 2018 AHA/ACC/AACVPR/AAPA/ABC/ACPM/ADA/AGS/APhA/ASPC/NLA/PCNA guideline on the management of blood cholesterol: a report of the American college of cardiology/American heart association task force on clinical practice guidelines. J Am Coll Cardiol. 2019;73:e285–e350. doi: 10.1016/j.jacc.2018.11.003. [DOI] [PubMed] [Google Scholar]
- 7.Colantonio L.D., Shannon E.D., Orroth K.K., et al. Ischemic event rates in very-high-risk adults. J Am Coll Cardiol. 2019;74:2496–2507. doi: 10.1016/j.jacc.2019.09.025. [DOI] [PubMed] [Google Scholar]
- 8.Centers for Disease Control and Prevention. NHANES survey methods and analytic guidelines. Accessed July 2, 2022. https://wwwn.cdc.gov/nchs/nhanes/analyticguidelines.aspx.
- 9.Curtin L.R., Mohadjer L.K., Dohrmann S.M., et al. The National health and nutrition examination survey: sample design, 1999-2006. Vital Health Stat. 2012;2:1–39. [PubMed] [Google Scholar]
- 10.Roth G.A., Mensah G.A., CO Johnson, et al. Global burden of cardiovascular diseases and risk factors, 1990-2019: update from the GBD 2019 study. J Am Coll Cardiol. 2020;76:2982–3021. doi: 10.1016/j.jacc.2020.11.010. [DOI] [PMC free article] [PubMed] [Google Scholar]
- 11.Jain V., Al Rifai M., Turpin R., et al. Evaluation of factors underlying sex-based disparities in cardiovascular care in adults with self-reported premature atherosclerotic cardiovascular disease. JAMA Cardiol. 2022;7:341–345. doi: 10.1001/jamacardio.2021.5430. [DOI] [PMC free article] [PubMed] [Google Scholar]
- 12.Al Rifai M., Blaha M.J., Nambi V., et al. Determinants of incident atherosclerotic cardiovascular disease events among those with absent coronary artery calcium: multi-Ethnic Study of Atherosclerosis. Circulation. 2022;145:259–267. doi: 10.1161/CIRCULATIONAHA.121.056705. [DOI] [PMC free article] [PubMed] [Google Scholar]
- 13.Chobufo M.D., Regner S.R., Zeb I., Lacoste J.L., Virani S.S., Balla S. Burden and predictors of statin use in primary and secondary prevention of atherosclerotic vascular disease in the US: from the National health and nutrition examination survey 2017-2020. Eur J Prev Cardiol. 2022;29:1830–1838. doi: 10.1093/eurjpc/zwac103. [DOI] [PubMed] [Google Scholar]
- 14.Jain V., Rifai M.A., Brinzevich D., et al. Association of premature atherosclerotic cardiovascular disease with higher risk of cancer: a behavioral risk factor surveillance system study. Eur J Prev Cardiol. 2022;29:493–501. doi: 10.1093/eurjpc/zwab084. [DOI] [PubMed] [Google Scholar]
- 15.Grundy S.M., Stone N.J., Bailey A.L., et al. 2018 AHA/ACC/AACVPR/AAPA/ABC/ACPM/ADA/AGS/APhA/ASPC/NLA/PCNA Guideline on the management of blood cholesterol: a report of the American college of cardiology/American heart association task force on clinical practice guidelines. Circulation. 2019;139:e1082–ee143. doi: 10.1161/CIR.0000000000000625. [DOI] [PMC free article] [PubMed] [Google Scholar]
- 16.Mach F., Baigent C., Catapano A.L., et al. 2019 ESC/EAS Guidelines for the management of dyslipidaemias: lipid modification to reduce cardiovascular risk. Eur Heart J. 2020;41:111–188. doi: 10.1093/eurheartj/ehz455. [DOI] [PubMed] [Google Scholar]
- 17.Williams B., Mancia G., Spiering W., et al. 2018 ESC/ESH guidelines for the management of arterial hypertension. Eur Heart J. 2018;39:3021–3104. doi: 10.1093/eurheartj/ehy339. [DOI] [PubMed] [Google Scholar]
- 18.Multum C. Drug database. Accessed July 2, 2022. https://www.cerner.com/solutions/drug-database.
- 19.Johnson C.L., Paulose-Ram R., Ogden C.L., et al. National health and nutrition examination survey: analytic guidelines, 1999-2010. Vital Health Stat. 2013;2:1–24. [PubMed] [Google Scholar]
- 20.Klein R.J., Schoenborn C.A. Age adjustment using the 2000 projected U.S. population. Healthy People 2010 Stat Notes. 2001:1–10. [PubMed] [Google Scholar]
- 21.Parker J.D., Talih M., Malec D.J., et al. National Center for health statistics data presentation standards for proportions. Vital Health Stat. 2017;2:1–22. [PubMed] [Google Scholar]
- 22.Ingram D.D., Malec D.J., Makuc D.M., et al. National Center for health statistics guidelines for analysis of trends. Vital Health Stat. 2018;2:1–71. [PubMed] [Google Scholar]
- 23.An J., Zhang Y., Muntner P., Moran A.E., Hsu J.W., Reynolds K. Recurrent atherosclerotic cardiovascular event rates differ among patients meeting the very high-risk definition according to age, sex, race/ethnicity, and socioeconomic status. J Am Heart Assoc. 2020;9 doi: 10.1161/JAHA.120.017310. [DOI] [PMC free article] [PubMed] [Google Scholar]
- 24.Virani S.S., Akeroyd J.M., Smith S.C., Jr., et al. Very high-risk ASCVD and eligibility for nonstatin therapies based on the 2018 AHA/ACC cholesterol guidelines. J Am Coll Cardiol. 2019;74:712–714. doi: 10.1016/j.jacc.2019.05.051. [DOI] [PubMed] [Google Scholar]
- 25.Sajja A., Li H.F., Spinelli K.J., et al. A simplified approach to identification of risk status in patients with atherosclerotic cardiovascular disease. Am J Prev Cardiol. 2021;7 doi: 10.1016/j.ajpc.2021.100187. [DOI] [PMC free article] [PubMed] [Google Scholar]
- 26.Wang L., Li X., Wang Z., et al. Trends in prevalence of diabetes and control of risk factors in diabetes among US adults, 1999-2018. JAMA. 2021;326:1–13. doi: 10.1001/jama.2021.9883. [DOI] [PMC free article] [PubMed] [Google Scholar]
- 27.Johansen K.L., Chertow G.M., Foley R.N., et al. US Renal Data System 2020 annual data report: epidemiology of kidney disease in the United States. Am J Kidney Dis. 2021;77:A7–A8. doi: 10.1053/j.ajkd.2021.01.002. [DOI] [PMC free article] [PubMed] [Google Scholar]
- 28.Muntner P., Hardy S.T., Fine L.J., et al. Trends in blood pressure control among US adults with hypertension, 1999-2000 to 2017-2018. JAMA. 2020;324:1190–1200. doi: 10.1001/jama.2020.14545. [DOI] [PMC free article] [PubMed] [Google Scholar]
- 29.Liu S., Li Y., Zeng X., et al. Burden of cardiovascular diseases in China, 1990-2016: findings from the 2016 global burden of disease study. JAMA Cardiol. 2019;4:342–352. doi: 10.1001/jamacardio.2019.0295. [DOI] [PMC free article] [PubMed] [Google Scholar]
- 30.Bi Y., Jiang Y., He J., et al. Status of cardiovascular health in Chinese adults. J Am Coll Cardiol. 2015;65:1013–1025. doi: 10.1016/j.jacc.2014.12.044. [DOI] [PubMed] [Google Scholar]
- 31.Cannon C.P., Blazing M.A., Giugliano R.P., et al. Ezetimibe added to statin therapy after acute coronary syndromes. N Engl J Med. 2015;372:2387–2397. doi: 10.1056/NEJMoa1410489. [DOI] [PubMed] [Google Scholar]
- 32.Sabatine M.S., Giugliano R.P., Keech A.C., et al. Evolocumab and clinical outcomes in patients with cardiovascular disease. N Engl J Med. 2017;376:1713–1722. doi: 10.1056/NEJMoa1615664. [DOI] [PubMed] [Google Scholar]
- 33.Leino A.D., Dorsch M.P., Lester C.A. Changes in statin use among U.S. adults with diabetes: a population-based analysis of NHANES 2011-2018. Diabetes Care. 2020;43:3110–3112. doi: 10.2337/dc20-1481. [DOI] [PubMed] [Google Scholar]
- 34.James P.A., Oparil S., Carter B.L., et al. 2014 evidence-based guideline for the management of high blood pressure in adults: report from the panel members appointed to the eighth joint national committee (JNC 8) JAMA. 2014;311:507–520. doi: 10.1001/jama.2013.284427. [DOI] [PubMed] [Google Scholar]
- 35.Chobanian A.V., Bakris G.L., Black H.R., et al. The Seventh report of the joint national committee on prevention, detection, evaluation, and treatment of high blood pressure: the JNC 7 report. JAMA. 2003;289:2560–2572. doi: 10.1001/jama.289.19.2560. [DOI] [PubMed] [Google Scholar]
- 36.Wilmot K.A., O'Flaherty M., Capewell S., Ford E.S., Vaccarino V. Coronary heart disease mortality declines in the United States from 1979 through 2011: evidence for stagnation in young adults, especially women. Circulation. 2015;132:997–1002. doi: 10.1161/CIRCULATIONAHA.115.015293. [DOI] [PMC free article] [PubMed] [Google Scholar]
- 37.Maaijwee N.A., Rutten-Jacobs L.C., Schaapsmeerders P., van Dijk E.J., de Leeuw F.E. Ischaemic stroke in young adults: risk factors and long-term consequences. Nat Rev Neurol. 2014;10:315–325. doi: 10.1038/nrneurol.2014.72. [DOI] [PubMed] [Google Scholar]
- 38.Vikulova D.N., Grubisic M., Zhao Y., et al. Premature atherosclerotic cardiovascular disease: trends in incidence, risk factors, and sex-related differences, 2000 to 2016. J Am Heart Assoc. 2019;8 doi: 10.1161/JAHA.119.012178. [DOI] [PMC free article] [PubMed] [Google Scholar]
- 39.Okura Y., Urban L.H., Mahoney D.W., Jacobsen S.J., Rodeheffer R.J. Agreement between self-report questionnaires and medical record data was substantial for diabetes, hypertension, myocardial infarction and stroke but not for heart failure. J Clin Epidemiol. 2004;57:1096–1103. doi: 10.1016/j.jclinepi.2004.04.005. [DOI] [PubMed] [Google Scholar]
- 40.Engstad T., Bonaa K.H., Viitanen M. Validity of self-reported stroke: the Tromso study. Stroke. 2000;31:1602–1607. doi: 10.1161/01.str.31.7.1602. [DOI] [PubMed] [Google Scholar]
- 41.Lampe F.C., Walker M., Lennon L.T., Whincup P.H., Ebrahim S. Validity of a self-reported history of doctor-diagnosed angina. J Clin Epidemiol. 1999;52:73–81. doi: 10.1016/s0895-4356(98)00146-2. [DOI] [PubMed] [Google Scholar]
Associated Data
This section collects any data citations, data availability statements, or supplementary materials included in this article.