Abstract
Purpose
Clearance of cerebrospinal fluid (CSF) is important for the removal of toxins from the brain, with implications for neurodegenerative diseases. Imaging evaluation of CSF outflow in humans has been limited, relying on venous or invasive intrathecal injections of contrast agents. The objective of this study was to introduce a novel spin-labeling MRI technique to detect and quantify the movement of endogenously tagged CSF, and then apply it to evaluate CSF outflow in normal humans of varying ages.
Methods
This study was performed on a clinical 3-Tesla MRI scanner in 16 healthy subjects with an age range of 19–71 years with informed consent. Our spin-labeling MRI technique applies a tag pulse on the brain hemisphere, and images the outflow of the tagged CSF into the superior sagittal sinus (SSS). We obtained 3D images in real time, which was analyzed to determine tagged-signal changes in different regions of the meninges involved in CSF outflow. Additionally, the signal changes over time were fit to a signal curve to determine quantitative flow metrics. These were correlated against subject age to determine aging effects.
Results
We observed the signal of the tagged CSF moving from the dura mater and parasagittal dura, and finally draining into the SSS. In addition, we observed a possibility of another pathway which is seen in some young subjects. Furthermore, quantitative CSF outflow metrics were shown to decrease significantly with age.
Conclusion
We demonstrate a novel non-invasive MRI technique identifying two intrinsic CSF clearance pathways, and observe an age-related decline of CSF flow metrics in healthy subjects. Our work provides a new opportunity to better understand the relationships of these CSF clearance pathways during the aging process, which may ultimately provide insight into the age-related prevalence of neurodegenerative diseases.
Keywords: cerebrospinal fluid outflow, dura mater, glymphatic system, non-contrast spin-labeling magnetic resonance imaging, parasagittal dura
Introduction
The investigation of the pathways of glymphatic fluid clearance has been gaining interest due to the potential association between dysfunction of brain waste clearance and neurodegenerative diseases such as Alzheimer’s disease.1 The concept of glymphatic fluid clearance in the brain was pioneered by Nedergaard, who proposed a system by which soluble proteins and metabolites are eliminated from the central nervous system via cerebrospinal fluid (CSF) and interstitial fluid (ISF) exchange in the paravascular space.2,3 Our understanding of the importance of this system continues to expand, predominantly from studies using either ionizing radiation or invasive contrast injection in rodents.1–6 However, rodent models may not fully recapitulate the human glymphatic system, necessitating study of CSF flow in humans.7
The classic or direct glymphatic drainage pathway has been postulated as flow from the subarachnoid space (SAS) to the superior sagittal sinus (SSS) via arachnoid granulations (AG), but without validation using in vivo imaging techniques.8,9 This concept was challenged with the discovery of the meningeal lymphatics, which have been identified in both humans and nonhuman primates via a combination of noncontrast and contrast-enhanced high-resolution MR.10 The meningeal lymphatics have been previously characterized running parallel to the SSS, most pronounced along the superolateral corners of the SSS within the upper parasagittal dura (PSD).10 The use of invasive methodologies provided tantalizing evidence for glymphatic clearance via the meningeal lymphatics, but has been limited to rodent models.11–13 Further work in murine models has expanded the potential sites of meningeal lymphatics to also include the skull base,14 but it remains currently unexplored if these glymphatic drainage pathways also exist in humans.
Recently, the use of gadolinium-based contrast agents (GBCA) via intrathecal injection in humans revealed uptake and washout of the tracer at the meninges as evidence of glymphatic clearance, albeit over an extended 48-hour period.7 These GBCA studies provide valuable evidence of dural lymphatic vessels and their connection to PSD and AG in humans but do not image intrinsic outflow of glymphatic fluid or quantify outflow metrics. Similarly, phase-contrast (PC) imaging has been successfully utilized to image aqueduct CSF dynamics with relatively faster flow speed15,16 but does not provide the level of temporal or spatial resolution to adequately resolve the PSD and egress of CSF or glymphatic fluid to the SSS, due to pulsation errors and limitations in velocity rate. As such, detailed reports on the direction of fluid movement, real-time visualization of glymphatic fluid movement, and quantification of CSF efflux in humans are needed to better understand the CSF flow pathways in humans.
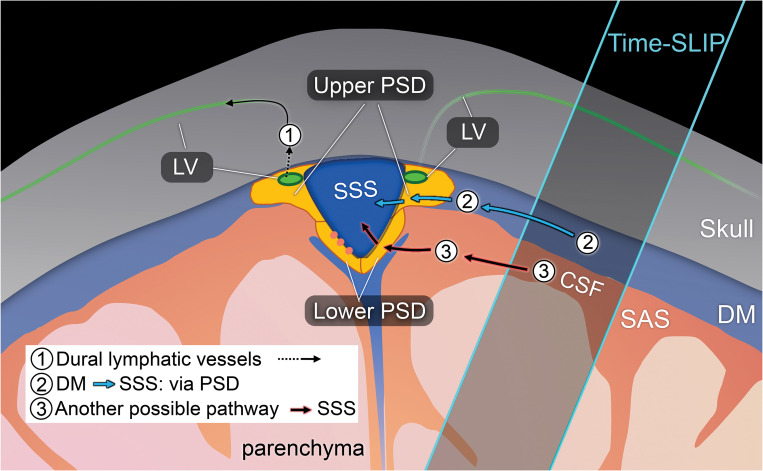
The present study was therefore aimed to elucidate and quantify the egress pathways of intrinsic CSF outflow in human subjects without utilizing contrast or other invasive injection techniques. Prior works studying blood-cerebrospinal barrier function successfully employed arterial spin-labeling (ASL) methods to quantify blood-to-CSF water transport and function of the choroid plexus,17,18 providing insight that ASL-like perfusion techniques may be similarly suitable to study the egress pathways of CSF outflow. To this purpose, we utilized a novel 3D ASL-based MRI method with a tag-on and tag-off 3D acquisition to study CSF egress pathways at the level of the convergence with the SSS. Because glymphatic function has been shown to change with age, we also examined outflow metrics in younger and older adults as proof of concept and to investigate potential age-related changes in CSF outflow tracts. In this article, we discuss the egress pathways of fluid outflow from the brain, using the term CSF to encompass ISF-CSF fluid, glymphatic fluid, or brain fluid throughout the article. Fig. 1 shows the dural lymphatic vessel pathway and our proposed intrinsic CSF egress pathways.
Fig. 1.
Drawing of possible egress pathways of CSF. (1) Pathway of egress through dural lymphatic vessels, observed using tracer studies, including gadolinium-based contrast agent. (2) Pathway of CSF from the DM to PSD, and then to SSS,41,44 observed using our tagged CSF method. (3) Another possible pathway where we observe in some healthy individuals. PSD was divided in horizontal or upper PSD and lateral or lower PSD. CSF, cerebrospinal fluid; DM, dura mater; PSD, parasagittal dura; SSS, superior sagittal sinus.
Materials and Methods
Experimental design
The study was approved by the Institutional Review Board of University of California, San Diego (200335). Written informed consent was obtained from all consecutive study participants. The study design was observational: Randomization of participants was not required, and we did not perform a prior sample size calculation since this was the first study of its kind.
Our consecutive study participants consisted of 16 healthy adults (10 males and 6 females; age range 19–71 years; mean age, 49.8 ± 13.8 years), each imaged in a supine position. None of the participants had any known neurodegenerative disease, pulmonary disease, or cardiovascular disease. Table 1 shows the participant demographics. Participants were further divided into two groups based on age: younger (19–59 years, n = 8) and older (60 years and older, n = 8) groups, to better assess age differences. All participants underwent 2D T2-weighted fluid attenuated inversion recovery (FLAIR), 3D T2-weighted centric ky–kz single-shot fast spin echo (cSSFSE), and 4D fluid spin-labeling MRI using 3D cSSFSE with various inversion time (TI) periods. All scans were acquired at mid-day to control for circadian effects.
Table 1.
Subject demographics
| ID# | Age (years) | BMI | Gender (M/F)* |
|---|---|---|---|
| 1 | 70 | 23.2 | M |
| 2 | 64 | 23.1 | F |
| 3 | 65 | 22.4 | F |
| 4 | 60 | 30.8 | F |
| 5 | 62 | 23.8 | M |
| 6 | 71 | 28.3 | F |
| 7 | 65 | 23.5 | M |
| 8 | 62 | 23.9 | M |
| 9 | 30 | 24.9 | M |
| 10 | 19 | 19.6 | M |
| 11 | 48 | 24.6 | M |
| 12 | 27 | 20.7 | M |
| 13 | 36 | 30.3 | F |
| 14 | 40 | 20.3 | F |
| 15 | 19 | 32.0 | M |
| 16 | 58 | 22.9 | M |
| 49.8 ± 13.8 | 24.6 ± 4.6 | 10 M/6 F |
Male (M) and Female (F). BMI, body mass index. Data are presented as mean ± standard deviation. Subject 1–8 (≥ 60 years old) are older adults and subject 9–16 (<59 years old) are younger adults.
MR protocol
All MRI examinations were performed on a clinical 3-T MRI scanner (Vantage Galan 3T; Canon Medical Systems, Tochigi, Japan), equipped with a 32-ch head coil.
1) T2-weighted 2D FLAIR, TR = 11000 ms, effective TE (TEeff) = 92 ms, echo train spacing (ETS) = 11.5 ms, TI = 2900 ms, flip angle/refocusing angle = 90/170º, 1 average, 32 slices, 2 mm thick, matrix = 384 × 364 (768 × 738 after interpolation), FOV = 22 × 22 cm, parallel imaging factor of 2.4, and acquisition time of 4 min 2s.
2) T2-weighted 3D cSSFSE parameters are TR = 4200 ms, TEeff = 121 ms, ETS = 6.5 ms, number of shots = 1, flip/refocusing angle = 90/110º, spectral adiabatic inversion recovery (SPAIR) fat suppression, matrix size = 432 × 432, (864 × 864 after interpolation), FOV = 22 × 22 cm, 100 slices, 0.6 mm thick, near isovoxel resolution of 0.3 mm × 0.3 mm × 0.3 mm after interpolation, parallel imaging factor of 3, and acquisition time of 3 min and 26s. Denoising deep learning reconstruction (dDLR) was applied.19
3) Ungated 4D CSF spin-labeling MRI parameters with 3D cSSFSE readout are TR = 5400 ms, TEeff = 30 ms, ETS = 5.0 ms, 6 echoes to the center of k space, flip/refocusing angle = 90/150o, SPAIR fat suppression, matrix size = 368 × 368 (736 × 736 after interpolation), FOV = 25 × 25 cm, parallel imaging factor of 3, 20 slices, 1 mm thick (0.5 mm after interpolation), tag-on and tag-off acquisition time of about 1 min and 48s. Imaging was acquired in coronal 3D with the right-left phase encode direction and the superior-inferior readout direction. Images were acquired for the TI of 500, 750, 1000, 1250, 1500, 2000, and 3000 ms. Temporal resolution of acquired data points between the TI periods was varied. Temporal resolution of 1000 ms was adopted after preliminary studies demonstrated peak flow at TI of 1000 ms. Table 2 shows the summary of MR imaging acquisition parameters. Supplementary Fig. 1 shows the position of imaging and time-spatial labeling inversion pulse (Time-SLIP).
Table 2.
MR imaging acquisition parameters
| Parameters | Units | T2 FLAIR | 3D cSSFSE | 3D Spin-Labeling |
|---|---|---|---|---|
| FOV | (mm) | 220 × 220 × 64 | 220 × 220 × 64 | 250 × 250 × 20 |
| Image matrix | 384 × 364 × 32 | 432 × 432 × 100 | 368 × 368 × 20 | |
| No. of sections | 32 | NA | NA | |
| Slice thickness | (mm) | 2 | 0.6 | 1 |
| Acquired resolution: (PE) × (RO) × (SE) | (mm) | 0.57 × 0.60 × 2.0 | 0.51 × 0.51 × 0.6 | 0.68 × 0.68 × 1.0 |
| Interpolated resolution: (PE) × (RO) × (SE) | (mm) | 0.29 × 0.3 × 1.0 | 0.25 × 0.25 × 0.3 | 0.34 × 0.34 × 0.5 |
| TR | (ms) | 11000 | 4200 | 5400 |
| Effective TE | (ms) | 92 | 121 | 30 |
| Echo train spacing | (ms) | 11.5 | 6.5 | 5 |
| Flip/fop angles | (degrees) | 90/170 | 90/110 | 90/150 |
| Averages | 1 | 1 | 1 | |
| Fat suppression (SPAIR) | Off | On | On | |
| Parallel reduction factor | 2.4 | 3 | 3 | |
| Acquisition time | 4 min 2s | 3 min 26s | 1 min 48s (for each TI) |
cSSFSE, centric ky–kz single-shot fast spin echo; FLAIR, fluid attenuated inversion recovery; NA, not appricable; PE, phase encode; RO, read-out; SE, slice encode; SPAIR, spectral adiabatic inversion recovery.
4D spin-labeling MRI theory
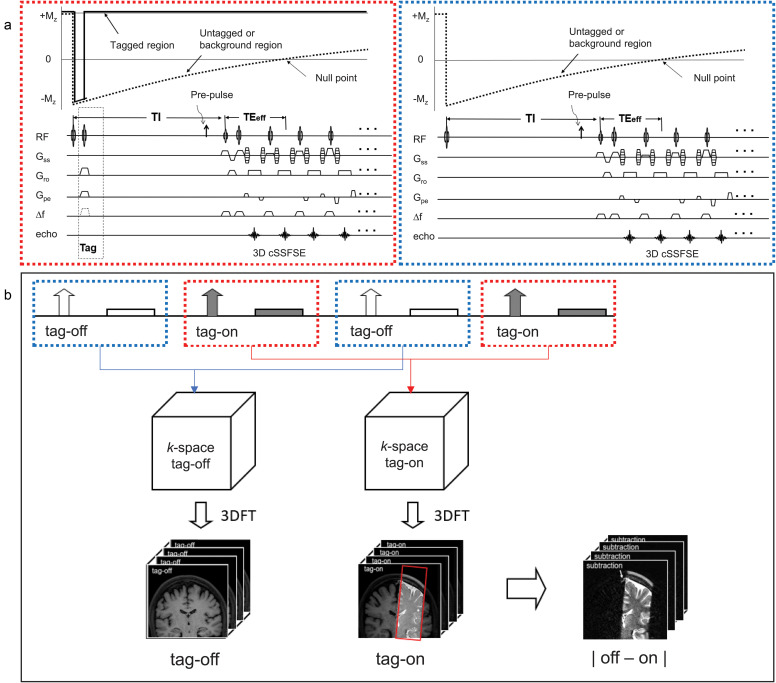
Figure 2a shows the pulse sequence of alternated tag-on and tag-off slice encoding acquisitions with their magnetization. Figure 2b shows post-processing of tag-on and tag-off in 3D Fourier-transformed data and subtraction analysis. An adiabatic spatially selective inversion recovery pulse, Time-SLIP, is used in the tag-on acquisition. A tag-on and tag-off alternate acquisition and subtraction technique was used with 3D cSSFSE. The tag-on sequence consists of a non-selective inversion recovery (non-sel-IR) pulse and a spatial-selective IR (sel-IR) pulse as a labeling (tag) pulse (Fig. 2a left). First, the non-sel IR pulse inverts all signals in the FOV from the initial longitudinal magnetization (+Mz) to (–Mz). Second, immediately after the non-sel-IR pulse, the sel-IR pulse is applied to invert back only the magnetized tissue and fluid in the ROI. Thus, the longitudinal magnetization in the tagged region is restored to +Mz, whereas the magnetization elsewhere remains at –Mz and follows an exponential T1 relaxation curve, as indicated in Fig. 2a left. The tag-off sequence consists of only non-sel IR pulse, as shown in Fig. 2a right. Both tag-on and tag-off acquisitions were alternately collected, and their subtraction provides flow-out signals from the tag pulse.20–24 Both tag-on and tag-off acquisitions have the non-sel IR pulse and thus the background signals with exponential T1 relaxation magnetization returns are the same in both images; therefore, background signals are canceled out and only the tagged signal that moves out of the Time-SLIP pulse is observed. For 3D volume data, this tag-on and tag-off acquisition was repeated in every slice encoding in TR. After this preparation, marked CSF signals flow out from the tag pulse and move out during the TI period (between the tag and read-out).
Fig. 2.
(a) Pulse sequence diagram of tag-on and tag-off 3D acquisition using 3D cSSFSE with magnetization states. Each slice encoding of tag-on and tag-off acquisitions is alternately acquired. Pre-pulse such as SPAIR fat suppression pulse can be applied before the readout acquisition. (b) Post-processing of 3D Fourier-transformed data of tag-off and tag-on brain images with a rectangular tag position in red (images at TI of 1500 ms, image details in Fig. 4). Simple subtraction enables visualization of movement of the tagged signal out of the tag region. cSSFSE, centric ky–kz single-shot fast spin echo; SPAIR, spectral adiabatic inversion recovery.
Experimental studies: visualization of CSF and effect of aging on outflow metrics
We acquired all 3 sequences described in the MR Protocol section (as well as in Table 2) on all 16 participants. The 3D coronal imaging slab was placed at the top of the head and an oblique tag pulse was applied alongside the SSS. The detailed anatomy of dura mater, upper or horizontal PSD, lower or lateral PSD, SSS, as well as SAS were obtained using coronal images of T2-weighted FLAIR and T2-weighted 3D cSSFSE with distinct intrinsic contrast. Our ungated 4D CSF spin-labeling MRI technique was previously optimized to acquire TI of 500, 750, 1000, 1250, 1500, 2000, and 3000 ms, a total of 7 acquisitions (each TI with 1 min 48s) to have higher temporal resolution of TI around 1000 ms, where a peak height (PH) was observed. As shown in Fig. 1 (2), our hypothesis is that tagged CSF at the perivascular space (PVS) of blood vessels in dura mater travels to PSD and then flows out into the SSS. We have studied both simple subtraction of tag-on and tag-off images as well as the signal increase ratio (SIR) after registration of both images. The detailed calculation of SIR is discussed in the data analysis and post-processing.
Along with the main experiment, we investigated the reproducibility of our methodology. We consecutively acquired tagged CSF outflow within a single scanning session in two participants to avoid differences in CSF flow related to circadian effects, or differences in prior physical activity or sleep.
Data analysis and post-processing
We measured four ROIs of upper PSD, lower PSD, SSS, as well as the entire SSS region containing upper PSD, lower PSD, and SSS. Regions were manually selected for each participant on the tag-on image (TI = 500 ms) away from the tagged region by an MR physicist and a medical doctor together. We carefully selected the 4 ROIs from images of TI of 500 ms together with T2-weighted FLAIR and T2-weighted 3D cSSFSE because the image contrast of TI of 500 ms provides well-defined region of PSD in bright signal with dark SSS signal. For both volumes (tag-on and tag-off), voxels with intensity values outside the range (mean ± 2 standard deviation [SD]) were excluded from further analysis. We performed this method to eliminate voxels that may contain signals of pulsatile blood flow between the tag-on and tag-off images and between TI periods. This ensures that our tagged MRI signal is indeed from the CSF and not the blood.
Normal distribution of intensities in tag-on and tag-off images is expected and the range of (mean ± SD) contains 95% of the voxels in the selected ROI.25 To determine the percent SIR from outflow, tag-off images were subtracted from tag-on images, and the absolute value of the difference was then divided by tag-off images, as shown in equation (1).
| (1) |
This was performed for each TI, resulting in a time-varying signal increase at each voxel. The ROI averaged values (y)were then used to perform least-squares fit for the TI-dependent gamma variate function26 given by equation (2):
| (2) |
The starting points and range of the parameters used for fit were:
| (3) |
Fitting results produced estimates for five outflow metrics27 including: PH, time-to-peak (TTP), mean transit time (MTT; width at half the PH), relative CSF volume (rCFV; area under the curve), and relative CSF flow (rCFF; rCFV divided by MTT). We determined how these metrics varied by age.
Statistical analysis
Differences in CSF outflow metrics in age groups were determined using t-tests. Prior to the analysis, the data were tested for normal distribution using Shapiro-Wilk test and through visual inspection of Q-Q plots. Pearson correlation analysis was performed to analyze the correlation between relative CSF flow and age. In addition, the Spearman’s rank-order correlation was performed on ages above 60 years old. All statistical analysis was performed using IBM SPSS v26 (IBM, NewYork, NY, USA).
Validation study to distinguish signals of CSF from blood
We performed the following to ensure that our tagged MRI signal was from the CSF, and not the blood. First, we applied an oblique tag pulse perpendicular to the coronal imaging plane to avoid tagging the blood signal from the SSS. The SSS venous blood T2 value has been reported to be about 62 ms at 3T,28 depending on oxygenation and hematocrit levels.29–30 To confirm if any contribution of blood signal occurred in our CSF measurements, we also acquired images with a long TEeff of 300 ms, at which no venous blood would show signal, and compared with images acquired at TEeff of 30 ms. With TEeff of 300 ms, only the long T2 component of CSF would be observable.
Results
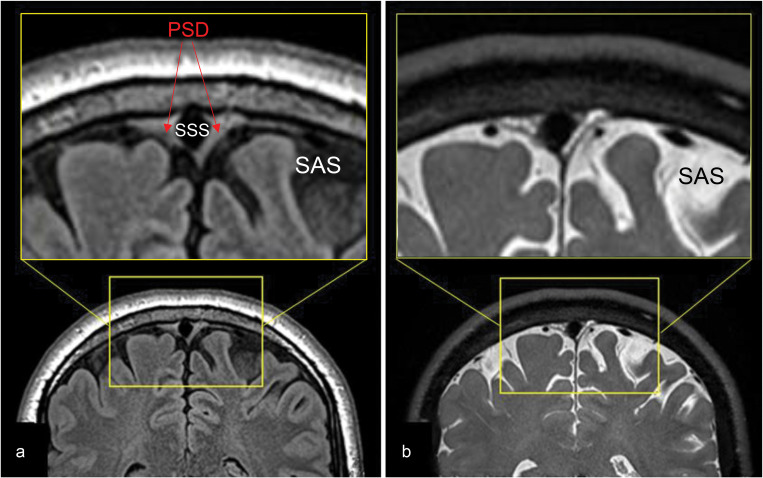
To acquire detailed brain anatomy and to identify PSD and SSS at the meninges, we performed high-resolution T2-weighted 3D cSSFSE and T2 FLAIR acquisitions (Fig. 3). CSF in the SAS appears hypointense on FLAIR and hyperintense on 3D cSSFSE, whereas PSD demonstrates intermediate hyperintensity on both the FLAIR and 3D cSSFSE images (Fig. 3a). Note multiple hyperintense signals, which are hypointense on FLAIR (Fig. 2a), are seen in the 3D cSSFSE images, localized within the PSD (Fig. 3b). These images were then used as locator images to identify PSD and to mark an ROI in the 3D coronal non-contrast MRI CSF outflow acquisition with varying TI periods. For visualization purposes, 3D cSSFSE images were fused with CSF tagged MR signals.
Fig. 3.
T2-weighted FLAIR and T2-weighted 3D cSSFSE of a healthy male adult, age 42. Top enlargement of the yellow box. (a) FLAIR image depicts hypointense CSF in the SAS and intermediate hyperintense PSD. (b) 3D cSSFSE image depicts hyperintense CSF in SAS and intermediate hyperintense PSD. CSF, cerebrospinal fluid; cSSFSE, centric ky–kz single-shot fast spin echo; FLAIR, fluid attenuated inversion recovery; PSD, parasagittal dura; SAS, subarachnoid space.
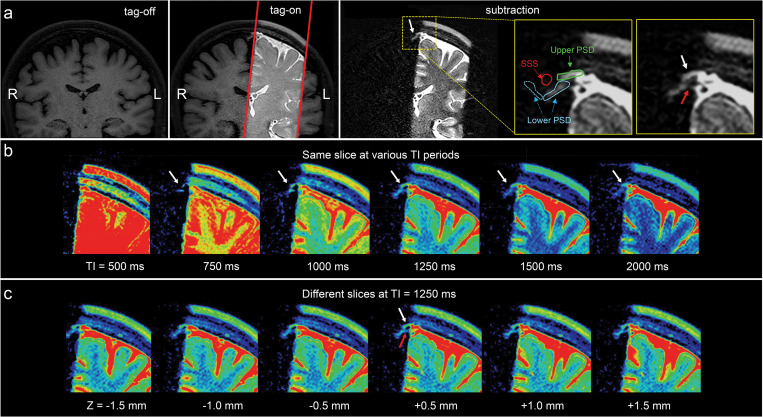
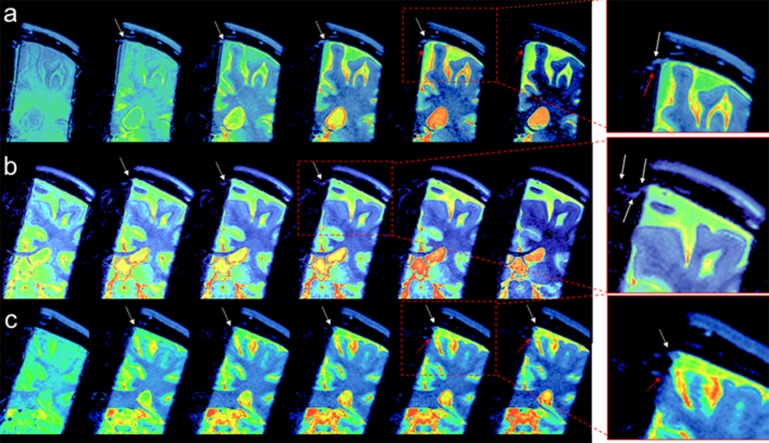
For CSF outflow imaging, we acquired coronal fluid spin labeling MR images with tag-on and tag-off acquisition and subtraction at varying TIs, as shown in Fig. 2. By acquiring both tag-on and tag-off images, the subtraction of tag-off from tag-on images shows movement of the tagged fluid out from the tag pulse area. Increasing the TI period allows the tagged fluid to travel greater distance; however, the signal eventually decreases with longer TIs. Detailed explanations of sequence and spin states of tag-on and tag-off acquisitions are described in the Materials and Methods. To elucidate the egress pathways of CSF, we applied a simple subtraction method of time-resolved images by varying the TI periods, in which distance traveled by the tagged fluid varies by the TI periods. Figure 4a shows the tag-off, tag-on, and the subtraction images with enlargement. The subtraction image presents the tagged CSF in the dura mater, upper PSD, and alongside the lower PSD. Figure 4b shows the subtracted color images of the same slice using TI of 500, 750, 1000, 1250, 1500, and 2000 ms of the same center slice at Z = 0 mm, as time-resolved images. The subtraction images allow visualization of the tagged CSF as it moves out from the tag at the dura mater toward the PSD at TI of 750 ms, and increased signals at TI of 1250 ms. The signal decreases at TI of 2000 ms. Figure 4c presents the color images of contiguous slices covering about −1.5 to + 1.5 mm (3 mm), showing the tagged CSF signals from dura mater to the upper and lower PSD in all 3D slices. We also observed an additional signal extending at lower PSD a few millimeters down from the upper PSD, as indicated by the red arrow. In our subtracted images, we observed the CSF from dura mater to upper PSD in most participants, although the signal was weak in some. Fewer participants exhibited signals from the lower PSD. Supplementary Fig. 2 shows example subtracted color images from 3 participants, demonstrating tagged signals appearing to move out from the dura mater from all participants, albeit with varying degrees of signal strength.
Fig. 4.
(a) Images of tag-off, tag-on, subtraction, and the enlargement of the subtraction obtained at TI of 1500 ms. The Time-SLIP pulse is shown in the red rectangular box. Enlarged images with and without labels show fluid moving out from the tagged region (left brain hemisphere) to the PSD (white arrows) extended from the dura mater and the lower PSD (red arrow). Segmented labels (enlargement on the right) show upper (or horizontal) parasagittal dura (PSD in green), lower (or lateral) PSD (light blue), left lower PSD in a solid line and the right lower PSD in a dotted line, and SSS in red. Note that the signal by the red arrow shows a possibility of a second pathway of CSF flow. Note that there are no noticeable signals at the right upper PSD and lower PSD from the right brain hemisphere consistent with no Time-SLIP pulse applied to this hemisphere. (b) Color map of subtracted images from the center slice at Z = 0 mm location of 3D images at TI of 500, 750, 1000, 1250, 1500, and 2000 ms. The tagged CSF moved out to PSD at 750 ms, increases signals at TI of 1000 to 1250 ms, and gradually decreased in signal intensity by TI of 2000 ms (white arrows). (c) Contiguous slices of subtracted color maps of 3D volume images obtained at TI of 1250 ms. Note that contiguous slices show marked movement of CSF toward the upper PSD (white arrow) in every slice (or a 3 mm Z direction distance) of 3D volume images. In addition, the tagged CSF movement toward the lower PSD can be seen (red arrow). CSF, cerebrospinal fluid; PSD, parasagittal dura; SSS, superior sagittal sinus; Time-SLIP, time-spatial labeling inversion pulse.
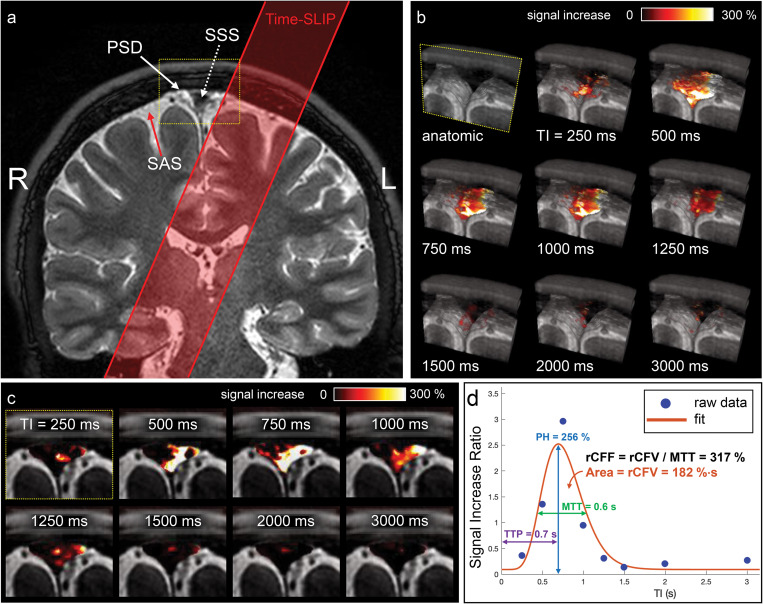
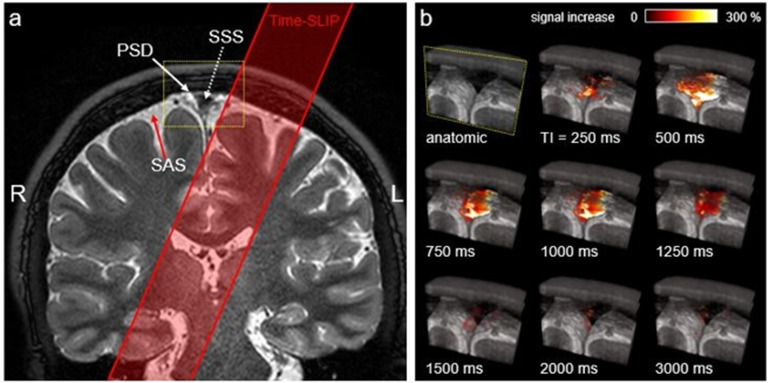
Next, we quantified the CSF flow using SIR of the tagged CSF MRI in the SSS region. The calculation and post-processing of SIR are explained in the Materials and Methods. Figure 5a shows the coronal image and tag pulse (red). Figure 5b shows enlarged oblique fusion images of 3D SSFSE and tagged MRI signals at the ROI covering the SSS, the upper PSD, and lower PSD in various TI periods. Bright white signal indicates strong tagged fluid signals, with an intensity increase up to 300%. At increasing TIs, this fusion technique captures snapshots of the egress pathway of CSF from dura mater into SSS, alongside the PSD, visualized in oblique 3D images (Fig. 5b and Supplementary Movie 1). Note that similar CSF outflow signals were observed in all slices in oblique view of Fig. 5b. Magnified straight coronal views in Fig. 5c demonstrate tagged CSF at the level of the PSD entering the lumen of the SSS from 500 to 1000 ms. Figure 5d shows quantitative measures of CSF signals at each TI period. When applying one tag pulse to the left hemisphere, the tagged CSF signal travels to the SSS, reaching a peak flow, and disappears with longer TI periods. By systematically increasing the TI period, and using tag-on, tag-off subtraction, we can visualize and quantify the path travelled by tagged-CSF until the signal disappears with long TI periods. After the non-selective IR pulse, which is applied to both the tag-on and tag tag-off acquisitions, the background signals outside the tag region experience the same exponential T1 relaxation magnetization and are cancelled out by the subtraction; only the tagged signals remain visible. Thus, venous blood signals in the SSS are likely to be cancelled out by the subtraction of tag-on and tag-off at each TI. To further avoid SSS venous contamination, the spin labeling tag-on and tag-off images were acquired in the coronal orientation while the tag labeling pulse for endogenous CSF tracing was applied in the oblique sagittal orientation parallel to the long axis of the SSS.
Fig. 5.
(a) Coronal 3D cSSFSE image with a spin labeling tag pulse (red box). The Time-SLIP tag pulse is placed about 10 mm away from the SSS. (b) A series of oblique 3D spin labeling images with various TIs fused over 3D cSSFSE image, enlargement of yellow box in (a). Note that the tagged signals increase from the Time-SLIP on the left brain at the PSD region at TI of 500 ms and then disappear or egress into the SSS by 1500 ms. (c) Straight coronal fusion images of tagged MRI signals around the SSS region over 3D cSSFSE images at various TIs show tagged fluid outflow from the tag pulse to dura mater and PSD into the SSS. (d) Tagged CSF outflow signal at the SSS. Circles show the data points and the line indicates the curve fit. PH is 256%, MTT is 600 ms, TTP is 700 ms, rCFV is 182%∙sec under the curve, and rCFF is 317%, obtained by dividing rCFV by MTT. CSF, cerebrospinal fluid; cSSFSE, centric ky–kz single-shot fast spin echo; MTT, mean transition time; PH, peak height; PSD, parasagittal dura; rCFF, relative CSF flow; rCFV, relative CSF volume; SSS, superior sagittal sinus; TIs, inversion times; Time-SLIP, time-spatial labeling inversion pulse; TTP, time to peak.
To quantify CSF outflow metrics, we curve-fitted CSF MRI outflow signal vs. TI data (Fig. 5d). The peak of the signal is seen at TI around 700 ms, reaching a PH of 256%. The signal returns to the baseline after TI of 1500 ms. The rCFF is 317%.
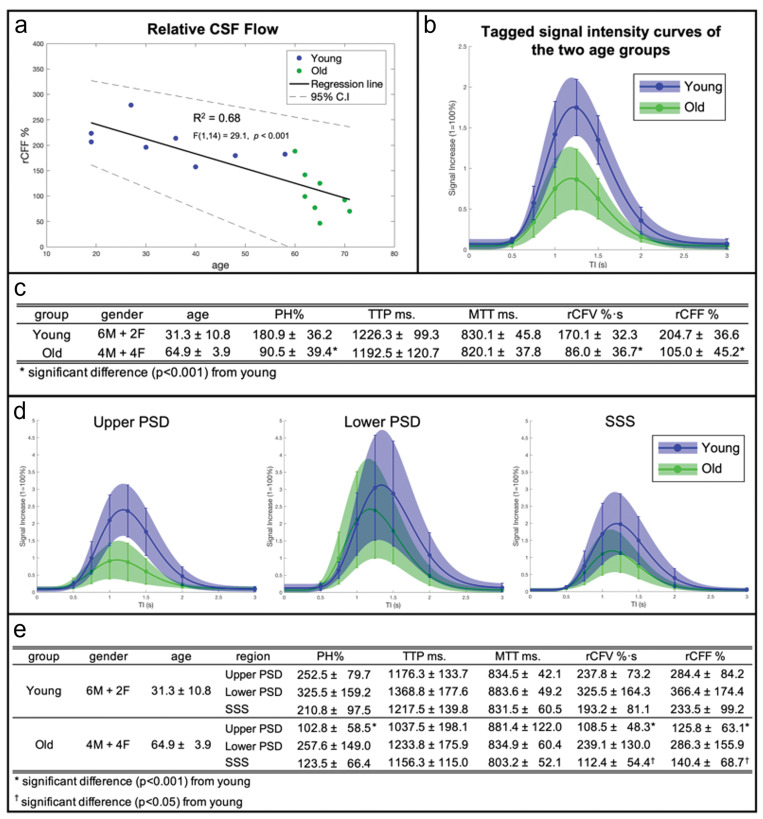
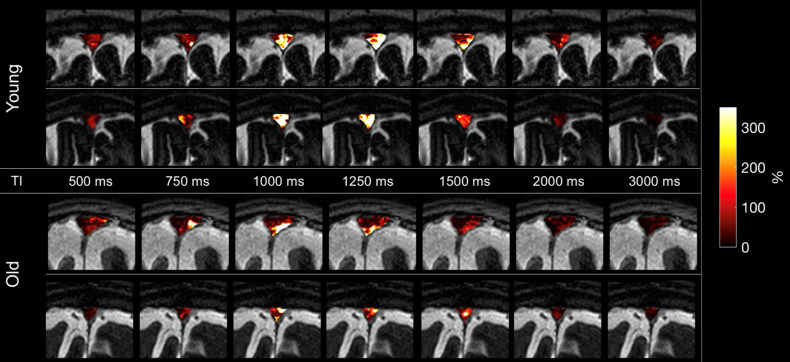
To determine the effect of age on the outflow of tagged CSF measures, we imaged 16 healthy participants ranging in age from 19 to 71 years. Supplementary Fig. 3 shows typical time-resolved images of two younger and two older adults with enlarged fusion images of 3D SSFSE and tagged MRI signals at the ROI covering the upper PSD, lower PSD, and SSS, in various TI periods. The younger adults display greater intensity signals than the older adults. Figure 6a shows the quantitative CSF outflow of the entire SSS region by participant age. From a scatter plot in Fig. 6a, the relationship appears to be non-linear, with greater decline of rCFF among subjects over 60 years. Thus, we categorized participants into younger (19–59 years, n = 8) and older (60 years and older, n = 8) groups to better assess age differences. Although our sample size is small, the Spearman’s rank-order correlation was applied to determine the relationship between rCFF and older ages. There was a strong negative correlation between rCFF and age, which was statistically significant (rs(14) = –0.912, P < 0.0001). Figure 6b shows group differences in tagged CSF outflow curves. Figure 6c shows group differences in quantitative outflow measures. PH, rCFV, and rCFF were significantly lower among older than younger adults (each P < 0.01). TTP and MTT did not differ between groups.
Fig. 6.
(a) CSF outflow of the entire SSS region on 16 participants between 19 and 71 years show a decline of outflow with age (there was a negative correlation F(1,14) = 29.1, P < 0.001, r = –0.82). Especially in those over 60 years of age, the Spearman’s rank-order correlation gives a strong negative correlation between rCFF and age, which was statistically significant (rs(14) = –0.912, P < 0.0001) in green dots. (b) Tagged fluid outflow rate of entire meninges in two groups: younger (19–59 years) and older (60–71 years) adults. The curves represent an average SIR fit of each age group with the colored shades denoting an SD range and SD bars at each TI point. The amount of outflow signal is markedly decreased in the older group, as compared to the younger group. (c) Quantitative CSF outflow measures between the younger and older groups. Tagged CSF outflow measures are PH, rCFV, and rCFF for each age group and for all participants. The TTP and MTT values were similar in the two groups; however, PH (180.9% ± 36.2 in young and 90.5% ± 39.4 in old; t(14) = –4.78, P < 0.001), rCFV (170.1%∙s ± 32.3 in young and 86.0%∙s ± 36.7 in old; t(14) = –4.87, P < 0.001), and rCFF (204.7% ± 36.6 in young and 105.0% ± 45.2 in old; t(14) = –4.85, P < 0.001) were significantly different between the two age groups using a two-sample t-test with unique variance. (d) Individual ROI analysis of upper PSD, lower PSD, and SSS in younger and older age groups and their quantitative measures (e). Similarly, as in (b), the curves represent an average SIR fit of each age group with colored shades denoting an SD range and SD bars at each TI point. The upper PSD shows a significant difference in PH (252.5% ± 79.7 in young and 102.8% ± 58.5 in old; t(14) = –4.28, P < 0.001), rCFV (237.8%∙s ± 73.2 in young and 108.5%∙s ± 48.3 in old; t(14) = –4.17, P < 0.001), and rCFF (284.4% ± 84.2 in young and 125.0% ± 63.1 in old; t(14) = –4.26, P < 0.001) between younger and older groups. The lower PSD shows no significant difference. SSS presents a significant difference in rCFV (193.2%∙s ± 81.1 in young and 112.4%∙s ± 54.4 in old; t(14) = –2.34, P < 0.05) and rCFF (233.5% ± 99.2 in young and 140.4% ± 68.7 in old; t(14) = –2.18, P < 0.05) between the two age groups using a two-sample t-test with unique variance. Note that the TTP is similar between the upper PSD and SSS, but slightly longer in SSS whereas TTP of the lower PSD is longer than that of upper PSD and SSS. CSF, cerebrospinal fluid; MTT, mean transit time; PH, peak height; PSD, parasagittal dura; rCFF, relative CSF flow; rCFV, relative CSF volume; SD, standard deviation; SIR, signal increase ratio; SSS, superior sagittal sinus; TTP, time-to-peak.
Next, for all 16 participants, we segmented the SSS region into the 3 ROIs of upper PSD, lower PSD, and SSS, as shown in the top right panel of Fig. 4. Figure 6d shows the tagged CSF outflow curves of these three regions in the younger and older groups. Figure 6e shows the corresponding tagged CSF metrics. Quantitative outflow measures of PH, rCFV, and rCFF in the PSD and SSS were significantly lower among the older group. However, there were no differences in these values for the lower PSD. Note that the difference in TTP between upper PSD and SSS, with slightly elevated TTP in SSS relative to PSD, is consistent with the direction of flow from the upper PSD into SSS (see Fig. 1). However, TTP of the lower PSD is longer than that of upper PSD and SSS, suggesting a different pathway from that implied by the time course of PSD to SSS.
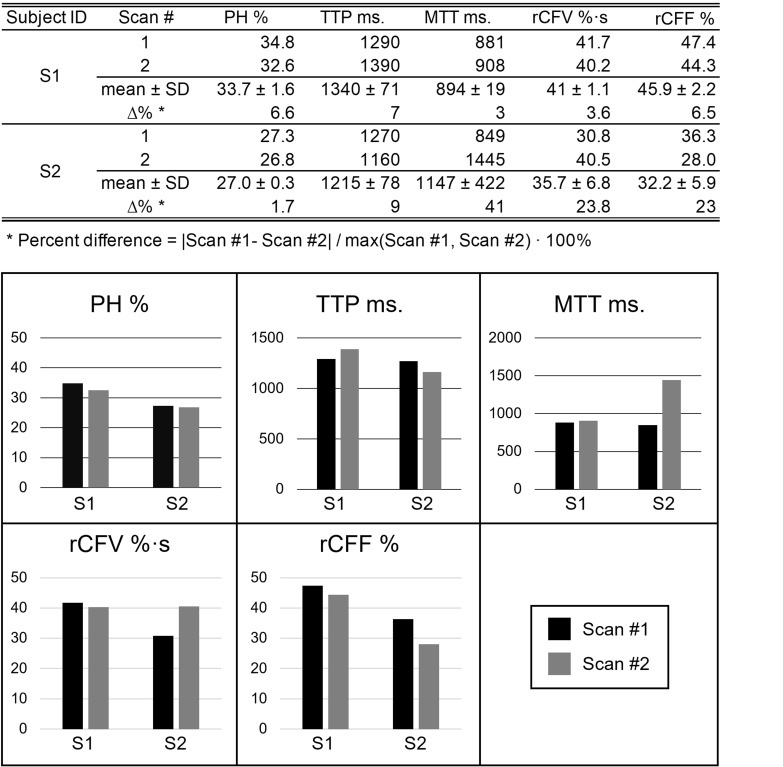
For reproducibility, we acquired two quantitative measures of tagged CSF measures consecutively in one scan session for two participants (aged 48 and 62 years). Results are shown in Supplementary Fig. 4. PH was the most reliable measure, with percent differences between the two scans of < 2% and < 7% for the two participants. For other flow parameters, rCFF and rCFV percent difference was not more than 23%.
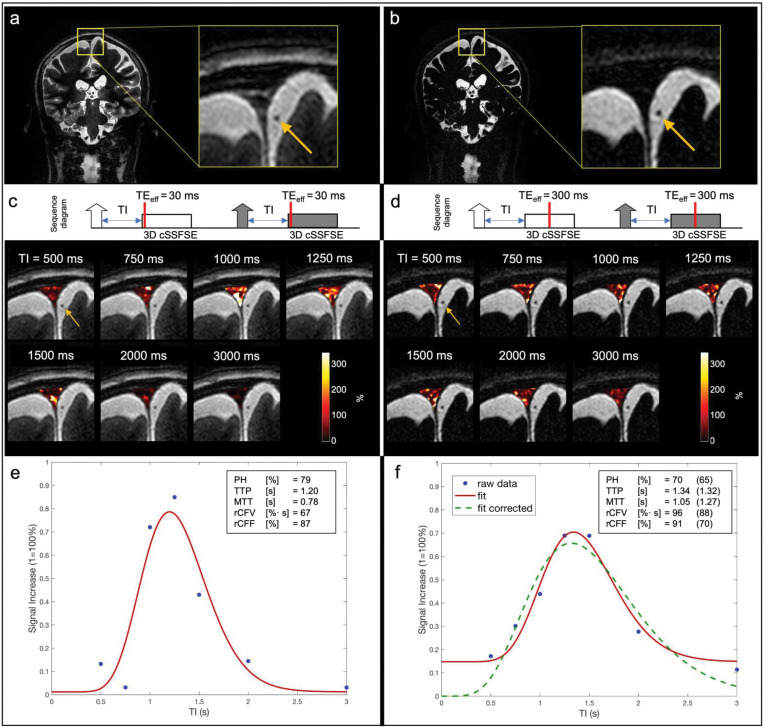
In addition, we examined whether there was any signal contribution from blood in our tagged MRI measurements. The source images of tag-on and tag-off images in various TI images on all 16 participants obtained using TEeff of 30 ms were reviewed by a medical doctor. We did not detect any bright blood signals in the SSS and the surrounding blood vessels such as cortical veins, as shown in Fig. 4, Fig. 7a–d, and Supplementary Fig. 3. Based on our sequence design, bright signal within the Time-SLIP pulse moves out as bright while the dark signal moves out dark. At each TI period, the background signals experience an exponential return in both tag-on and tag-off acquisitions, as shown in Fig. 2. The tagged region also showed dark signal intensity in the regions corresponding to blood vessels; therefore, it could be deduced that no blood signals from the tagged pulse contributed to our tagged MRI measurements. Only bright signals (+Mz) in the tag region contribute to the tagged MRI signals, as indicated in Fig. 2a.
Fig. 7.
The tag-on and tag-off acquisitions using a TEeff of (a, c, and e) 30 ms and (b, d, and f) 300 ms. (a) and (b) are coronal images and their enlarged anatomic images of TEeff of 30 ms and 300 ms, respectively. (c) and (d) show the acquisition sequence showing the contrast-determined time of TEeff of 30 ms and 300 ms by red line, and their various TI images, respectively. The fusion image with TI 500 ms was used with tagged MRI color images covering the entire SSS region including upper PSD, lower PSD, and SSS at a slice of 3D images using various TI periods. Both TEeff of 30 ms and 300 ms show tagged CSF signals at the upper PSD, lower PSD, and SSS, while showing dark blood signals (yellow arrows) throughout TI periods. Tagged MRI signal curves of both TEeff of (e) 30 ms and (f) 300 ms show similar tagged MRI curves; tagged MRI signal increase (wash-in) and decrease (wash-out) were both around 1100–1300 ms, with similar PH. However, MTT was a bit longer, rCFF and rCFV were higher in data obtained at TEeff of 300 ms, as compared to TEeff of 30 ms. MTT was increased by approximately 270 ms, which is the difference between TEeff of 300 ms and 30 ms. This may be due to adding an extra contrast-determined time of TEeff to the TI period. During the TEeff of 300 ms period, tagged signals within the 3D slab may travel in multiple directions to increase tagged MRI outflow measures. Regarding the baseline of (f) TEeff of 300 ms, it is a non-zero baseline due to the lower signal but higher contrast (more T2-weighted) at TEeff of 300 ms, as compared to TEeff of 30 ms. From the Equation (1), lower signal in the ROI due to the long TEeff is likely to introduce an extra signal bias like a ratio of small signals in both numerator and denominator. To correct this bias, we have added an extra data point (SIR = 0% at TI = 0 ms) based on the assumption that no signal is present at TI = 0 ms. Dotted green line shows the corrected curve fit with zero starting point with the corresponding tagged fluid metrics in the parentheses. CSF, cerebrospinal fluid; MTT, mean transit time; PH, peak height; PSD, parasagittal dura; rCFF, relative CSF flow; rCFV, relative CSF volume; SIR, signal increase ratio; SSS, superior sagittal sinus; TEeff, effective TE; TI, inversion time.
Lastly, to ensure that only CSF and not blood is imaged, we scanned increasing TEeff in 3D SSFSE readout to 300 ms, to selectively acquire long T2 components of CSF, rather than observing surrounding blood signals (shorter T2) that would have decayed. The SSS venous blood has T2 value of 62 ms;28 therefore, there should not be blood contribution at TEeff of 300 ms. Figure 7a and b show the coronal images with enlargements obtained using TEeff of 30 and 300 ms. Figure 7c and d show the simple sequence charts of tag-on and tag-off acquisitions using TEeff of 30 ms and 300 ms, as well as fusion images at each TI period. The contrast-determined time is the TEeff period in 3D SSFSE, as indicated by red bars. The fusion images of Fig. 7c and d show the background tag-off images using TEeff of 30 ms and 300 ms at TI of 500 ms with tagged MRI signals covering upper PSD, lower PSD, and the SSS. Note that the background images show that the PSD region is bright in TEeff of 30 ms, but dark in TEeff of 300 ms, due to the T2 difference. The color maps of the entire PSD region show the tagged MRI signals from the lower PSD with bright white color, indicating high values. Figure 7e and f show the results of tagged CSF curves obtained using TEeff of 30 ms and 300 ms. Both TEeff of 30 and 300 ms produce similar quantitative metrics of PH, rCFV, and rCFF. Note that TEeff of 30 ms and 300 ms provide a similar TTP with a reasonable delay due to an extra time of TEeff of 300 ms, consistent with an increased TEeff. However, the MTT was slightly longer and the baseline was higher in the TEeff of 300 ms, as compared to TEeff of 30 ms. We applied the |tag-off – tag-on|/|tag-off| images as an SIR in our tagged CSF signal analysis because the TEeff of 300 ms results in a low SNR as compared to TEeff of 30 ms in both tag-on and tag-off images, resulting in a low SNR. This low SNR may be amplified by dividing by the low SNR in the tag off image. We also added the calculation using a TI of 0 ms, for which zero signal was assumed. This experiment confirmed that both TEeff of 30 ms and 300 ms detect CSF outflow in the SSS region and not blood.
Discussion
The findings from the time-resolved spin-labeling MRI study demonstrate, for the first time, a method to directly image the intrinsically tagged CSF outflow without administration of exogenous tracers or contrast agents in healthy adults at the level of the PSD. Our ungated technique uses a long TR of 5400 ms to minimize the physiological effects of respiration, cardiac pulsation, microvascularity, vasodilation, or venodilation, of critical importance with composite measurements of the small adjacent meningeal structures, such as the dura mater, sinus, vessels, PVS, etc. By utilizing spin-labeled MRI as an endogenous tracer at the tag region of dura mater and SAS, we were able to visualize tagged CSF from dura mater to PSD and then into the SSS. The small differences in TTPs between PSD and SSS are consistent with flow of the tagged CSF from dura to PSD and then to SSS, while the slower TTP of lower PSD may indicate another pathway for CSF clearance to the SSS. This pathway was best visualized in the subtracted color images from young adult participants, many of which showed signal extending into the lower PSD about a few millimeters below the upper PSD pathway. Although our techniques utilize ungated 3D cSSFSE with slice encoding per every TR of 5400 ms, we, nevertheless, observed that all slices in the 3D volume demonstrated the outflow of CSF. This implies that outflow may occur constantly in the brain as a steady state, as has been previously suggested.31
Outflow of CSF containing waste products including Aβ is essential for the maintenance of brain health.32,33 Aging is one of the major risk factors of neurodegenerative diseases.33 Murine models have shown reduction in glymphatic clearance with age.34 Our non-contrast MRI study also demonstrated a decline of CSF outflow with age in healthy adults. Our method, which is suitable for use in anyone without MRI contraindications, may facilitate establishment of normative values for CSF outflow. This may allow further investigation of the role of CSF outflow in neurodegenerative disorders and potential advancement of a novel biomarker predictive of risk for the development of dementia.
The present technique exploits the intrinsic image contrast between the SAS and compartmentalized components of CSF at the PSD, demonstrating low and high signal intensities on FLAIR and 3D cSSFSE, respectively. This finding is supported by recent work demonstrating the presence of several distinct components of CSF signal in the brain based on T2 or spin-spin relaxation times (2000 ms at the CSF of SAS and T2 of 400 ms for the PSD) using non-negative least squares in pixel-by-pixel analysis35 and most recently by comparison of signals reflecting various albumin concentrations with results from human imaging.36 Additional work further helped compartmentalize these signals using FLAIR imaging7 to demonstrate the complex, sub-millimeter cross-sectional structure of the PSD along the length of the SSS.11–13 Given the close opposition of the PSD and the SAS, and their intrinsic differences in spin-spin relaxation times, an active CSF-mediated exchange of molecules between the brain tissue and dural lymphatic vessels has been postulated as the structural underpinnings of the glymphatic system.7
Results of our validation study suggest that tagged MRI signal acquired using the present technique likely stems from the longer T2 components of CSF, not from the blood. We have shown that there is no bright blood signal in either the tag-on or tag-off source images, in the SSS and surrounding vessels. The tagged fluid flow-out technique shows only the tagged region with bright signals move out bright, while dark signals move out dark.37,38 We also compared images acquired at both short (30 ms) and long (300 ms) TEeff. Because of the short T2 of approximately 62 ms of SSS venous blood, the blood signal would experience marked decay in the long TEeff images.28 The TEeff of 30 and 300 ms resulted in similar tagged MRI signal curves with similar PH, rCFV, and rCFF, which would not be expected if blood contributed to the signal. The longer MTT in TEeff of 300 ms can be explained by the tagged fluid within the 3D excitation slab during the TEeff, which allows fluid to move in multiple directions in PSD, causing an elongation of tagged signals returning to the baseline, as shown in Fig. 7. Taken together, these findings support that our non-contrast spin-labeling MRI technique enables assessment of the flow of CSF rather than blood.
The mean outflow time of endogenous CSF from the dura mater to SSS utilizing our spin-labeling technique averaged less than a couple of seconds, rather than on the order of hours or days as previously reported with the use of intrathecal administration of GBCA.7 Although the precise mechanism for the difference remains to be elucidated, it may reflect the relatively limited diffusivity of GBCA across the selectively impermeable barrier of the PSD, the evaluation of which was beyond the scope of this present study which was aimed at elucidating age-associated intrinsic CSF flow changes. Further work will directly compare the differences in intrinsic CSF outflow metrics between spin-labeling and gadolinium-tracer techniques to help fill technical gap between the intrinsic CSF outflow and GBCA-tracer MRI.
Beyond differences in technique, prior work has identified rapid enhancement of the pial sheath of parasagittal cortical veins, which drain into the inferior aspect of the SSS, contiguous with linear and selective contrast enhancement within the PSD.39 This suggests the possibility of direct connection between the pial sheath of the cortical veins and the meningeal lymphatics, or so-called subpial CSF flow, which could also potentially account both for the rapidity of intrinsic CSF egress as well as the observed tagged CSF signals at the lower PSD seen in young volunteers. Ultimately, further investigation is warranted into elucidating the spatial representation of separate CSF egress pathways and their potential contributions for selective waste clearance in the setting of exercise, sleep and/or aging.
This is the first study to provide quantitative metrics characterizing age-related decline in the flow of intrinsic CSF through the PSD. Two studies have previously identified age-related increases in the volume of the PSD.40,41 As such, one hypothesis for our finding is that overall flow metrics are decreased due to increasing volume of the CSF and ISF space, leading to increased stagnation and reduced relative waste clearance. In an another work, Taoka et al. demonstrated age-dependent intrinsic decreased diffusivity of the perivascular and perivenous space using diffusion weighted image analysis along the perivascular space (DWI-ALPS),42 with further studies also demonstrating decreased diffusivity in the setting of mild cognitive impairment and Alzheimer’s disease.43 In subsequent work, we will perform volumetric analysis of the PSD and meningeal lymphatics in both the young and older cohort to help distinguish between these two possibilities.
We obtained preliminary data on the reproducibility of our method on 2 participants. There was excellent reliability of PH and TTP in both participants; however, one of the participants showed large percentage differences in rCFV and rCFF, mainly due to high variability in MTT. The MTT metric strongly depends on the temporal resolution. Thus, reliability can likely be improved by increasing the data sampling to improve the temporal resolution which will be assessed in future studies.
Our time-resolved CSF MRI has the following limitations: temporal and spatial resolution of 4D acquisition is about 250 ms around the peak flow with submillimeter resolution; the present study also applied tagging to only one brain hemisphere at the top of the brain; small sample size; and the SIR baseline of tagged MRI signal curve relies on the TEeff of the tag-on images as non-zero signal. Nevertheless, our time-resolved study shows that oblique-sagittal tagged CSF travels in both pathways from the dura mater and upper PSD to the SSS and the lower PSD to the SSS by the subtraction color images and the quantitative SIR analysis. Regarding the extra selective IR pulse in the tag-on acquisition, there is a magnetization transfer (MT) effect in the brain parenchyma; however, we have not observed the MT effect using long TI periods, as well as we believe CSF has less MT effect.23
Conclusion
In conclusion, our experimental findings from the subtraction of tag-on and tag-off images in the healthy human adults reveal egress pathways of tagged CSF outflow from the upper PSD and the lower PSD to the SSS. This outflow is quantifiable, and initial results show strong differences in CSF outflow metrics with age among healthy adults. Our non-invasive non-contrast tagged MRI method may be an important enabling technology to non-invasively study CSF outflow in sleep, across the circadian rhythm and in response to exercise and other interventions that may impact the glymphatic system. Furthermore, this method may help increase knowledge of CSF outflow contributions to pathological brain changes normal aging, in the setting of neurodegenerative disorders as well as in patients with altered CSF flow dynamics, such as idiopathic normal pressure hydrocephalus.
Acknowledgments
The authors thank Professor Alexander Norbash, Department Chair of Radiology, University of California San Diego (UCSD), for his support on this project. The authors also thank Mr. Jirach Kungsamutr (UCSD) for his help on data analysis, Dr. Xiaowei Zhang (UCSD) for reviewing the regions of interest, Dr. Yoshimori Kassai and Mr. Yurian Falls of Canon Medical Systems for their technical support.
Funding Statement
This work was supported by an NIH grant RF1AG076692 (M.M.) and a grant by Canon Medical Systems, Japan (35938).
*The funders had no role in study design, data collection, and interpretation, or the decision to submit the work for publication.
Footnotes
Conflicts of interest
All authors have no conflicts of interest.
Supplementary Information
Supplementary files below are available online.
Supplementary Fig. 1.
Axial (left), coronal (middle), and sagittal (right) localizer images from the left show the positions of the 3D imaging slab and the tag pulse. The oblique tag pulse is perpendicularly applied to the 3D coronal imaging slab.
Supplementary Fig. 2.
Three subtraction color images of tagged CSF at TI of 500, 750, 1000, 1250, 1500, and 2000 ms of (a) 30 years old male, (b) 19 years old male, and (c) 36 years old female participants. Enlargements show the CSF from dura mater (white arrows). (a) and (c) show a signal from another route near the lower PSD (red arrows). (b) shows tagged CSF signals that seem to travel to the left lower PSD and then to the right lower PSD.
Supplementary Fig. 3.
Four example images of tagged glymphatic color maps at TI of 500, 750, 1000, 1250, 1500, 2000, and 3000 ms in two younger (top) and two older (bottom) adults. The younger adults show bright signals in the SSS region 1000–1500 ms; signals in the older adult images are less bright. Note that the fusion image with TI 500 ms was used with tagged MRI color images covering the entire SSS region including upper PSD, lower PSD, and SSS at a slice of 3D images using various TI periods.
Supplementary Fig. 4.
Re-test reliability of the tagged CSF outflow measurements for two participants. Percent differences in PH and TTP have less than 10%. For participant 1, there was little difference in outflow metrics between the two scans. For participant 2, there was no difference in PH between scans, and little difference in TTP, but the larger difference in MTT (41%) between the two scans resulted in somewhat more variability between scans for rCFV and rCFF (23%).
Supplementary Fig. 5 and Movie 1.
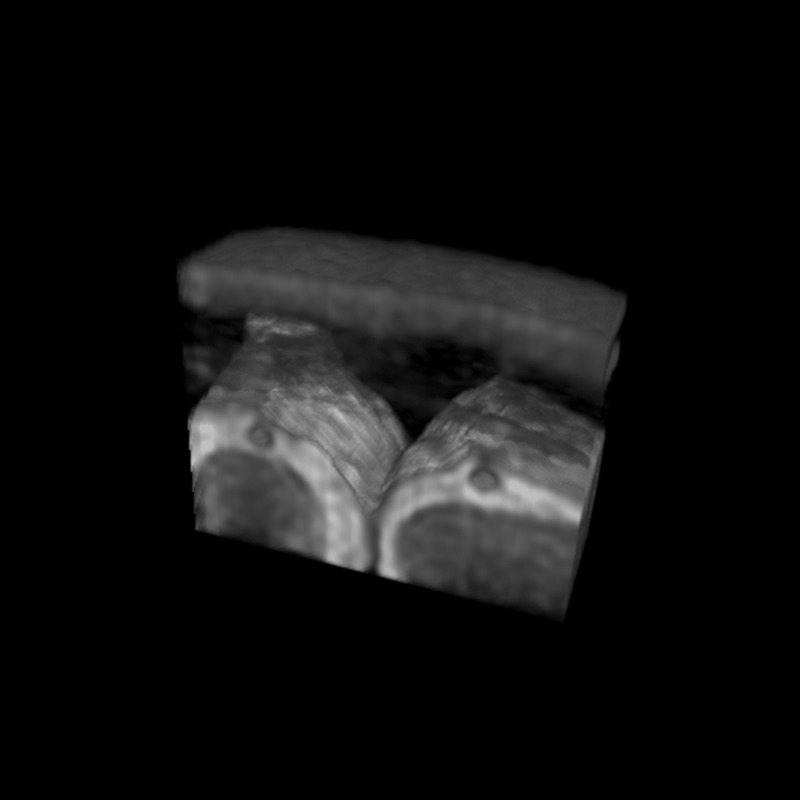
Left and middle images from Fig. 5 (a) and (b), respectively. (a) Coronal T2-weighted 3D cSSFSE image. The yellow box indicates the meninges region. (b) Enlargement of yellow box. The oblique outflow 3D images covering 20 slices (about 20 mm) with T2-weighted 3D cSSFSE. Right video shows various TI periods (250–3000 ms), corresponding to (b). Tagged CSF signals from the left side of brain outflow into the SSS, via along the upper and lower PSD.
References
- 1.Nedergaard M. Garbage trunk of the brain. Science 2013; 340:1529–1530. [DOI] [PMC free article] [PubMed] [Google Scholar]
- 2.Iliff JJ, Wang M, Liao Y, et al. A paravascular pathway facilitates CSF flow through the brain parenchyma and the clearance of interstitial solutes, including amyloid β. Sci Transl Med. 2012; 4:147ra111. [DOI] [PMC free article] [PubMed] [Google Scholar]
- 3.Iliff JJ, Wang M, Zeppenfeld DM, et al. Cerebral arterial pulsation drives paravascular CSF-interstitial fluid exchange in the murine brain. J Neurosci 2013; 33:18190–18199. [DOI] [PMC free article] [PubMed] [Google Scholar]
- 4.Benveniste H, Lee H, Volkow ND. The glymphatic pathway: waste removal from the CNS via cerebrospinal fluid transport. Neuroscientist 2017; 23:454–465. [DOI] [PMC free article] [PubMed] [Google Scholar]
- 5.Jessen NA, Munk ASF, Lundgaard I, Nedergaard M. The brain system – a beginner’s guide. Neurochem Res 2015; 40:2583–2599. [DOI] [PMC free article] [PubMed] [Google Scholar]
- 6.Kress BT, Iliff JJ, Xia M, et al. Impairment of paravascular clearance pathways in the aging brain. Ann Neurol 2014; 76:845–861. [DOI] [PMC free article] [PubMed] [Google Scholar]
- 7.Ringstad G, Eide PK. Cerebrospinal fluid tracer efflux to parasagittal dura in humans. Nat Commun 2020; 11:354. [DOI] [PMC free article] [PubMed] [Google Scholar]
- 8.Pollay M. The function and structure of the cerebrospinal fluid outflow system. Cerebrospinal Fluid Res 2010; 7:9. [DOI] [PMC free article] [PubMed] [Google Scholar]
- 9.Sakka L, Coll G, Chazal J. Anatomy and physiology of cerebrospinal fluid. Eur. Anna. Otorhinolaryngology, Head and Neck Diseases 2011; 128:309–316. [DOI] [PubMed] [Google Scholar]
- 10.Absinta M, Ha SK, Nair G, et al. Human and nonhuman primate meninges harbor lymphatic vessels that can be visualized noninvasively by MRI. eLife 2017; 6:e29738. [DOI] [PMC free article] [PubMed] [Google Scholar]
- 11.Aspelund A, Antila S, Proulx ST, et al. A dural lymphatic vascular system that drains brain interstitial fluid and macromolecules. J Exp Med 2015; 212:991–999. [DOI] [PMC free article] [PubMed] [Google Scholar]
- 12.Louveau A, Smirnov I, Keyes T, et al. Structural and functional features of central nervous system lymphatic vessels. Nature 2015; 523:337–341. [DOI] [PMC free article] [PubMed] [Google Scholar]
- 13.Da Mesquita S, Fu Z, Kipnis J. The meningeal lymphatic system: a new player in neurophysiology. Neuron 2018; 100:375–388. [DOI] [PMC free article] [PubMed] [Google Scholar]
- 14.Ahn JH, Cho H, Kim JH, et al. Meningeal lymphatic vessels at the skull base drain cerebrospinal fluid. Nature 2019; 572:62–66. [DOI] [PubMed] [Google Scholar]
- 15.Enzmann DR, Pelc NJ. Normal flow patterns of intracranial and spinal cerebrospinal fluid defined with phase-contrast cine MR imaging. Radiology 1991; 178:467–474. [DOI] [PubMed] [Google Scholar]
- 16.Ichikawa S, Motosugi U, Okumura A, Shimizu T, Onishi H. Measurement of cerebrospinal fluid flow dynamics using phase contrast MR imaging with bilateral jugular vein compression: a feasibility study in healthy volunteers. Magn Reson Med Sci 2018; 17:265–268. [DOI] [PMC free article] [PubMed] [Google Scholar]
- 17.Evans PG, Sokolska M, Alves A, et al. Non-invasive MRI of blood-cerebrospinal fluid barrier function. Nat Commun 2020; 11:2081. [DOI] [PMC free article] [PubMed] [Google Scholar]
- 18.Petitclerc L, Hirschler L, Wells JA, et al. Ultra-long-TE arterial spin labeling reveals rapid and brain-wide blood-to-CSF water transport in humans. Neuroimage 2021; 245:118755. [DOI] [PMC free article] [PubMed] [Google Scholar]
- 19.Kidoh M, Shinoda K, Kitajima M, et al. Deep learning based noise reduction for brain MR imaging: test on phantoms and healthy volunteers. Magn Reson Med Sci 2020; 19:195–206. [DOI] [PMC free article] [PubMed] [Google Scholar]
- 20.Miyazaki M, Lee VS. Nonenhanced MR angiography. Radiology 2008; 248:20–43. [DOI] [PubMed] [Google Scholar]
- 21.Miyazaki M, Isoda H. Non-contrast-enhanced MR angiography of abdomen. Eur J Radiol 2011; 80:9–23. [DOI] [PubMed] [Google Scholar]
- 22.Miyazaki M, Akahane M. Non-contrast enhanced MR angiography: established techniques. J Magn Reson Imaging 2012; 35:1–19. [DOI] [PubMed] [Google Scholar]
- 23.Miyazaki M, Zhou X, Hoshino T, Yokoyama K, Ishimura R, Nitatori T. Non-contrast myocardial perfusion using a novel 4D magnetic resonance arterial spin labeling technique: initial experience. Microvasc Res 2015; 98:94–101. [DOI] [PubMed] [Google Scholar]
- 24.Wheaton AJ, Miyazaki M. Non-contrast enhanced MR angiography: physical principles. J Magn Reson Imaging 2012; 36:286–304. [DOI] [PubMed] [Google Scholar]
- 25.Huber F. A logical introduction to probability and induction. New York:Oxford University Press. 2018; 80. [Google Scholar]
- 26.Chan AA, Nelson AJ. Simplified gamma-variate fitting of perfusion curves. 2004 2nd IEEE International Symposium on Biomedical Imaging: Nano to Macro (IEEE Cat No. 04EX821) 2004; 2:1067-1070. [Google Scholar]
- 27.Copen WA, Schaefer PW, Wu O. MR perfusion imaging in acute ischemic stroke. Neuroimaging Clin N Am 2011; 21:259–283. [DOI] [PMC free article] [PubMed] [Google Scholar]
- 28.Lu H, Ge Y. Quantitative evaluation of oxygenation in venous vessels using T2-relaxation-under-spin-tagging MRI. Magn Reson Med 2008; 60:357–363. [DOI] [PMC free article] [PubMed] [Google Scholar]
- 29.Chen JJ, Pike GB. Human whole blood T2 relaxometry at 3 Tesla. Magn Reson Med 2009; 61:249–254. [DOI] [PubMed] [Google Scholar]
- 30.Zhao JM, Clingman CS, Narvainen MJ, Kauppinen RA, van Zijl PC. Oxygenation and hematocrit dependence of transverse relaxation rates of blood at 3T. Magn Reson Med 2007; 58:592–597. [DOI] [PubMed] [Google Scholar]
- 31.Metzger F, Mischek D, Stoffers F. The connected steady state modal and the interdependence of the CSF proteome and CSF flow characteristics. Front Neurosci 2017; 11:241. [DOI] [PMC free article] [PubMed] [Google Scholar]
- 32.Benveniste H, Liu X, Koundal S, Sanggaard S, Lee H, Wardlaw J. The glymphatic system and waste clearance with brain aging: a review. Gerontology 2019; 65:106–119. [DOI] [PMC free article] [PubMed] [Google Scholar]
- 33.Hou Y, Dan X, Babbar M, et al. Aging as a risk factor for neurodegenerative disease. Nat Rev Neurol 2019; 15:565–581. [DOI] [PubMed] [Google Scholar]
- 34.Ma Q, Ineichen BV, Detmar M, Proulx ST. Outflow of cerebrospinal fluid is predominantly through lymphatic vessels and is reduced in aged mice. Nat Commun 2017; 8:1434. [DOI] [PMC free article] [PubMed] [Google Scholar]
- 35.Oshio K, Yui M, Shimizu S, Yamada S. The spatial distribution of water components with similar T2 may provide insight into pathways for large molecule transportation in the brain. Magn Reson Med Sci 2021; 20:34–39. [DOI] [PMC free article] [PubMed] [Google Scholar]
- 36.Albayram MS, Smith G, Tufan F, et al. Non-invasive MR imaging of human brain lymphatic networks with connections to cervical lymph nodes. Nat Commun 2022; 13:203. [DOI] [PMC free article] [PubMed] [Google Scholar]
- 37.Yamada S, Miyazaki M, Kanazawa H, et al. Visualization of cerebrospinal fluid movement with spin labeling at MR imaging: preliminary results in normal and pathophysiologic conditions. Radiology 2008; 249:644–652. [DOI] [PubMed] [Google Scholar]
- 38.Yamada S, Miyazaki M, Yamashita Y, et al. Influence of respiration on cerebrospinal fluid movement using magnetic resonance spin labeling. Fluids Barriers CNS 2013; 10:36. [DOI] [PMC free article] [PubMed] [Google Scholar]
- 39.Naganawa S, Ito R, Taoka T, Yoshida T, Sone M. The space between the pial sheath and the cortical venous wall may connect to the meningeal lymphatics. Magn Reson Med Sci 2020; 19:1–4. [DOI] [PMC free article] [PubMed] [Google Scholar]
- 40.Park M, Kim JW, Ahn SJ, Cha YJ, Suh SH. Aging is positively associated with peri-sinus lymphatic space volume: assessment using 3T black-blood MRI. J Clin Med 2020; 9:3353. [DOI] [PMC free article] [PubMed] [Google Scholar]
- 41.Hett K, McKnight CD, Eisma JJ, et al. Parasagittal dural space and cerebrospinal fluid (CSF) flow across the lifespan in healthy adults. Fluids Barriers CNS 2022; 19:24. [DOI] [PMC free article] [PubMed] [Google Scholar]
- 42.Taoka T, Ito R, Nakamichi R, et al. Diffusion-weighted image analysis along the perivascular space (DWI-ALPS) for evaluating interstitial fluid status: age dependence in normal subjects. Jpn J Radiol 2022; 40:894–902. [DOI] [PMC free article] [PubMed] [Google Scholar]
- 43.Kamagata K, Andica C, Takabayashi K, Saito Y, Taoka T, et al. , Association of MRI indices of glymphatic system with amyloid deposition and cognition in mild cognitive impairment and Alzheimer’s disease. Neurology 2022; 99:e2648–e2660. [DOI] [PMC free article] [PubMed] [Google Scholar]
- 44.Eide PK, Ringstad G. Cerebrospinal fluid egress to human parasagittal dura and the impact of sleep deprivation. Brain Res 2021; 1772:147669. [DOI] [PubMed] [Google Scholar]


