Abstract
Determination of the mRNA start site is the first step in identifying the promoter region, which is of key importance for transcriptional regulation of gene expression. The ‘oligo-capping’ method enabled us to introduce a sequence tag to the first base of an mRNA by replacing the cap structure of the mRNA. Using cDNA libraries made from oligo-capped mRNAs, we could identify the transcriptional start site of an individual mRNA just by sequencing the 5′-end of the cDNA. The fine mapping of transcriptional start sites was performed for 5880 mRNAs in 276 human genes. Contrary to our expectations, the majority of the genes showed a diverse distribution of transcriptional start sites. They were distributed over 61.7 bp with a standard deviation of 19.5. Our finding may reflect the dynamic nature of transcriptional initiation events of human genes in vivo.
INTRODUCTION
In eukaryotes, mRNA is transcribed by a large multi-subunit enzyme called RNA polymerase II (pol II). The transcriptional initiation of mRNAs is preceded by the formation of a pre-initiation complex. This complex consists of pol II and additional protein components, known as general transcription initiation factors (GTFs), such as TFIIA, IIB, IID, IIE, IIF and IIH. These molecules are assembled at the transcription start site (TSS) in a stepwise manner, with the binding of each factor promoting the association of the next (Mitchell and Tjian, 1989; Novina and Roy, 1996; Orphanides et al., 1996; Roeder, 1996; Smale, 1997).
Transcription is regulated by modulating the efficiency of the formation of the pre-initiation complex. The DNA sequence just proximal to or overlapping the mRNA start sites plays the most important role in the regulation. This region is called the promoter, and several sequence elements are embedded in it. They are recognized by GTFs, or tissue-specific or developmental stage-specific transcription regulatory factors (TFs). When these proteins are recruited to the promoter, they accelerate the formation of the pre-initiation complex through direct interaction or by creating a more efficient docking platform, which results in increased transcription.
Among many sequence elements, the TATA box, which is present ∼30 bp upstream of the transcription start site of many genes, is one of the key signals for transcriptional initiation. TATA-binding protein (TBP), a component of TFIID, specifically recognizes this sequence. When TFIID is recruited to the TATA box, it nucleates the formation of the pre-initiation complex (Orphanides et al., 1996; Roeder, 1996; Lee and Young, 1998).
In order to understand the molecular mechanism of the transcription of a gene, it is essential to identify the corresponding promoter, and determination of the mRNA start site is the first step in identifying the promoter. Once the mRNA start sites are determined, it becomes a simple computational task to identify the promoter, because most of the human genomic sequence has been determined (http://www.ncbi.nlm.nih.gov/genome/seq/page.cgi?F=HsHome.html). However, conventional methods for identifying mRNA start sites, such as RNA protection (Berk and Sharp, 1977), primer extension (McKnight and Kingsbury, 1982) or 5′RACE (Schaefer, 1995) are elaborate and sometimes difficult to perform.
The ‘oligo-capping’ method, developed by us, replaces the cap structure, which is present at the 5′-end of eukaryotic mRNAs, with a synthetic oligo-ribonucleotide using three enzymatic reaction steps (Maruyama and Sugano, 1994; also see Methods). This oligo-ribonucleotide serves as a sequence tag for the mRNA cap site, i.e. the mRNA start site. We also developed a method to make a full-length-enriched cDNA library from oligo-capped mRNAs (Suzuki et al., 1997). This type of library contained 50–80% of the full-length cDNAs whose 5′-ends correspond to the mRNA start sites. Thus, these oligo-capped cDNA libraries are good resources for identification of the mRNA start site for many genes.
Using oligo-capped cDNA libraries, we attempted to identify the mRNA start sites and flanking promoter regions at the genome-wide level (Suzuki et al., 2001). We constructed oligo-capped cDNA libraries from 34 kinds of human tissues and cultured cells and sequenced the 5′-ends of 100 000 clones from these cDNA libraries. By clustering the sequence data, we identified the mRNA start sites for at least 2251 genes (Suzuki et al., 2000). Unexpectedly the mRNA start sites were highly divergent in most of the genes examined. Here we report our fine mapping of 5880 mRNA start sites in 276 kinds of human genes and the statistical analysis of the distribution of the mRNA start sites.
RESULTS
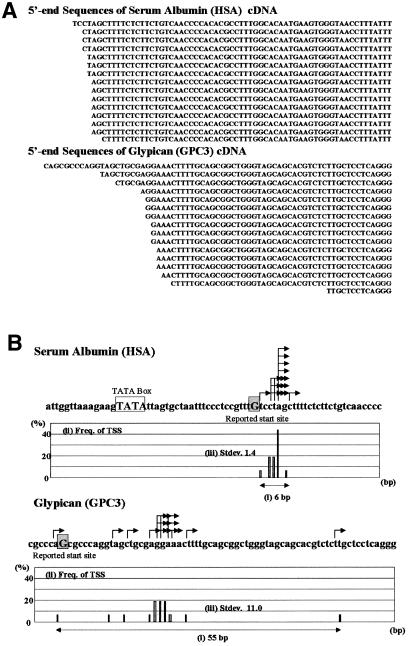
During the clustering of the 5′-end sequences of the oligo-capped cDNAs, we unexpectedly found that mRNA start sites showed heterogeneity for most of the genes. For example, the clustered and aligned 5′-end data of the human serum albumin (HSA) gene (Urano et al., 1986) and glypican (GPC3) gene (Huber et al., 1997) are shown in Figure 1A. Diversity of the mRNA start sites was observed in both cases, although the heterogeneity of serum albumin cDNAs was small and that of glypican cDNAs was more marked.
Fig. 1. Sequence alignment of the 5′-ends of oligo-capped cDNAs (A) and the mapped mRNA start sites (B) of the HSA and GPC3 genes. Arrows show the mapped position of each mRNA start site. Previously reported start sites are shown by upper case letters and shaded boxes. The TATA box reported in the promoter of the HSA gene is also shown by upper case letters and a box. For each gene, the results of the calculation of (i) the distance between the most upstream and most downstream transcription start sites; (ii) the frequency of each transcription start site of the promoter; and (iii) the standard deviation of the start site distribution, are also shown. TSS, transcription start site.
We selected 276 genes whose mRNA start sites were represented by >5 independent 5′-ends of oligo-capped cDNAs and aligned them onto the genomic sequences in DDBJ/EMBL/GenBank. A total of 5880 oligo-capped cDNAs (average redundancy = 22.9) were computationally mapped on the promoters. (In the present study, we putatively defined the region between 500 bp upstream and 100 bp downstream of the most frequent 5′-end of the mRNA as ‘promoter’. Also see Figure 1).
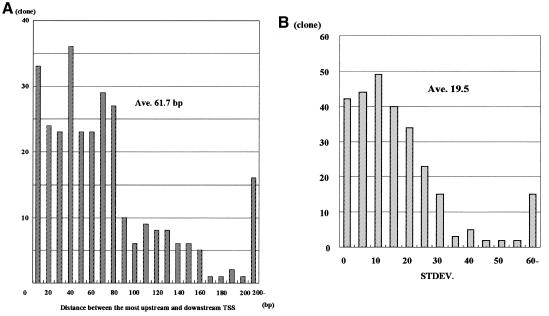
We then analyzed the distribution of the mRNA start sites for these 276 genes. For each gene we determined (i) the distance between the most upstream and the most downstream mRNA start site; (ii) the frequency at which each nucleotide in the promoter is used as a transcription start site; and (iii) the standard deviation of the distribution of the mRNA start sites. Figure 1B shows the results of such an analysis of the human serum albumin and glypican genes. The mRNA start sites of serum albumin and glypican were distributed over 6 and 55 bp, with standard deviations of 1.4 and 11.0, respectively. Figure 2 shows a summary of the values of (i) and (iii), respectively, in 276 genes. The mRNA start sites were on average scattered over 61.7 bp (Figure 2A) with a standard deviation of 19.5 (Figure 2B).
Fig. 2. The distance between the most upstream and the most downstream mRNA start sites (A) and the standard deviation of the distribution of these distances (B) are shown for each gene.
For these analyses, we tentatively defined and selected the oligo-capped cDNAs containing at least the translation initiator ATG as full-length cDNAs (‘Full’ cDNAs). Because of this selection procedure, the frequency of the full-length cDNAs in the current data set should be much higher than the overall frequencies of them in the oligo-capped cDNA libraries, which is estimated at 50–80% (Suzuki et al., 1997). Indeed, >90% of the cDNAs used in this study had longer/almost the same 5′-ends compared with any other previously reported cDNAs (data not shown; also see Suzuki et al., 2000).
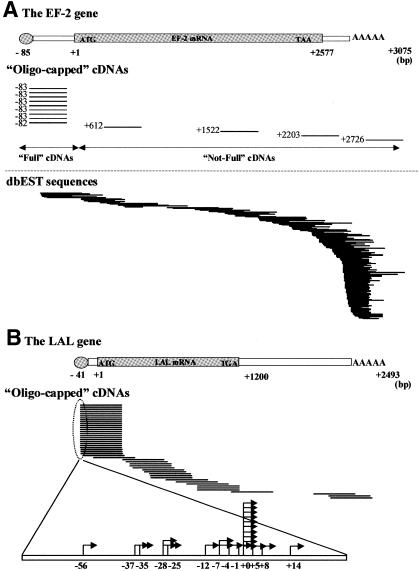
In order to exclude the possibility that the heterogeneity of the 5′-ends of the cDNAs observed in Figure 1 could be traced to an oligo-capping error, it was also important to examine how the 5′-ends of the truncated cDNAs, which have been removed from our data set, are distributed. For this purpose, we aligned all the oligo-capped cDNAs onto the previously identified cDNA sequences. Figure 3 shows the case of the elongation factor 2 (EF-2) gene and the lysosomal acid lipase (LAL) gene. Thirteen oligo-capped cDNAs were identical to the EF-2 mRNA in total. According to our criterion mentioned above, nine out of 13 oligo-capped cDNAs (69%) were categorized as ‘Full’. The other four cDNAs were categorized as ‘Not-Full’. Incomplete enzymatic reaction (especially in BAP treatment step) might have caused the erroneous oligo-capping in these cases.
Fig. 3. Sequence alignments between the oligo-capped cDNAs and previously reported cDNA sequences of the EF-2 [(A) NM_001961] and LAL [(B) NM_000235] genes. (A) The bars in the upper panel represent the 5′-end positions of the oligo-capped cDNAs. The bars in the lower panel represent those of dbEST sequences. The number attached to each bar represents the position of the 5′-end of the cDNA relative to the EF-2 cDNA. (B) The mapped start sites of the ‘Full’ cDNAs of the LAL gene were also shown in the lower panel.
As shown in Figure 3, the start sites of the ‘Full’ cDNAs were clustered to some extent, although the width of distribution of start sites differs between genes. On the contrary, the positions of the 5′-ends in the ‘Not-Full’ cDNAs are randomly distributed along the mRNA, which is similar to the case of the dbESTs sequences (Figure 3A, lower panel). These results strongly suggest that most of the cDNAs used in this study are really full-length cDNAs, and the diversity of the 5′-ends of mRNAs is actually a reflection of multiple transcriptional initiation events in vivo.
The range of distribution of the start sites was significantly variable from gene to gene. We examined whether any sequence element present within the promoter correlates with the distribution.
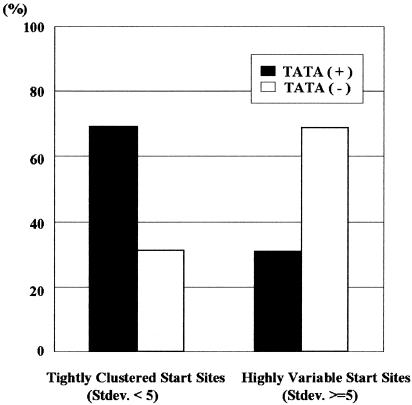
We tentatively divided the genes into two groups; genes with highly variable transcription start sites (SD ≥5) and genes with tightly clustered start sites (SD <5). According to this criterion, 42 genes (15%) were categorized as genes with tightly clustered start sites and 234 (85%) as genes with highly variable start sites. It should be also noted that only in five genes (2%) were the mRNA start sites mapped uniformly to a single position.
We searched the corresponding promoters of the 276 genes for the presence of all 205 types of TF-binding motifs in TRANSFAC (Heinemeyer et al., 1999), using a TF binding motif prediction program, TFBIND (Tsunoda and Takagi, 1999). We performed correlation analysis between the presence of TF-binding motifs and the start site distribution and found that only the TATA box showed a significant effect on the start site distribution. The presence of the TATA box was characteristic of the promoters of genes with tightly clustered transcription start sites (Figure 4).
Fig. 4. The proportion of TATA-containing promoters with tightly clustered start sites (left columns) and promoters with highly variable start sites (right columns) is shown.
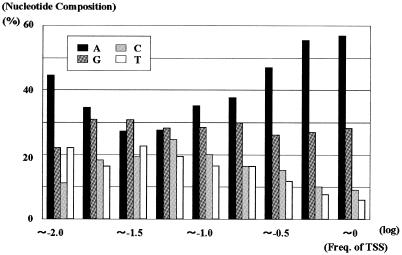
We also examined the nucleotide preference at the transcription start sites. Overall, the nucleotide of the transcription start site was A (47%), G (28%), C (14%) and T (12%). When only the most frequently used transcription start site in each gene were counted, the start site was A (54%), G (28%), C (10%) and T (8%). Figure 5 shows that the first nucleotide was generally a purine, predominantly A, especially at the frequently used start site [see also the figure legend and (ii) in Figure 1B]. In the most frequent start sites (Figure 5, far-right columns), 85% of the first nucleotides were purines and 57% were A. However, this preference was weaker for minor start sites than for major ones. In minor start sites with an x-value of –1.25, the nucleotide preference was A (28%), G (28%), C (25%) and T (19%).
Fig. 5. The nucleotide preference of the transcription start site. The x-axis indicates whether the start sites were frequently used ones or minor ones. For example an x-value of –1.0, means that this start sites would be used once if ten mRNAs were transcribed. Nucleotide composition was calculated for each population of the transcription start sites [also see (ii) in Figure 1B].
DISCUSSION
This is the first report showing that transcription is initiated from a relatively wide region for most of the human genes in vivo. Although in vitro experiments using cell-free systems and viral promoters (e.g. adenovirus major late promoter) revealed that the diverse transcriptional initiation occurs especially when the canonical TATA box is lacking from the promoter (Roeder, 1996; Smale, 1997), there has been no report showing whether such a diverse initiation event is actually occurring in human cells at the genome-wide level in vivo. In most cases, the transcription start sites have been regarded as ‘regions’ rather than as static ‘positions’. Previous reports have usually described only one or at most a few transcription start sites for each gene (see also the Eukaryotic Promoter Database, which collects the previously reported transcription start sites, at http://www.epd.isb-sib.ch; Perier et al., 2000). As shown in Figure 1B, even if a gene has multiple start sites, most of them have been overlooked. In the case of the HAS gene and the GPC3 gene, the start sites identified at most upstream positions seem to have been registered, although they represent minor start sites in our study.
This may be due to the indirect nature of the conventional methods, which rely on the principle that the 5′-end of the longest cDNA should be considered as the start site (Berk and Sharp, 1977; McKnight and Kingsbury, 1982; Schaefer, 1995). Since the oligo-capping method allowed us to identify the position of the cap structure of mRNA directly (Maruyama and Sugano, 1994), the accuracy and reliability of the detected mRNA start sites have been improved compared with those in the conventional methods.
It is unlikely that the diverse mRNA start sites described in this report were derived from erroneous products of the oligo-capping or the cDNA cloning. Considering the success rate of oligo-capping reaction is 50–80%, there should only be a rare chance that the mRNAs were truncated and wrongly oligo-capped in clustered positions (Figures 1 and 3). It is also unlikely that deletion of the cDNA ends occurred during the cDNA cloning, because once the 5′-oligo is introduced to the 5′-end of the mRNA, it protects the first nucleotide of mRNA from being chewed by exonucleases.
A significant population of the genes examined show start sites >100 bp apart (Figure 2A). In some of these genes, transcription might be fired from relatively close, multiple promoters. This type of arrangement has been observed in some previously characterized promoters (e.g. in human N-myc promoter; Stanton and Bishop, 1987). Indeed, in some genes, the distribution patterns of the start sites seem to be a combination of the multiple tightly clustered start sites (data not shown). However, as shown in Figure 1B, it seems unlikely that each of the start sites in the GPC3 gene are driven from the separate promoters. More likely, a single promoter of this gene has the ability to arrange the transcriptional initiation from a >50 bp-wide region. Because it was not easy to distinguish whether multiple or single promoters drive the start site cluster, especially when the clusters are mutually near or overlapped, we did not analyze them separately.
The distribution of transcription start sites differs from gene to gene despite the fact that all the mRNAs are transcribed by pol II. Our data set might be biased for highly-expressed genes because we selected the genes whose transcriptional start sites were represented by >5 oligo-capped cDNAs. However, it was intriguing that the diverse start sites were observed for most of the genes examined. At present, we do not know the molecular mechanism by which the distribution of the mRNA start sites is determined. Pol II itself does not have the property of sequence-specific binding. It relies on GTFs and TFs for promoter recognition. We could not find any evidence that the distribution of the start sites correlates with GTFs or TFs, except for the effect of the TATA box (Figure 4). There might be some other GTFs or TFs that determine the distribution. The distribution of the start sites might also reflect more flexible interactions between DNA, GTFs, TFs and the pol II complex.
The presence of the TATA box was characteristic of the promoters with tightly clustered mRNA start sites (Figure 4). The crystal structure of the ternary complex of TFIIB–TBP–TATA box has shown that the DNA backbone is bent by 90° when TBP is recruited to the TATA box (Nikolov et al., 1995). This structural change may cause the DNA to be anchored rigidly to the polymerase active site of the pre-initiation complex. Once such a rigid interation is formed, the position of the transcriptional start site relative to the active site should be strictly determined. Thus, in the TATA-containing promoters the transcriptional start sites were tightly clustered. In contrast, if there is no TATA box in the promoter, the active site may remain unstable on the promoter. A recent structural analysis also suggests that the fitting of the DNA into the active site is likely to be flexible in yeast polymerase II (Fu et al., 1999). Without the anchoring effect of the TATA box, the active site would slide over the promoter, which results in transcriptional initiation from widely distributed positions.
In this report, we described the diverse distribution of the mRNA start sites, which should reflect the dynamic nature of the transcriptional initiation events in vivo. Precise information about the position and the frequency of the initial nucleotide of the transcription presented in this study should lay the groundwork for elucidating the biophysical principles that govern transcription initiation.
METHODS
Construction of oligo-capped cDNA libraries and sequencing analysis. Oligo-capped cDNA libraries were constructed as previously reported (Suzuki et al., 1997, 2000). The cap structure of the mRNA was replaced with a 5′-oligo-ribonucleotide by the oligo-capping method, which consists of three enzymatic reaction steps. First, bacterial alkaline phosphatase (BAP) hydrolyses the phosphate of truncated mRNA 5′-ends whose cap structures have been broken down. Then, tobacco acid pyrophosphatase (TAP) removes the cap structure, leaving a phosphate at the 5′-end. Finally, T4 RNA ligase, which requires a phosphate at the 5′-end as its substrate, selectively ligates the 5′-oligo to the 5′-end that originally had the cap structure. Using oligo-capped mRNA, first strand cDNA was synthesized with oligo(dT) adapter primer to prepare a ‘full-length enriched’ library, and random hexamer adaptor primer to prepare a ‘5′-end enriched’ library. The 5′-end enriched libraries were intended to cover the 5′-ends of long mRNAs. After alkaline degradation of the RNA, first strand cDNA was amplified by PCR, digested with restriction enzyme SfiI and cloned into a plasmid vector. For further details of the procedure see Suzuki et al. (1997, 2000). The sources of cDNA libraries were also described elsewhere (Suzuki et al., 2000).
Mapping of the mRNA start sites onto the genomic sequences. Sequence similarity was matched against DDBJ/EMBL/GenBank (Release 102.0) using BLASTN (Altschul et al., 1990). The cDNAs matched with named genes were clustered to create a non-redundant data set. The cDNAs lacking the annotated translation initiator ATG were removed from the data set as erroneous products of the oligo-capping. For alignment of the 5′-ends of the cDNAs onto the genomic sequence, genomic sequences were downloaded from (ftp://ncbi.nlm.nih.gov/genbank/genomes/H_sapiens/) on February 8, 2000, when draft and finished sequences altogether had covered about 60% of the entire human genome. These sequences were first roughly searched with BLAST, using 100 bp sequences from the 5′-ends of oligo-capped cDNAs. The exact alignment between cDNAs and genome sequences were confirmed with CLUSTAL_W (Thompson et al., 1994). When 23 out of 25 bp from the 5′-ends of the cDNAs were matched, the corresponding genomic sequences were retrieved. The promoters were defined as the sequences ranging from 500 bp upstream to 100 bp downstream of the mapped 5′-ends of the oligo-capped cDNAs. Repetitive sequence elements were masked using CENSOR (Jurka et al., 1996).
Prediction of the TATA box in the promoter. For the prediction of the TATA box in the promoters, TFBIND was obtained form Dr T. Tsunoda. TRANSFAC were from http://transfac.gbf.de/index.html. Using TFBIND and TF frequency matrices in TRANSFAC, matching scores were calculated for the promoter sequences. Since the preferred position of the TATA box has been calculated as between –40 and –23 (Tsunoda and Takagi, 1999), the promoter sequences between –90 and +27 were searched. The 50 bp margins were added at each end of the preferred region, considering the distribution of the start site. As for all the 205 kinds of TF-binding matrices in TRANSFAC, corresponding TF binding sites were searched similarly.
Accession numbers. The nucleotide sequences reported in this paper have been deposited in the DDBJ/EMBL/GenBank with the accession Nos of AU102218–108097.
Acknowledgments
ACKNOWLEDGEMENTS
We thank Y. Shirai, Y. Takahashi and T. Sato for their technical support. We are also thankful to M. Hida for helpful discussions. We are grateful to E. Nakajima for critical reading of the manuscript. This work was supported by a Grant-in-Aid for Scientific Research on Priority Areas from the Ministry of Education, Science, Sports and Culture of Japan and by special coordination funds for promoting science and technology (SCF) from the Science and Technology Agency (STA) of Japan.
References
- Altschul S.F., Gish, W., Miller, W., Myers, E.W. and Lipman, D.J. (1990) Basic local alignment search tool. J. Mol. Biol., 215, 403–410. [DOI] [PubMed] [Google Scholar]
- Berk A.J. and Sharp, P.A. (1977) Sizing and mapping of early adenovirus mRNAs by gel electrophoresis of S1 endonuclease-digested hybrids. Cell, 12, 721–732. [DOI] [PubMed] [Google Scholar]
- Fu J., Gnatt, A.L., Bushnell, D.A., Jensen, G.J., Thompson, N.E., Burgess, R.R., David, P.R. and Kornberg, R.D. (1999) Yeast RNA polymerase II at 5 Å resolution Cell, 98, 799–810. [DOI] [PubMed] [Google Scholar]
- Heinemeyer T. et al. (1999) Expanding the TRANSFAC database towards an expert system of regulatory molecular mechanisms. Nucleic Acids Res., 27, 318–322. [DOI] [PMC free article] [PubMed] [Google Scholar]
- Huber R., Crisponi, L., Mazzarella, R., Chen, C.N., Su, Y., Shizuya, H., Chen, E.Y., Cao, A. and Pilia, G. (1997) Analysis of exon/intron structure and 400 kb of genomic sequence surrounding the 5′-promoter and 3′-terminal ends of the human glypican 3 (GPC3) gene. Genomics, 45, 48–58. [DOI] [PubMed] [Google Scholar]
- Jurka J., Klonowski, P., Dagman, V. and Pelton, P. (1996) CENSOR—a program for identification and elimination of repetitive elements from DNA sequences. Comput. Chem., 20, 119–122. [DOI] [PubMed] [Google Scholar]
- Lee T.I. and Young, R.A. (1998) Regulation of gene expression by TBP-associated proteins. Genes Dev., 12, 1398–1408. [DOI] [PubMed] [Google Scholar]
- Maruyama K. and Sugano, S. (1994) Oligo-capping: a simple method to replace the cap structure of eucaryotic mRNAs with oligoribonucleotides. Gene, 138, 171–174. [DOI] [PubMed] [Google Scholar]
- McKnight S.L., and Kingsbury, R. (1982) Transcriptional control signals of a eukaryotic protein-coding gene. Science, 217, 316–324. [DOI] [PubMed] [Google Scholar]
- Mitchell P.J. and Tjian, R. (1989) Transcriptional regulation in mammalian cells by sequence-specific DNA binding proteins. Science, 245, 371–378. [DOI] [PubMed] [Google Scholar]
- Nikolov D.B., Chen, H., Halay, E.D., Usheva, A.A., Hisatake, K., Lee, D.K., Roeder, R.G. and Burley, S.K. (1995) Crystal structure of a TFIIB-TBP-TATA-element ternary complex. Nature, 377, 119–128. [DOI] [PubMed] [Google Scholar]
- Novina C.D. and Roy A.L. (1996) Core promoters and transcriptional control. Trends Genet., 12, 351–355. [PubMed] [Google Scholar]
- Orphanides G., Lagrange, T. and Reinberg, D. (1996) The general transcription factors of RNA polymerase II. Genes Dev., 10, 2657–2683. [DOI] [PubMed] [Google Scholar]
- Perier R.C., Praz, V., Junier, T., Bonnard, C., and Bucher, P. (2000) The eukaryotic promoter database (EPD). Nucleic Acids Res., 28, 302–303. [DOI] [PMC free article] [PubMed] [Google Scholar]
- Roeder R.G. (1996) The role of general initiation factors in transcription by RNA polymerase II. Trends. Biochem. Sci., 21, 327–335. [PubMed] [Google Scholar]
- Schaefer B. (1995) Revolutions in rapid amplification of cDNA ends: new strategies for polymerase chain reaction cloning of full-length cDNA ends. Anal. Biochem., 227, 255–273. [DOI] [PubMed] [Google Scholar]
- Smale S.T. (1997) Transcription initiation from TATA-less promoters within eukaryotic protein-coding genes. Biochim. Biophys. Acta, 1351, 73–88. [DOI] [PubMed] [Google Scholar]
- Stanton L.W. and Bishop, J.M. (1987) Alternative processing of RNA transcribed from NMYC. Mol. Cell Biol., 7, 4266–4272. [DOI] [PMC free article] [PubMed] [Google Scholar]
- Suzuki Y., Yoshitomo, K., Maruyama, K., Suyama, A. and Sugano, S. (1997) Construction and characterization of a full length-enriched and a 5′-end-enriched cDNA library. Gene 200, 149–156. [DOI] [PubMed] [Google Scholar]
- Suzuki Y. et al. (2000) Statistical analysis of the 5′ untranslated region of human mRNA using ‘oligo-capped’ cDNA libraries. Genomics, 64, 286–297. [DOI] [PubMed] [Google Scholar]
- Suzuki Y. et al. (2001) Identification and characterization of the potential promoter regions of 1031 kinds of human genes. Genome Res., in press. [DOI] [PMC free article] [PubMed] [Google Scholar]
- Thompson J.D., Higgins, D.G. and Gibson, T.J. (1994) CLUSTAL_W: improving the sensitivity of progressive multiple sequence alignment through sequence weighting, positions-specific gap penalties and weight matrix choice. Nucleic Acids Res., 22, 4673–4680. [DOI] [PMC free article] [PubMed] [Google Scholar]
- Tsunoda T. and Takagi, T. (1999) Estimating transcription factor bindability on DNA. Bioinformatics, 15, 622–630. [DOI] [PubMed] [Google Scholar]
- Urano Y., Watanabe, K., Sakai, M., and Tamaoki, T. (1986) The human albumin gene. Characterization of the 5′ and 3′ flanking regions and the polymorphic gene transcripts. J. Biol. Chem., 261, 3244–3251. [PubMed] [Google Scholar]


