Abstract
An essential issue derived from the sequencing of the human and other genomes is the identification of gene regulatory elements. Using in vivo footprinting and expression analysis, here we show that mouse and human CpG island promoters at homologous genes have a completely different organization in terms of size and binding of transcription factors. Despite these species-specific differences, a unifying picture emerges from the precise confinement of protein–DNA interactions between the 5′ boundary of the CpG islands and the transcription initiation site. This finding allows direct localization of promoters on genomic sequences and reveals a very high rate of variation and evolutionary divergence of mammalian regulatory regions. Our results also show that CpG island promoters associated with tissue-specific genes, such as the human α-globin, are bound by ubiquitous factors that allow a constitutive low level of expression in many cell types.
INTRODUCTION
Mammalian promoters belong to two different categories in terms of base composition and DNA methylation. In human and mouse, approximately half of them have a G+C content and a methylation pattern that are undistinguishable form bulk DNA and are invariably associated with tissue-specific genes. The other half are associated with CpG islands, which are regions devoid of methylation and have a G+C content higher than the genome average. They remain non-methylated throughout development regardless of the expression of the gene, with the exception of CpG islands in the inactive X chromosome and those at imprinted genes. All housekeeping genes and many tissue-specific genes fall within this group (Antequera and Bird, 1993). The relationship between CpG islands and gene promoters has long been known (Bird, 1987; Gardiner and Frommer, 1987) and has been exploited to identify and validate the presence of genes within the recently completed sequence of the human genome (Lander et al., 2001; Venter et al., 2001).
An interesting feature of CpG islands is that, while maintaining the distinctive G+C composition and lack of methylation common to all of them, each one is unique in terms of sequence and position relative to the transcription initiation site (see below). This uniqueness is consistent with the proposed origin of the CpG islands in the vertebrate genome as regions under a mutational pressure different from the rest of the genome because of their dual role as promoters and DNA replication origins (Delgado et al., 1998; Antequera and Bird, 1999). As a consequence, comparison of CpG island sequences, even when associated to homologous genes, discloses no significant homology (Broderick et al., 1987; Zhao et al., 1998). This, together with the short, dispersed and degenerated nature of regulatory elements that make up promoters, explains the difficulty involved in their identification by sequence comparison (Prestridge, 1995; Duret and Bucher, 1997; Hardison et al., 1997; Tautz, 2000).
In this article, we describe the organization of promoters at CpG islands at mouse and human homologous genes by in vivo footprinting. Our results reveal a disparate pattern of protein–DNA interactions at regulatory regions of genes whose genomic organization, sequence and expression pattern are highly conserved between both organisms.
RESULTS
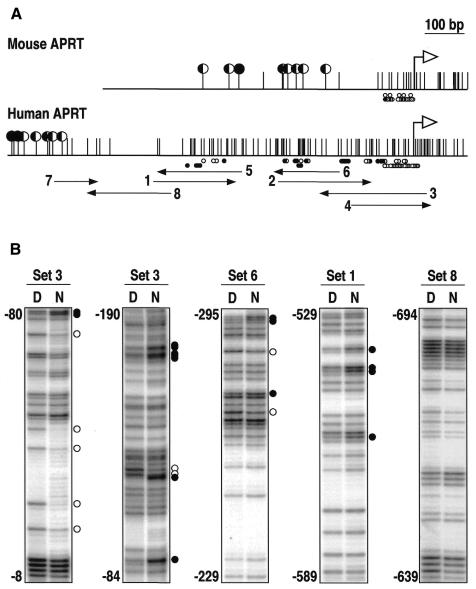
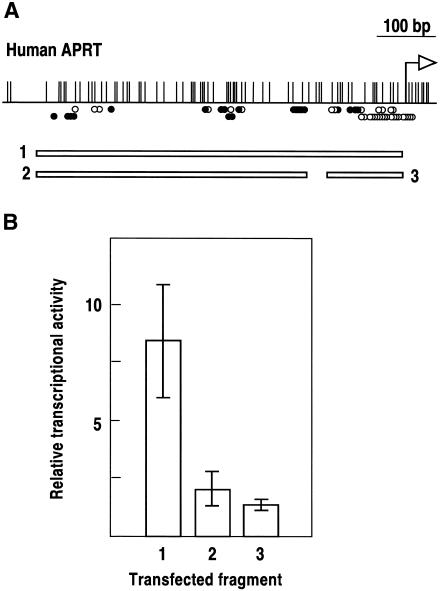
The promoter of the mouse adenosine phosphoribosyl transferase gene (APRT) lies within a CpG island and has been characterized by transient transfection experiments (Dush et al., 1988) and by in vivo footprinting analysis (Macleod et al., 1994). The promoter extends 100 bp upstream from the major transcription initiation site up to the 5′ boundary of the unmethylated CpG-rich region (Figure 1A). The human APRT gene has a very similar genomic organization and its coding sequence is 82% identical to that of the mouse homolog (Broderick et al., 1987). In contrast, the CpG island at the human APRT gene stretches ∼600 bp upstream from the transcription initiation point (Figure 1A). To analyze the organization of the human promoter relative to the CpG island, we mapped the boundary of the unmethylated region by bisulfite analysis and footprinted in vivo a 1 kb region spanning the 5′ end of the CpG island. The results shown in Figure 1 define a region of multiple protein–DNA interactions encompassing the 600 bp CpG-rich region. No interactions were detected along the 350 bp further upstream footprinted with oligonucleotide sets 7 and 8 (Figure 1). Given the differences in the pattern of protein–DNA interactions between the mouse and human APRT upstream sequences, we asked whether the entire 600 bp region was required for transcription. We cloned this region and two subfragments of 112 and 430 bp (Figure 2A) immediately upstream from a minimal promoter driving the chloramphenicol acetyltransferase (CAT) gene, and the constructs were transiently transfected into HeLa cells. Figure 2B shows that both subfragments can activate transcription independently but that there is a strong synergic effect when combined, suggesting that most or all of the elements along the 600 bp region contribute to the transcriptional activation of the human APRT gene.
Fig. 1. In vivo footprinting of the human APRT gene 5′ region. (A) Genomic maps of the mouse and human APRT gene 5′ regions. Large black or half filled circles indicate fully or partially methylated CpG dinucleotides, respectively. Vertical lines without a circle represent unmethylated CpGs. White arrows show the transcription initiation site. Small black or white circles below each map represent hyper- and hyporeactive guanines on each DNA strand, respectively. Numbered black arrows span the regions footprinted with eight sets of oligonucleotides. Data for the mouse APRT gene are taken from Macleod et al. (1994). (B) Examples of in vivo footprinting analyses in human HeLa cells. Paired tracks show reactivity to DMS of guanines on naked DNA (D) and nuclei (N). Black or white circles represent hyper- or hyporeactive guanines, respectively, along the regions between the nucleotide positions indicated on the left of each panel. Numbering is relative to the transcription initiation site.
Fig. 2. Expression analysis of the human APRT gene promoter. (A) The three indicated fragments from positions –590 to –10 (1), –590 to –160 (2) and –122 to –10 (3) upstream from the human APRT gene were cloned immediately upstream from a minimal thymidine kinase promoter driving the CAT gene, transfected into HeLa cells and tested for their ability to activate transcription. The in vivo footprint diagram of Figure 1 is shown above for reference. A small region of 38 bp between fragments 2 and 3, not bound by factors in vivo, was not included in the analysis for technical reasons. (B) Fragments 1, 2 and 3 were capable of activating transcription 1.3-, 2.0- and 8.2-fold relative to the minimal promoter without any enhancer, respectively. Segments indicate standard deviation of four independent transfection experiments.
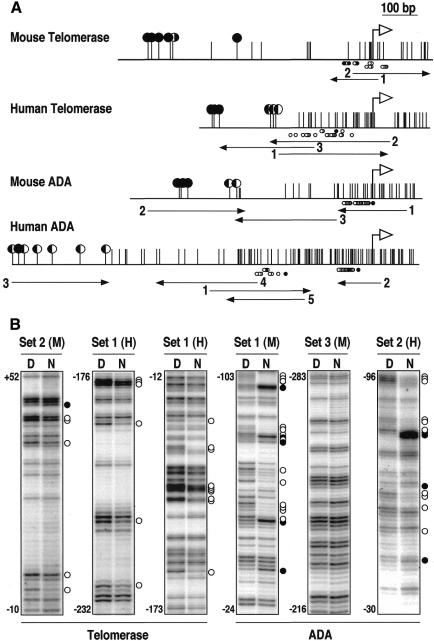
The localization of proximal regulatory sequences of the human and mouse APRT gene between the 5′ boundary of the CpG island and the transcription initiation site opened the possibility of predicting the localization of the cis-regulatory regions of CpG island genes. To test this possibility, we footprinted the 5′ regions of two pairs of mouse and human homologous genes with differently positioned CpG islands relative to the transcription initiation site: the telomerase RNA gene and the adenosine deaminase (ADA) gene (Figure 3A). Results shown in Figure 3B show that, as in the case of the APRT gene, the pattern of protein–DNA interactions is strikingly different in both organisms (Figure 3). The regions of protein–DNA interaction in the telomerase RNA genes exactly coincided with the minimal promoters defined previously by transient transfection experiments (Zhao et al., 1998) and, together with the APRT expression analysis (Figure 2), suggest that the regions defined by in vivo footprinting are required for the expression of these genes. A search of the TRANSFACT database with the sites containing reactive guanines showed that some of them corresponded to Sp1 and other well characterized transcriptional activators (see Supplementary data, available at EMBO reports Online).
Fig. 3. In vivo footprinting of the mouse and human telomerase RNA and ADA 5′ gene regions. (A) Genomic maps of the footprinted regions. Symbols are as in Figure 1. (B) Examples of in vivo footprinting analyses of the four 5′ gene regions shown in (A). Footprints corresponding to mouse NIH cells (M) or human 293 kidney cells (H) are indicated along with the primer set used in each case. The panel corresponding to ADA Set 3(M) is shown as an example of a region without detectable protein–DNA interactions. Other symbols are as in Figure 1.
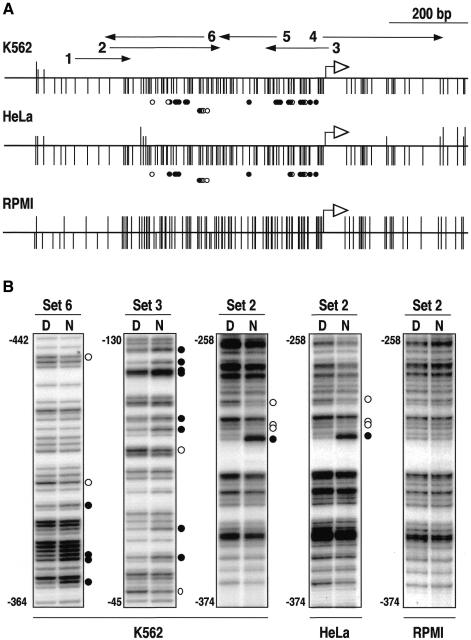
Approximately 50% of all CpG islands are associated with tissue-specific genes (Antequera and Bird, 1993). To test whether the same promoter organization also applies to them, we decided to study the human α-globin gene, which is associated with a non-methylated CpG island in all tissues regardless of its expression (Bird et al., 1987). We footprinted a region 1.2 kb long encompassing the transcription initiation site in human K562 leukemia cells that actively express the α-globin gene. Our results revealed extensive protein–DNA interactions across the entire 500 bp CpG-rich region immediately upstream from the transcription initiation site (Figure 4), suggesting a similar organization of CpG island promoters at housekeeping and tissue-specific genes.
Fig. 4. In vivo footprinting of the 5′ region of the human α-globin gene. (A) CpG methylation map of K562, HeLa and RPMI 8420 cells. Vertical lines below each diagram represent CpG dinucleotides tested for methylation. A vertical upward extension of the same length indicates full methylation of this site. Half of the extension or no extension indicates partial methylation or no methylation, respectively. The entire CpG island is almost fully methylated in RPMI 8420 cells. (B) Examples of in vivo footprinting analyses. The same region between positions –258 and –374 covered by primer set 2 is shown for K562, HeLa and RPMI 8420 cells for comparison. Symbols are as in Figure 1.
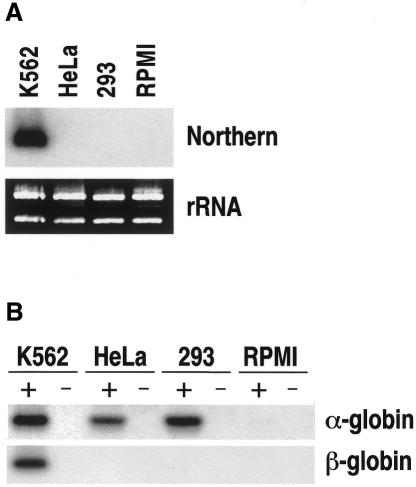
An interesting point emerging from these results is whether there might be any promoter occupancy in cells where the α-globin gene is not transcribed. We addressed this question by footprinting analysis in HeLa cells, in which transcription of the α-globin gene is undetectable by northern blotting (Figure 5A). Surprisingly, except for a few minor differences, the pattern of protein–DNA interaction was identical to that found in K562, (Figure 4 and Supplementary data). This suggested that most of the factors bound in both cell types are probably ubiquitous. In view of these results, we reassessed the expression level by RT–PCR and found that the gene is transcribed at a low rate in HeLa cells (Figure 5B). To monitor how general this situation was in non-erythroid cells, we also tested the expression of the α-globin gene in the human embryonic kidney cell line 293 whose CpG island is also non-methylated (data not shown). No mRNA was detected by northern analysis (Figure 5A) but a low level of expression comparable to that found in HeLa cells was detected by RT–PCR. In both cases, this level was approximately four orders of magnitude lower than in K562 cells (Figure 5B). In contrast, transcription of the β-globin gene, which is not associated with a CpG island, was detected by RT–PCR only in K562 cells (Figure 5B).
Fig. 5. Expression analysis of the human α- and β-globin genes. (A) Thirty micrograms of total RNA from K562, HeLa, 293 and RPMI 8420 cells were electrophoresed, blotted and hybridized using a human α-globin probe. Ribosomal RNA is shown as a loading control (rRNA). (B) For RT–PCR, 2 µg of total RNA from the same cells were incubated with (+) or without (–) reverse transcriptase and PCR amplified using primers complementary to the first and third exon of the α- or β-globin genes. A 10–4 dilution of the K562 RNA was used to equal the PCR signal obtained for α-globin in HeLa and 293 cells. RT–PCR products were electrophoresed, blotted and hybridized to α- and β-globin-specific probes.
The large differences in the level of α-globin expression between erythroid and non-erythroid cells and the similarity in the pattern of protein–DNA interactions raised the question of how relevant for transcription the factors bound to the promoter of the gene were. We addressed this question by looking for a cell line where the α-globin CpG island was methylated. We have previously shown that this CpG island often becomes methylated in non-erythroid cultured cells (Antequera et al., 1990). We tested the level of methylation in several human cell lines (data not shown) and found that this CpG island was methylated at virtually all CpGs in the lymphoblastoid cell line RPMI 8420 (Figure 4A). In vivo footprinting showed that methylation effectively prevented protein–DNA interactions since no differences in guanine sensitivity to dimethylsulfate (DMS) between naked DNA and nuclei were detected along the entire footprinted region (Figure 4B). No transcription was detected in these cells even by RT–PCR (Figure 5B), suggesting that the binding of factors to the gene upstream region is at least required for the low expression of the α-globin gene.
The extensive binding of factors to the α-globin promoter in non-erythroid cells can explain the surprising ‘promiscuous expression’ of the human α-globin gene when transfected into non-erythroid cells (Whitelaw et al., 1989). That study failed to detect any sequence responsible for the erythroid-specific expression within or close to the gene. Our findings are compatible with those observations and suggest that regulatory elements distant from the gene could be responsible for the enhancement in erythroid cells of the low constitutive transcription driven by ubiquitous factors in many other cell types. Our results do not preclude, however, the possibility that the subtle differences in protein–DNA interactions between K562 and HeLa cells, or the binding of other undetected factors, could be responsible for the differences in transcriptional activity.
DISCUSSION
The large majority of CpG islands are associated with the 5′ region of genes (Bird, 1987; Gardiner and Frommer, 1987), and previous analyses of several CpG island promoters have shown multiple binding sites for trancription factors (Stapleton et al., 1993; Tommasi and Pfeifer, 1997, 1999). However, the organization of regulatory elements within the frame of the CpG islands has not been addressed systematically. Our results indicate that, in some cases, the unmethylated and the CpG-rich regions do not overlap exactly, suggesting that both features could have been generated by different mechanisms. The short unmethylated and CpG depleted regions at the 5′ boundary of some islands (Figures 1A, 3A and 4A) do not fulfill the definition of CpG islands in terms of G+C content and CpG frequency (Bird, 1986; Gardiner and Frommer, 1987) and we have not detected any factors bound to them. Our finding of the precise circumscription of the protein–DNA interactions between the 5′ boundary of the CpG-rich region and the transcription initiation site will contribute to improving algorithms for identifying elements of transcriptional control in genomic sequences by reducing the ‘space’ of sequences to be analyzed. For example, phylogenetic footprinting of the mouse and human regulatory regions of skeletal muscle-specific genes has shown that limitation of this ‘space’ dramatically reduces the noise generated by false predictions (Wasserman et al., 2000; Ohler and Niemann, 2001).
Our results also provide direct evidence for the divergent evolution of cis-regulatory regions in mammals. Previous comparative analysis of CpG island sequences between human and mouse APRT and telomerase RNA genes showed no significant homology between them (Broderick et al., 1987; Zhao et al., 1998). Comparison of the human and mouse ADA upstream gene regions revealed the presence of three conserved motifs (Ingolia et al., 1986) of which only two are bound by factors in vivo (see Supplementary data). The number and position of the remaining occupied sites are specific for each species.
Similar results to those for the α-globin gene expression (Figure 5) have been described for the trkA proto-oncogene, a tissue-specific gene associated with a CpG island encoding the receptor for the nerve growth factor (Sacristán et al., 1999). While northern analysis detected transcription in brain and testis only, more sensitive in situ hybridization and RNase protection analysis revealed widespread expression of trkA in many non-neuronal tissues (Lomen-Hoerth and Shooter, 1995). These observations, together with the human α-globin expression in non-erythroid tissues, suggest that this scenario could apply to other tissue-specific CpG island genes.
Multiple examples illustrate the notion that promoter divergence is a major source of the genetic variability that underlies evolution (Wang et al., 1999; Carroll, 2000). It has recently been reported that promoters can evolve in different species of Drosophila by stabilizing selection without any loss of specificity (Ludwig et al., 2000). One prediction of that study was that such a pattern of variation would be a common theme in cis-regulatory evolution (Ludwig et al., 2000). Our data show that this prediction is correct to the extreme of generating highly divergent promoters at genes that encode the same protein in mammals.
METHODS
DNA methylation analysis.
DNA was denatured and treated with sodium bisulfite and hydroquinone as previously described by Clark et al. (1994). Transformed DNA was purified through a columm of Wizard DNA Clean-Up System (Promega) and 100 ng were amplified by two rounds of 35 cycles of PCR using nested oligonucleotides under the following conditions. First 10 cycles: 2 min at 94°C, 1 min at the annealing temperature (specific for each set of primers) and 3 min of extension at 68°C using the Expand High Fidelity PCR System (Roche). For the remaining 25 cycles, 15 s were used for denaturation and annealing and the time for extension was increased by 20 s per cycle. The resulting amplified fragments were electrophoresed, recovered from the gel and cloned directly in the pGEM-T vector (Promega) for sequencing.
In vivo footprinting.
Human K562, HeLa and 293 cells were grown in α-MEM medium (BioWhittaker) with 10% fetal calf serum, 1% l-glutamine and 1% penicillin–streptomycin. The RPMI 8420 cell line was grown in RPMI 1640 medium (BioWhittaker). Exponential cultures were treated with 0.1% DMS (Sigma) for 1–5 min at room temperature. The methylation reaction was stopped by the addition of 1% bovine serum albumin and 100 mM β-mercaptoethanol made up in phosphate-buffered saline. Cells were collected and total DNA was purified and cleaved with piperidine following the protocol described by Mueller et al. (1992). Amplification of the resulting fragments by LM–PCR was carried out as described in the same reference. The same treatment was applied to a sample of naked DNA to be used as control. Labelled fragment ladders were electrophoresed in 6% acrylamide sequencing gels and visualized by autoradiography.
Cell transfection and expression analysis.
The three fragments of 580, 430 and 112 bp from the human APRT gene were cloned into the SalI site of the pBLCAT2 plasmid (Luckow and Schütz, 1987) immediately upstream from a minimal thymidine kinase promoter driving the CAT gene. Constructs were sequenced before transfection. Exponentially growing HeLa cells were transfected by the calcium phosphate method as described by Sambrook et al. (1989). Cells were cotransfected with a plasmid expressing the LacZ gene driven by the CMV promoter as a transfection control. CAT activity was measured using a CAT-ELISA kit (Roche).
Oligonucleotide sequences.
The sequences and localization of all the oligonucleotides used in this work (>100 oligonucleotides) are available upon request.
Supplementary data.
Supplementary data to this paper are available at EMBO reports Online.
Supplementary Material
Acknowledgments
ACKNOWLEDGEMENTS
We thank Dionisio Martín Zanca for advice on the cell transfection analysis and helpful criticism of the manuscript. We are also grateful to Mauro Giacca and Gulnara Abdurashidova for advice on the footprinting analysis. M.C. was a recipient of a postgraduate fellowship from the Ministerio de Educación y Cultura. This work was funded by the Spanish CICYT and the European Union FEDER programme.
REFERENCES
- Antequera F. and Bird, A. (1993) Number of CpG islands and genes in human and mouse. Proc. Natl Acad. Sci. USA, 90, 11995–11999. [DOI] [PMC free article] [PubMed] [Google Scholar]
- Antequera F. and Bird, A. (1999) CpG islands as genomic footprints of promoters that are associated with replication origins. Curr. Biol., 9, 661–667. [DOI] [PubMed] [Google Scholar]
- Antequera F., Boyes, J. and Bird, A. (1990) High levels of de novo methylation and altered chromatin structure at CpG islands in cell lines. Cell, 62, 503–514. [DOI] [PubMed] [Google Scholar]
- Bird A.P. (1986) CpG-rich islands and the function of DNA methylation. Nature, 321, 209–213. [DOI] [PubMed] [Google Scholar]
- Bird A.P. (1987) CpG islands as gene markers in the vertebrate nucleus. Trends Genet., 3, 342–347. [Google Scholar]
- Bird A., Taggart, M.H., Nicholls, R.D. and Higgs, D.R. (1987) Nonmethylated CpG-rich islands at the human α-globin locus: implications for evolution of the α-globin pseudogene. EMBO J., 6, 999–1004. [DOI] [PMC free article] [PubMed] [Google Scholar]
- Broderick T.P., Schaff, D.A., Bertino, A.M., Dush, M.K., Tischfield, J.A. and Stambrook, P.J. (1987) Comparative anatomy of the human APRT gene and enzyme: nucleotide sequence divergence and conservation of a nonrandom CpG dinucleotide arrangement. Proc. Natl Acad. Sci. USA, 84, 3349–3353. [DOI] [PMC free article] [PubMed] [Google Scholar]
- Carroll S.B. (2000) Endless forms: the evolution of gene regulation and morphological diversity. Cell, 101, 577–580. [DOI] [PubMed] [Google Scholar]
- Clark S.J., Harrison, J., Paul, C.L. and Frommer, M. (1994) High sensitivity mapping of methylated cytosines. Nucleic Acids Res., 22, 2990–2997. [DOI] [PMC free article] [PubMed] [Google Scholar]
- Delgado S., Gómez, M., Bird, A. and Antequera, F. (1998) Initiation of DNA replication at CpG islands in mammalian chromosomes. EMBO J., 17, 2426–2435. [DOI] [PMC free article] [PubMed] [Google Scholar]
- Duret L. and Bucher, P. (1997) Searching for regulatory elements in human noncoding sequences. Curr. Opin. Struct. Biol., 7, 399–406. [DOI] [PubMed] [Google Scholar]
- Dush M.K., Briggs, M.R., Royce, M.E., Schaff, D.A., Khan, S.A., Tischfield, J.A. and Stambrook, P.J. (1988) Identification of DNA sequences required for mouse APRT gene expression. Nucleic Acids Res., 16, 8509–8524. [DOI] [PMC free article] [PubMed] [Google Scholar]
- Gardiner M. and Frommer, M. (1987) CpG islands in vertebrate genomes. J. Mol. Biol., 196, 261–282. [DOI] [PubMed] [Google Scholar]
- Hardison R.C., Oeltjen, J. and Miller, W. (1997) Long human–mouse sequence alignments reveal novel regulatory elements: a reason to sequence the mouse genome. Genome Res., 7, 959–966. [DOI] [PubMed] [Google Scholar]
- Ingolia D.E., Al-Ubaidi, M.R., Yeung, C.Y., Bigo, H.A., Wright, D.A. and Kellems, R.E. (1986) Molecular cloning of the murine adenosine deaminase gene from a genetically enriched source: identification and characterization of the promoter region. Mol. Cell. Biol., 6, 4458–4466. [DOI] [PMC free article] [PubMed] [Google Scholar]
- Lander E. et al. (2001) Initial sequencing and analysis of the human genome. Nature, 409, 860–921. [DOI] [PubMed] [Google Scholar]
- Lomen-Hoerth C. and Shooter E.M. (1995) Widespread neurotrophin receptor expression in the immune system and other nonneuronal rat tissues. J. Neurochem., 64, 1780–1789. [DOI] [PubMed] [Google Scholar]
- Luckow B. and Schütz, G. (1987) CAT constructions with multiple unique restriction sites for the functional analysis of eukaryotic promoters and regulatory elements. Nucleic Acids Res., 15, 5490. [DOI] [PMC free article] [PubMed] [Google Scholar]
- Ludwig M.Z., Bergman, C., Patel, N.H. and Kreitman, M. (2000) Evidence for stabilizing selection in a eukaryotic enhancer element. Nature, 403, 564–567. [DOI] [PubMed] [Google Scholar]
- Macleod D., Charlton, J., Mullins, J. and Bird, A. (1994) Sp1 sites in the mouse aprt gene promoter are required to prevent methylation of the CpG island. Genes Dev., 8, 2282–2292. [DOI] [PubMed] [Google Scholar]
- Mueller P.R., Wold, B. and Garrity, P.A. (1992) Ligation-mediated PCR for genomic sequencing and footprinting. Curr. Protocols Mol. Biol., Supplement 20, 15.5.1–15.5.26. [DOI] [PubMed] [Google Scholar]
- Ohler U. and Niemann, H. (2001) Identification and analysis of eukaryotic promoters: recent computational approaches. Trends Genet., 17, 56–60. [DOI] [PubMed] [Google Scholar]
- Prestridge D.S. (1995) Predicting Pol II promoter sequences using transcription factor binding sites. J. Mol. Biol., 249, 923–932. [DOI] [PubMed] [Google Scholar]
- Sacristán M., de Diego, J.G., Bonilla, M. and Martín-Zanca, D. (1999) Molecular cloning and characterization of the 5′ region of the mouse trkA proto-oncogene. Oncogene, 18, 5836–5842. [DOI] [PubMed] [Google Scholar]
- Sambrook J., Fritsch, E.F. and Maniatis, T. (1989) Molecular Cloning: A Laboratory Manual. 2nd edn. Cold Spring Harbor Laboratory Press, Cold Spring Harbor, NY, pp. 16.32–16.36.
- Stapleton G., Somma, M.P. and Lavia, P. (1993) Cell type-specific interactions of transcription factors with a housekeeping promoter in vivo. Nucleic Acids Res., 21, 2465–2471. [DOI] [PMC free article] [PubMed] [Google Scholar]
- Tautz D. (2000) Evolution of transcriptional regulation. Curr. Opin. Genet. Dev., 10, 575–579. [DOI] [PubMed] [Google Scholar]
- Tommasi S. and Pfeifer, G.P. (1997) Constitutive protection of E2F recognition sequences in the human thymidine kinase promoter during cell cycle progression. J. Biol. Chem., 272, 30483–30490. [DOI] [PubMed] [Google Scholar]
- Tommasi S. and Pfeifer, G.P. (1999) In vivo structure of two divergent promoters at the human PCNA locus. J. Biol. Chem., 274, 27829–27838. [DOI] [PubMed] [Google Scholar]
- Venter C. et al. (2001) The sequence of the human genome. Science, 291, 1304–1351. [DOI] [PubMed] [Google Scholar]
- Wang R.L., Stec, A., Hey, J., Lukens, L. and Doebley, J. (1999) The limits of selection during maize domestication. Nature, 398, 236–239. [DOI] [PubMed] [Google Scholar]
- Wasserman W.W., Palumbo, M., Thompson, W., Fickett, J.W. and Lawrence, C.E. (2000) Human–mouse genome comparisons to locate regulatory sites. Nature Genet., 26, 225–228. [DOI] [PubMed] [Google Scholar]
- Whitelaw E., Hogben, P., Hanscombe, O. and Proudfoot, N.J. (1989) Transcriptional promiscuity of the human α-globin gene. Mol. Cell. Biol., 9, 241–251. [DOI] [PMC free article] [PubMed] [Google Scholar]
- Zhao J.G., Hoare, S.F., McFarlane, R., Muir, S., Parkinson, E.K., Black, D.M. and Keith, W.N. (1998) Cloning and characterization of human and mouse telomerase RNA gene promoter sequences. Oncogene, 16, 1345–1350. [DOI] [PubMed] [Google Scholar]
Associated Data
This section collects any data citations, data availability statements, or supplementary materials included in this article.


