Abstract
Understanding disordered structure is difficult due to insufficient information in experimental data. Here, we overcome this issue by using a combination of diffraction and simulation to investigate oxygen packing and network topology in glassy (g-) and liquid (l-) MgO–SiO2 based on a comparison with the crystalline topology. We find that packing of oxygen atoms in Mg2SiO4 is larger than that in MgSiO3, and that of the glasses is larger than that of the liquids. Moreover, topological analysis suggests that topological similarity between crystalline (c)- and g-(l-) Mg2SiO4 is the signature of low glass-forming ability (GFA), and high GFA g-(l-) MgSiO3 shows a unique glass topology, which is different from c-MgSiO3. We also find that the lowest unoccupied molecular orbital (LUMO) is a free electron-like state at a void site of magnesium atom arising from decreased oxygen coordination, which is far away from crystalline oxides in which LUMO is occupied by oxygen’s 3s orbital state in g- and l-MgO–SiO2, suggesting that electronic structure does not play an important role to determine GFA. We finally concluded the GFA of MgO–SiO2 binary is dominated by the atomic structure in terms of network topology.
Introduction
The MgO–SiO2 system is very important in both glass science and geoscience1 since glassy (g)-MgO–SiO2 is a typical binary silicate glass system and crystalline (c)-MgSiO3 (enstatite) and c-Mg2SiO4 (forsterite) are Mg-end members of main components of the Earth’s mantle. Liquid (l)-Mg2SiO4 can be classified as a fragile liquid, while l-MgSiO3 is a stronger liquid according to Angell.2 Particularly, viscosity under high pressure and high temperature is an important thermophysical property to understand magma ocean solidification.3 The structures of g-MgSiO3 (high glass-forming ability (GFA)) and g-Mg2SiO4 (low GFA) have been widely studied because the use of the levitation technique4 made it possible to synthesize a bulk g-Mg2SiO4.5 Numerous studies using X-ray6−9 and neutron7−9 diffraction, NMR,5,10−13 Raman spectroscopy,14 and reverse Monte Carlo (RMC)15–density functional (DF) theory simulation have been reported.9 The structure of liquid (l)-MgSiO3 has been studied by X-ray diffraction16,17 and DF–molecular dynamics (MD) simulation.9 In the case of l-Mg2SiO4, available data are very limited due to a high melting point (1850 °C); only synchrotron X-ray diffraction data17 are available, while DF–MD simulation data are reported.9 The previous diffraction studies report that SiO4 tetrahedra are stable, and the Mg–O coordination number (CN) is around 5 in l- and g-MgO–SiO2, although there are some discrepancies in Mg–O CN’s in the previous reports. NMR spectroscopy confirmed that the Q2 species (SiO4 chain) are dominant in g- and l-MgSiO3, while Si2O76– dimers and isolated SiO44– are dominant in g- and l-Mg2SiO4.
In this article, we performed high-energy X-ray diffraction and neutron diffraction measurements on l-MgSiO3 and l-Mg2SiO4 to obtain more detailed structural information about the liquids. To obtain atomic configurations with detailed electronic structures of g- and l-MgO–SiO2, advanced DF–MD simulations for g- and l-MgO–SiO2 were conducted to understand the electronic structure in MgO–SiO2. We measured the density of l-Mg2SiO4 by using an electrostatic levitation furnace (ELF) under microgravity at the International Space Station (ISS). Moreover, we performed several topological analyses (ring, polyhedral connection analysis, and persistent homology) on crystalline (c-), g-, and l-MgO–SiO2 to extract topological similarity among the crystal, glass, and liquid to understand the relationship between the topology and GFA.
Experimental and Simulation Procedures
Stoichiometric mixtures of MgO and SiO2 were annealed in air in 12 h to obtain polycrystalline MgSiO3 and Mg2SiO4 for levitation experiments. Spherical samples with a diameter of 2–3 mm were prepared by melting the c-MgSiO3 and c-Mg2SiO4 using a CO2 laser heating on an aerodynamic levitator. Samples of g-MgSiO3 were obtained during cooling, while 2–3 mm Mg2SiO4 was too large to be vitrified because of its low GFA.
The density of l-MgO–SiO2 was measured with an ELF at the ISS. The following obstacles exist when measuring oxide materials using an ELF on the ground: (1) A large voltage is required to overcome the gravity, but this voltage is discharged. (2) A vacuum is required to avoid discharge, but in that case, the oxides will volatilize. On the other hand, the above two problems can be avoided in space; this is why the measurements must be performed on the ISS. A sample was 2 mm in diameter. It was charged by friction or contact with other materials in ISS–ELF18 and then levitated to the center between six electrodes that applied Coulomb force. The sample position was stabilized by tuning voltages between electrodes at 1000 Hz and monitoring the image of the sample backlit with a He–Ne laser. The levitated sample was heated and melted by four 40 W semiconductor lasers (980 nm) under 2 atm of dry air. The temperature of the sample was measured by a pyrometer (1.45–1.8 μm). It was calibrated using an emissivity calculated from the plateau temperature at recalescence and the reference value of the melting point (MgSiO3: 1650 °C and Mg2SiO4: 1850 °C19). After melting, the nonspherical sample became spherical upon cooling after shutting off the lasers. During cooling, the sample image was observed by ultraviolet back light and a CCD camera. The pixel size was calibrated against an image of 2.0 mm stainless steel spheres, which was recorded under the same conditions as the sample. The sample volume was calculated from its diameter obtained from the image. The density was calculated from the volume and weight measured by UMX2 (Metler TOLEDO) after the sample was returned to the earth.
The X-ray diffraction measurements of l-MgSiO3 and l-Mg2SiO4 were performed at the BL04B2 beamline20 of SPring-8 using an aerodynamic levitator.21 The energy of the incident X-rays was 61.4 keV. The 2 mm sample was levitated in dry air and heated by a 200 W CO2 laser. The temperature of the sample specimen was monitored by a two-color pyrometer (0.9 and 1.05 μm). The instrument background was successfully reduced by shielding the detectors and by optimizing a beam stop. The measured X-ray diffraction data were corrected for polarization, absorption, and background, and the contribution of Compton scattering was subtracted using standard analysis procedures.22
The neutron diffraction measurements were conducted on the Nanoscale-Ordered Materials Diffractometer (NOMAD) diffractometer23 at SNS of Oak Ridge National Laboratory using an aerodynamic levitator. The 3 mm sample was levitated in dry argon and heated by a 400 W CO2 laser. The temperature of the sample specimen was monitored by a two-color pyrometer. The measured scattering intensities for the samples were corrected for instrument background, absorption of the samples, and multiple and incoherent scattering and then normalized by the incident beam profile.
The fully corrected data sets were normalized to give the Faber–Ziman24 total structure factor S(Q), and the total correlation function T(r) was obtained by a Fourier transform of S(Q).
The initial configurations for l-MgO–SiO2 were generated by RMC modeling started with a random configuration using both X-ray and neutron diffraction data. The RMC++25 code was used. The number of particles in the unit cells was 510 and 511 for MgSiO3 and Mg2SiO4, respectively. DF–MD calculations were performed using the CP2K code,26 which is a software package for DF–MD calculations using the hybrid Gaussian (MOLOPT-DZVP-SR) and plane wave basis set. The generalized gradient approximation (GGA) of Perdew, Burke, and Ernzerhof27 was adopted for the exchange–correlation energy functional. The norm-conserving pseudopotentials of Goedecker, Teter, and Hutter28 were adopted. The cutoff energy of the plane wave was set to 400 Ry. NVT simulations were carried out using the Nose–Hoover chain method with three thermostats. We performed MD simulations for 20 ps with the time step of 1 fs at 293 K for glass and at 2073 K for liquid.
For the electronic structure calculations, we used the structures of DF–MD at 10 ps for glasses and 10 and 20 ps for liquids. We employed the PHASE/0 code,29 which is DF calculations using a plain wave basis set. The norm-conserving pseudo potentials30 were used for Mg and Si atoms, while ultrasoft pseudo potential31 was used for O atoms. The PBE0 hybrid functional32 with fraction α = 0.3 was used for much more reliable estimation of band gap, where Γ is the fraction of the exact exchange term in the functional. The k-sampling was 2 × 2 × 2 for the Γ point centered mesh with tetrahedron method. The cutoff energies of plane wave basis set and charge density were 25 and 225 Ry, respectively. For the evaluation of the exact exchange term, only the gamma point was sampled, and the real-space method was used for the deficit charge term.
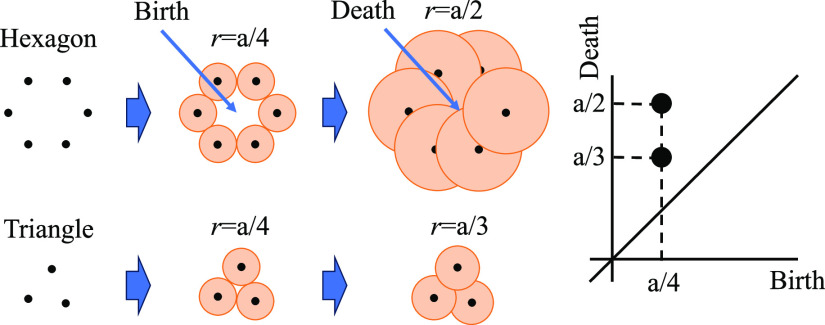
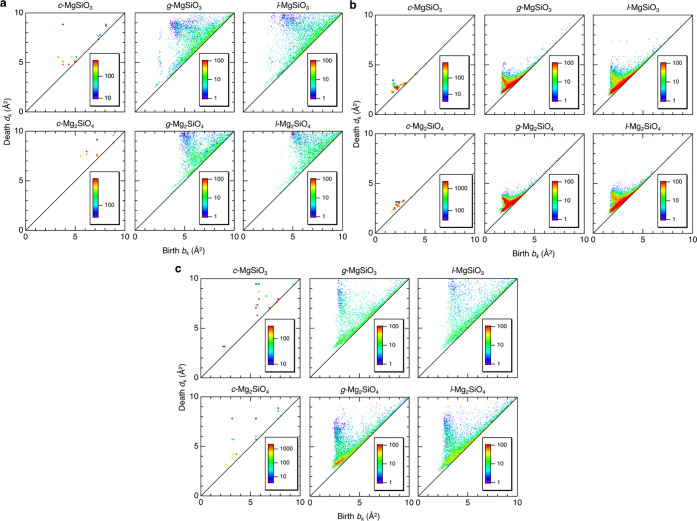
King ring size distributions were calculated by using R. I. N. G. S. code.33 The homology of atomic configurations for c-, g, and l-MgO–SiO2 was investigated using the PD1, which is comprised of two-dimensional histograms showing a persistent homology. Figure 1 shows the methodology of PD1.34D1 of a set of atoms given by the following thickening process of spheres: (i) place a sphere with a radius r at the center of each atom, (ii) increase the radii of the spheres from 0 to a sufficiently large value, and (iii) encode the pair of birth and death radii (bi, di) for each ring ci consisting of a set of spheres. The PD1 is then constructed by the two-dimensional histogram on the birth and death plane obtained by the pairs for independent ci, (i = 1,···, K). Here, the birth (death) radius is detected as the radius of spheres at which ring ci first appears (disappears). The birth radius has information about the distances between atoms of the ring ci, and the death radius exhibits information about the size of the ring. The PD1 provides statistical information on the shapes of all rings and thereby provides insight into intermediate-range ordering in a disordered structure. The rings detected by this process are recorded for the computation of the PD1s; hence, their geometric shapes can be identified for further analyses. The PD1s were calculated using the HomCloud package.35
Figure 1.
Methodology of the persistent diagram.
Results and Discussion
Density Data
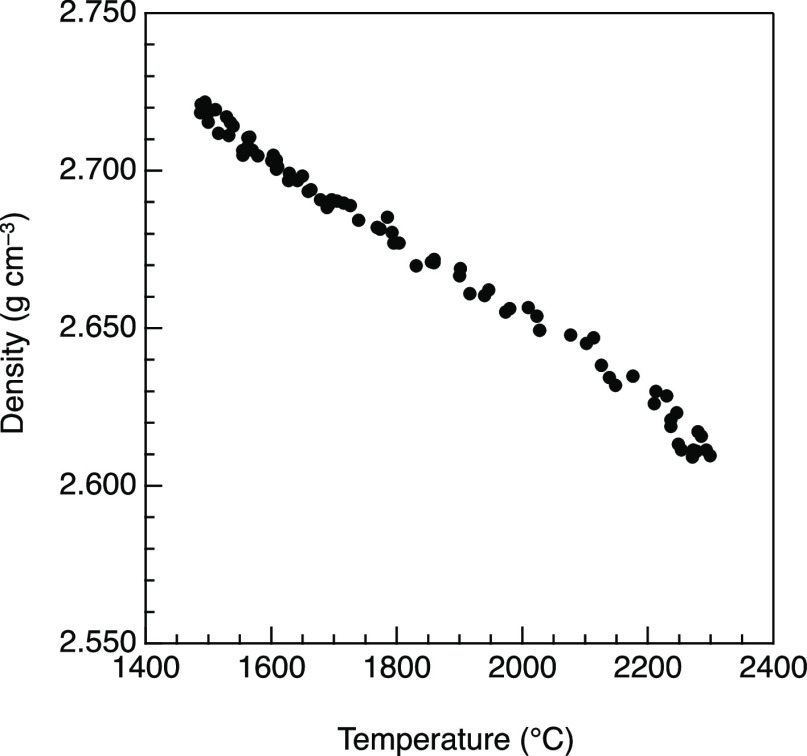
Table 1 summarizes the published density data for MgO–SiO2. Note that density data for l-Mg2SiO4 is estimated in the supplemental data of ref (9). Density of l-Mg2SiO4 as a function of the temperature measured at the ISS using ELF is depicted in Figure 2. The density showed a linear temperature dependence, which can be fitted to
| 1 |
with 99% confidence interval. The density is 2.678 g cm–3 at 1800 °C, very close to the estimated value of 2.677 g cm–3 given in Table 1. Experimental density data of l-xMgO–(100 – x)SiO2 (x = 30, 40, 50, 60, 66.7, 70) were also obtained (Figure S1). Both the densities for g- and l-Mg2SiO4 are higher than those of g- and l-MgSiO3, respectively. However, the density for c-Mg2SiO4 is comparable to that of c-MgSiO3 despite the increase in MgO content. The densities of the liquids are lower than those for the glasses, which is a common trend in oxide materials. It is worth mentioning that the density difference between c-MgSiO3 and g-MgSiO3 is much larger than that between c-Mg2SiO4 and g-Mg2SiO4.
Table 1. Density (g cm–3) Data for MgO–SiO2.
Figure 2.
Measured density of l-Mg2SiO4 as a function of temperature. Error bar was estimated to be 3%.
Diffraction Data
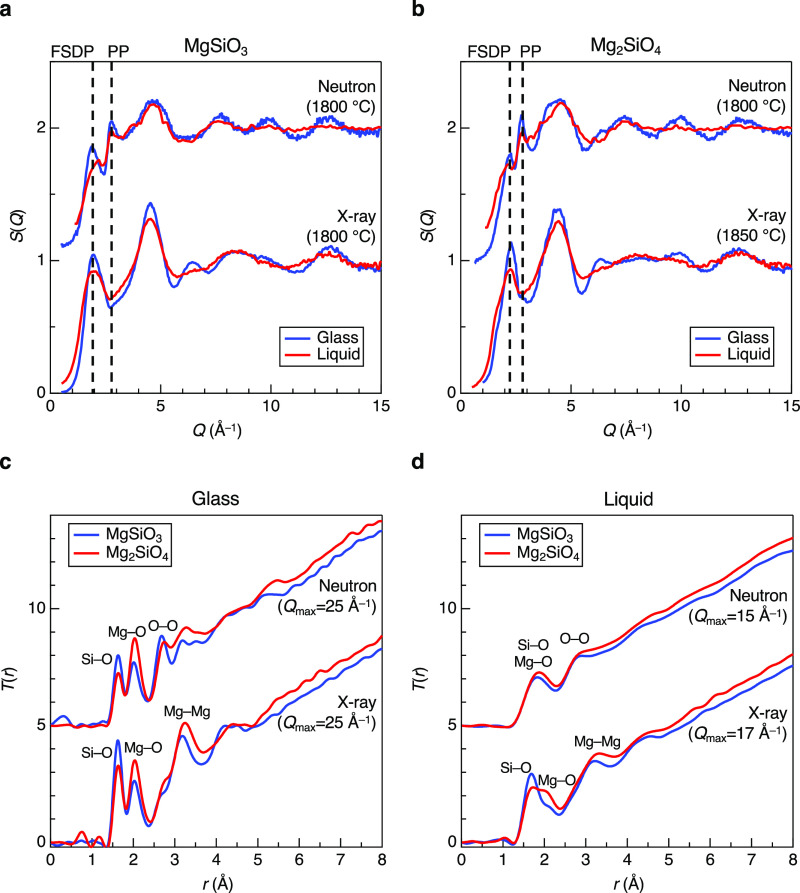
Figure 3 shows X-ray and neutron total structure factors, S(Q), for g-9 and l-MgSiO3 (a) and Mg2SiO4 (b), respectively. And also, Figure S2 shows X-ray total structure factors, S(Q), for l-xMgO–(100 – x)SiO2 were corrected using density data from Figure S1. The liquid data show broader features in comparison with the glass data due to the high temperature in Figure 3. A first sharp diffraction peak (FSDP)39 is observed at Q ∼ 2 and 2.2 Å–1 in the X-ray and neutron S(Q) for MgSiO3 and Mg2SiO4, respectively. An FSDP is considered the symbol of intermediate-range order which is composed of corner-sharing of SiO4 tetrahedra across the void. A principal peak (PP)40 is observed at Q ∼ 2.8 Å–1 in only the neutron S(Q) because the PP reflects the packing fraction of oxygen atoms,41 which neutrons are more sensitive to. The position of the FSDP in g-MgSiO3 is higher in Q than that of g-SiO29 and that in g-Mg2SiO4 is higher in Q than that of g-MgSiO3 because the network comprised by the corner-sharing of SiO4 tetrahedra is broken down into MgSiO3 and Mg2SiO4 by the addition of MgO associated with the reduction of the cavity volume.9 On the other hand, the position of the PP in the neutron S(Q) is almost identical, but the peak heights for glasses are greater than those for liquids. This trend is consistent with density data because the PP reflects the packing fraction of the oxygen atoms as mentioned earlier.
Figure 3.
Diffraction data for MgO–SiO2 glasses and liquids. (a) Neutron (upper) and X-ray (lower) structure factors, S(Q) for g-7,9 and l-MgSiO3. (b) Neutron (upper) and X-ray (lower) structure factors, S(Q) for g-7,9 and l-Mg2SiO4. (c) Neutron (upper) and X-ray (lower) total correlation functions, T(r) for g-7,9 MgSiO3 (bule line) and Mg2SiO4 (red line). (d) Neutron (upper) and X-ray (lower) total correlation functions, T(r) for l-MgSiO3 (blue line) and Mg2SiO4 (red line). Dashed lines are guides for the eyes.
The total correlation functions, T(r), for MgO–SiO2 glasses and liquids are shown in Figure 3. The real-space resolution in the glass data is better than that in the liquid data because we have measured the glass data with a wider Q range. In addition, the liquid structure is inherently more disordered than the glass structure, making peak assignment more difficult in the liquid data, as shown in Figure 3d. As can be seen in Figure 3c, we observe well-defined Si–O, Mg–O, and O–O peaks at approximately 1.63, 2.02, and 2.71 Å, respectively, but both the Mg–O and the O–O atomic distances in g-Mg2SiO4 are slightly longer than those in g-MgSiO3. We evaluated CNs using experimental and simulation data (Figure S3 and Tables S1 and S2), and it shows that the Si–O and Mg–O CNs are approximately 4 and 5 in both MgSiO3 and Mg2SiO4, although the Mg–O CNs in the glasses are slightly larger than those in the liquids, and those in Mg2SiO4 are larger than those in MgSiO3. These behaviors are in line with the behaviors of the PP in the neutron S(Q) and density data because the glasses are much denser than the liquids, and g- and l-Mg2SiO4 are denser than g- and l-MgSiO3. The average CNMg–O of DF–MD model of g-MgSiO3 shows 5.0 and the distribution of the value CNMg–O gives [4]Mg (21.6%), [5]Mg (55.9%), and [6]Mg (22.5%) using the cutoff distance 2.60 Å. The previous results obtained by neutron diffraction, RMC, and empirical potential structure refinement (EPSR) show CNMg–O around 4.50,42 4.50,43 and 4.48,44 respectively. Our DF–MD model has higher CNMg–O than those because a lot of [5]Mg exist. On the other hand, [4]Mg is predominant in other previous models; it might be our model slightly overestimates the Mg–O coordination.
Partial Structure and Short-Range Structure Derived from DF–MD Simulation
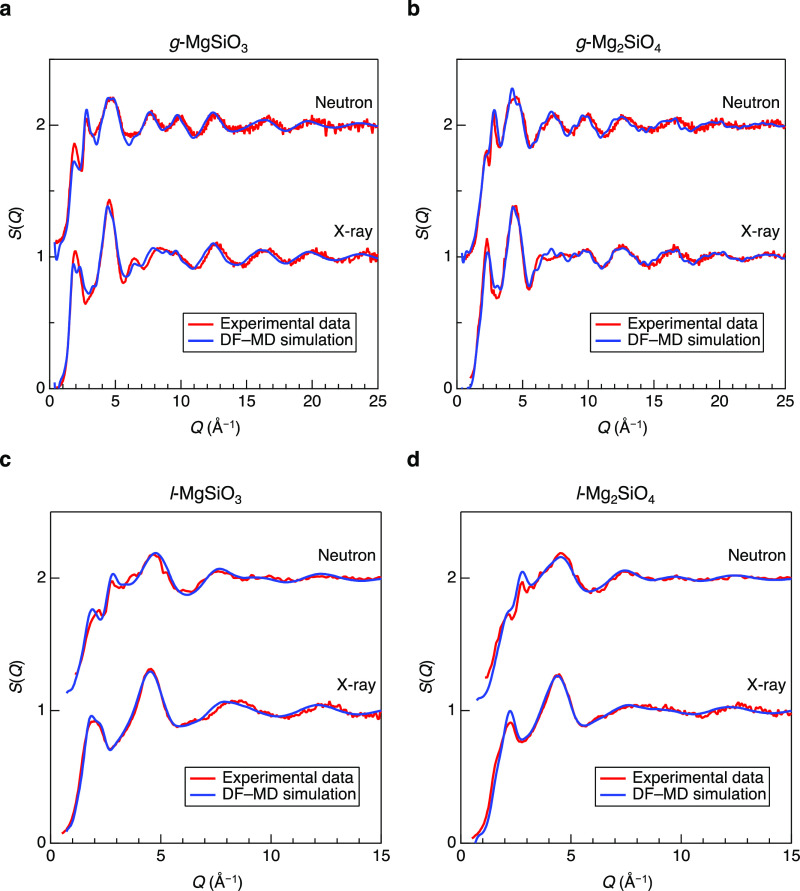
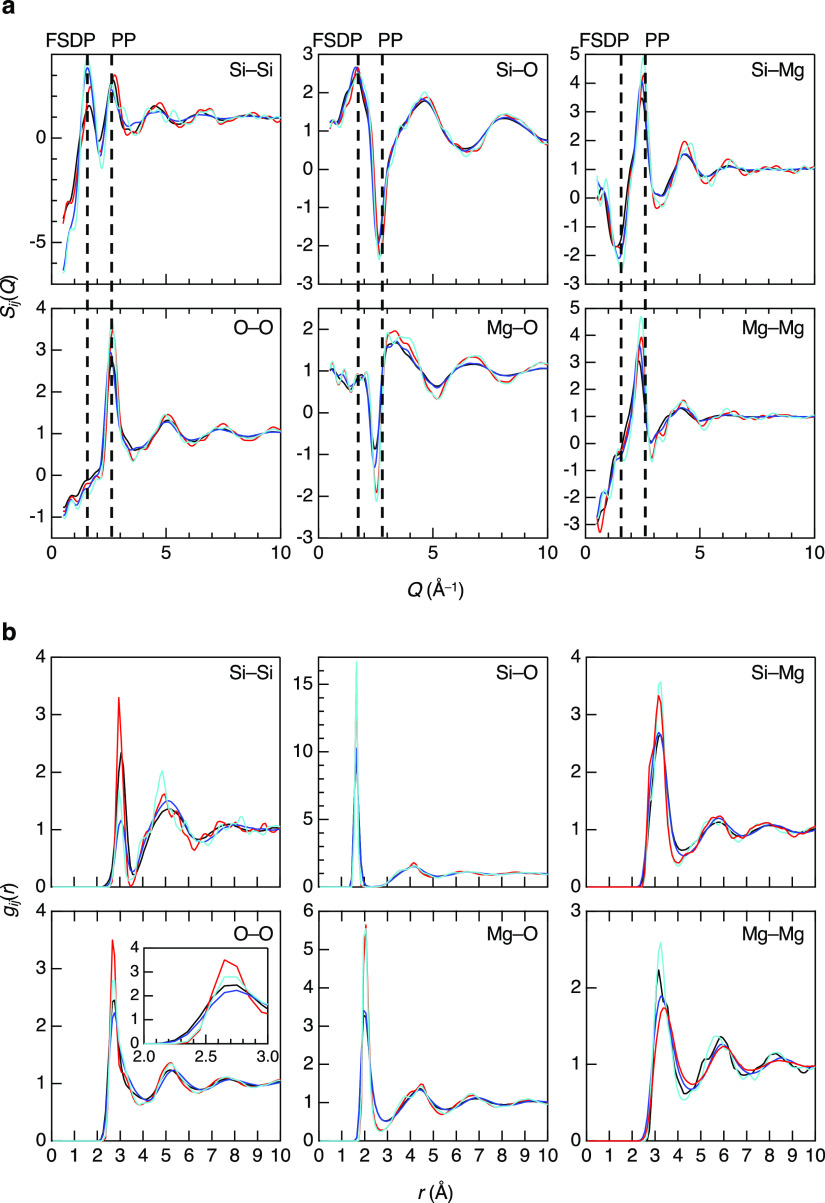
X-ray and neutron total structure factors, S(Q), for g-MgO–SiO2 and l-MgO–SiO2 derived from DF–MD simulations are shown in Figure 4. Figure 5a shows the partial structure factors, Sij(Q), for MgO–SiO2. The Sij(Q) except SSi–Mg(Q) exhibits a negative peak at the FSDP position. Similar behavior is found in 22.7R2O–77.3SiO2 glasses (R=Na and/or K).45 The cation–oxygen Sij(Q) (SSi–O(Q) and SMg–O(Q)) exhibit a positive peak at the PP position, while the cation–cation Sij(Q) (SSi–Si(Q), SSi–Mg(Q), and SMg–Mg(Q)) and SO–O(Q) exhibit a positive peak. The alkali–oxygen Sij(Q) in 22.7R2O–77.3SiO2 glasses do not exhibit such a negative peak at the PP position because alkali and magnesium have different valences, which results in different oxygen coordination numbers. Indeed, oxygen coordination numbers are mostly smaller than 5 in 22.7R2O–77.3SiO2 glasses. The partial pair distribution functions, gij(r), for MgO–SiO2 derived from the DF–MD simulations are shown in Figure 5b. The first correlation peaks for the glasses are sharper than those of the liquids. The first correlation peaks of gSi–Si(r) in MgSiO3 are sharper than those in Mg2SiO4 and the first correlation peaks of gMg–Mg(r) in Mg2SiO4 are sharper than those in MgSiO3, which reflect the composition difference between MgSiO3 (MgO–SiO2) and Mg2SiO4 (2MgO–SiO2).
Figure 4.
Neutron and X-ray total structure factors, S(Q), for g,l-MgO–SiO2 derived from DF–MD simulations (blue line) and experimental (red line) data.(a) Neutron (upper) and X-ray (lower) structure factors, S(Q) for g-7,9 MgSiO3. (b) Neutron (upper) and X-ray (lower) structure factors, S(Q) for g-7,9 Mg2SiO4. (c) Neutron (upper) and X-ray (lower) structure factors, S(Q) for l-MgSiO3. (d) Neutron (upper) and X-ray (lower) structure factors, S(Q) for l-Mg2SiO4.
Figure 5.
Partial structure for MgO–SiO2 glasses and liquids.(a) Partial structure factors, Sij(Q). (b) Partial pair distribution functions, gij(r). Black, l-MgSiO3; red, g-MgSiO3; blue, l-Mg2SiO4; cyan, g-Mg2SiO4. Dashed lines are a guide to the eyes.
It is confirmed that both the Si–O and Mg–O CNs derived from the DF–MD simulations are comparable to the experimental data. These behaviors suggest that there is no considerable structural difference in cation–oxygen coordination between MgSiO3 and Mg2SiO4 and between liquids and glasses. On the other hand, gO–O(r) shows significant differences between them, although the difference in oxygen atomic fractions between MgSiO3 (atomic fraction is 0.6) and Mg2SiO4 (atomic fraction is 0.57) is subtle. The O–O CNs for g-MgSiO3, g-Mg2SiO4, l-MgSiO3, and l-Mg2SiO4 are found to be 12.17, 12.70, 11.24, and 11.80, respectively. The difference between MgSiO3 and Mg2SiO4 and between liquids and glasses is large, which agrees well with the behavior of the PP in neutron S(Q). These results suggest that differences in packing fraction of oxygen atoms46 are an important parameter to understand the glass structure.
Three Body Correlations
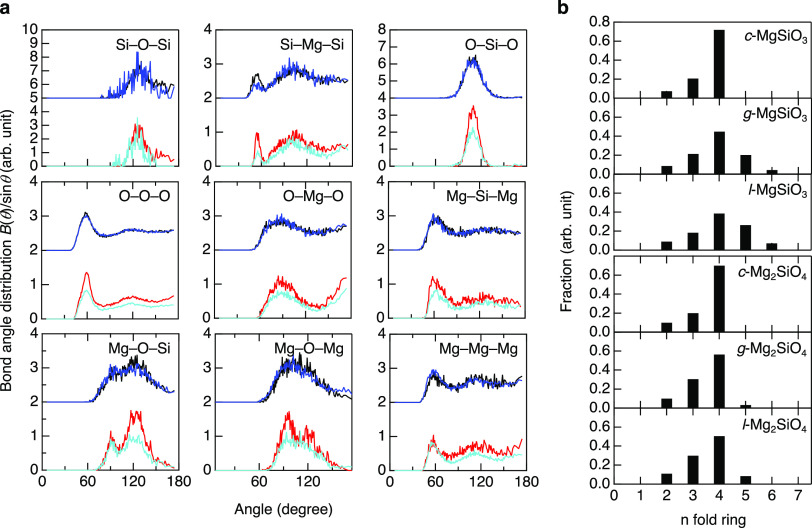
Figure 6a shows the bond angle distributions (BAD) for Mg–SiO2 glasses and liquids. It is worth mentioning that l-MgSiO3, l-Mg2SiO4, and g-Mg2SiO4 data are very similar, and only g-MgSiO3 exhibits a difference in fine structure in the Mg–O–Si and Mg–O–Mg BADs.
Figure 6.
Analysis of intermediate-range structure in MgO–SiO2. (a) BADs. (b) King ring size distributions for −O–Si(Mg)–O– rings. Black, l-MgSiO3; red, g-MgSiO3; blue, l-Mg2SiO4; cyan, g-Mg2SiO4.
Especially, the Mg–O–Mg BAD exhibit that the MgOx polyhedra of g-MgSiO3 have a unique connectivity because c-MgSiO3 shows only a single broad peak at ∼97° (no peak at ∼120°). The O–Mg–O BADs of g-MgSiO3 and g-Mg2SiO4 have two distinct peaks at ∼90 and ∼180°, which are very different from a single well-defined peak for O–Si–O (109°), suggesting that MgOx polyhedra are octahedral, although the Mg–O CN is 5. The O–Mg–O BADs are rather similar to O–Er–O of l-Er2O3 (Er–O CN is 6.1)47 and O–Al–O of g-Al2O3 (Al–O CN is 4.7). Note that the Er2O3 is a nonglass-forming liquid and Al2O3 glass can be obtained only by electrochemical method48 since Al2O3 is classified into intermediate (nonglass former).49
Topological Analysis
From previous research,9 the addition of MgO decreases SiO4 tetrahedra rings because MgO worked as intermediate oxide. Especially, g-Mg2SiO4 has no SiO4 tetrahedra rings, and SiO4 monomer and Si2O7 dimer are predominant silicate species. In this research, we focused on the ring statistics for −O–Si(Mg)–O– rings in MgO–SiO2, and these data are shown in Figure 6b. Our ring statistics data are slightly different from those reported previously.9 We attribute this discrepancy to the different modeling approaches, i.e., RMC modeling in ref (9) vs a DF–MD simulation in our study. Fourfold rings are the dominant rings in all MgO–SiO2. Intriguingly, all ring size distributions are very similar in Mg2SiO4, while g- and l-MgSiO3 have larger-sized rings in comparison with c-MgSiO3. It is suggested that g- and l-MgSiO3 are topologically disordered,50 which is a typical behavior of high GFA glass, while g- and l-Mg2SiO4 are topologically very similar to c-Mg2SiO4. Table 2 summarizes the results of the polyhedral connections and Qn analyses for MgO–SiO2. It is found that most of MgO–SiO2 are within the corner-sharing motif for SiO4–SiO4 connectivities, although small fractions of edge-sharing are observed in g-Mg2SiO4 and liquid MgO–SiO2. SiO4–MgOx connectivities for c-MgSiO3 show a corner-sharing motif, too, but the fraction of edge-sharing is increased in g-MgSiO3 and shows the maximum value in l-MgSiO3 due to disorder. However, SiO4–MgOx connectivities in Mg2SiO4 show completely different behavior. The fraction of edge-sharing is increased in l-Mg2SiO4 in comparison with g-Mg2SiO4, but the fraction of that in c-Mg2SiO4 shows the maximum value. Moreover, the ratio of corner-sharing and edge-sharing is exactly the same between SiO4–MgOx connectivities and MgOx–MgOx connectivities between c-Mg2SiO4 and g- and l-Mg2SiO4. The fraction of corner-sharing in MgOx–MgOx connectivities in c-Mg2SiO4 is smaller than that in g-Mg2SiO4 and l-Mg2SiO4. On the other hand, MgOx–MgOx connectivities in c-MgSiO3 show only edge-sharing, while the g-MgSiO3 shows a small fraction of edge-sharing in addition to corner-sharing and the fraction of edge-sharing slightly decreases in l-MgSiO3. Thus, the behavior is quite different between MgSiO3 and Mg2SiO4, and the latter shows similarity between c-Mg2SiO4 and g-/l-Mg2SiO4 because it is noted that the SiO4–SiO4 connectivities are subtle in g-/l-Mg2SiO4 owing to the breakdown of SiO4 network.
Table 2. Polyhedral Connections and Qn Analyses for MgO–SiO2.
| polyhedral connections |
Qn |
||||||||
|---|---|---|---|---|---|---|---|---|---|
| SiO4–SiO4 | SiO4–MgOx | MgOx–MgOx | Q0 | Q1 | Q2 | Q3 | Q4 | ||
| c-MgSiO3 | corner | 100 | 92.3 | 0 | 0 | 0 | 100 | 0 | 0 |
| edge | 0 | 7.7 | 100 | ||||||
| face | 0 | 0 | 0 | ||||||
| g-MgSiO3 | corner | 100 | 82.7 | 65.9 | 4.9 | 22.6 | 44.1 | 21.4 | 7.0 |
| edge | 0 | 17.3 | 30.7 | ||||||
| face | 0 | 0 | 3.4 | ||||||
| l-MgSiO3 | corner | 98.5 | 77.1 | 69.6 | 5.8 | 20.3 | 44.3 | 25.7 | 3.9 |
| edge | 1.5 | 22.5 | 27.9 | ||||||
| face | 0 | 0.4 | 2.5 | ||||||
| c-Mg2SiO4 | corner | 0 | 66.7 | 66.7 | 100 | 0 | 0 | 0 | 0 |
| edge | 0 | 33.3 | 33.3 | ||||||
| face | 0 | 0 | 0 | ||||||
| g-Mg2SiO4 | corner | 96.6 | 79.3 | 71.5 | 39.6 | 43.8 | 16.6 | 0 | 0 |
| edge | 3.4 | 20.7 | 27.4 | ||||||
| face | 0 | 0 | 1.1 | ||||||
| l-Mg2SiO4 | corner | 98.4 | 76.2 | 68.5 | 37.1 | 45.2 | 16.2 | 1.4 | 0.1 |
| edge | 1.6 | 23.2 | 28.3 | ||||||
| face | 0 | 0.6 | 3.2 | ||||||
Qn distributions summarized in Table 2 provide us with connectivities of SiO4 polyhedra. c-MgSiO3 shows quite unique connectivity, because we can observe only Q2 chain network. Indeed, it is demonstrated that SiO4 tetrahedra form a corner-sharing chain network and MgOx polyhedra form only an edge-sharing network, which form a layer structure in c-MgSiO3. More than 50% of the Q2 chain transforms into Q1 and Q3 in both g-MgSiO3 and l-MgSiO3, suggesting that the structural transformation between c-MgSiO3 and g-/l-MgSiO3 requires quite significant structural modifications. On the other hand, c-Mg2SiO4 shows only Q0 because the SiO4 tetrahedra are isolated. Moreover, the fractions of Q0 in g- and l-Mg2SiO4 are decreased to less than 40% and Q1 (Si2O76– dimers7) is dominant (43.8% in glass and 45.2% in liquid), while the fractions of Q2 are about 16%. In addition, a small fraction of Q3 (1.4%) and Q4 (0.1%) is observed in l-Mg2SiO4. It is suggested from these behaviors that the transformation from g/l-Mg2SiO4 into c-Mg2SiO4 seems to be easier than that in MgSiO3 because only the breakdown of chains or dimers is required while the formation of chains is required in the transformation from g/l- MgSiO3 into c-MgSiO3. The average Qn values of MgO–SiO2 are 2.00 (c-MgSiO3), 2.03 (g-MgSiO3), 2.02 (l-MgSiO3), 0 (c-Mg2SiO4), 0.77 (g-Mg2SiO4), and 0.82 (l-Mg2SiO4). Both g- and l-SiO2 with high GFA have the value of that average Qn are almost 4.0, which suggested that the number of average Qn is an indicator of GFA.
Figure 7a shows the Si-centric persistence diagrams, PD1s. It is well-known that g-SiO2 shows a prominent vertical profile along with the death axis at bk ∼ 2.2 Å2 in both the Si-centric and O-centric PD1s due to the formation of SiO4 tetrahedral network with corner-sharing of oxygen atoms.51,52 Similar profiles are only observed in the Si-centric PD1 for g- and l-MgSiO3 at bk ∼ 2.4 Å2, but c-MgSiO3 does not show such a profile since c-MgSiO3 has only a Q2 chain network, which is not three-dimensional. Mg2SiO4 does not show such a profile, either, because there is almost no Q3 or Q4 three-dimensional SiO4 network. The O-centric PD1s are shown in Figure 7b. The small death profiles are observed along with the diagonal in PD1s because the death values reflect significantly high packing of oxygen atoms and high density. It is found that the death value is a maximum in l-MgSiO3 (minimum density) and a minimum in c-MgSiO3 (maximum density). Figure 7c shows Mg-centric PD1s. The PD1s for g-MgSiO3 and g-Mg2SiO4 have a profile along with the death axis at bk ∼ 3.0 Å2, which are the signature for the formation of the Mg–O network. The PD1s for c-Mg2SiO4 have a profile at the same bk position, while c-MgSiO3 does not have such a profile because of the absence of well-defined three-dimensional Mg–O network. Moreover, it is suggested that all of the liquid data are very similar to glass data and that c-Mg2SiO4 data are very similar to g-Mg2SiO4, but c-MgSiO3 data are very different from g/l-MgSiO3 data. This trend is consistent with ring size distributions, demonstrating that we can see similarity in homology in Mg2SiO4, but the homology of c-MgSiO3 is quite different from that of g- and l-MgSiO3.
Figure 7.
Topological analysis for MgO–SiO2. (a) Si-centric PD1, (b) O-centric PD1, and (c) Mg-centric PD1.
Electronic Structures
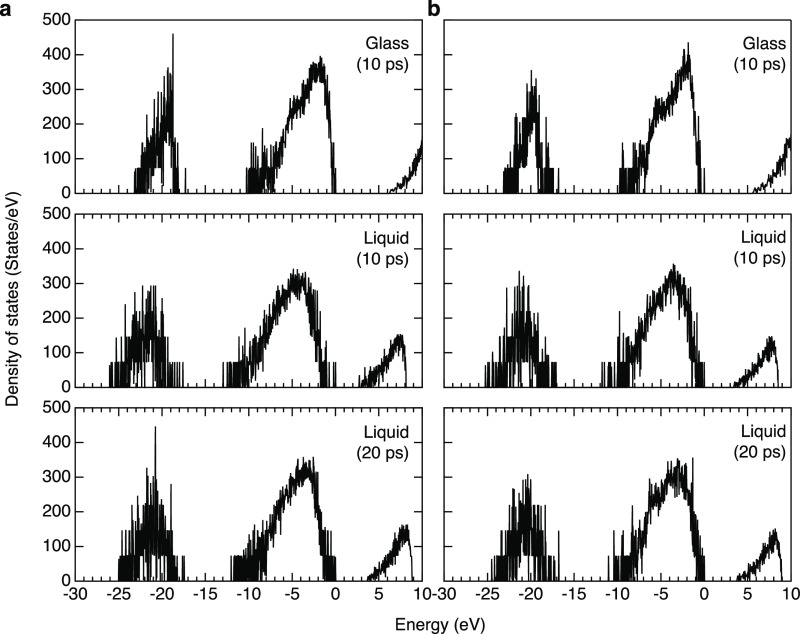
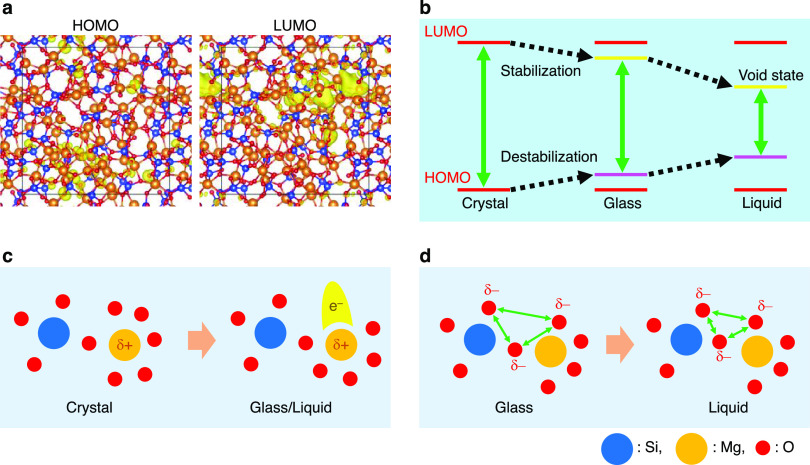
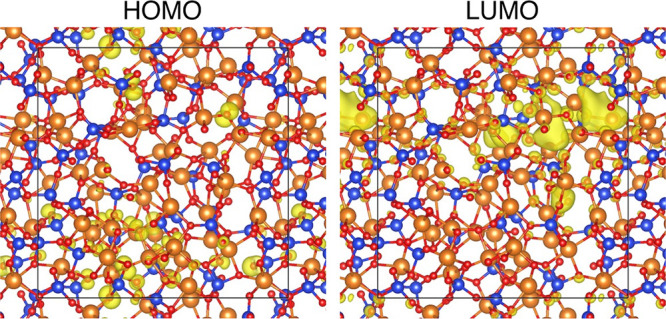
Figure 8 shows electron density of states (DOS) for g-and l-MgO–SiO2 calculated employing PBE053 with a fraction of exact exchange of α = 0.3, which will be referred to as PBE0 (0.3) below. It is known that GGA–PBE underestimates the band gap, and we performed several benchmark tests for crystalline MgO, SiO2 (α-quartz), MgSiO3, and Mg2SiO4 (see Table S3) and confirmed that PBE0 (0.3) shows the best agreement with experimental data; hence, we compare GGA–PBE (blue) and PBE0 (0.3) (red) in Figure S4. It is suggested from the DF–MD calculations that the lowest unoccupied molecular orbitals (LUMOs) are 3s orbitals and free electron-like state at the void sites near magnesium atoms (see Figure 9a for g-MgSiO3 as a typical example and Figure S5 for l-MgSiO3 and g-/l-Mg2SiO4) arising from a decreased oxygen coordination, and the highest occupied molecular orbitals (HOMOs) are oxygen’s 2p orbital states. These behaviors are in line with our previous study on CaO–Al2O3 glass54 but very different from α-quartz, c-MgO, c-MgSiO3, and c-Mg2SiO4, in which LUMOs and HOMOs are oxygen’s 3s and 2p orbitals, respectively. Electron band gaps calculated by PBE0 (0.3) are found to be 7.97, 6.30, and 2.71 (10 ps)/3.69 (20 ps) eV, for c-, g, and l-MgSiO3 and 8.37, 5.64, and 3.43 (10 ps)/3.81 (20 ps) eV, for c-, g, and l-Mg2SiO4. Note that liquid data have more fluctuations due to the high temperature. It is found that band gap values become small in the order of crystal, glass, and liquid (see Figure 9b) and the band gap of g-Mg2SiO4 is narrower than that of g-MgSiO3. We discuss these behaviors in Figure 9. The LUMO levels of glasses can be stabilized due to void site arising from a decreased oxygen coordination from six in the crystals to five in the glasses (Figure 9c). The LUMO levels of the liquid can be more stabilized due to the high temperature. HOMO can be destabilized in glasses due to inherent structural disorder, especially between oxygen atoms. This feature is enhanced in the liquid due to high temperature (see Figure 9d) manifested by decreased minimum oxygen–oxygen atomic distances shown in the inset of Figure 5b.
Figure 8.
Electronic structure of MgO–SiO2 glasses and liquids. Electron DOSs for (a) MgSiO3 and (b) Mg2SiO4 glasses and liquids calculated by DF–MD simulations employing PBE0 (0.3).
Figure 9.
Behaviors of HOMO and LUMO in MgO–SiO2.(a) Isosurface plots of the partial charge density around the HOMO and the LUMO levels for g-MgSiO3. (b) Schematic illustration for HOMOs and LUMOs in crystals, glasses, and liquids. (c) Schematic illustration of LUMO in glasses and liquids. (d) Schematic illustration for electron repulsions in liquids.
Conclusions
In this article, we have discussed the atomic and electronic structures of MgSiO3 and Mg2SiO4 to understand the network topology and relationship between structure and GFA. The density measurement at the ISS confirmed that our previous estimated density for l-Mg2SiO4 is very close to experimental data. The packing of oxygen atoms in Mg2SiO4 is larger than that in MgSiO3, and that of the glasses is larger than that of the liquids. Diffraction measurements and DF–MD simulations demonstrated that the packing of oxygen atoms is an important structural descriptor to understand the difference between MgSiO3 and Mg2SiO4 and between glass and liquid. The analysis of electronic and topological structures reasonably explained the behaviors of electron band gaps and topological similarity in crystals, glasses, and liquids. These results suggest that an electronic state does not change quite a lot between MgSiO3 and Mg2SiO4, also the topological similarity between crystalline (c)- and g-(l-) Mg2SiO4 is the signature of low GFA and high GFA g-(l-) MgSiO3 shows a unique glass topology, which is different from c-MgSiO3. This means the atomic structure in terms of network topology is an important factor to understand GFA. We demonstrated that systematic comparison among crystal, glass, and liquid is important to understand the nature and glass and liquid. The utilization of containerless techniques and understanding of behavior of oxygen atoms, as well as network topology, provide us with crucial information to discuss glass-forming ability.
Acknowledgments
The synchrotron radiation experiments were performed with the approval of the Japan Synchrotron Radiation Research Institute (JASRI) (proposal nos. 2018A1096 and 2022A1074). The neutron data were collected on the NOMAD instrument at the Spallation Neutron Source, a DOE Office of Science User Facility operated by the Oak Ridge National Laboratory. This research was supported by JSPS Grant-in-Aid for Transformative Research Areas (A) “Hyper-Ordered Structures Science” Grant Numbers 20H05878 (to M.S. and S.K.), 20H05881 (to S.K. and Y.O.), 20H05882 (to T.I.), 20H05884 (to M.S.), and KAKENIHI Grant Number 19K05648 (to Y.O.)). Discussion with Yuji Higo is gratefully appreciated.
Data Availability Statement
The data sets used and/or analyzed during the current study available from the corresponding author on reasonable request.
Supporting Information Available
The Supporting Information is available free of charge at https://pubs.acs.org/doi/10.1021/acs.jpca.3c05561.
Experimental and computational details; density data of l– xMgO–(100 – x)SiO2; X-ray total structure factors, S(Q), for l– xMgO–(100 – x)SiO2; pair function analysis; electron density of states; Isosurface plots of the partial charge density; coordination numbers obtained by pair function analysis; coordination number obtained by DF–MD; electron band gaps of GGA–PBE and PBE0 (PDF).
Author Contributions
S.K. designed the research. A.M. prepared the samples. Y.S., S.K., C.K. A.M., Y.W., Y.N. H.O, and T.I. measured density of l-Mg2SiO4. Y.S., S.K., Y.O., C.K., A.M., S.S., S.H., Y.W., and K.O. performed X-ray diffraction measurements. S.K., Y.O., C.K., J.T.O. A.M., Y.N., M.G.T., and M.T.M. performed neutron diffraction measurements. T.K. and K.S. conducted DF–MD simulations. Y.S., S.K., T.K., K.S., Y.O., M.S., I.O., Y.H., M.M. H.O., and T.I. analyzed data. Y.S. and S.K. wrote the paper, with comments provided by all authors.
The authors declare no competing financial interest.
Supplementary Material
References
- Mysen B.; Richet P.. Silicate Glasses and Melts, Second ed.; Elsevier, 2019. [Google Scholar]
- Angell C. A. Formation of glasses from liquids and biopolymers. Science 1995, 267, 1924–1935. 10.1126/science.267.5206.1924. [DOI] [PubMed] [Google Scholar]
- Xie L.; Yoneda A.; Yamazaki D.; Manthilake G.; Higo Y.; Tange Y.; Guignot N.; King A.; Scheel M.; Andrault D. Formation of bridgmanite-enriched layer at the top lower-mantle during magma ocean solidification. Nat. Commun. 2020, 11, 548. 10.1038/s41467-019-14071-8. [DOI] [PMC free article] [PubMed] [Google Scholar]
- Price D. L.High-Temperature Levitated Materials; Cambridge University Press, 2010. [Google Scholar]
- Tangeman J.; Phillips B. L.; Novrotsky A. Vitreous forsterite (Mg2SiO4): Synthesis, structure, and thermochemistry. Geophys. Res. Lett. 2001, 28, 2517. 10.1029/2000GL012222. [DOI] [Google Scholar]
- Yi C. D.; Okuno M.; Morikawa H.; Marumo F. Structure analysis of MgSiO3 glass. J. Non-Cryst. Solids 1983, 55, 131–141. 10.1016/0022-3093(83)90013-3. [DOI] [Google Scholar]
- Kohara S.; Suzuya K.; Takeuchi K.; Loong C. K.; Grimsditch M.; Weber J. K. R.; Tangeman J. A.; Key T. S. Glass formation at the limit of insufficient network formers. Science 2004, 303, 1649–1652. 10.1126/science.1095047. [DOI] [PubMed] [Google Scholar]
- Wilding M. C.; Benmore C. J.; Tangeman J. A.; Sampath S. Coordination changes in magnesium silicate glasses. Europhys. Lett. 2014, 67, 212–218. 10.1209/epl/i2003-10286-8. [DOI] [Google Scholar]
- Kohara S.; Akola J.; Morita H.; Suzuya K.; Weber M. C.; Benmore C. J. Relationship between topological order and glass forming ability in densely packed enstatite and forsterite composition glasses. Proc. Natl. Acad. U. S. A. 2011, 108, 14780–14785. 10.1073/pnas.1104692108. [DOI] [PMC free article] [PubMed] [Google Scholar]
- Shimoda K.; Tobu Y.; Hatakeyama M.; Nemoto T.; Saito K. Structural investigation of Mg local environments in silicate glasses by ultra-high field 25Mg 3QMAS NMR spectroscopy. Am. Mineral. 2007, 92, 695–698. 10.2138/am.2007.2535. [DOI] [Google Scholar]
- Sen S.; Tangeman J. Evidence for anomalously large degree of polymerization in Mg2SiO4 glass and melt. Am. Mineral. 2008, 93, 946–949. 10.2138/am.2008.2921. [DOI] [Google Scholar]
- Shimoda K.; Nemoto T.; Saito K. Local structure of magnesium in silicate glasses: A 25Mg 3QMAS NMR study. J. Phys. Chem. B 2008, 112, 6747–6752. 10.1021/jp711417t. [DOI] [PubMed] [Google Scholar]
- Sen S.; Maekawa H.; Papatheodorou G. N. Short-range structure of invert glasses along the pseudo-binary join MgSiO3-Mg2SiO4: Results from 29Si and 25Mg MAS NMR spectroscopy. J. Phys. Chem. B 2009, 113, 15243–15248. 10.1021/jp9079603. [DOI] [PubMed] [Google Scholar]
- Kalampounias A. G.; Nasikas N. K.; Papatheodorou G. N. Glass formation and structure in the pseudobinary system: From degraded networks to ioniclike glasses. J. Chem. Phys. 2009, 131, 114513. 10.1063/1.3225431. [DOI] [PubMed] [Google Scholar]
- Mcgreevy R. L.; Pusztai L. Reverse Monte Carlo simulation: a new technique for the determination of disordered structures. Mol. Simul. 1988, 1, 359–367. 10.1080/08927028808080958. [DOI] [Google Scholar]
- Waseda Y.; Toguri J. M. The structure of molten binary silicate systems CaO–SiO2 and MgO–SiO2. Metall. Trans. B 1977, 8, 563–568. 10.1007/BF02669331. [DOI] [Google Scholar]
- Wilding M. C.; Benmore C. J.; Weber J. K. R. In situ diffraction studies of magnesium silicate liquids. J. Mater. Sci. 2008, 43, 4707–4713. 10.1007/s10853-007-2356-5. [DOI] [Google Scholar]
- Tamaru H.; Koyama C.; Saruwatari H.; Nakamura Y.; Ishikawa Y.; Takada T. Status of the electrostatic levitation furnace (ELF) in the ISS-KIBO. Microgravity Sci. Technol. 2018, 30, 643–651. 10.1007/s12217-018-9631-8. [DOI] [Google Scholar]
- Fabrichnaya O. B. Thermodynamic modelling of melting in the system FeO–MgO–SiO2–O2 at pressure of 1 bar. CALPHAD: Comput. Coupling Phase Diagrams Thermochem. 2000, 24, 113–131. 10.1016/S0364-5916(00)00018-3. [DOI] [Google Scholar]
- Ohara K.; Onodera Y.; Murakami M.; Kohara S. Structure of disordered materials under ambient to extreme conditions revealed by synchrotron x-ray diffraction techniques at SPring-8—recent instrumentation and synergic collaboration with modelling and topological analyses. J. Phys.: Condens. Matter 2021, 33, 383001. 10.1088/1361-648X/ac0193. [DOI] [PubMed] [Google Scholar]
- Ohara K.; Onodera Y.; Kohara S.; Koyama C.; Masuno A.; Mizuno A.; Okada J. T.; Tahara S.; Watanabe Y.; Oda H.; et al. Accurate synchrotron hard X-ray diffraction measurements on high-temperature liquid oxides. Int. J. Microgravity Sci. Appl. 2020, 37, 370202 10.15011/jasma.37.2.370202. [DOI] [Google Scholar]
- Kohara S.; Itou M.; Suzuya K.; Inamura Y.; Sakurai Y.; Ohishi Y.; Takata M. Structural studies of disordered materials using high-energy x-ray diffraction from ambient to extreme conditions. J. Phys.: Condens. Matter 2007, 19, 506101 10.1088/0953-8984/19/50/506101. [DOI] [Google Scholar]
- Neuefeind J.; Feygenson M.; Carruth J.; Hoffmann R.; Chipley K. K. The nanoscale ordered materials diffractometer NOMAD at the spallation neutron source SNS. Nucl. Instrum. Meth. B 2012, 287, 68–75. 10.1016/j.nimb.2012.05.037. [DOI] [Google Scholar]
- Faber T. E.; Ziman J. M. A theory of the electrical properties of liquid metals III. The resistivity of binary alloys. Philos. Mag. 1965, 11, 153–173. 10.1080/14786436508211931. [DOI] [Google Scholar]
- Greben O.; Jóvári P.; Temleitner L.; Pusztai L. A new version of the RMC++ Reverse Monte Carlo programme, aimed at investigating the structure of covalent glasses. J. Optoelectron. Adv. Mater. 2007, 9, 3021–3027. [Google Scholar]
- CP2K Download site, http://www.cp2k.org/. Access date 2020/4/5.
- Perdew J. P.; Burke K.; Ernzerhof M. Generalized gradient approximation made simple. Phys. Rev. Lett. 1996, 77, 3865–3868. 10.1103/PhysRevLett.77.3865. [DOI] [PubMed] [Google Scholar]
- Goedecker S.; Teter M.; Hutter J. Separable dual-space Gaussian pseudopotentials. Phys. Rev. B 1996, 54, 1703–1710. 10.1103/PhysRevB.54.1703. [DOI] [PubMed] [Google Scholar]
- PHASE0 download site, http://azuma.nims.go.jp/. Access date 2020/5/17.
- Vanderbilt D. Soft self-consistent pseudopotentials in a generalized eigenvalue formalism. Phys. Rev. B 1990, 41, 7892–7895. 10.1103/PhysRevB.41.7892. [DOI] [PubMed] [Google Scholar]
- Troullier N.; Martins J. L. A straightforward method for generating soft transferable pseudopotentials. Solid State Commun. 1990, 74, 613–616. 10.1016/0038-1098(90)90686-6. [DOI] [Google Scholar]
- Perdew J. P.; Ernzerhof M.; Burke K. Rationale for mixing exact exchange with density functional approximations. J. Chem. Phys. 1996, 105, 9982–9985. 10.1063/1.472933. [DOI] [Google Scholar]
- Le roux S.; Jund P. Ring statistics analysis of topological networks: new approach and application to amorphous GeS2 and SiO2 systems. Comput. Mater. Sci. 2010, 49, 70–83. 10.1016/j.commatsci.2010.04.023. [DOI] [Google Scholar]
- Hiraoka Y.; Nakamura T.; Hirata A.; Escolar E. G.; Matsue K.; Nishiura Y. Hierarchical structures of amorphous solids characterized by persistent homology. Proc. Natl. Acad. Sci. USA 2016, 113, 7035–7040. 10.1073/pnas.1520877113. [DOI] [PMC free article] [PubMed] [Google Scholar]
- Obayashi I.HomCloud; Hiraoka Laboratory, Advanced Institute for Materials Research, Tohoku University: Japan, 2018. https://www.wpi-aimr.tohoku.ac.jp/hiraoka_labo/homcloud/index.en.html. Access date 2020/7/10.
- Morimoto N.; Koto K. The crystal structure of orthoenstatite. Z. Krist.-Cryst. Mater. 1969, 129, 65–83. 10.1524/zkri.1969.129.1-4.65. [DOI] [Google Scholar]
- Smyth J. R.; Hazen R. M. The crystal structures of forsterite and hortonolite at several temperatures up to 900 °C. Am. Mineral. 1973, 58, 588–593. [Google Scholar]
- Tomlinsonm J. W.; Heynes M. S. R.; Bockris J. O’M. The structure of liquid silicates. Part 2.—Molar volumes and expansivities. Trans. Faraday Soc. 1958, 54, 1822–1833. 10.1039/TF9585401822. [DOI] [Google Scholar]
- Price D. L.; Moss S. C.; Reijers R.; Saboungi M. L.; Susman S. Intermediate-range order in glasses and liquids. J. Phys. C Solid State Phys. 1988, 21, L1069–L1072. 10.1088/0022-3719/21/32/001. [DOI] [Google Scholar]
- Salmon P. S.; Martin R. A.; Mason P. E.; Cuello G. J. Topological versus chemical ordering in network glasses at intermediate and extended length scales. Nature 2005, 435, 75–78. 10.1038/nature03475. [DOI] [PubMed] [Google Scholar]
- Salmon P. S.; Zeidler A. Ordering on different length scales in liquid and amorphous materials. J. Stat. Mech. Theory E 2019, 2019, 114006. 10.1088/1742-5468/ab3cce. [DOI] [Google Scholar]
- Salmon P. S.; Moody G. S.; Ishii Y.; Pizzey K. J.; Polidori A.; Salanne M.; Zeidler A.; Buscemi M.; Fischer H. E.; Bull C. L.; Klotz S.; Weber R.; Benmore C. J.; MacLeod S. G. Pressure induced structure transformations in amorphous MgSiO3 and CaSiO3. J. Non-Cryst. Solids 2019, 3, 100024 10.1016/j.nocx.2019.100024. [DOI] [Google Scholar]
- Cormier L.; Cuello G. J. Mg coordination in a MgSiO3 glass using neutron diffraction coupled with isotopic substitution. Phys. Rev. B 2011, 83, 224204 10.1103/PhysRevB.83.224204. [DOI] [Google Scholar]
- Comier L.; Hennet L.; Lelong G.; Cuello G. J.; Bytchkov A. Structure from glass to melt: a case study along the MgSiO3–CaSiO3 join using neutron and X-ray diffraction. C. R. Geosci. 2022, 354, 15–34. 10.5802/crgeos.112. [DOI] [Google Scholar]
- Onodera Y.; Takimoto Y.; Hijiya H.; Taniguchi T.; Urata S.; Inaba S.; Fujita S.; Obayashi I.; Hiraoka Y.; Kohara S. Origin of the mixed alkali effect in silicate glass. NPG Asia Mater. 2019, 11, 75. 10.1038/s41427-019-0180-4. [DOI] [Google Scholar]
- Zeidler A.; Salmon P. S.; Skinner L. B. Packing and the structural transformations in liquid and amorphous oxides from ambient to extreme conditions. Proc. Natl. Acad. USA 2014, 111, 10045–10048. 10.1073/pnas.1405660111. [DOI] [PMC free article] [PubMed] [Google Scholar]
- Koyama C.; Tahara S.; Kohara S.; Onodera Y.; Småbråten D. R.; Selbach S. M.; Akola J.; Ishikawa T.; Masuno A.; Mizuno A.; et al. Very sharp diffraction peak in nonglass-forming liquid with the formation of distorted tetraclusters. NPG Asia Mater. 2020, 12, 43. 10.1038/s41427-020-0220-0. [DOI] [Google Scholar]
- Hashimoto H.; Onodera Y.; Tahara S.; Kohara S.; Yazawa K.; Segawa H.; Murakami M.; Ohara K. Structure of alumina glass. Sci. Rep. 2022, 12, 516. 10.1038/s41598-021-04455-6. [DOI] [PMC free article] [PubMed] [Google Scholar]
- Sun K.-H. Fundamental condition of glass formation. J. Am. Ceram. Soc. 1947, 30, 277–281. 10.1111/j.1151-2916.1947.tb19654.x. [DOI] [Google Scholar]
- Gupta P. K.; Cooper A. R. Topologically disordered networks of rigid polytopes. J. Non-Cryst. Solids 1990, 123, 14–21. 10.1016/0022-3093(90)90768-H. [DOI] [Google Scholar]
- Onodera Y.; Kohara S.; Tahara S.; Masuno A.; Inoue H.; Shiga M.; Hirata A.; Tsuchiya K.; Hiraoka Y.; Tsuchiya K.; et al. Understanding diffraction patterns of glassy, liquid and amorphous materials via persistent homology analyses. J. Ceram. Soc. Jpn. 2019, 127, 853–863. 10.2109/jcersj2.19143. [DOI] [Google Scholar]
- Onodera Y.; Kohara S.; Salmon P. S.; Hirata A.; Nishiyama N.; Kitani S.; Zeidler A.; Shiga M.; Masuno A.; Inoue H.; et al. Structure and properties of densified silica glass: characterizing the order within disorder. NPG Asia Mater. 2020, 12, 85. 10.1038/s41427-020-00262-z. [DOI] [Google Scholar]
- Perdew P. J.; Ernzerhof M.; Burke K. Rationale for mixing exact exchange with density functional approximations. J. Chem. Phys. 1996, 105, 9982–9985. 10.1063/1.472933. [DOI] [Google Scholar]
- Akola J.; Kohara S.; Ohara K.; Fujiwara A.; Watanabe Y.; Masuno A.; Usuki T.; Kubo T.; Nakahira A.; Nitta K.; Uruga T.; et al. Network topology for the formation of solvated electrons in binary CaO–Al2O3 composition glasses. Proc. Natl. Acad. USA 2013, 110, 10129–10134. 10.1073/pnas.1300908110. [DOI] [PMC free article] [PubMed] [Google Scholar]
Associated Data
This section collects any data citations, data availability statements, or supplementary materials included in this article.
Supplementary Materials
Data Availability Statement
The data sets used and/or analyzed during the current study available from the corresponding author on reasonable request.


