

Abstract
Triheptanoin (triheptanoylglycerol) has shown value as anaplerotic therapy for patients with long chain fatty acid oxidation disorders but is contraindicated in medium-chain acyl-CoA dehydrogenase (MCAD) deficiency. In search for anaplerotic therapy for patients with MCAD deficiency, fibroblasts from three patients homozygous for the most common mutation, ACADMG985A/G985A, were treated with fatty acids hypothesized not to require MCAD for their metabolism, including heptanoic (C7; the active component of triheptanoin), 2,6-dimethylheptanoic (dMC7), 6-amino-2,4-dimethylheptanoic (AdMC7), or 4,8-dimethylnonanoic (dMC9) acids. Their effectiveness as anaplerotic fatty acids was assessed in live cells by monitoring changes in cellular oxygen consumption rate (OCR) and mitochondrial protein lysine succinylation, which reflects cellular succinyl-CoA levels, using immunofluorescence (IF) staining. Krebs cycle intermediates were also quantitated in these cells using targeted metabolomics. The four fatty acids induced positive changes in OCR parameters, consistent with their oxidative catalysis and utilization. Increases in cellular IF staining of succinylated lysines were observed, indicating that the fatty acids were effective sources of succinyl-CoA in the absence of media glucose, pyruvate, and lipids. The ability of MCAD deficient cells to metabolize C7 was confirmed by the ability of extracts to enzymatically utilize C7-CoA as substrate but not C8-CoA. To evaluate C7 therapeutic potential in vivo, Acadm−/− mice were treated with triheptanoin for seven days. Dose dependent increase in plasma levels of heptanoyl-, valeryl-, and propionylcarnitine indicated efficient metabolism of the medication. The pattern of the acylcarnitine profile paralleled resolution of liver pathology including reversing hepatic steatosis, increasing hepatic glycogen content, and increasing hepatocyte protein succinylation, all indicating improved energy homeostasis in the treated mice. These results provide the impetus to evaluate triheptanoin and the medium branched chain fatty acids as potential therapeutic agents for patients with MCAD deficiency.
Keywords: ACADs, acyl-CoA dehydrogenases; Anaplerosis; Dojolvi™; Heptanoic acid; Fatty acid oxidation disorders; MCAD deficiency; Lysine succinylation; Medium branched chain fatty acids; Triheptanoin
INTRODUCTION
The search for effective anaplerotic therapy has increasingly gained attention with the recognition that an imbalance or deficit in the Krebs cycle intermediates is a major contributor to the pathophysiology of rare inborn errors of metabolism and other more common diseases (1–20). Triheptanoin (triheptanoylglycerol) was the first medication to be approved as anaplerotic therapy for long chain fatty acid oxidation disorders. It was also investigated for glucose transporter type 1 deficiency syndrome (GLUT1DS), glycogen storage disease type V (GSD V, McArdle disease), Huntington’s disease, and Rett syndrome (1–23). Side effects of triheptanoin treatment including diarrhea, nausea, stomach discomfort, and/or other GI distress in some cases have been reported and needs to be considered in treatment protocols (21, 24). While the anaplerotic treatment with triheptanoin has proven efficacious in treating critical long chain fatty acid oxidation disorders’ (FAODs) symptoms, in some cases patients still require hospitalization for symptoms including rhabdomyolysis. This can be attributed to less than optimum C7 muscle and peripheral tissue distribution and limited efficacy of its products (primarily C5 metabolites; see C5 ketone CoA precursors Schematic 1, (25)) as an energy source in muscles. Rapid liver conversion of C7 to C5 is evident from the high presence of combined C5 metabolites compared to heptanoylcarnitine detected in plasma of treated patients 2 hours following meal with triheptanoin (22, 26).
Medium branched chain fatty acids (MBCFAs) are under investigation as potential anaplerotic therapy alternatives for long chain FAODs (25). Since the primary target enzyme expected to initiate the breakdown of MBCFAs is long chain acyl-CoA dehydrogenase (LCAD; 1.3.8.8; see Schematic 2 (25)) rather than the more abundant medium chain acyl-CoA dehydrogenase (MCAD; 1.3.8.7), we postulated they can be therapeutic as they bypass MCAD in patients with MCAD deficiency (MCADD: OMIM 201450). MCADD is the most frequently inherited defect of fatty acid β-oxidation and one of the most frequent inborn errors of metabolism in general. MCADD patients are typically asymptomatic at birth as they are frequently fed; however, older infants are at risk for episodes of acute life-threatening metabolic decompensation with hypoglycemia, with or without hyperammonemia, due to longer periods of overnight fasting and exposure to viral infections (27–33). Later in life, muscle symptoms, fatty liver, and encephalopathy have also been reported (34). Morbidity occurs secondary to physiologic and psychologic stress including infections and physically demanding activities. Treatment guidelines for MCADD have not been published. Current standard of care includes use of high calorie fluids either enterally or intravenously, if oral intake cannot be maintained or in the presence of significant metabolic stress, including intercurrent illness. In practice, this often means hospital admission in infants and young children with fever or other significant signs of viral illness. These recommendations lead to heightened anxiety in parents, especially when mild intercurrent illness is present, especially with continued rare reports of unexpected death in MCADD patients (35, 36).
In this study, the ability of human control and MCAD deficient cell lines to utilize heptanoic (C7), 2,6-dimethylheptanoic (dMC7), 6-amino-2,4-dimethylheptanoic (AdMC7), and 4,8-dimethylnonanoic (dMC9) acids as anaplerotic molecules was investigated using whole cell oxygen consumption studies, targeted metabolomics, and protein lysine succinylation. We also determined that the residual utilization of C7 by the deficient cells was attributed to short chain acyl-CoA dehydrogenase (SCAD; 1.3.8.1), which was determined to have significant enzyme activity towards C7-CoA as substrate. Furthermore, we used triheptanoin to treat Acadm−/− MCAD deficient mice and histological and biochemical results provide evidence for its therapeutic potential for patients with MCAD deficiency.
RESULTS
Extracellular Anaplerotic Fatty Acid Flux Assays
1. Extracellular Flux Assay in Control Cells
Relative oxygen consumption rate (OCR) data comparisons/dose response:
To assess response of treatment with C7 and the MBCFAs on cellular bioenergetics, OCR parameters measured in control cells in the presence of various fatty acid concentrations were plotted as relative percent change [or Change (%) extrapolated from values reported in Supplemental Figure 1s] in comparison to the OCR parameters at 0 μM fatty acid (FA) treatment in the absence of glucose/pyruvate (Figure 1). Relative basal respiration and ATP-linked respiration increased about 15% compared to no treatment (0 μM FA). While C7 had the highest relative maximal respiration (152% at 15 μM C7) and spare capacity (257% at 30 μM C7) increase compared to no treatment (0 μM FA) (Figure 1A), all four parameters, i.e., basal respiration, ATP-linked respiration, maximal respiration, and spare capacity were significantly higher in the presence of 90 μM AdMC7 compared to no treatment (0 μM FA) (Figure 1C). While the relative basal respiration, ATP-linked respiration, maximal respiration, and spare capacity increases were highest at 15 μM for dMC7 and dMC9 (Figure 1B and D), the lowest maximal respiration observed with the MBCFAs treatment was at 90 μM dMC7, and at 180 μM AdMC7 and dMC9 compared to the 0 μM FA treatment. The lowest spare capacity observed at 180 μM dMC9 was 84% compared to no treatment (0 μM FA).
Figure 1.
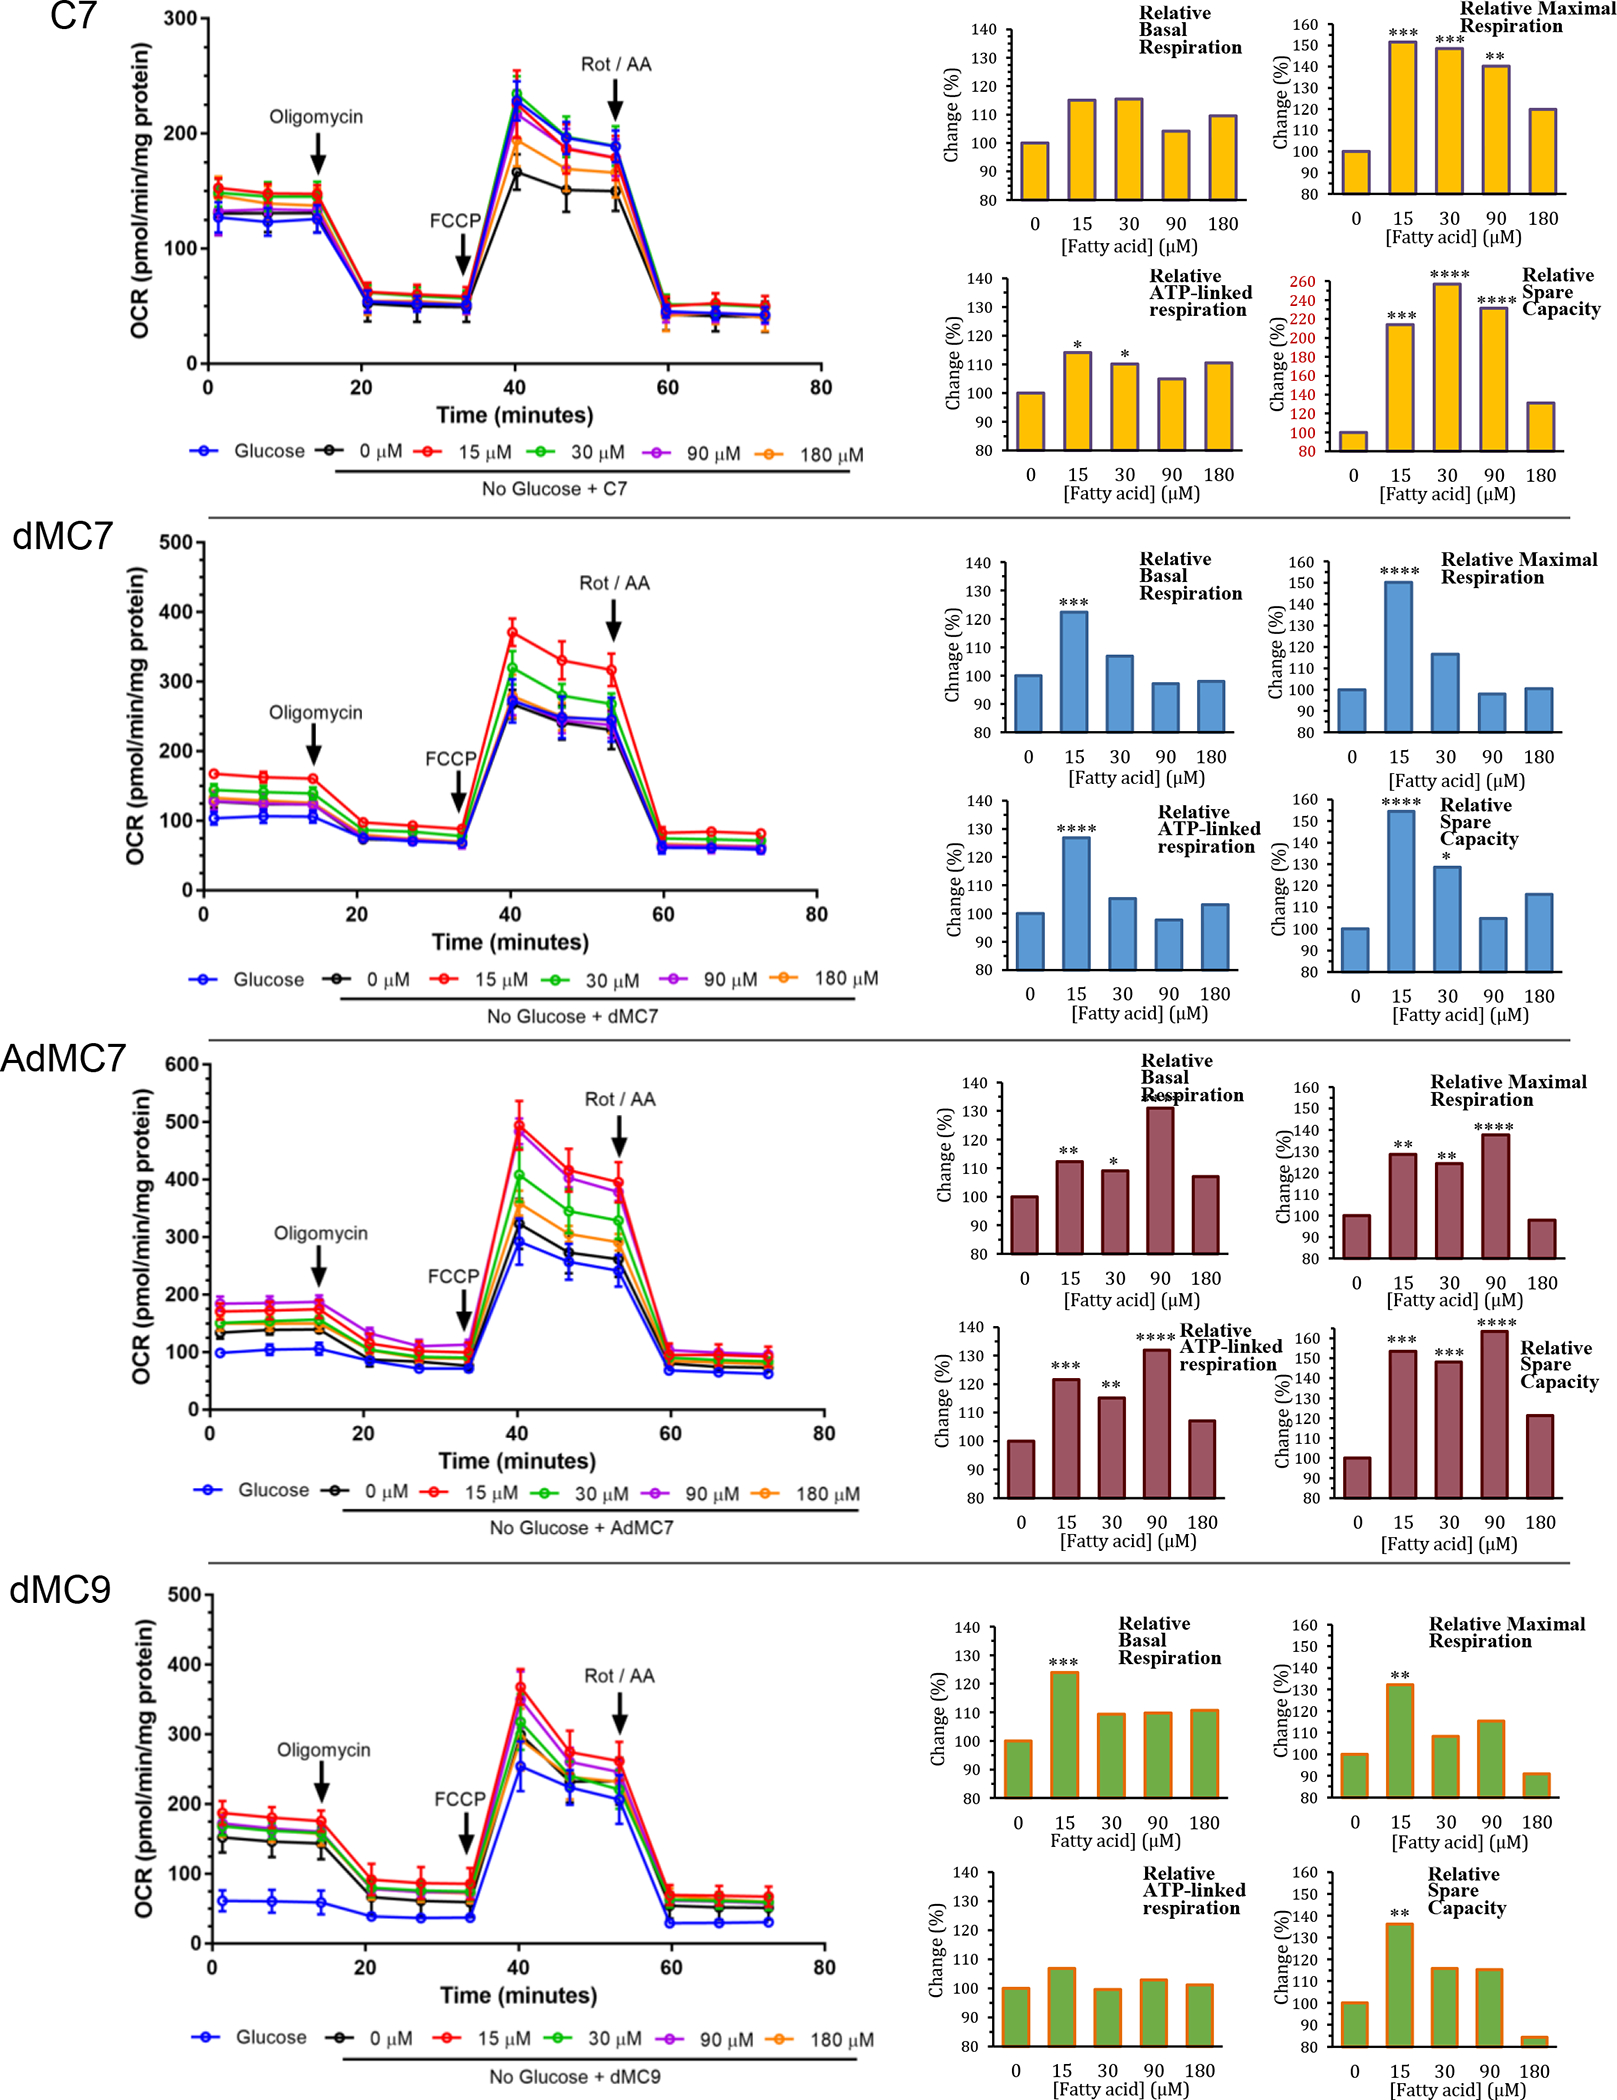
Bioenergetic parameters determined from oxygen consumption rate (OCR) measurements in control cells (Fb826) after sequential addition of the electron transport chain inhibitors/stress compounds oligomycin, FCCP, and rotenone/antimycin A. Panels from top heptanoic acid (C7), dimethylheptanoic acid (dMC7), 6-amino-2,4-dimethylheptanoic acid (AdMC7), and 4,8-dimethylheptanoic acid (dMC9). Bar graphs are comparison of C7 and MBCFAs treatment groups are relative, normalized in percentage terms to untreated (0 μM FA), to untreated cells in the absence of glucose/pyruvate cells. Statistical analyses were carried out on original raw data provided in Supplement Data section Figure 1s, where Tukey multiple range test was used. Data are means ± SD of n=6–8 wells. *P < 0.05, **P < 0.01, ***P < 0.001, ****P < 0.0001, statistical comparison of C7 and MBCFAs treatment groups are relative to untreated cells (0 μM FA) in the absence of glucose/pyruvate. Percent changes in red to draw attention to the significantly different Y-axis scale.
Real Time OCR measurements in the presence versus absence of glucose/pyruvate:
Control cells behaved somewhat differently across treatments with the different fatty acids tested as shown by OCR values measured in the presence (medium A; see Methods section) versus the absence of glucose/pyruvate (medium B or C) (Figure 1SA–D). In the absence of glucose/pyruvate, while basal and ATP-linked respiration values were not changed significantly with C7 treatment, these two values were significantly higher in all three MBCFAs treatments suggestive of a stress response. The maximal respiration and spare capacity were lower with C7 treatment compared to the reasonably similar levels in the MBCFA treatment (Figure 1SA–D). The variation in basal and ATP-linked respiration values in the presence versus the absence of glucose/pyruvate across the different MBCFAs treatments demonstrates the necessity to monitor the individual dose response for each treatment and indicates that comparing the performance among treatments in different plates is not a valid comparison. Thus, comparisons for the rest of our analyses were performed in this fashion.
Basal respiration values did not significantly change with increasing C7 dose (Figure 1SA), but ATP-linked respiration values slightly increased in the absence of glucose/pyruvate when compared to the value with no treatment in the absence of glucose/pyruvate (Figure 1SB). In contrast, basal respiration values were significantly increased with treatment with all three MBCFAs and untreated cells, compared to the untreated MBCFAs in the presence of glucose/pyruvate (Figure 1SA). The most significant increase of ATP-linked respiration was observed with 15 μM dMC7 and AdMC7 treatments. On the other hand, maximal respiration and spare capacity values significantly decreased as the C7 dose increased compared to the untreated cells in the presence of glucose/pyruvate (Figure 1SC & D). Nevertheless, maximal respiration and spare capacity values were significantly higher at 15 μM dMC7 and dMC9 and at 90 μM AdMC7 when compared to the value with no treatment in the absence of glucose/pyruvate. Spare capacity in the dMC9 treatment was somewhat lower in the absence of glucose/pyruvate. Overall, the most significant increase in the four OCR parameters was that of the 90 μM AdMC7 treatment in the absence of glucose/pyruvate.
2. Extracellular Flux Assay for MCADD Cells
OCR values measured for the three MCADD cell lines tested are reported in Figures 2S, 3S, and 4S (extrapolated to percentage untreated in Figure 2). In Fb831, AdMC7 appears to outperform C7 and the other two MBCFAs in terms of ATP production and maximal respiration parameters (Figure 2 and Figure 2S). However, dMC9 outperformed dMC7 and AdMC7 in the MCAD deficient Fb786 and Fb787 cell lines (Figure 3S and 4S). The relative basal respiration following treatment of the MCADD cells with C7 produced statistically significant increases at 15 μM in the MCAD deficient Fb831 and Fb786 cell lines compared to no treatment (Figure 2, upper panel). There was an increase in relative ATP-linked respiration at 15 μM C7 in these two cell lines, Fb831 and Fb786, respectively. Changes in relative maximal respiration, 149% and 135%, and relative spare capacity, 152% and 160%, were significant at 15 μM C7 in these two cell lines, respectively, (Figure 2). Changes in these parameters were not as significant in Fb787 in the presence of C7, where statistically only 15 μM produced a change in relative maximum respiration.
Figure 2.
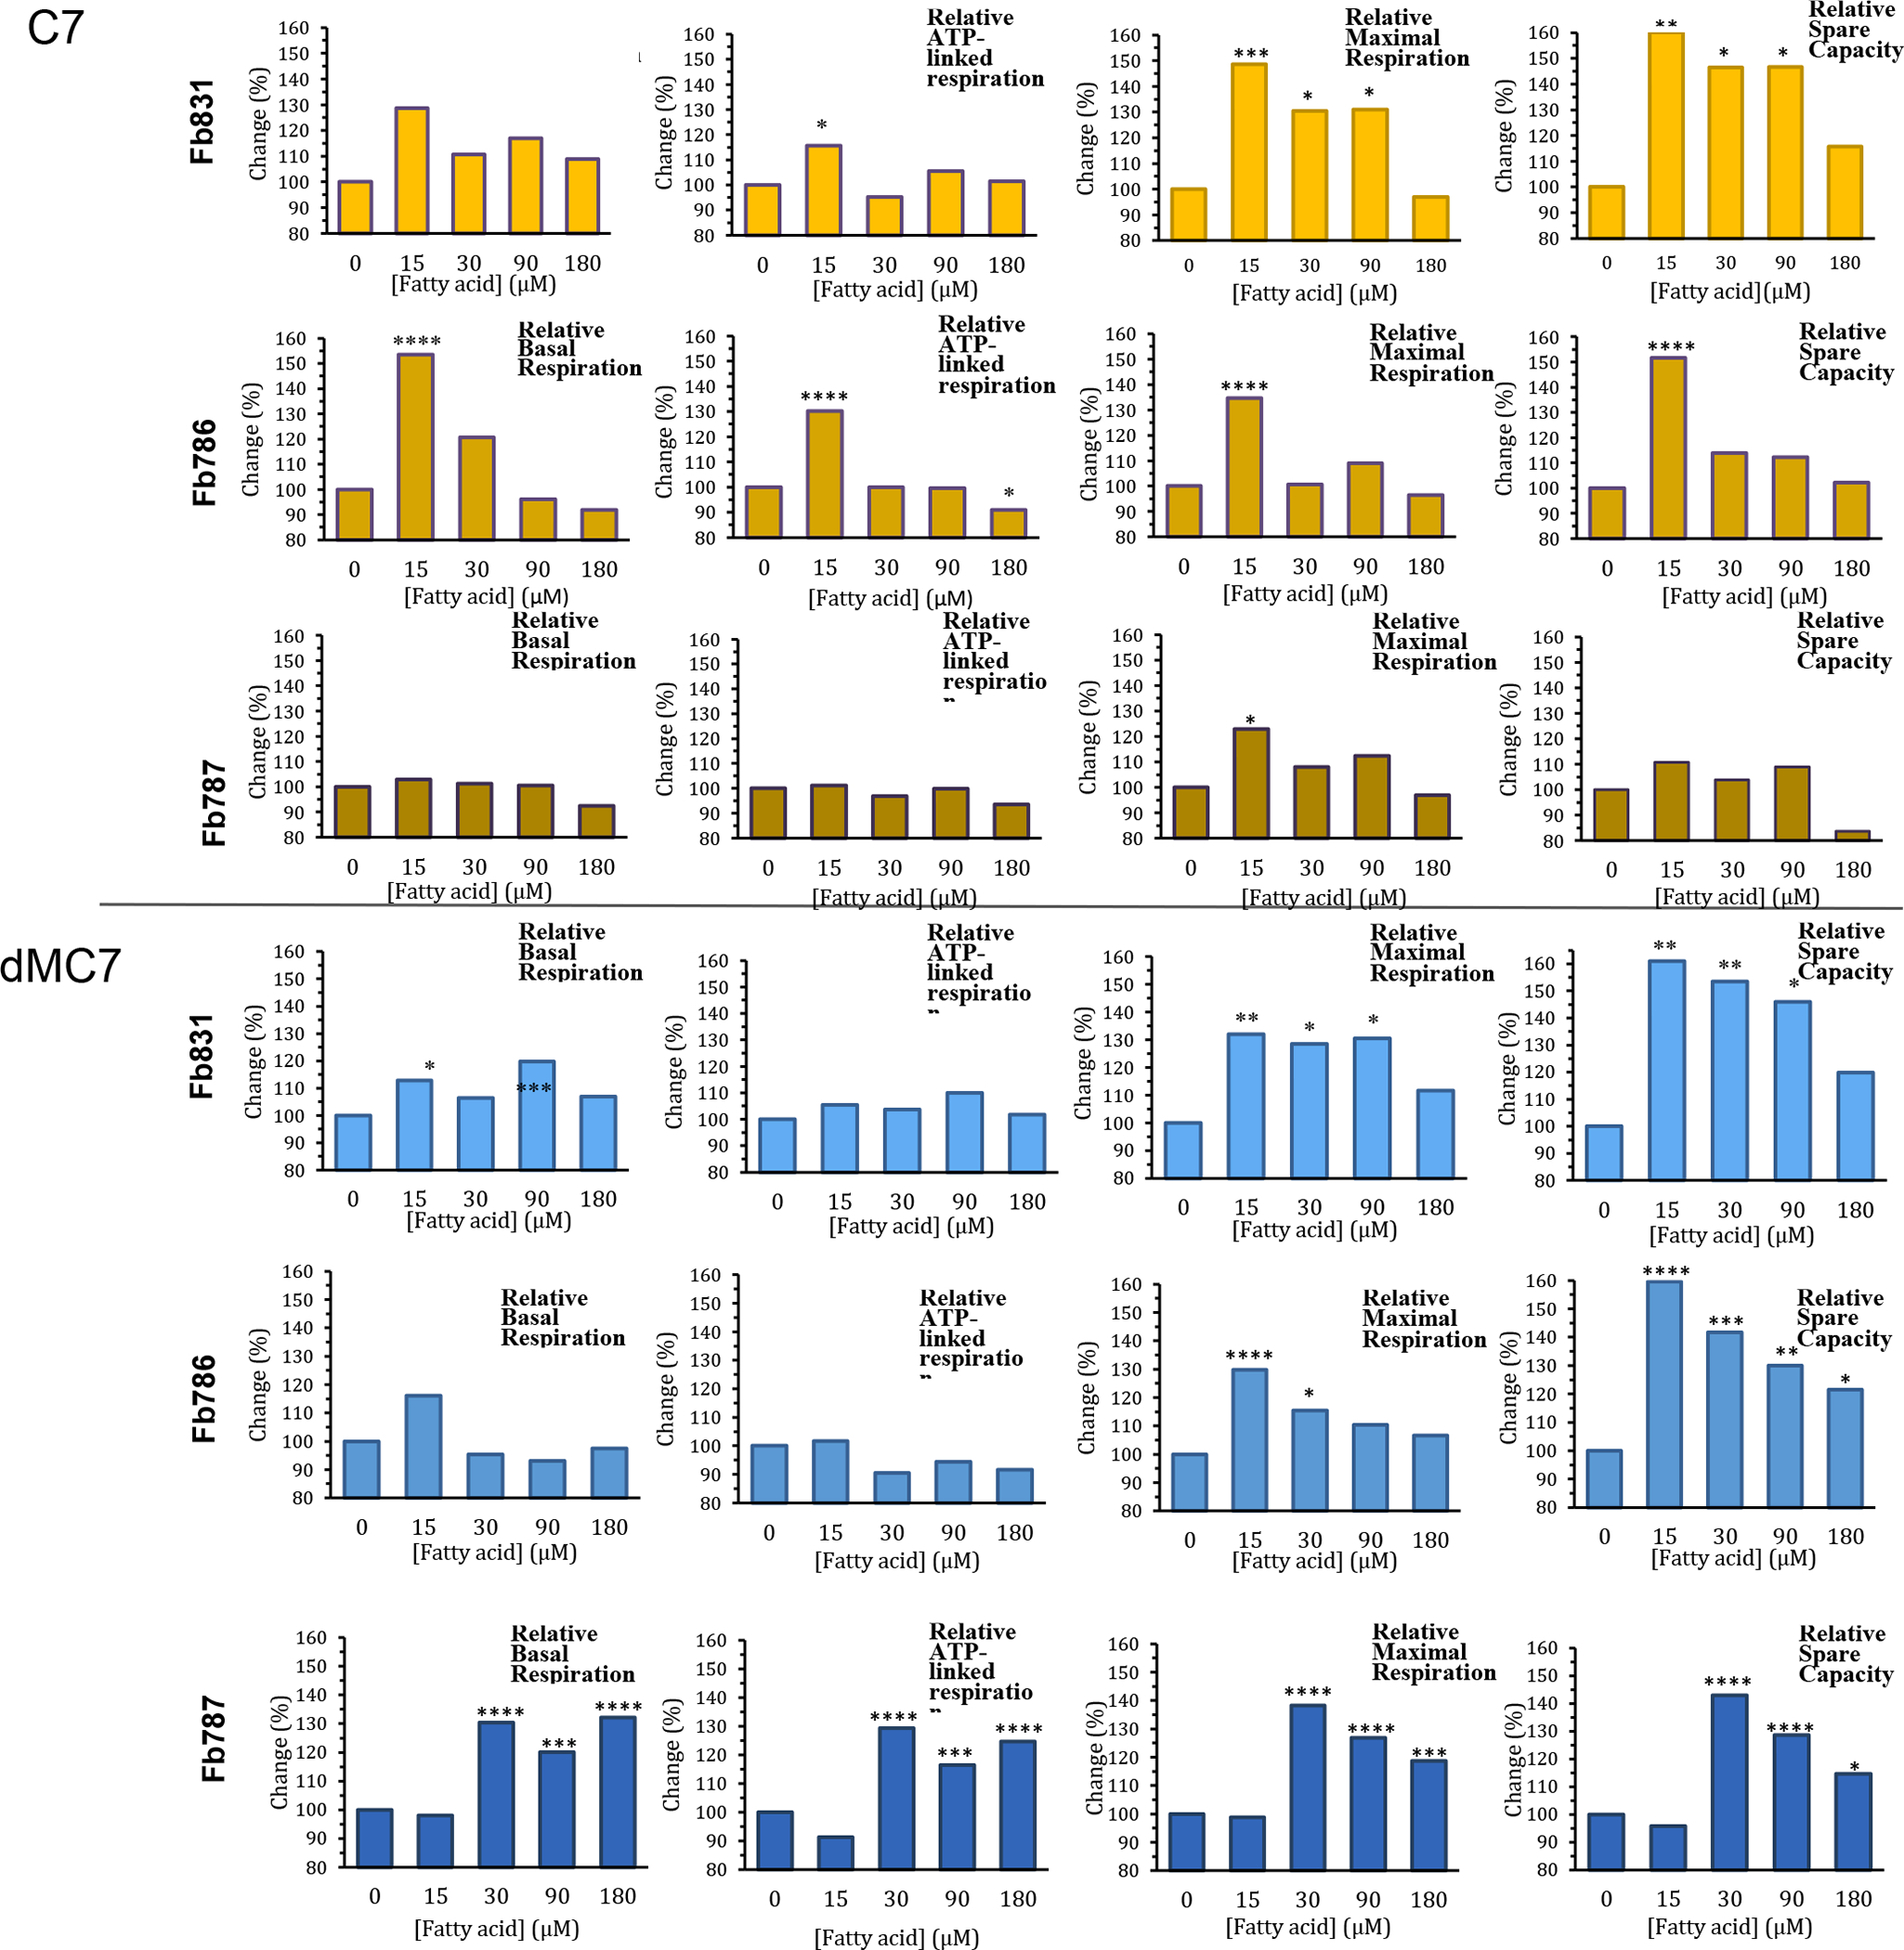
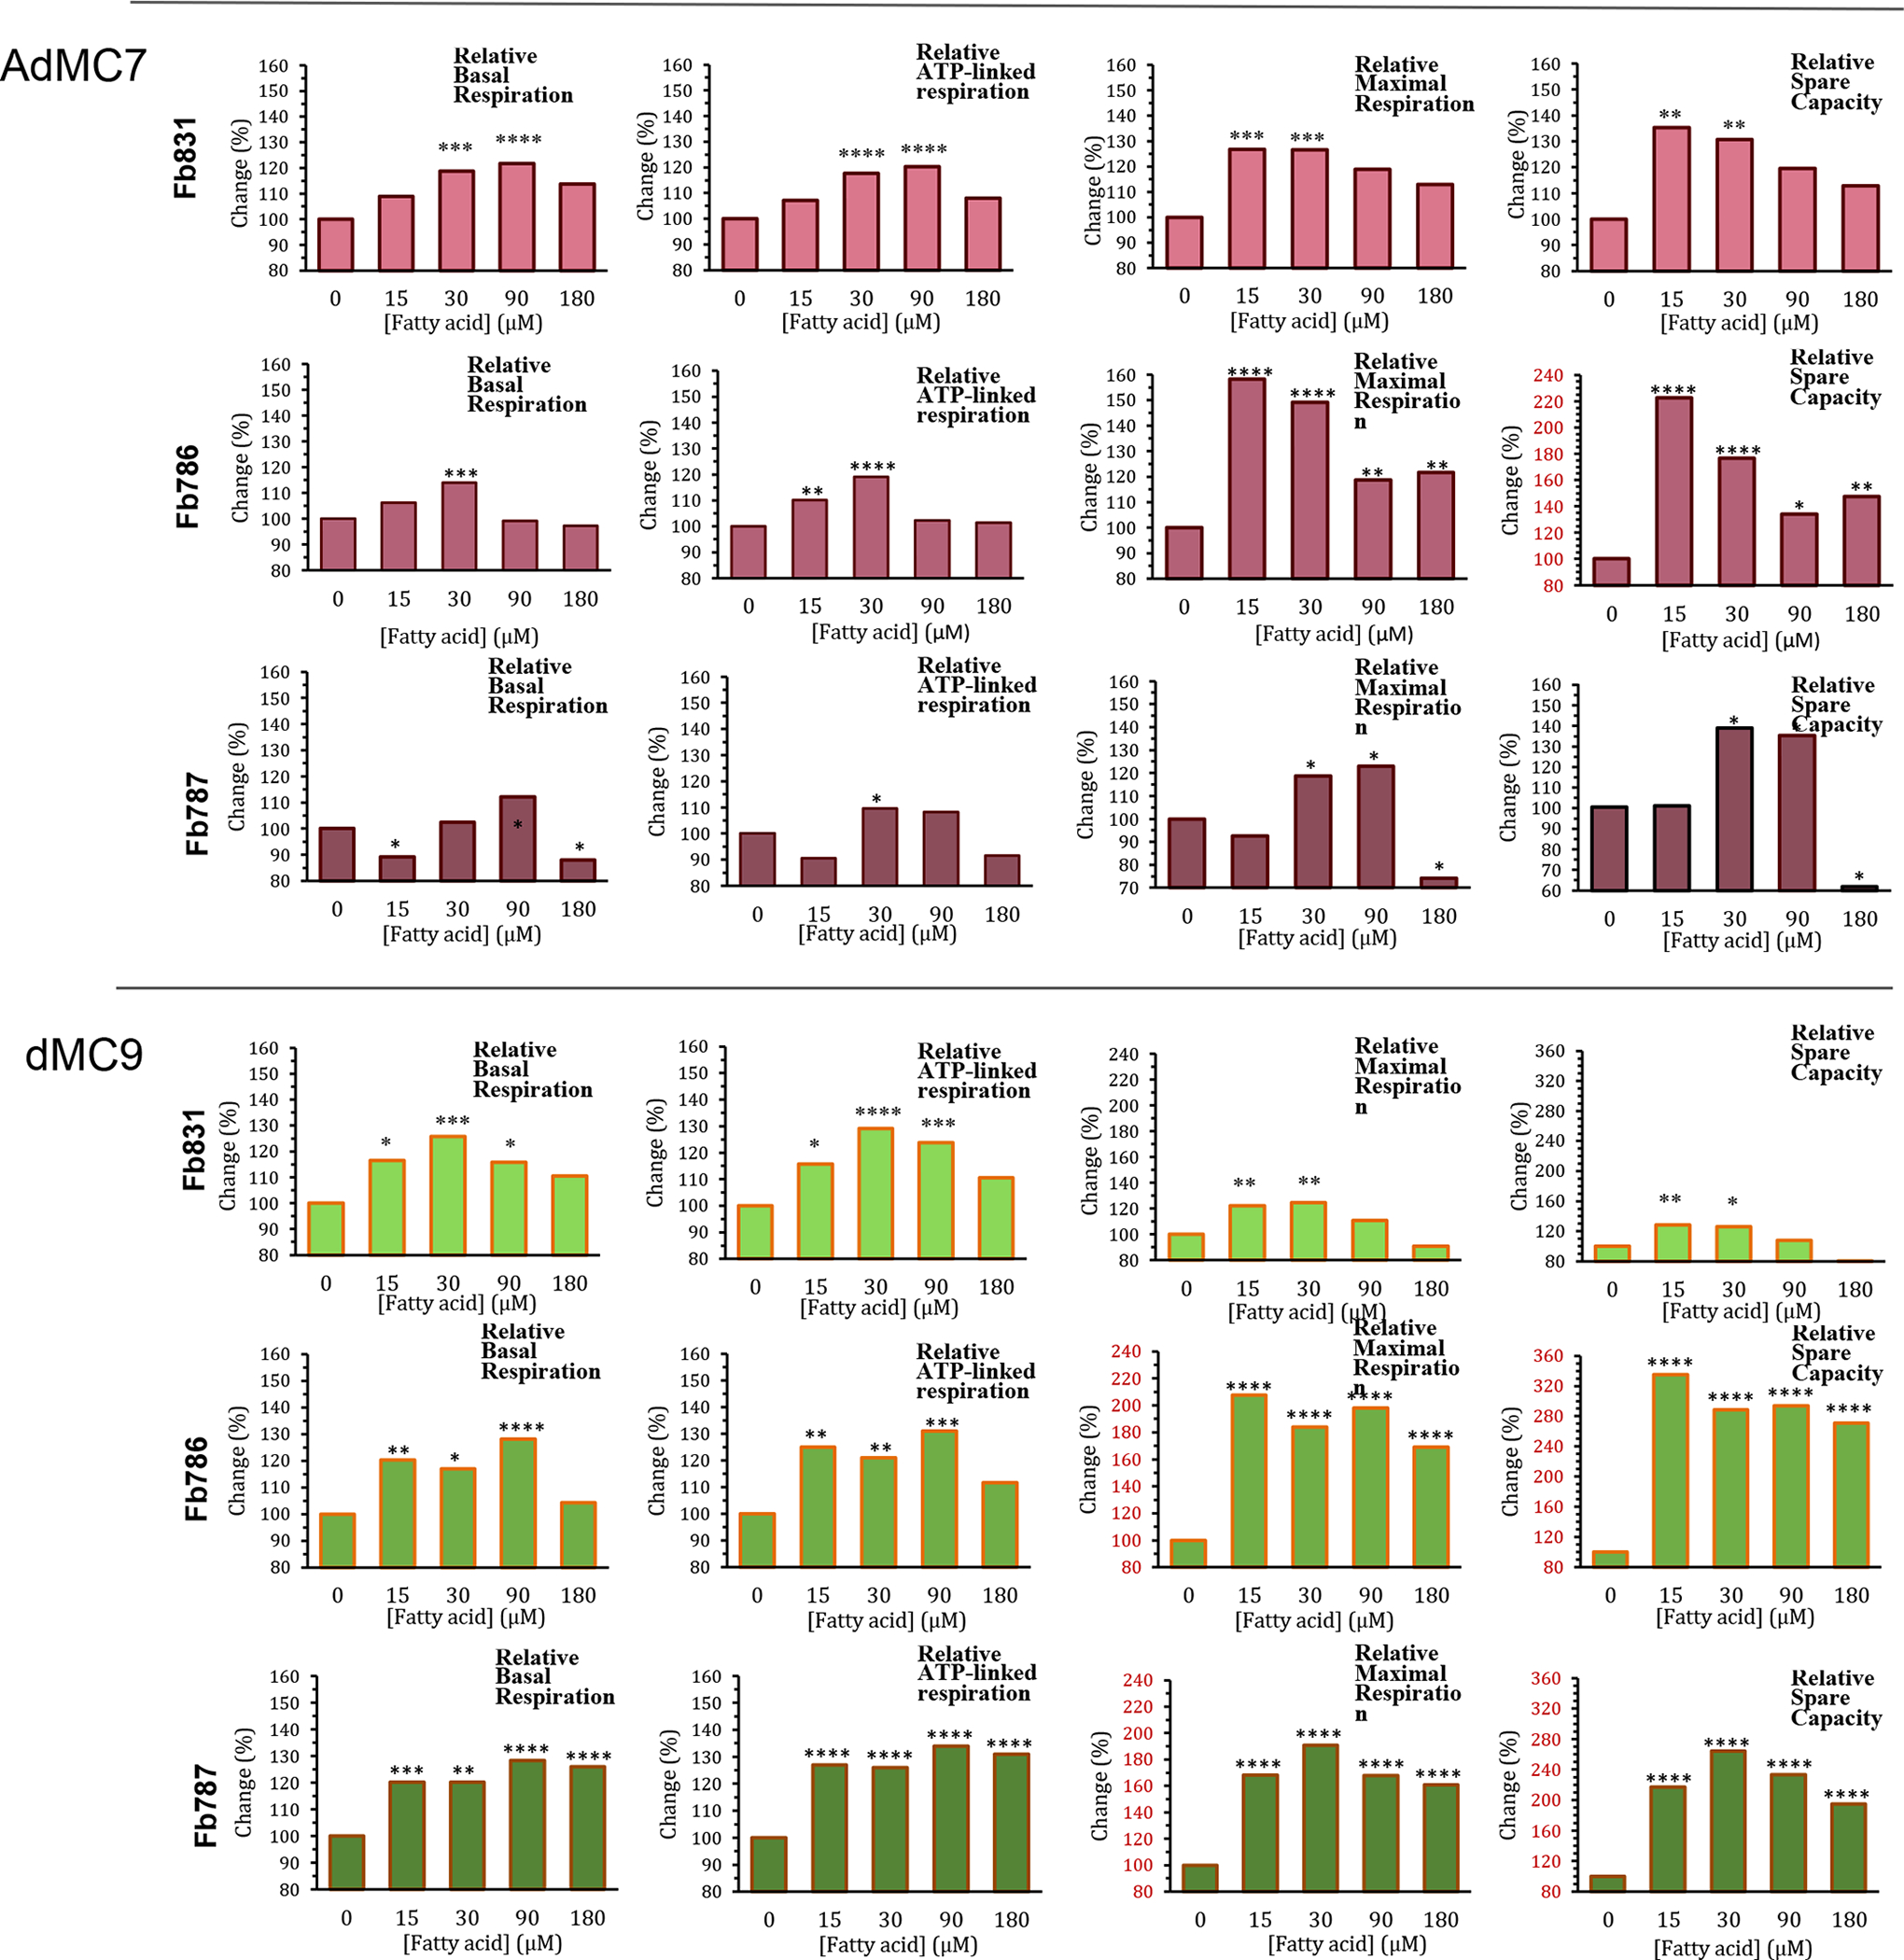
Comparative, normalized in percentage terms to untreated, real time oxygen consumption rate (OCR) measurements in three MCAD deficient patient fibroblast cell lines Fb831, Fb786, and Fb787 following treatment of medium chain fatty acids (FA). Panels from top to bottom: (A) C7, (B) dMC7, (C) AdMC7, and (D) dMC9. Graphs from left to right: Basal respiration, ATP-linked respiration, maximal respiration, and spare capacity. Statistical significance was transferred from the original data provided in Supplement Data section Figures 2s, 3s, and 4s, that were means ± SD of n=6–8 wells; *P < 0.05, **P < 0.01, ***P < 0.001, ****P < 0.0001, statistical comparison of C7 and MBCFAs treatment groups relative to no treatment (0 μM FA). Statistical analysis used Tukey multiple range test.
Overall, the three MBCFAs appeared to outperform C7 with increases in OCR parameters compared to a control of no fatty acid treatment, suggesting the ability to utilize these fatty acids at higher rates, especially dMC9 (Figure 2). Among the three MCADD cell lines, Fb786 cells responded the best to all three MBCFAs with maximum improvement in maximal respiration and spare capacity. In these cells treated with 15 μM AdMC7 and dMC9, relative maximal respiration and spare capacity reached statistically significant higher levels relative to no treatment control. Fb787 showed the next best response in these two parameters with the dMC9 treatment, while Fb831 showed the best response to treatment with AdMC7 for the same parameters.
3. Extracellular Acidification Rates (ECAR)
Control cells (Fb826) had significantly higher basal ECAR measurements in the presence of glucose/pyruvate compared to ECAR measurements in their absence (Figure 5Sa, Left panel). The basal ECAR measurement with dMC9 treatment was about twice that observed in the presence of glucose/pyruvate for unknown reasons. Treatment with various concentrations of C7, and all of the MBCFAs, resulted in further increase in ECAR at various concentrations (Figures 3 and 5Sa); however, the increase in ECAR with dMC9 was the most consistent across all concentrations when compared to other MBCFAs treatments (Figures 3, 5Sa).
Figure 3.
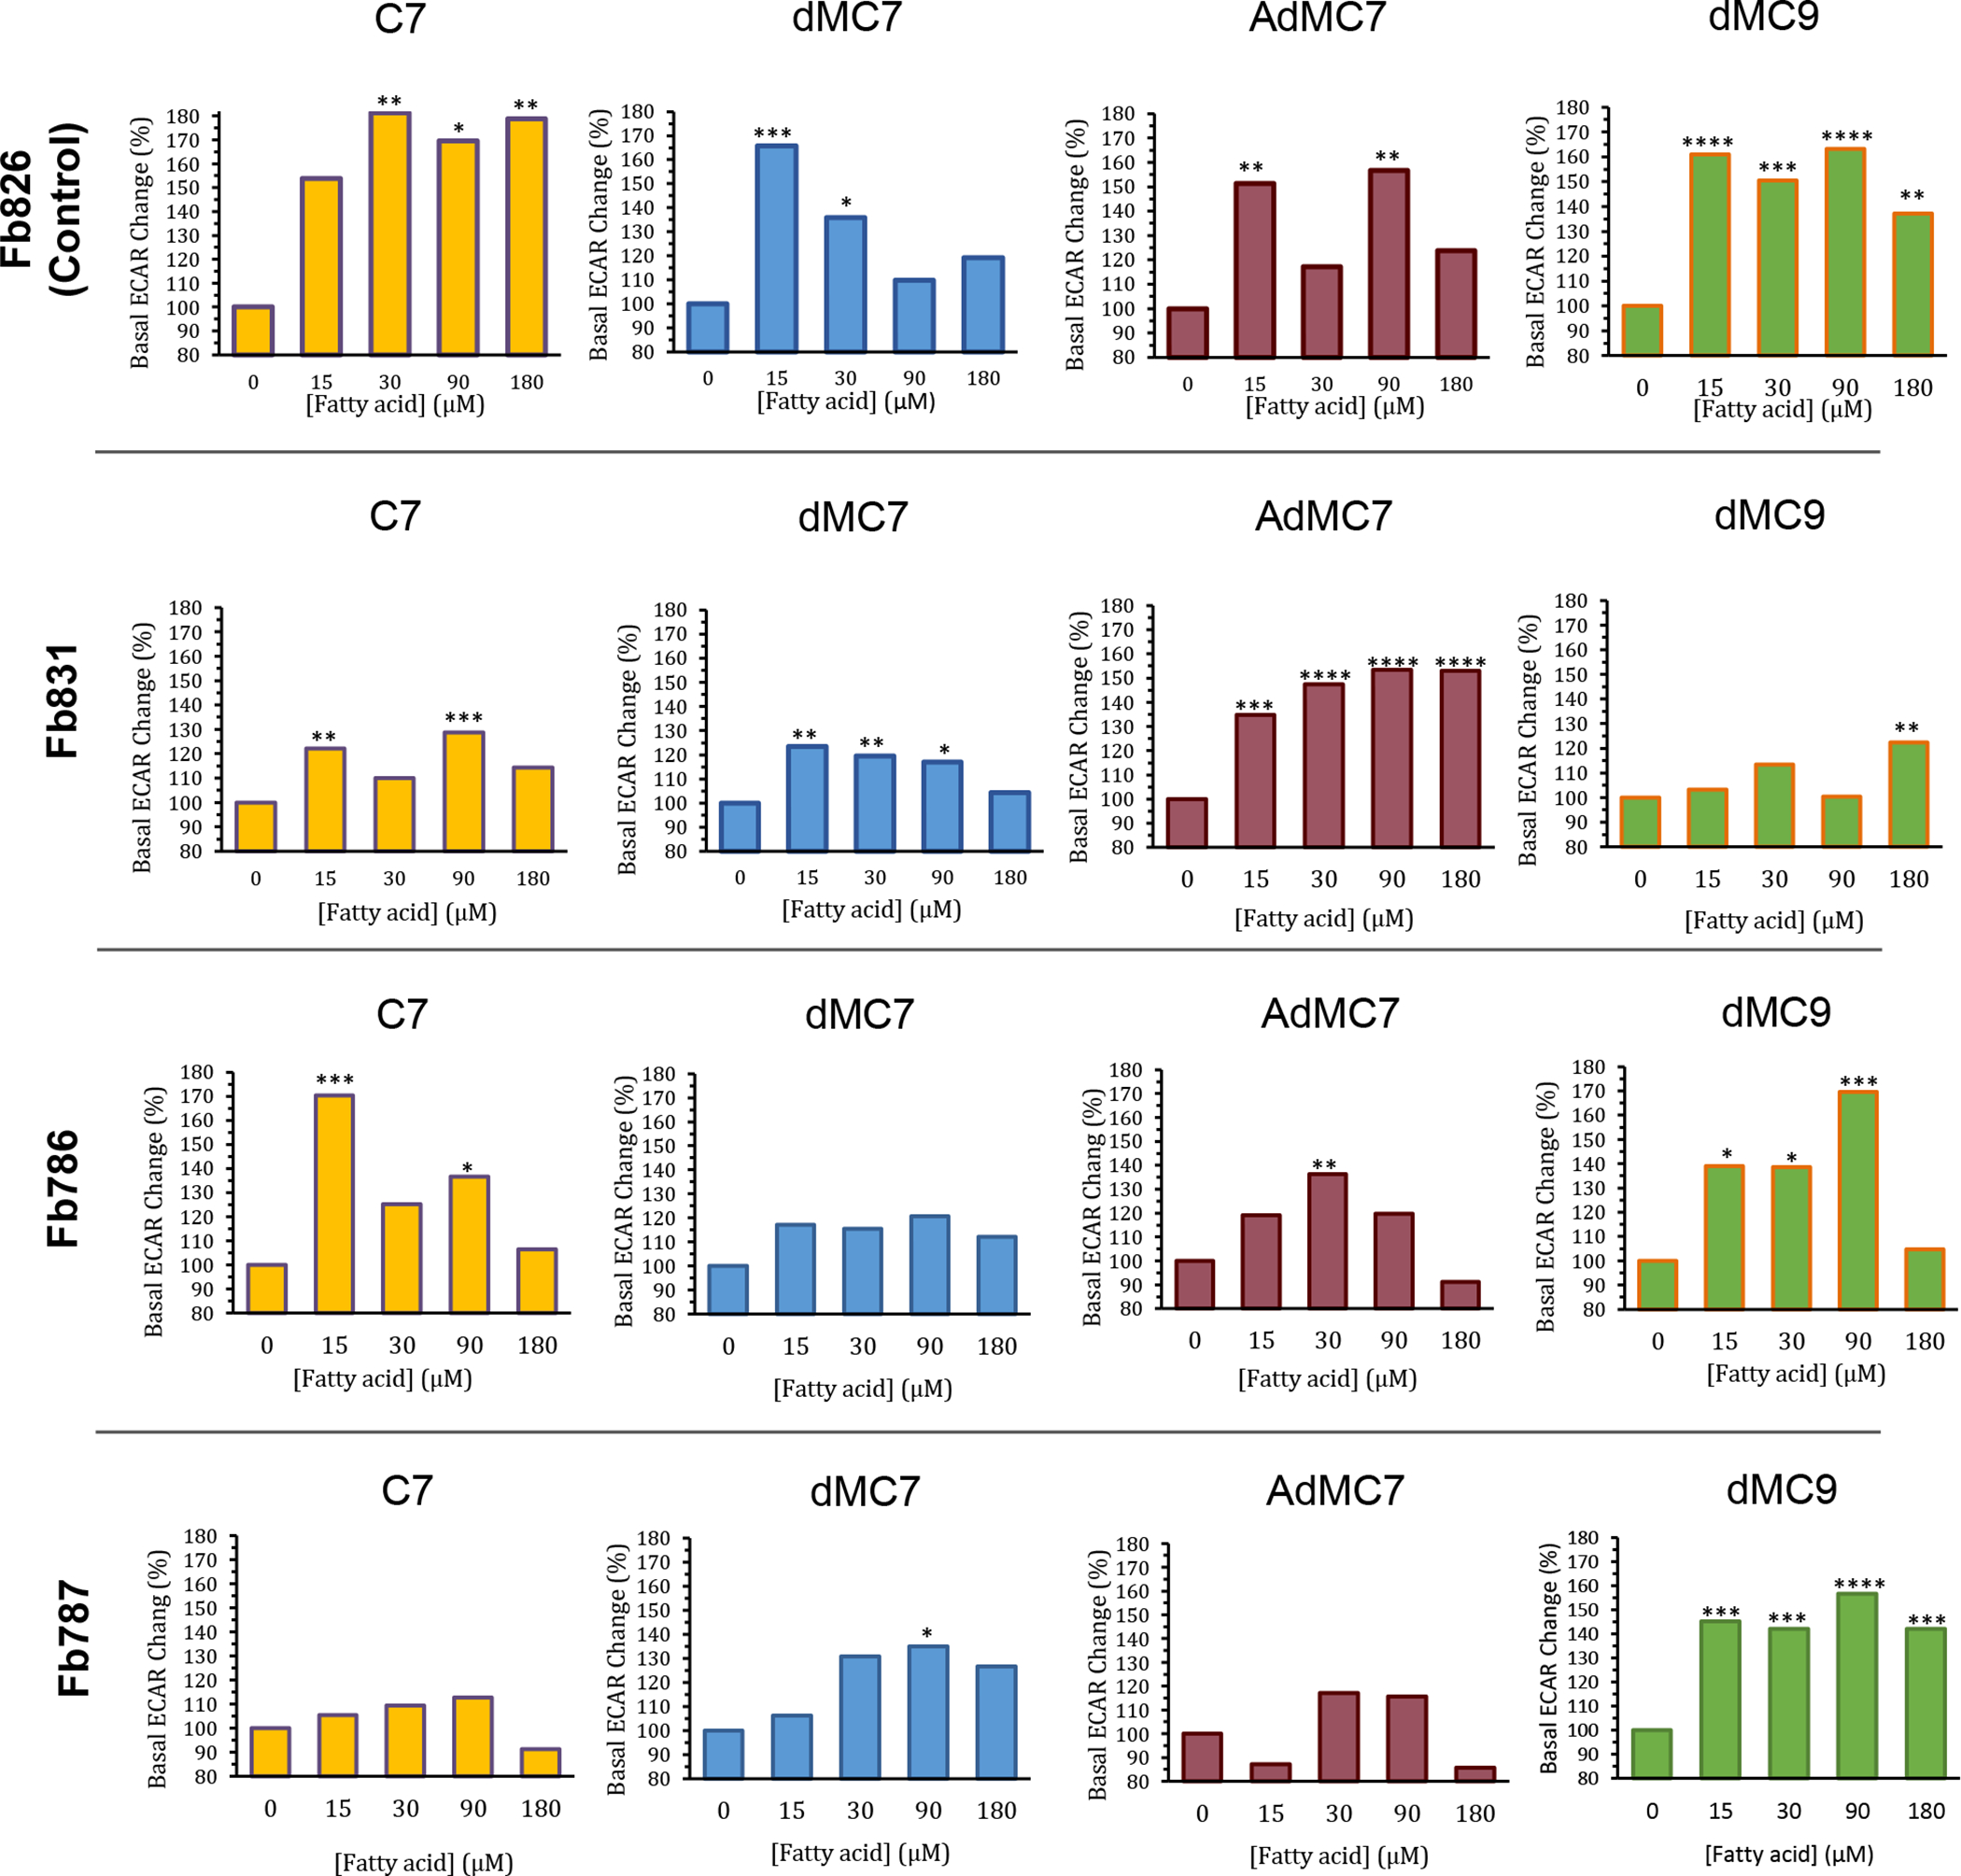
Comparative, normalized in percentage terms to untreated, real time basal extracellular acidification rate (ECAR) measurements in control fibroblast (Fb826) and three MCAD deficient patient fibroblast cell lines Fb831, Fb786, and Fb787 in response to incubation for 72 hours with C7, dMC7, AdMC7, and dMC9. Percent change in basal ECAR calculated relative to the measurement at 0 μM FA (no treatment). Data are means ± SD of n=6–8 wells. *P < 0.05, **P < 0.01, ***P < 0.001, ****P < 0.0001, statistical comparison of C7 and MBCFAs treatment groups relative to no treatment (0 μM FA). Statistical analysis used Tukey multiple range test.
In Fb831, basal ECAR had the highest response with 15 μM and 90 μM C7 (Figure 3). While dMC7 induced a basal ECAR increase at 15 μM in Fb831, the percent change compared to no treatment (0 μM FA) trended lower with the increase in its concentration (Figure 3). Conversely, basal ECAR trended higher with 15, 30, 90, 180 μM AdMC7 when compared to no treatment Fb831 control. While Fb831 showed the best ECAR response to AdMC7, Fb786 and Fb787 showed better basal ECAR response to dMC9 at 90 μM compared to no treatment MCAD deficient control.
Protein lysine succinylation in MCAD deficient cell lines
Figure 4 presents the level of cellular protein lysine succinylation as detected by antisuccinyllysine antibody staining (green) in control cells (Fb826) and MCAD deficient cells and the effect of the various treatments on the lysine succinylation. Anti-MTCO1 antibody staining (red) was used as a mitochondrial localization protein. Staining with antisuccinyllysine and anti-MTCO1 staining overlapped (yellow) in control cells (Fb826) in the presence of glucose/pyruvate highlighting the relative level of succinylated lysine residues in mitochondria compared to MTCO1 presence (Figure 4A). Notable is that in the absence of glucose/pyruvate antisuccinyllysine staining appears slightly reduced (Figure 4A, No Glucose image), while anti-MTC01 staining is more dramatically reduced. Antisuccinyllysine staining was restored with the treatments, although somewhat more intensely with the MBCFAs compared to C7.
Figure 4.
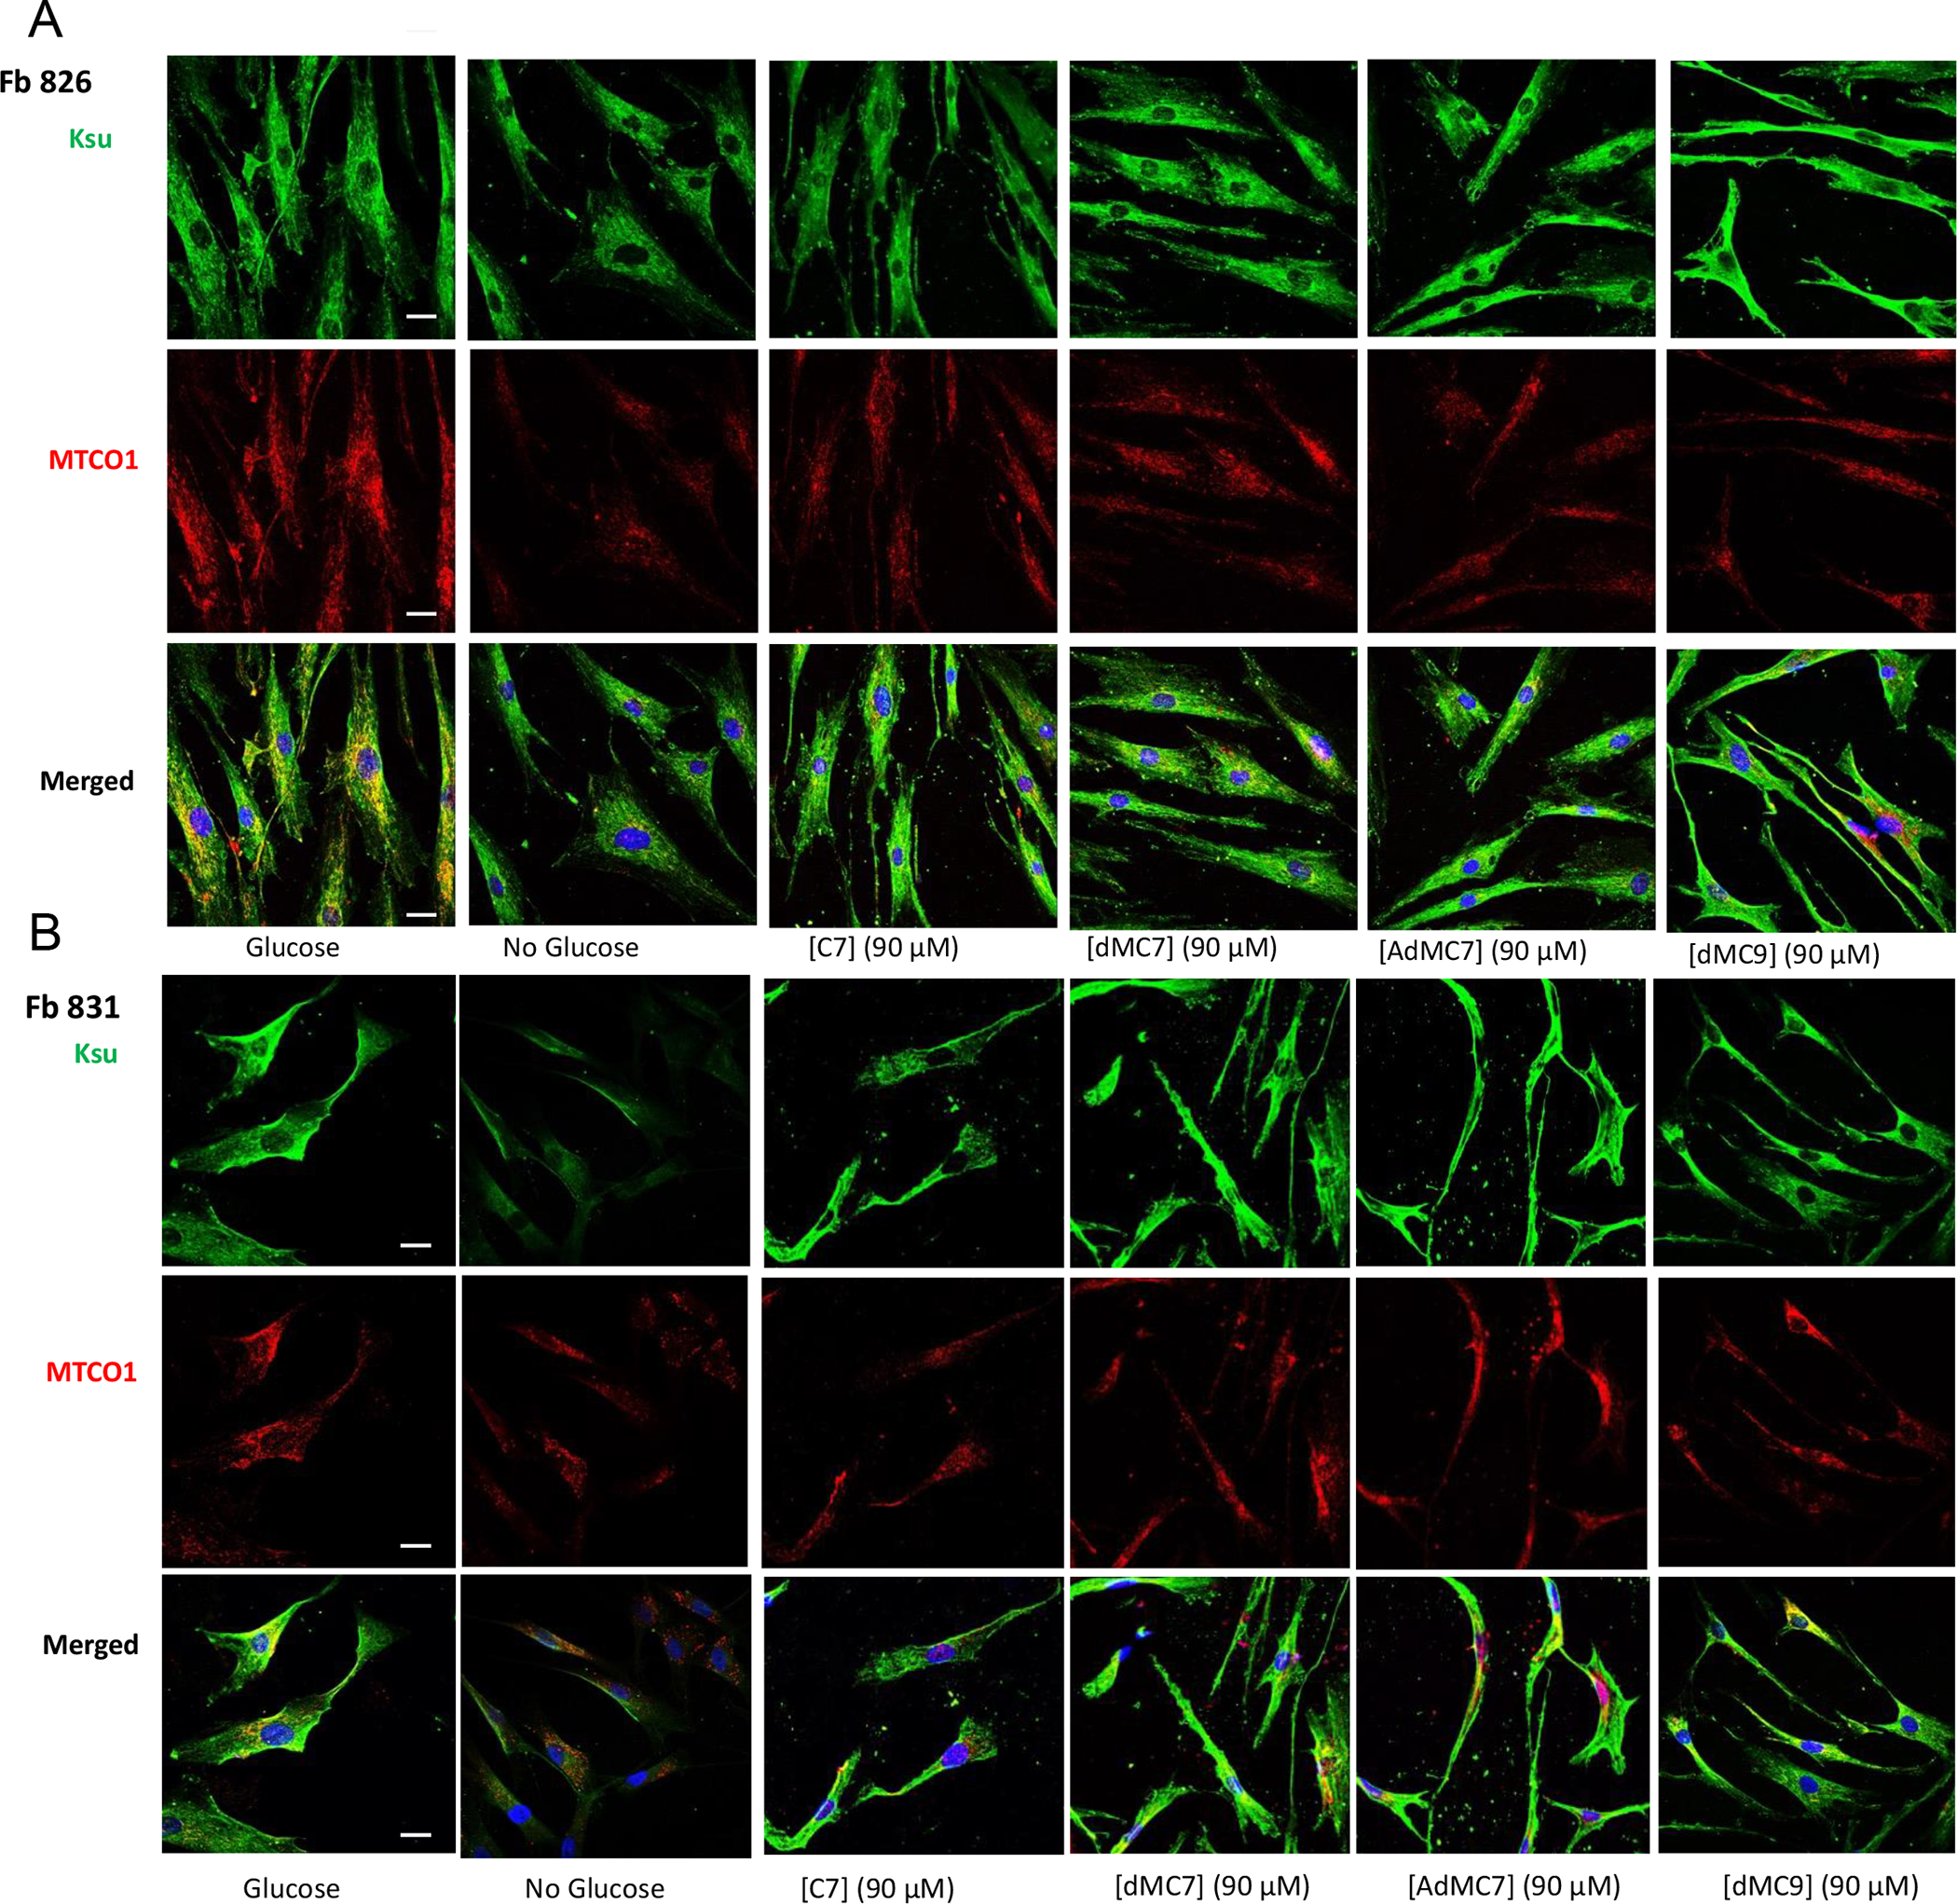
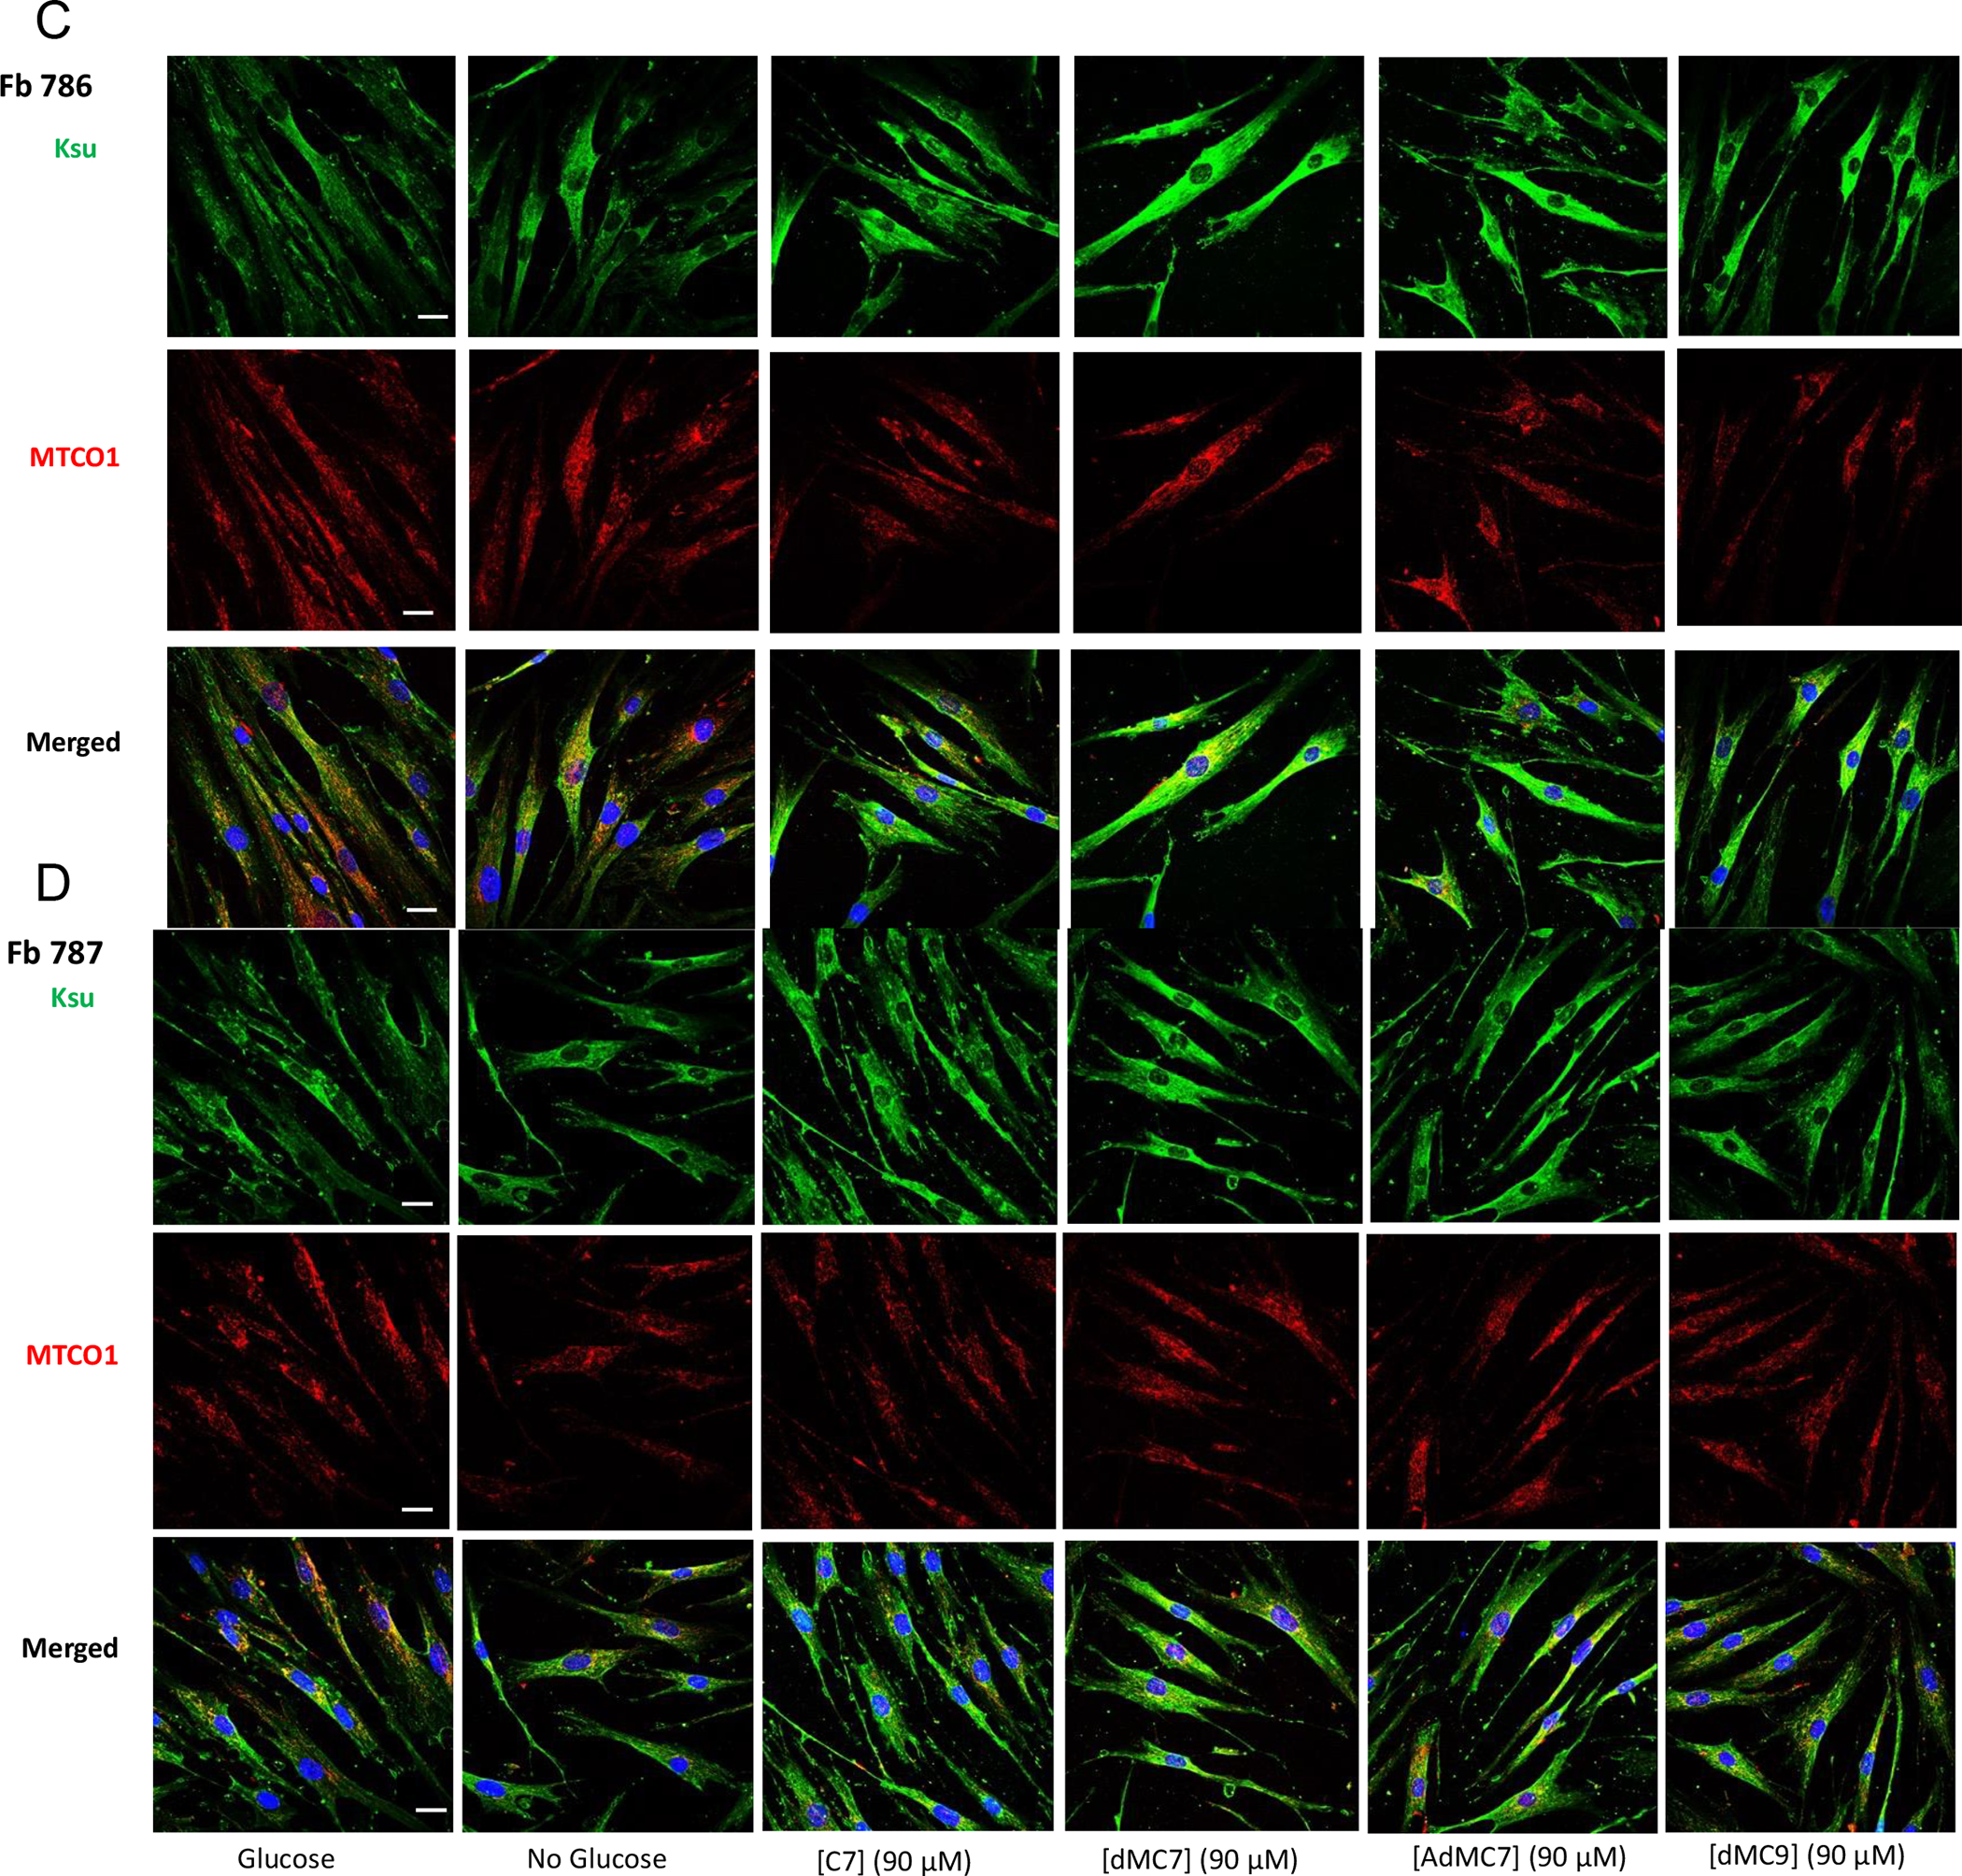
Immunofluorescence of Fb826 control (A) and Fb831, Fb786, Fb787 patient fibroblast cell lines (B-D) stained with antisuccinyllysine antibody (Ksu; Green) and anti-MTCO1 (Red) antibodies and DAPI (Blue) counterstain for nuclei after 72h treatment with 90 μM C7, dMC7, AdMC7 and dMC9. Scale bar = 20 μM.
MCAD deficient cells, Fb831 and Fb786, grown in media with no glucose/pyruvate had notable decrease in antisuccinyllysine staining (Figure 4B) and (Figure 4C), which was not as the decrease in Fb787 (Figure 4D), compared to Control (Fb826) grown in no glucose/pyruvate medium. The antisuccinyllysine staining was restored when cells were grown in media containing C7 or MBCFAs. Parallelly anti-MTCO1 antibody detected less MTCO1 protein in cells, Fb831 and Fb787, grown in media with no glucose/pyruvate but level was restored in cells grown in media containing C7 or MBCFAs. The Fb786 cells, (Figure 4C), grown in presence or absence of glucose/pyruvate or fatty acids did not show changes consistent with the other cell lines.
Quantitation of Selected Intracellular Metabolites
In the presence or absence of glucose/pyruvate, propionate levels in control (Fb826) and MCADD (Fb831) cells were minimally lower in the control cell line compared to no significant difference in the MCADD cell line (Figure 5A). In control cells, the proportion of intracellular propionate to succinate was similar across the four fatty acids treatments, with the succinate level being double the propionate level in each treatment (Figure 5A and B). Treatment of MCADD cells with the four fatty acids led to parallel changes in propionate and succinate, with C7 providing the greatest change (Figure 5A). Succinate also was significantly higher in the C7 treated MCADD cells compared to control, but was similar across the other treatments (Figure 5B).
Figure 5.
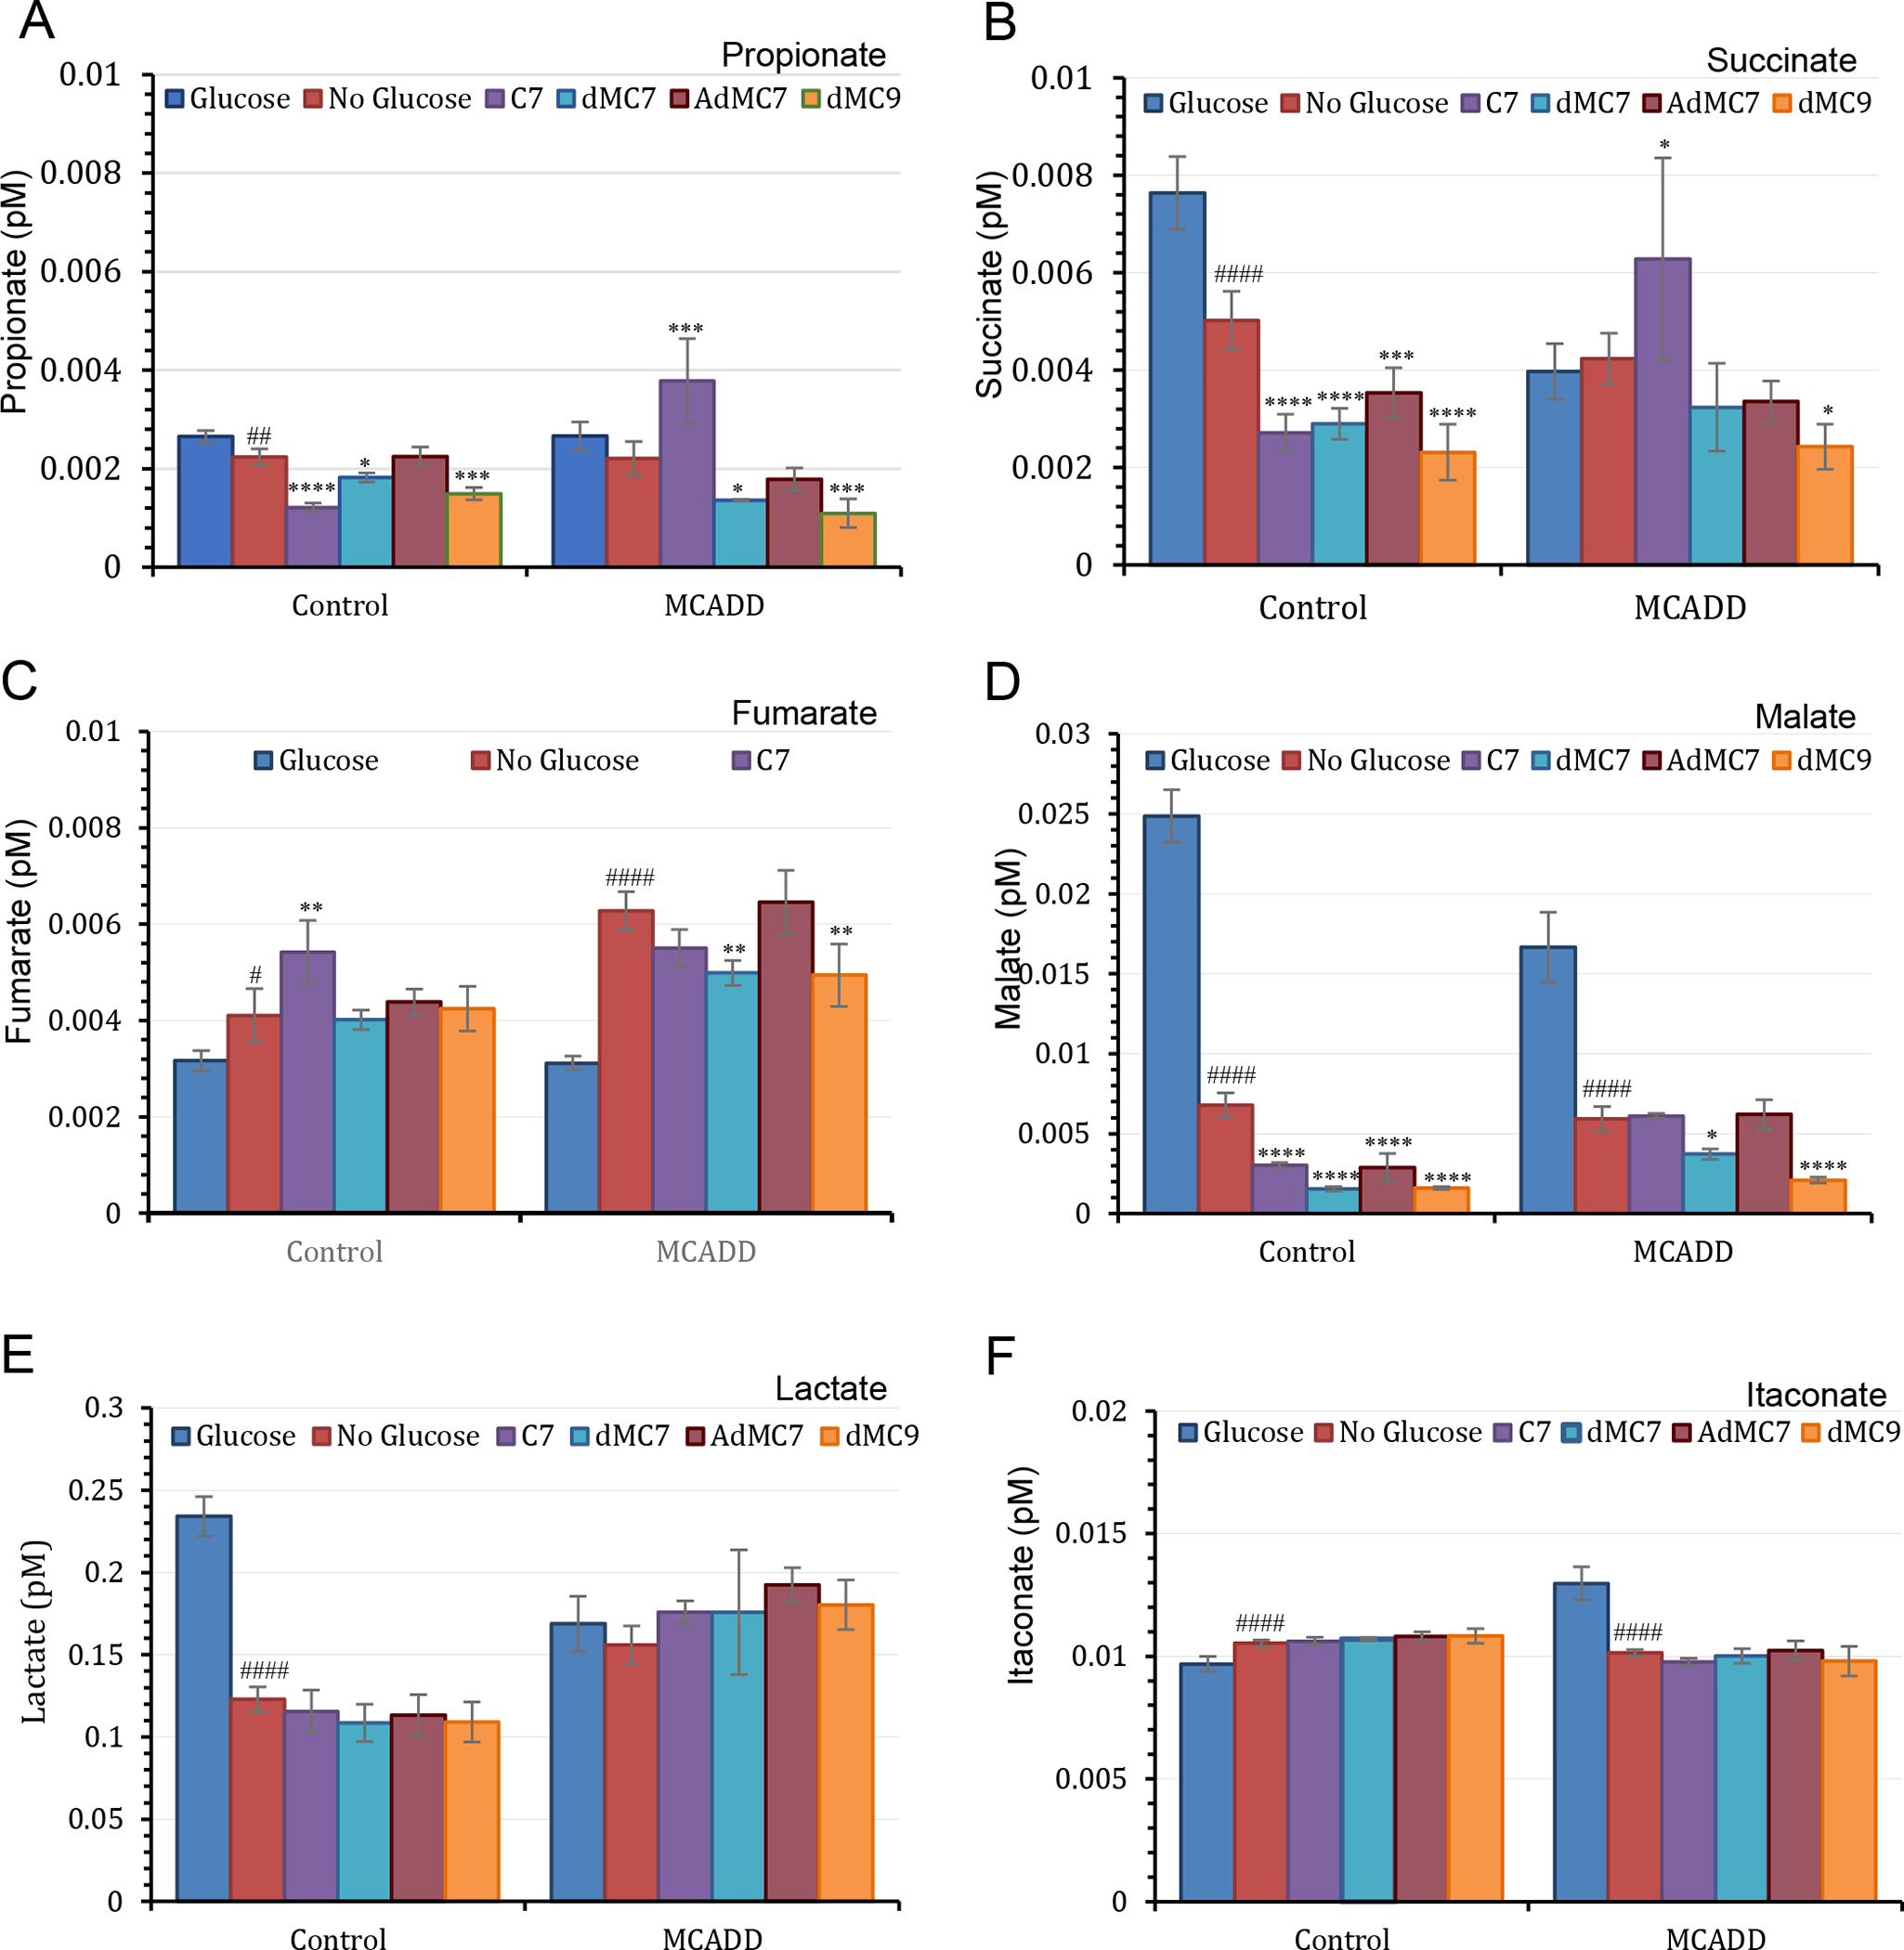
Measurements of selected Krebs cycle intermediates in control (Fb826) and in MCAD deficient (Fb831) fibroblast cells cultured in T175 flasks. All media had no additional glutamine or pyruvate, and lipid stripped FBS was included instead of regular FBS in all treatments. The number of biological replicates (n) submitted for analysis was six. Data are means ± SD of n=4–6. *P < 0.05, **P < 0.01, ***P < 0.001, ****P < 0.0001, statistical comparison of C7 and MBCFAs treatment groups relative to no treatment (0 μM FA); #P < 0.1, ##P < 0.01, ####P < 0.0001 statistical comparison of untreated cells in the absence of glucose/pyruvate relative to untreated cells in the presence of glucose/pyruvate. Statistical analysis used Tukey multiple range test.
Fumarate in control and MCADD cells was similar in the presence of glucose or with C7 treatments. However, it was higher in MCADD versus control cells in the absence of glucose, with or without treatment of dMC7, AdMC7, or dMC9 (Figure 5C). Malate was dramatically reduced in both cell lines without glucose and no fatty acid treatment compared to levels in the presence of glucose (Figure 5). However, in MCADD cells C7, dMC7 and AdMC7 had double the malate value when each fatty acid was compared to the corresponding malate level in control cell.
In control cells, intracellular lactate content decreased by about half in the absence of glucose/pyruvate and when treated with MBCFAs in their absence, while it was almost the same in the MCADD cells under all 3 media conditions (Figure 5E). Although when treated with AdMC7, lactate content increased compared to no treatment, it was slightly higher than with the C7 treatment though not statistically significant. Itaconate increased minimally in control cells when glucose was absent regardless of fatty acid treatment, while it decreased significantly in MCADD cells grown without glucose, regardless of fatty acid treatment (Figure 5F).
Intracellular aspartate was significantly higher (181%) in control than MCADD cells when cells were grown in the presence of glucose/pyruvate but was slightly lower in control cells compared to MCADD cells in their absence (Figure 6A). Aspartate rose significantly in MCADD cells when glucose was removed from the medium and did not change further with C7 or MBCFAs treatments. Similarly, glutamate content in control cells was higher than in MCADD cells in the presence of glucose/pyruvate, but dropped to similar levels in the two cell lines in their absence. Subsequent treatment with MBCFAs further reduced glutamate levels in control cells but had a minimal effect in the MCADD cells, except for dMC9, which resulted in lower glutamate level (Figure 6B).
Figure 6.
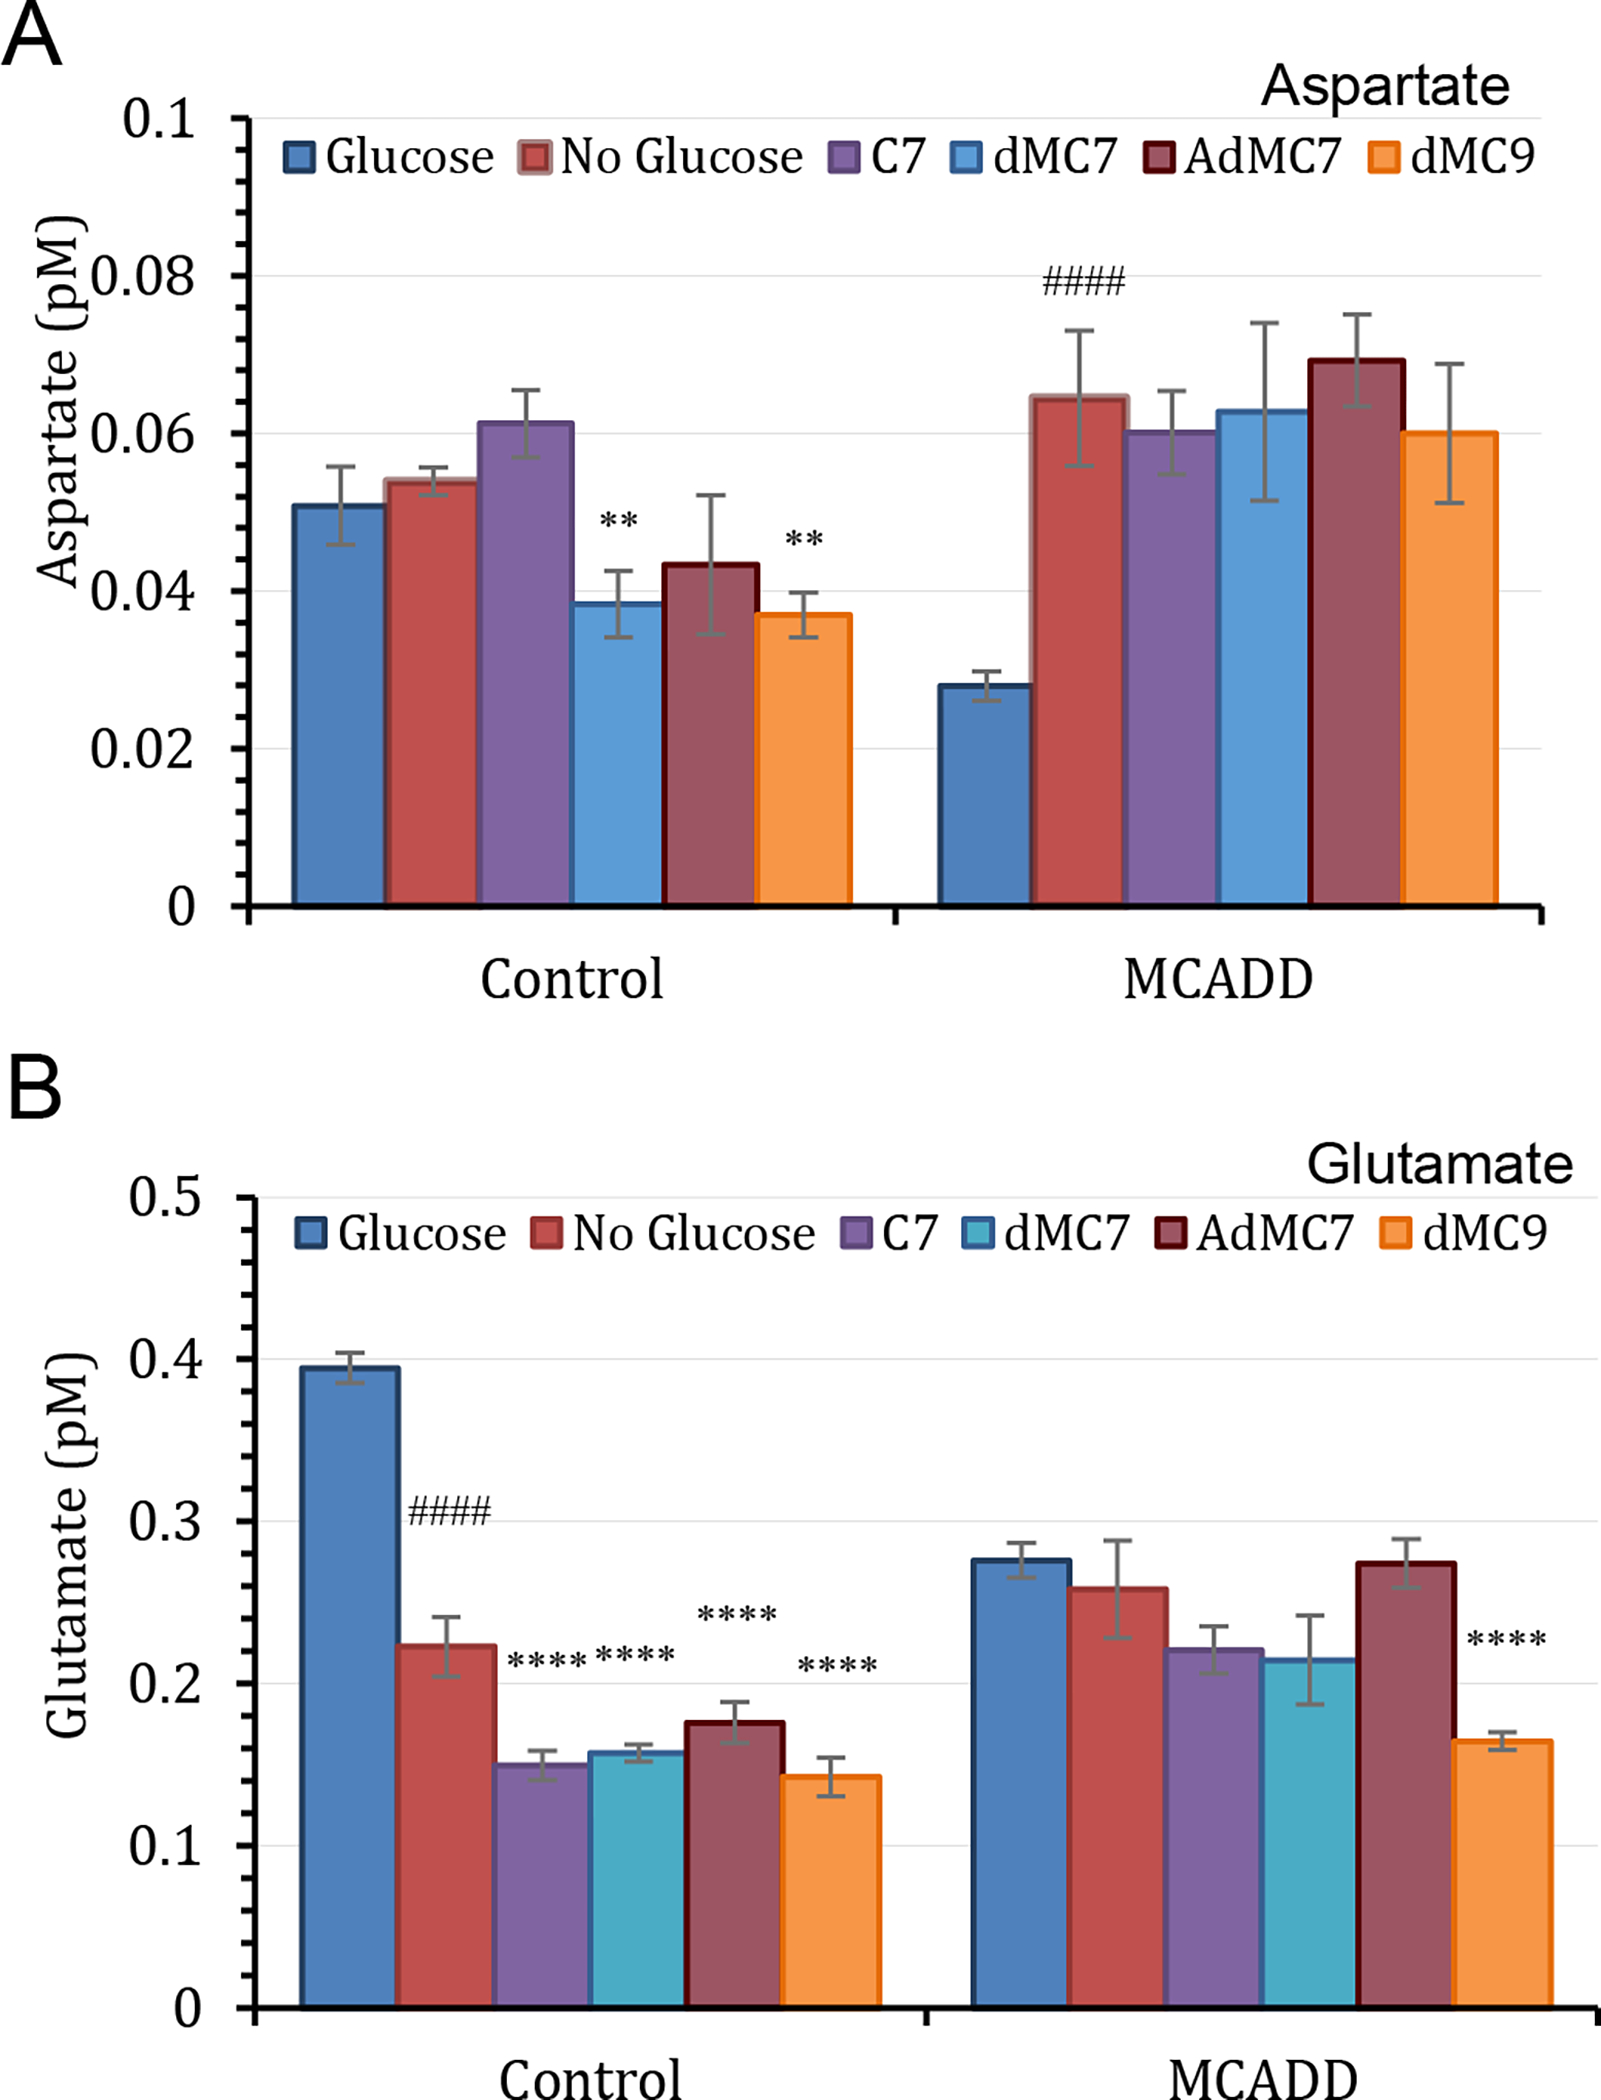
Measurements of aspartate and glutamate in control (Fb826) and MCAD deficient (Fb831) fibroblast cells. All media had no additional glutamine or pyruvate, and lipid stripped FBS was included instead of regular FBS in all treatments. The number of biological replicates (n) was six. Error bars reflect at least four biological replicates used in the data analysis. Data are means ± SD of n=6–8. **P < 0.01 and ****P < 0.0001, statistical comparison of C7 and MBCFAs treatment groups relative to no treatment (0 μM FA); ####P < 0.0001 statistical comparison of untreated cells in the absence of glucose/pyruvate relative to untreated cells in the presence of glucose/pyruvate. Statistical analysis used Tukey multiple range test.
Figure 6S summarizes and comparative levels of the various metabolites in control and MCADD cells grown in 120 μM of each fatty acid. Table 1 shows selected metabolite percentages in Control (FB826) and MCADD Fb831 cells when treated with C7 and MBCFAs compared to no treatment (0 μM FA).
Table 1.
Metabolite percentage in control FB826 and MCADD Fb831 cells when treated with a fatty acid at a final concentration of 180 μM in the culture media compared to no fatty acid treatment.
| Metabolite | Control Cells | MCADD Cells | ||||||
|---|---|---|---|---|---|---|---|---|
| C7/N.Gl.P.*(%) | dMC7/ N.Gl.P. (%) | AdMC7/ N.Gl.P. (%) | dMC9/ N.Gl.P. (%) | C7/ N.Gl.P. (%) | dMC7 N.Gl.P. (%) | AdMC7/ N.Gl.P. (%) | dMC9/ N.Gl.P. (%) | |
| Propionate | 54 | 81 | 100 | 67 | 171 | 61 | 81 | 50 |
| Succinate | 54 | 58 | 70 | 46 | 148 | 77 | 79 | 57 |
| Fumarate | 132 | 98 | 107 | 103 | 88 | 79 | 103 | 79 |
| Malate | 45 | 23 | 42 | 24 | 103 | 63 | 105 | 35 |
| Lactate | 94 | 88 | 92 | 89 | 113 | 113 | 123 | 116 |
| Itaconate | 101 | 102 | 103 | 103 | 96 | 99 | 101 | 97 |
| Asparate | 114 | 71 | 80 | 68 | 93 | 97 | 107 | 93 |
| Glutamate | 67 | 71 | 79 | 64 | 85 | 83 | 106 | 64 |
N.Gl.P.: No Glucose or Pyruvate added.
Triheptanoin remedies pathological symptoms in Acadm−/− mice and improves energy homeostasis
Given the unexpected improvement of intracellular bioenergetics and in levels of Krebs cycle related intermediates in MCADD patient derived fibroblasts in the presence of C7, triheptanoin was fed to Acadm−/− mice and biochemical and histological biomarkers were followed. The metabolism of C7 was monitored through the carnitine breakdown derivatives of C7 in plasma. In treated Acadm−/− mice, blood levels of heptanoylcarnitine and its metabolites valerylcarnitine, and propionylcarnitine increased in a dose dependent fashion (Figure 7 inset, Table 1S) unequivocally demonstrating metabolism of the triheptanoin derived heptanoyl-CoA. Histological biomarkers were also examined with triheptanoin on Acadm−/− mice fed a high sucrose diet, which leads to the development of hepatosteatosis in these animals. Triheptanoin reversed micro and macro hepatosteatosis (Figure 7A&B) and improved glycogen storage (Figure 7C) in the high sucrose fed animals. Wild type and Acadm−/− mice liver sections stained with antisuccinyllysine and MTCO1 antibodies confirmed that the Acadm−/− mice had dramatically less lysine succinylated proteins and MTCO1 protein (Figure 8A & B, left panel). Treatment of the Acadm−/− mice with C7G caused a dramatic increase in detectable lysine succinylated proteins and MTCO1 protein at all the three doses (Figure 8B).
Figure 7.
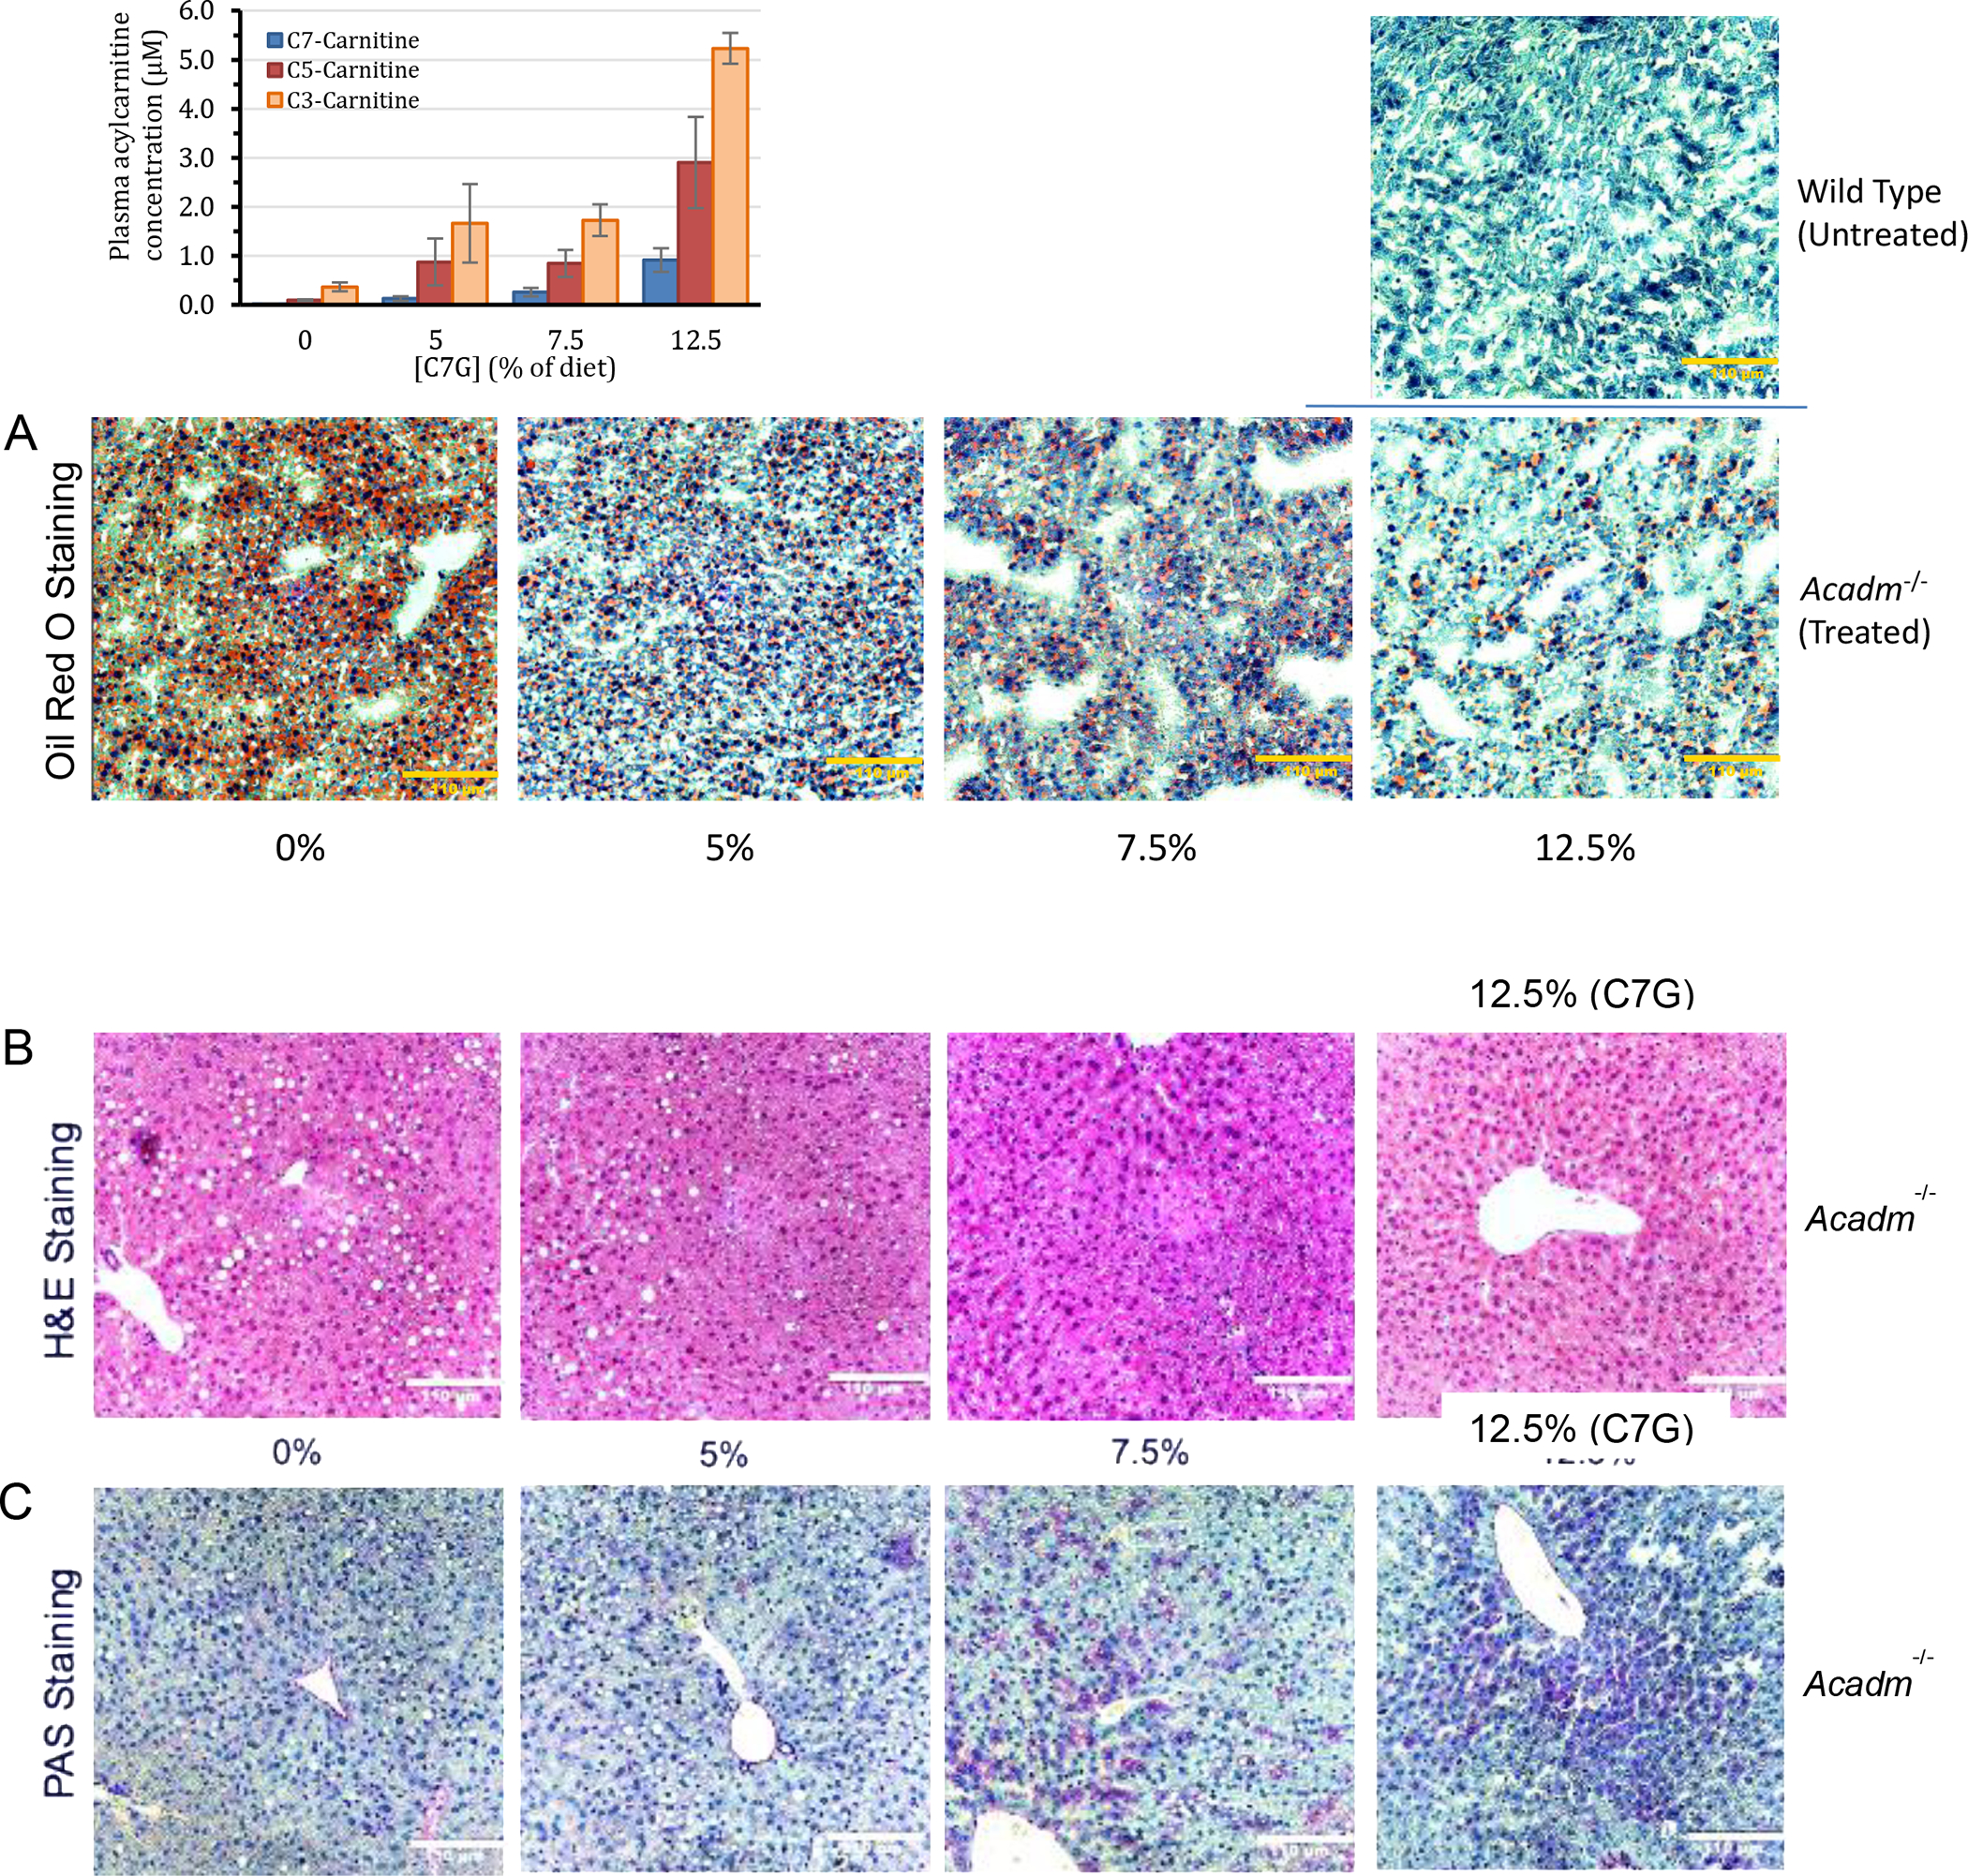
Biochemical and histological evidence of efficacy of triheptanoin in Acadm−/− mice. Mice were treated twice daily with triheptanoin [0%, 5%, 7.5%, and 12.5% of diet (wt:wt)] using oral gavage for seven days before histological examination. Livers from the various treatments were sectioned at different regions. (A) Oil Red O staining of mouse liver tissue section showing dose-dependent improvement of macrovesicular and microvesicular steatosis (B) H&E staining showing oil droplets disappearing; and (C) PAS staining showing glycogen liver content increasing (more purple) with increasing amounts of triheptanoin. Yellow (or White) bar in bottom right corner of images represents 110 μm. Inset bar graph is the heptanoylcarnitine (C7-carnitine), valerylcarnitine (C5-carnitine), and propionylcarnitine (C3-carnitine) plasma levels after four days of dosing triheptanoin at 0%, 5%, 7.5% and 12.5% of diet (wt:wt) to Acadm−/− mice (n=4 per treatment group).
Figure 8.
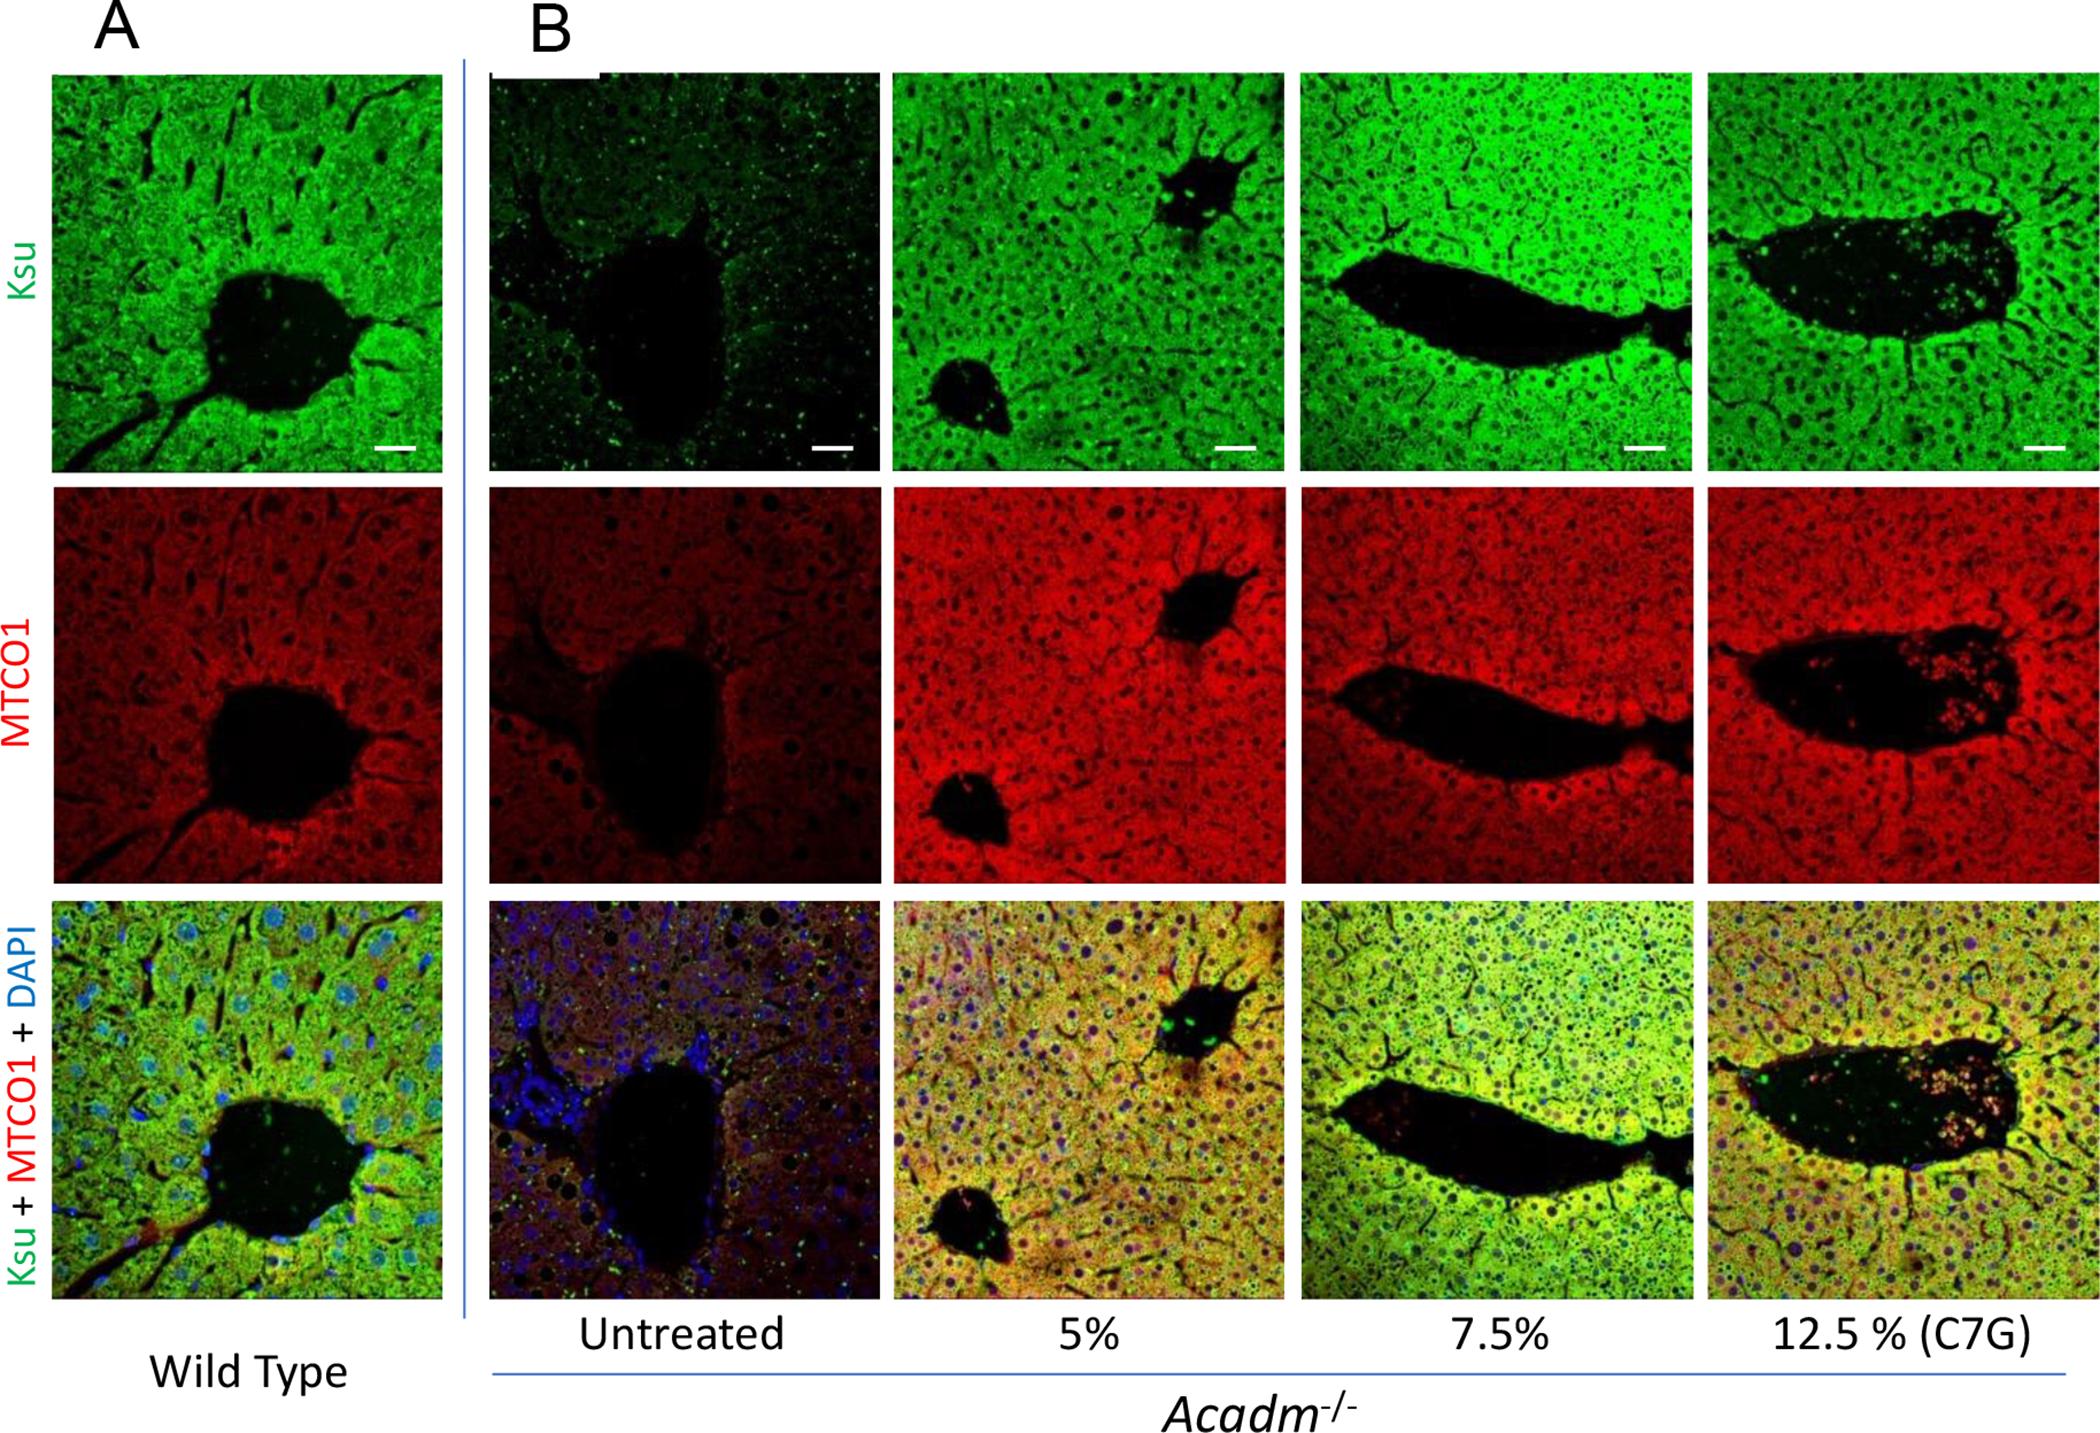
Immunofluorescence confocal microscopy images of mice liver sections stained with antisuccinyllysine (Ksu; Green) and anti-MTCO1 (Red) antibodies and DAPI (Blue) counterstain. Wildtype untreated (A) and Acadm−/− untreated and triheptanoin treatment [0%, 5%, 7.5%, and 12.5% of diet (wt:wt)] using oral gavage for seven days before histological examination. Images were captured using Zeiss LSM 710 confocal microscope with 20x objective Zoom 1.5x. Scale bar = 20 μM.
Involvement of SCAD in C7 metabolism
The cellular and animal studies unequivocally demonstrated that Acadm−/− mice were able to metabolize C7. To examine the enzyme responsible for this activity in the absence of MCAD, acyl-CoA dehydrogenase activity was measured in cellular extracts from control and MCADD fibroblasts using four acyl-CoA substrates: C4-CoA, C7-CoA, C8-CoA, or C16-CoA (Table 2). The level of activity in control cells measured with each substrate was in keeping with normal SCAD, MCAD, and VLCAD optimum substrate specificity. As expected, no activity was detected in MCADD cell extract using C8-CoA as substrate, consistent with the known cellular ACADMG985A/G985A genotype. However, the extract was able to readily catalyze C7-CoA, demonstrating the presence of another ACAD(s) that could utilize this substrate. Finally, purified recombinant human SCAD was found to utilize C7-CoA as substrate at ~20% of its optimum substrate, C4-CoA (Table 2).
Table 2.
Specific activity values for acyl-CoA dehydrogenases using substrate-specific CoA esters to measure SCAD, MCAD, and VLCAD activity. The enzyme assay used was the ETF fluorescence reduction assay (42, 53, 54).
| Cell line | Specific Activity (nmol ETFred•min−1•mg−1; mU/mg) ±SD | C7/C4 (%) | |||
|---|---|---|---|---|---|
| C4-CoA | C7-CoA | C8-CoA | C16-CoA | ||
| Fb826* | 0.93 ±0.20 | 1.93 ±0.13 | 2.18 ±0.07 | 4.13 ±0.43 | 208 |
| Fb831* | 1.00 ±0.16 | 0.51 ±0.03 | Not Detectable | 2.64 ±0.30 | 51 |
| Enzyme | Specific Activity (μmol ETFred•min−1•mg−1; U/mg) ±SD | ||||
| rhSCAD** | 17.61 ±5.71 | 3.69 ±0.14 | Not Determined*** | N/A | 21 |
Amount of protein used from Fb826 control cell free extract and the Fb831 (MCAD deficient) cell free extract was 240 μg for C4-CoA and C7-CoA and 120 μg for C8-CoA and C16-CoA assays. Substrate concentration used in all assays was saturating at 30 μM. No activity was detected in the Fb831 assay with C8-CoA.
Amount of recombinant human short chain acyl-CoA dehydrogenase (rhSCAD) used in the assays was 0.22 μg protein/0.6 ml reaction volume. Values reported as the average of 3 measurements of the same sample.
Previously determined (56)
DISCUSSION
Utilization of C7 and MBCFAs in control and MCADD cells
The anaplerotic effect of treatment of long chain FAODs with triheptanoin has been demonstrated to reduce symptoms in patients with long chain fatty acid oxidation disorders and has been especially effective in eliminating hypoglycemia (21, 22, 37). Triheptanoin has heretofore been assumed to be contraindicated in MCADD based on the demonstration that growth of MCAD deficient cells in the presence of 7C-2H3-heptanoate led to accumulation of significant levels of 2H3-heptanoylcarnitine in the culture medium (38). In contrast, our current findings demonstrate that both purified SCAD and cellular extracts from MCAD fibroblasts can readily utilize C7-CoA as substrate, and that MCADD mice fed a high sucrose diet are protected from hepatosteatosis when treated with triheptanoin. A negative isotope effect can explain the discrepancy between the 7C-2H3-heptanoate MCAD deficient cell studies and ours, as the SCAD substrate binding pocket is most likely unable to sterically accommodate the D3-labeled carbon-7 of its CoA ester substrate.
OCR changes were measured in media without glucose, pyruvate, and long chain fatty acids associated with FBS into the media. Cells without these energy sources can utilize amino acids for generating glucose and for other energy needs. Thus, to eliminate variability emanating from alternative pathways across cells when comparing the performance of the MBCFAs we have compared their effect to that observed with C7. The improvement in the mitochondrial bioenergetic parameters of control and MCADD cells in the presence of C7 was substantiated by the increase in maximal respiration and spare capacity. While AdMC7 and dMC7 showed variable improvement, dMC7 was utilized consistently well by all three MCADD cell lines in terms of OCR and dMC9 outperformed the other FAs in two of the MCADD cells.
While the catabolism of dMC7 and AdMC7 in mitochondria is predicted to primarily proceed through LCAD, the CoA ester of dMC9 could hypothetically be an MCAD substrate, since the active site of MCAD has been reported to accommodate branching at the C4 and C5 positions (46,47). Catabolism of these three MBCFAs is also expected to be slower in liver since ACADL (the gene coding for LCAD) is expressed at relatively low level compared to ACADM expression. Therefore, their catabolism is expected to be significantly slower compared to C7 in normal cells. However, it is promising that despite the relatively lower ACADL gene expression in fibroblast cells compared to other ACADs, MCADD cells grown in dMC7, AdMC7, and dMC9 produced improved OCR patterns compared to grown growth in C7. Such changes could be considered as “metabolic re-programing”, similar to those proposed in ischemic heart disease or malignancies where major metabolic disruptions occur but in a higher number of biochemical pathways (39, 40).
Effect of C7 and MBCFAs on ECAR
Basal ECAR data are consistent with MBCFAs being well utilized in control cells, potentially generating lactate or glucose. In this setting, dMC9 more closely mirrored C7 in performance (41). An increase in lactic acid may reflect the contribution of C7 to correct an imbalance in glucose cellular homeostasis in response to the absence of extracellular glucose. This suggests rapid C7 oxidation and gluconeogenic utilization in control cells and supports the role of MCAD in initiating the breakdown of C7. However, the greater increase of ECAR in control cells grown in dMC9 compared to C7 indicates higher efficiency of dMC9 catabolism, perhaps leading to higher levels of oxaloacetate, a key gluconeogenic intermediate. In MCADD cell lines Fb787 and Fb786 grown without glucose/pyruvate, the relative effect of MBCFAs on basal ECAR was more modest than in control cells, though still significant.
While dMC9 caused the largest increase in ECAR in these two cell lines, AdMC7 induced the highest increase in ECAR across all concentrations compared to the other treatments in Fb831. The predicted catabolic fate of AdMC7 is to produce one pyruvate molecule (25), which could account for an increase in lactate and hence ECAR. An alternative explanation to the notable increase in ECAR is secretion of excess free propionate (due to exhaustion of intracellular carnitine supply), acidic amino acids, aspartate and/or glutamate, and/or acetate. The latter is less likely given that dMC7 provides only one acetate while AdMC7 provides an acetate only if it is generated from the predicted pyruvate conversion. Of course, utilizing synthetic amino fatty acids as anaplerotic compounds will require careful assessment of possible untoward effects including generation of NH3 affecting its homeostasis.
Lysine succinylation in MCAD deficient human cells
In our previous study examining these MBCFAs as anaplerotic molecules in treating cells with long chain fatty acid disorders, we hypothesized that being a rich source of succinyl-CoA is key for their effectiveness (25). Our IF results in this study are, in general, consistent with the hypothesis that in the absence of glucose/pyruvate the level of succinyl-CoA also is affected in MCAD patient cells, evident from lower antisuccinyllysine signal, and hence is likely key to pathogenesis. The variability observed in the levels of lysine succinylation among the three cell lines is consistent with a heterozygosity phenomenon or variations in metabolic reprograming or adaptability of cells to utilize other anaplerotic molecules. Treatment with C7 and the MBCFAs restores protein lysine succinylation, suggesting that these fatty acids would be effective in vivo to treat severe depletion of succinyl-CoA and risk of development of hypoglycemia as the downstream oxaloacetate, a gluconeogenic Krebs cycle intermediate, is expected to be enriched.
Effect of C7 and MBCFAs on selected metabolites
Metabolomics results revealed that the levels of key intracellular energy metabolites, propionate, succinate, fumarate, malate, lactate, glutamate, and aspartate are generally improved in MCADD cells in the presence of C7 or MBCFAs compared to control cells. The two amino acids can easily be generated from oxaloacetate and α-ketoglutarate, respectively, and so may reflect the level of these Krebs intermediates as well. The metabolomics data are consistent with the extracellular OCR results in suggesting the efficient utilization of these fatty acids to generate energy and supplying the metabolites needed for gluconeogenesis, especially important in MCADD cells. Furthermore, these results are consistent with our hypothesis that MCADD cells are metabolically reprogrammed to use alternative sources of energy molecules other than glucose compared to control cells and can bypass the MCAD step readily in the presence of a proper alternative.
While there was a dramatic decrease in both intracellular measured lactate and ECAR (Figure 4; Figure 5Sa) in the control cells in the absence of glucose with or without C7 and MBCFAs treatments, in MCADD cells the two parameters did not show a similar trend. In MCADD cells, the level of intracellular lactate was similar in the presence or in the absence of glucose (Figure 4), but the ECAR values were dramatically lower in the absence of glucose with no FA no treatment, and in the rest of the treatments (Figure 5Sa). This implies that MCADD cells can regulate intracellular lactate production/excretion from glucose and C7 or MBCFAs differently than control cells and is consistent with MCADD cells being metabolically reprogrammed. Unlike in control cells, the levels of aspartate were significantly lower in the presence versus absence of glucose/pyruvate in the Fb831 cells compared to its absence (Figure 5). Glutamate levels among all treatments somewhat mirrored lactate levels in control and MCADD cells, with the exception of dMC9 treatment in MCADD cells where glutamate was significantly lower, consistent with reasonable availability of these two metabolites for cellular function.
Efficacy of C7 in treating MCADD cells
The presence of more than one acyl-CoA dehydrogenase capable of initiating C7-CoA breakdown could explain the rapid breakdown in the liver in long chain FAODs patients receiving triheptanoin treatment. While the data confirm that MCAD is the major contributor to C7 metabolism when the enzyme is present, the results also prove it is not essential in human MCADD cells for its metabolism. Activity ratios of assays performed with recombinant human SCAD demonstrate that SCAD has 1/5 the activity with C7-CoA compared to C4-CoA at saturating concentrations (Table 2). Consistent with the enzymatic data, OCR and ECAR assays of MCADD cells indicate that C7 is well tolerated in the absence of MCAD activity. It is possible, however, that ACADs other than SCAD may be involved to a lesser degree in metabolizing C7-CoA in the absence of MCAD. While C5-CoA generated after one β-oxidation cycle can compete rather effectively with C7-CoA as substrate for SCAD since it is expected to have a lower Km for C5-CoA, isovaleryl-CoA dehydrogenase (IVD) also has been reported to have significant activity towards C5-CoA (42). In theory then, IVD, and possibly other enzymes, including short/branched chain acyl-CoA dehydrogenase (SBCAD), could contribute to metabolization of C5-CoA when present in excess. Detailed study of substrate specificity of SCAD, MCAD, LCAD and other ACADs (e.g., SBCAD) using short and medium chain CoA esters to determine their kinetic parameters, in addition to C7 oxidation assays in MCAD, SCAD and IVD deficient cells would be informative in determining the contribution of these enzymes to the breakdown of C7.
Effect of triheptanoin on Acadm−/− mice liver pathology
H&E, Oil Red O, and PAS cell staining and acylcarnitine profiles from the Acadm−/− mice treated with triheptanoin provide compelling in vivo evidence for the efficacy of triheptanoin treatment of MCAD deficiency. The dose dependent reversal of hepatosteatosis and increase in glycogen stores in Acadm−/− mouse liver with concomitant increase in heptanoylcarnitine and the two catabolic conjugates of C7, valerylcarnitine and propionylcarnitine, are all demonstrate utilization of C7 as an anaplerotic and glycogen storage enhancing molecule. Tissue distribution and urine excretion remain to be investigated as part of evaluating the tolerance of C7 systemically to determine an optimum therapeutic dose.
Lysine succinylation in Acadm−/− mouse hepatocytes
The difference in antisuccinyllysine staining between wild type and Acadm−/− mice hepatocytes indicates severe depletion of succinyl-CoA, and hence other Krebs cycle intermediates are expected to be depleted as well. The depletion of succinyl-CoA was reversable in liver by triheptanoin treatment as observed, confirming the efficacy of the drug as anaplerotic.
In conclusion, this study has provided in vitro evidence of the utilization of MBCFAs by control and MCADD cells for energy. The results support the conclusion that the MBCFAs could in general provide effective anaplerotic therapy for rare diseases where such a therapeutic approach is needed. Since the MBCFAs tested provide two propionyl-CoA per molecule, a therapeutic propionyl-CoA level could be achieved by as low as half the therapeutic dose of C7 and thus may allow better tolerability clinically. This study also identifies triheptanoin (the triglyceride form of C7) as a potential therapy for MCADD. Such a treatment would be especially useful in MCADD infants and young children who are at the highest risk of developing hypoglycemia during times of physiologic stress. However, it may also be of use in adults experiencing various symptoms such as muscle pain or fatigue, those unable to rely on significant sugar intake during physiologic stress, and those at risk of developing fatty liver.
MATERIALS AND METHODS
Materials
Fatty acids, heptanoic acid (C7) and D,L-2,6-dimethylheptanoic acid (dMC7) were obtained from Matreya LLC, State College, PA; 6-Amino-2,4-dimethylheptanoic acid (AdMC7) from Sigma-Aldrich Co., St. Louis, MO; and 4,8-Dimethylnonanoic acid (dMC9) from Rieke Metals, Lincoln, NE. Butyryl-CoA (C4-CoA), heptanoyl-CoA (C7-CoA), octanoyl-CoA (C8-CoA), and palmitoyl-CoA(C16-CoA) were purchased from Sigma-Aldrich Co. Triheptanoin, commercially known as Dojolvi©, was obtained from Ultragenyx Pharmaceutical, Cambridge, MA. Recombinant pig ETF protein used in the enzyme assay was prepared as described previously (42). Recombinant human short chain acyl-CoA dehydrogenase (rhSCAD) had been purified to essential homogeneity using standard protocol as described previously (43).
Fibroblast cells sources
MCAD deficient fibroblast cell line Fb831 (lab designation) was obtained from Coriell Institute ID# GM13275. Fb786 and Fb787 (lab designations) were obtained de-identified from the Biochemical Genetics Lab, UPMC Children’s Hospital of Pittsburgh, PA. The three MCADD patient cells are homozygous for the ACADM 985A>G mutation (Lys304Glu, mature peptide numbering). Control fibroblast cell line, Fb826 (lab designation), was obtained from American Type Culture Collection, ID# PCS201012, Primary Dermal Fibroblast; Normal, Human, Adult (HDFa), Manassas, VA.
In Vitro study – Cell Culture and Treatments
1. Mitochondrial bioenergetics:
C7, dMC7, AdMC7, and dMC9 were surveyed in human control and MCAD deficient cell lines for utilization as anaplerotic molecules in real time using Agilent Seahorse XFe96 Analyzer (Agilent Technologies, Santa Clara, CA), which measures oxygen consumption rate (OCR) and extra cellular acidification rate (ECAR) a key indicator of mitochondrial respiration and glycolysis, respectively. In brief, the assay is performed in a XFe96 microplate using the Seahorse XF Cell Mito Stress Test kit that has 3 components (oligomycin, carbonyl cyanide-4 (trifluoromethoxy) phenylhydrazone (FCCP), rotenone + antimycin A (Rot/AA)) that are injected sequentially after measuring OCR for Basal Respiration (baseline energetic demand) and Basal ECAR (equated to glycolysis primarily a measure of lactate production (44)) during resting phase in the following order: 1- ATP-linked Respiration: the first injection of oligomycin an ATP synthase (complex V) inhibitor results in decrease in OCR representing ATP produced by mitochondria in response to energetic needs of the cells. ATP-linked OCR increase is indicative of increase in ATP demand, while a decrease is attributed to low ATP demand, a lack of substrate availability and/or severe damage to oxidative phosphorylation, which would impede the flow of electrons and result in a lower OCR. 2- Maximal Respiration and Spare Capacity: the second injection of FCCP an uncoupling agent results in disruption of the membrane potential due to proton gradient collapse and results in maximum consumption of oxygen by complex IV as there is no restriction of electron flow through the Electron Transport Chain (ETC). FCCP is said to mimic a physiological energy demand causing rapid oxidation of substrates like sugars, fats & amino acids. According to (Balu et al., 2014; Hill et al., 2012; Agilent seahorse cell Mito Stress test kit user guide, 2019) a lower maximal capacity means decreased substrate availability or that mitochondrial mass or integrity is compromised. Whereas a high FCCP-stimulated rate when compared to basal rate implies that the cell has a substantial mitochondrial reserve capacity also known as Spare Capacity, an indicator of cell fitness or flexibility and is said to be important for responding to acute insults. 3- Non-Mitochondrial respiration: the third injection is a mixture of Rotenone and Antimycin (Rot/AA) an inhibitor of complex I and complex III respectively, which shuts down the mitochondrial respiration (45, 46).
A live cell assay was performed in a poly-D-Lysine coated XFe96 microplate using a Seahorse XFe96 Analyzer. Patient and control fibroblasts at sub-confluence were harvested and seeded at a concentration of 25,000 cells/80 μl in each well (eight technical replicates were seeded) in regular culture medium, left to rest in a culture hood for 1 hour, and subsequently incubated overnight at 37°C in a 5% CO2 incubator. Following overnight incubation, the cells were further incubated for 72 hours after replacing the regular culture medium in designated wells with medium A (180 μl of DMEM with 4.5 g/L glucose supplemented with 10% lipid stripped fetal bovine serum (FBS) (Sigma-Aldrich Co.), and 100 IU penicillin and 100 μg/ml streptomycin), medium B (180 μl of DMEM medium devoid of glucose/pyruvate supplemented with 10% lipid stripped FBS and 100 IU penicillin and 100 μg/ml streptomycin), or medium C (180 μl of DMEM medium devoid of glucose/pyruvate supplemented with 10% lipid stripped FBS and 100 IU penicillin and 100 μg/ml streptomycin) and microliter amounts for various concentrations, 15, 30, 90, and 180 μM, of either C7, dMC7, AdMC7, and dMC9 acids were added directly to the buffered media. After 72 hours incubation the medium was replaced with 180 μl Seahorse XF DMEM medium, pH 7.4 supplemented with 10 mM glucose, 1 mM pyruvate, 2 mM L-glutamine in wells with medium A, or 180 μl Seahorse XF DMEM medium, pH 7.4 supplemented with 2 mM L-glutamine in wells with medium B and C.
According to the manufacturer’s protocol Seahorse XF Cell Mito Stress test kit (Agilent Technologies), the cells were incubated at 37°C in a non-CO2 incubator for 1 hour following which the OCR was measured at baseline, followed by sequential injection of oligomycin (1.5 μM), carbonyl cyanide 4-(trifluoromethoxy) phenylhydrazone (FCCP, 1 μM), and rotenone + antimycin A (Rot/AA, 0.5 μM). Finally, cells were lysed, and protein content was determined as described (47–50). Data was normalized to protein concentration and analyzed using the software tools WAVE and XF Cell Mito Stress Test report generator (Agilent Technologies).
2. Krebs cycle intermediates and amino acids:
Only fibroblast cells of MCAD deficient patient Fb831 and control Fb826 were selected for measurements of Krebs cycle intermediates. Cells were grown in T175 flasks (6 flasks per treatment) in regular culture medium consisting of DMEM, Corning Life Sciences, Manassas, VA, containing 4.5 g/L glucose and supplemented with 10% FBS, Gibco Life Technology (Grand Island, NY), and 100 IU penicillin and 100 μg/ml streptomycin, Corning Life Sciences (Manassas, VA). When the cultured cells were 85–90% confluent, exchange of medium and treatments were carried out as previously described (25). After 72 hours, cells were harvested by standard tissue culture method and cell pellets were frozen at −80°C. Cells were processed and extracts analyzed for Krebs cycle intermediates and amino acids at the Health Sciences Metabolomics and Lipidomics Core at the University of Pittsburgh, Pittsburgh, PA, following published methods (51, 52).
3. Enzyme activity measurement of Acyl-CoA dehydrogenases (ACADs)
Enzyme activity of ACADs was measured using the ETF fluorescence reduction assay as published previously with modifications (42, 53, 54). This assay is highly sensitive and specific for measuring enzyme activity of ACADs in patient tissues and in cultured cells and for determining purified ACADs kinetic parameters (42, 53, 54). Fibroblast control cells, Fb826 and MCAD deficient patient cells Fb831 were grown in T175 flasks and harvested at confluency and processed essentially as described (54, 55). All assays were carried out using 30 μM for C4-CoA, C7-CoA, C8-CoA, or C16-CoA as substrate.
In vivo study – Animals and Treatments
1. Animals and Diet:
The MCAD KO mice (B6;129P2-Acadmtm1Uab/Mmmh) were obtained from the NIH supported Mutant Mouse Resource and Research Centers (MMRRC) repository. The mice handling, housing, breeding, and experimental procedures were evaluated and approved by IACUC of University of Pittsburgh (Protocol # 19044708). Mouse pups were weaned between 3–4 weeks of age, then housed in microisolator cages in groups of 4 males and 5 females at ambient room temperature of 21°C, under 12 hours light and dark cycles. The animals were maintained on a regular diet (Picolab Rodent Diet 20,5053) until they were required to be acclimatized to a modified special diet associated to an experimental design. All animals had free access to water under all circumstances.
Male mice MCAD KO littermates between 7–8 weeks were divided into 4 experimental groups of 4 mice per group. They were acclimatized to a modified no fat/high sucrose diet, Teklad Custom Diet, TD.03314 (Envigo, Indianapolis, IN, USA), for 4 days before sterile PBS (0%) or triheptanoin 5.0%, 7.5% and 12.5% of diet (wt:wt) were administered by oral gavage for 7 days. The no fat/high sucrose diet was used to ensure the reliance of mice on the triheptanoin as the main fat source. The PBS and triheptanoin doses were administered twice daily 5 hours apart, providing half the calculated daily dose at each gavage. A fifth group of 4 wild type mice on the same background (B6;129P2 mice) were maintained on regular diet and oral gavage with PBS for the entire experimental period. To a variable degree, there was a change in the appearance (discolored or pale but still solid) and frequency of fecal secretions that followed the increase in the triheptanoin dose.
2. Blood and Tissue Sampling:
A mid-experimental blood sampling on day 4 was carried out by retro orbital bleeding using heparinized capillary tubes. The plasma was collected from the blood by centrifugation for 5 minutes at 13,000 g and stored at −80°C for plasma acylcarnitine analysis at the Metabolic Core, Rangos Research Center, UPMC Children’s Hospital of Pittsburgh, PA. On the 7th day of the triheptanoin treatment, mice were fasted for 21 hours and the experiment was terminated with the mice euthanized by CO2 asphyxiation following the IACUC guidelines and the liver tissue collected for histopathological analysis. During fasting the animal had free access to water. The dissected livers were immediately transferred to cryomolds, covered with Tissue-Tek OCT, and temporarily stored on dry ice until finally moved to −80°C for storage.
3. Histology:
A portion of the liver tissue from each animal was collected over dry ice in cryomolds, covered by Tissue-Tek OCT for lipid content analysis, the remaining tissue was 10% formalin/PBS fixed. The cryopreserved and formalin fixed tissue samples were submitted to the Histopathology Core, Department of Pediatrics, Rangos Research Center, UPMC Children’s Hospital of Pittsburgh, PA, for Oil Red O and H&E and PAS staining, respectively, according to manufacturer’s instructions.
Immunofluorescence staining for lysine succinylated proteins
1. Immunocytochemistry:
Control and patient fibroblasts were grown in (DMEM) containing 4.5 g/L glucose supplemented with 10% FBS (Sigma-Aldrich Co.), 100 IU penicillin and streptomycin. The cells were harvested following standard trypsinization protocol at sub-confluence and seeded on a coated glass coverslip at a seeding density of 3–5 ×10⁴ cells/500 μl/well in a 12 well plate in regular culture media and incubated overnight at 37 °C in a 5% CO2 incubator. Following overnight incubation, the cells were further incubated for 72 hours after replacing the regular culture media in designated wells as follows: (a) 1 ml of DMEM with 4.5 g/L glucose supplemented with 10% FBS and 100 IU penicillin and 100 μg/ml streptomycin (b) 1ml of Agilent Seahorse XF DMEM medium devoid of glucose supplemented with 10% lipid stripped FBS, Sigma-Aldrich Co., St. Louis, MO, and 100 IU penicillin and 100 μg/ml streptomycin (c) 1ml of Agilent Seahorse XF DMEM medium devoid of glucose supplemented with 10% lipid stripped FBS, Sigma-Aldrich Co., St. Louis, MO, and 100 IU penicillin and 100 μg/ml streptomycin and 90 μM of either C7, dMC7, AdMC7, and dMC9 acids. After 72h incubation the cells were fixed in 4% paraformaldehyde, permeabilized with 0.1% Triton X-100, and blocked in 10% donkey serum according to standard protocols followed by primary antibodies as follows: antisuccinyllysine, PTM Biolabs catalog #401 (Chicago, IL), at 1:50 dilution; anti-MTCO1, Abcam catalog# ab14705 (Waltham, MA) at 1:500 dilution and overnight incubation at 4 °C. The cells were then incubated with the secondary antibodies Alexa fluor 488 and 555 respectively at a dilution of 1:1000 for 1h at room temperature followed by counterstaining with DAPI for nuclei. The coverslips were then mounted and imaged on a Zeiss LSM 710 Confocal microscope (Dublin, CA) at 40x magnification.
2. Mouse Liver Tissues:
The formalin-fixed paraffin-embedded (FFPE) slides of 5 micron liver sections from wildtype and Acadm−/− mice (fed chow with and without C7G) were processed according to standard protocol. The slides were deparaffinized with xylene, rehydration with decreasing concentration of ethanol (100, 70, and 50%), heat induced antigen retrieval using 10 mM citrate buffer (pH 6.0), followed by 0.1% TritonX-100 permeabilization and blocking in 10% donkey serum. Following blocking the slides were incubated in the primary, secondary antibodies and counterstained with DAPI as mentioned under immunocytochemistry. Anti-fade fluorescence mounting media Permafluor (Thermofisher Scientific, Fremont, CA) was applied to each section and a coverslip was placed over it and sealed with clear nail polish and left to dry for 2 h before imaging. The slides were imaged on a Zeiss LSM 710 confocal microscope at 40x magnification.
Statistical analysis
Statistical analysis was performed with GraphPad Prism 7.04 (Windows) software (La Jolla, CA, www.graphpad.com). One-way analysis of variance (ANOVA) followed by Tukey multiple range test for comparisons between groups. Differences were considered significant when P <0.05. The corresponding P values are provided in the figure legends.
Supplementary Material
Acknowledgments
The authors acknowledge Lorna Cropcho at the clinical Biochemical Genetics Lab, UPMC Children’s Hospital of Pittsburgh, PA, for material support. The authors thank Drs. Stacy G. Wendell, Ph.D., and Steven Mullett, Ph.D., at the Health Sciences Metabolomics & Lipidomics Core at the University of Pittsburgh for providing their expertise. This project was performed in collaboration with Rangos Metabolic Core for Seahorse Analyzer and LC/MS/MS services and the Rangos Histology Core for Histological services at the Department of Pediatrics, University of Pittsburgh.
Funding
This study was partly funded by the Children’s Hospital of Pittsburgh Foundation, Pennsylvania, USA, and NIH R01DK78775 grant (JV). Triheptanoin was the kind gift of Ultragenyx Pharmaceutical.
Abbreviations:
- ACADs
acyl-CoA dehydrogenases
- IVD
isovaleryl-CoA dehydrogenase
- MBCFAs
medium branched chain fatty acids
- MCAD
medium chain acyl-CoA dehydrogenase
- LCAD
long chain acyl-CoA dehydrogenase
- SCAD
short chain acyl-CoA dehydrogenase
- C7
heptanoic acid
- dMC7
2,6-dimethylheptanoic acid
- AdMC7
6-amino-2,4-dimethylheptanoic acid
- dMC9
4,8-dimethylnonanoic acid
Footnotes
Compliance with Ethics Guidelines
Conflict of Interest:
Al-Walid Mohsen, the corresponding author, has a patent application, US 2021/0322357 A1, submitted to the US patent office pertaining compounds mentioned in this manuscript.
Anuradha Karunanidhi, Shakuntala Basu, Xue-Jun Zhao, Olivia D’Annibale, Clinton Van’t Land, Jerry Vockley, all have no conflict of interest.
Informed Consent:
This article does not contain any studies with human subjects performed by any of the authors. To obtain fibroblast cell samples, informed consent forms were signed by patients or patients’ legal representative for use in research. In addition, patients’ names were anonymized.
Animal Rights
This article describes studies with animal subjects, mice, performed following University of Pittsburgh IACUC regulations.
Publisher's Disclaimer: This is a PDF file of an unedited manuscript that has been accepted for publication. As a service to our customers we are providing this early version of the manuscript. The manuscript will undergo copyediting, typesetting, and review of the resulting proof before it is published in its final form. Please note that during the production process errors may be discovered which could affect the content, and all legal disclaimers that apply to the journal pertain.
Data Availability
Additional data are submitted as Supplementary Data section.
REFERENCES
- 1.Borges K, Kaul N, Germaine J, Kwan P, O’Brien TJ, Randomized trial of add-on triheptanoin vs medium chain triglycerides in adults with refractory epilepsy. Epilepsia Open 4, 153–163 (2019). [DOI] [PMC free article] [PubMed] [Google Scholar]
- 2.Calvert S, Barwick K, Par M, Ni Tan K, Borges K, A pilot study of add-on oral triheptanoin treatment for children with medically refractory epilepsy. Eur J Paediatr Neurol 22, 1074–1080 (2018). [DOI] [PubMed] [Google Scholar]
- 3.Gillingham MB, Heitner SB, Martin J, Rose S, Goldstein A, El-Gharbawy AH, Deward S, Lasarev MR, Pollaro J, DeLany JP, Burchill LJ, Goodpaster B, Shoemaker J, Matern D, Harding CO, Vockley J, Triheptanoin versus trioctanoin for long-chain fatty acid oxidation disorders: a double blinded, randomized controlled trial. J Inherit Metab Dis 40, 831–843 (2017). [DOI] [PMC free article] [PubMed] [Google Scholar]
- 4.Hainque E, Caillet S, Leroy S, Flamand-Roze C, Adanyeguh I, Charbonnier-Beaupel F, Retail M, Le Toullec B, Atencio M, Rivaud-Pechoux S, Brochard V, Habarou F, Ottolenghi C, Cormier F, Meneret A, Ruiz M, Doulazmi M, Roubergue A, Corvol JC, Vidailhet M, Mochel F, Roze E, A randomized, controlled, double-blind, crossover trial of triheptanoin in alternating hemiplegia of childhood. Orphanet J Rare Dis 12, 160 (2017). [DOI] [PMC free article] [PubMed] [Google Scholar]
- 5.Mahapatra S, Ananth A, Baugh N, Damian M, Enns GM, Triheptanoin: A rescue therapy for cardiogenic shock in carnitine-acylcarnitine translocase deficiency. JIMD Reports 39, 19–23 (2018). [DOI] [PMC free article] [PubMed] [Google Scholar]
- 6.McDonald T, Puchowicz M, Borges K, Impairments in oxidative glucose metabolism in epilepsy and metabolic treatments thereof. Front Cell Neurosci 12, 274 (2018). [DOI] [PMC free article] [PubMed] [Google Scholar]
- 7.Mochel F, Hainque E, Gras D, Adanyeguh IM, Caillet S, Heron B, Roubertie A, Kaphan E, Valabregue R, Rinaldi D, Vuillaumier S, Schiffmann R, Ottolenghi C, Hogrel JY, Servais L, Roze E, Triheptanoin dramatically reduces paroxysmal motor disorder in patients with GLUT1 deficiency. J Neurol Neurosurg Psychiatry 87, 550–553 (2016). [DOI] [PMC free article] [PubMed] [Google Scholar]
- 8.Ørngreen MC, Vissing J, Treatment Opportunities in Patients With Metabolic Myopathies. Curr Treat Options Neurol 19, 37 (2017). [DOI] [PubMed] [Google Scholar]
- 9.Roe CR, Brunengraber H, Anaplerotic treatment of long-chain fat oxidation disorders with triheptanoin: Review of 15 years Experience. Mol Genet Metab 116, 260–268 (2015). [DOI] [PMC free article] [PubMed] [Google Scholar]
- 10.Schiffmann R, Wallace ME, Rinaldi D, Ledoux I, Luton MP, Coleman S, Akman HO, Martin K, Hogrel JY, Blankenship D, Turner J, Mochel F, A double-blind, placebo-controlled trial of triheptanoin in adult polyglucosan body disease and open-label, long-term outcome. J Inherit Metab Dis 41, 877–883 (2018). [DOI] [PubMed] [Google Scholar]
- 11.Schwarzkopf TM, Koch K, Klein J, Reduced severity of ischemic stroke and improvement of mitochondrial function after dietary treatment with the anaplerotic substance triheptanoin. Neuroscience 300, 201–209 (2015). [DOI] [PubMed] [Google Scholar]
- 12.Shoffner JM, Concerning “Triheptanoin vs trioctanoin for long-chain fatty acid oxidation disorders: A double blinded, randomized controlled trial” by Gillingham et al et al. J Inherit Metab Dis 42, 394–395 (2019). [DOI] [PubMed] [Google Scholar]
- 13.Tan KN, Hood R, Warren K, Pepperall D, Carrasco-Pozo C, Manzanero S, Borges K, Spratt NJ, Heptanoate is neuroprotective in vitro but triheptanoin post-treatment did not protect against middle cerebral artery occlusion in rats. Neurosci Lett 683, 207–214 (2018). [DOI] [PubMed] [Google Scholar]
- 14.Tan KN, Simmons D, Carrasco-Pozo C, Borges K, Triheptanoin protects against status epilepticus-induced hippocampal mitochondrial dysfunctions, oxidative stress and neuronal degeneration. J Neurochem 144, 431–442 (2018). [DOI] [PubMed] [Google Scholar]
- 15.Vockley J, Burton B, Berry GT, Longo N, Phillips J, Sanchez-Valle A, Tanpaiboon P, Grunewald S, Murphy E, Humphrey R, Mayhew J, Bowden A, Zhang L, Cataldo J, Marsden DL, Kakkis E, UX007 for the treatment of long chain-fatty acid oxidation disorders: Safety and efficacy in children and adults following 24weeks of treatment. Mol Genet Metab 120, 370–377 (2017). [DOI] [PubMed] [Google Scholar]
- 16.Vockley J, Charrow J, Ganesh J, Eswara M, Diaz GA, McCracken E, Conway R, Enns GM, Starr J, Wang R, Abdenur JE, Sanchez-de-Toledo J, Marsden DL, Triheptanoin treatment in patients with pediatric cardiomyopathy associated with long chain-fatty acid oxidation disorders. Mol Genet Metab 119, 223–231 (2016). [DOI] [PMC free article] [PubMed] [Google Scholar]
- 17.Yamada K, Taketani T, Management and diagnosis of mitochondrial fatty acid oxidation disorders: focus on very-long-chain acyl-CoA dehydrogenase deficiency. J Hum Genet 64, 73–85 (2019). [DOI] [PubMed] [Google Scholar]
- 18.Vockley J, Burton B, Berry GT, Longo N, Phillips J, Sanchez-Valle A, Tanpaiboon P, Grunewald S, Murphy E, Bowden A, Chen W, Chen CY, Cataldo J, Marsden D, Kakkis E, Results from a 78-week, single-arm, open-label phase 2 study to evaluate UX007 in pediatric and adult patients with severe long-chain fatty acid oxidation disorders (LC-FAOD). J Inherit Metab Dis 42, 169–177 (2019). [DOI] [PMC free article] [PubMed] [Google Scholar]
- 19.Hainque E, Gras D, Meneret A, Atencio M, Luton MP, Barbier M, Doulazmi M, Habarou F, Ottolenghi C, Roze E, Mochel F, Long-term follow-up in an open-label trial of triheptanoin in GLUT1 deficiency syndrome: a sustained dramatic effect. J Neurol Neurosurg Psychiatry 90, 1291–1293 (2019). [DOI] [PMC free article] [PubMed] [Google Scholar]
- 20.McDonald T, Hodson MP, Bederman I, Puchowicz M, Borges K, Triheptanoin alters [U-(13)C6]-glucose incorporation into glycolytic intermediates and increases TCA cycling by normalizing the activities of pyruvate dehydrogenase and oxoglutarate dehydrogenase in a chronic epilepsy mouse model. J Cereb Blood Flow Metab 40, 678–691 (2020). [DOI] [PMC free article] [PubMed] [Google Scholar]
- 21.Sklirou E, Alodaib AN, Dobrowolski SF, Mohsen A-WA, Vockley J, Physiological Perspectives on the Use of Triheptanoin as Anaplerotic Therapy for Long Chain Fatty Acid Oxidation Disorders. Frontiers Genetics 11, (2021). [DOI] [PMC free article] [PubMed] [Google Scholar]
- 22.Roe CR, Sweetman L, Roe DS, David F, Brunengraber H, Treatment of cardiomyopathy and rhabdomyolysis in long-chain fat oxidation disorders using an anaplerotic odd-chain triglyceride. J Clin Invest 110, 259–269 (2002). [DOI] [PMC free article] [PubMed] [Google Scholar]
- 23.Shirley M, Correction to: Triheptanoin: First Approval. Drugs 80, 1873 (2020). [DOI] [PMC free article] [PubMed] [Google Scholar]
- 24.Vockley J, Marsden D, McCracken E, DeWard S, Barone A, Hsu K, Kakkis E, Long-term major clinical outcomes in patients with long chain fatty acid oxidation disorders before and after transition to triheptanoin treatment--A retrospective chart review. Mol Genet Metab 116, 53–60 (2015). [DOI] [PMC free article] [PubMed] [Google Scholar]
- 25.Karunanidhi A, Van’t Land C, Rajasundaram D, Grings M, Vockley J, Mohsen A-W, Medium branched chain fatty acids improve the profile of tricarboxylic acid cycle intermediates in mitochondrial fatty acid β-oxidation deficient cells: A comparative study. J Inherit Metab Dis 45, 541–556 (2022). [DOI] [PMC free article] [PubMed] [Google Scholar]
- 26.Kinman RP, Kasumov T, Jobbins KA, Thomas KR, Adams JE, Brunengraber LN, Kutz G, Brewer WU, Roe CR, Brunengraber H, Parenteral and enteral metabolism of anaplerotic triheptanoin in normal rats. Am J Physiol Endocrinol Metab 291, E860–866 (2006). [DOI] [PubMed] [Google Scholar]
- 27.Pollitt RJ, Manning NJ, Olpin SE, Young ID, Prenatal diagnosis of a defect in medium-chain fatty acid oxidation. J Inherit Metab Dis 17, 279–282 (1994). [DOI] [PubMed] [Google Scholar]
- 28.Grosse SD, Khoury MJ, Greene CL, Crider KS, Pollitt RJ, The epidemiology of medium chain acyl-CoA dehydrogenase deficiency: An update. Genetics Med 8, 205–212 (2006). [DOI] [PubMed] [Google Scholar]
- 29.Gregersen N, Kolvraa S, Rasmussen K, Mortensen PB, Divry P, David M, Hobolth N, General (medium-chain) acyl-CoA dehydrogenase deficiency (non-ketotic dicarboxylic aciduria): quantitative urinary excretion pattern of 23 biologically significant organic acids in three cases. Clin Chim Acta 132, 181–191 (1983). [DOI] [PubMed] [Google Scholar]
- 30.Rhead WJ, Amendt BA, Fritchman KS, Felts SJ, Dicarboxylic aciduria: Deficient [1–14C]octanoate oxidation and medium-chain acyl-CoA dehydrogenase in fibroblasts. Science 221, 73–75 (1983). [DOI] [PubMed] [Google Scholar]
- 31.Gregersen N, Kolvraa S, Medium chain acyl-CoA dehydrogenase deficiency: Apparent Km and Vmax values for fibroblast acyl-CoA dehydrogenase towards octanoyl CoA in patient and control cell lines. J Inherit Metab Dis 7 Suppl 2, 105–106 (1984). [DOI] [PubMed] [Google Scholar]
- 32.Grosse S, Screening for medium chain acyl-CoA dehydrogenase deficiency is being evaluated. BMJ 322, 1062 (2001). [PMC free article] [PubMed] [Google Scholar]
- 33.Pollitt RJ, Leonard JV, Prospective Surveillance Study of medium chain acyl-CoA dehydrogenase deficiency in the UK. Arch Dis Childh 79, 116–119 (1998). [DOI] [PMC free article] [PubMed] [Google Scholar]
- 34.Perper JA, Ahdab-Barmada M, Fatty liver, encephalopathy, and sudden unexpected death in early childhood due to medium-chain acyl-Coenzyme A dehydrogenase deficiency. Am J Forensic Med Pathol 13, 329–334 (1992). [DOI] [PubMed] [Google Scholar]
- 35.Mutze U, Nennstiel U, Odenwald B, Haase C, Ceglarek U, Janzen N, Garbade SF, Hoffmann GF, Kolker S, Haas D, Sudden neonatal death in individuals with medium-chain acyl-Coenzyme A dehydrogenase deficiency: Limit of newborn screening. Eur J Pediatr 181, 2415–2422 (2022). [DOI] [PMC free article] [PubMed] [Google Scholar]
- 36.Yusupov R, Finegold DN, Naylor EW, Sahai I, Waisbren S, Levy HL, Sudden death in medium chain acyl-Coenzyme A dehydrogenase deficiency (MCADD) despite newborn screening. Mol Genet Metab, 101, 33–39 (2010). [DOI] [PubMed] [Google Scholar]
- 37.Roe CR, Method of use of five and fifteen carbon fatty acids. World Intellectual Property Organization, PCT WO 2004/103307 A3, (2004). [Google Scholar]
- 38.Roe CR, Method of use of five and fifteen carbon fatty acids. U.S. Patent and Trade Office, Patent number US 8,399,515 B2 (2013).
- 39.Liang J, Han R, Zhou B, Metabolic Reprogramming: Strategy for ischemic stroke treatment by ischemic preconditioning. Biology (Basel) 10, 424–442 (2021). [DOI] [PMC free article] [PubMed] [Google Scholar]
- 40.Yoshida GJ, Metabolic reprogramming: the emerging concept and associated therapeutic strategies. J Exp Clin Cancer Res 34, 111 (2015). [DOI] [PMC free article] [PubMed] [Google Scholar]
- 41.Wu M, Neilson A, Swift AL, Moran R, Tamagnine J, Parslow D, Armistead S, Lemire K, Orrell J, Teich J, Chomicz S, Ferrick DA, Multiparameter metabolic analysis reveals a close link between attenuated mitochondrial bioenergetic function and enhanced glycolysis dependency in human tumor cells. Amer J Physiol - Cell Physiol 292, C125–136 (2007). [DOI] [PubMed] [Google Scholar]
- 42.Zhang Y, Mohsen AW, Kochersperger C, Solo K, Schmidt AV, Vockley J, Goetzman ES, An acyl-CoA dehydrogenase microplate activity assay using recombinant porcine electron transfer flavoprotein. Anal Biochem 581, 113332 (2019). [DOI] [PMC free article] [PubMed] [Google Scholar]
- 43.Battaile K, Mohsen A-W, Vockley J, Functional role of the active site glutamate-368 in rat short chain acyl-CoA dehydrogenase. Biochemistry 35, 15356–15363 (1996). [DOI] [PubMed] [Google Scholar]
- 44.Rose S, Frye RE, Slattery J, Wynne R, Tippett M, Pavliv O, Melnyk S, James SJ, Oxidative stress induces mitochondrial dysfunction in a subset of autism lymphoblastoid cell lines in a well-matched case control cohort. PLoS One 9, e85436 (2014). [DOI] [PMC free article] [PubMed] [Google Scholar]
- 45.Chacko BK, Kramer PA, Ravi S, Benavides GA, Mitchell T, Dranka BP, Ferrick D, Singal AK, Ballinger SW, Bailey SM, Hardy RW, Zhang J, Zhi D, Darley-Usmar VM, The Bioenergetic Health Index: A new concept in mitochondrial translational research. Clin Sci (Lond) 127, 367–373 (2014). [DOI] [PMC free article] [PubMed] [Google Scholar]
- 46.Hill BG, Benavides GA, Lancaster JR Jr., Ballinger S, Dell’Italia L, Jianhua Z, Darley-Usmar VM, Integration of cellular bioenergetics with mitochondrial quality control and autophagy. Biol Chem 393, 1485–1512 (2012). [DOI] [PMC free article] [PubMed] [Google Scholar]
- 47.Leipnitz G, Mohsen AW, Karunanidhi A, Seminotti B, Roginskaya VY, Markantone DM, Grings M, Mihalik SJ, Wipf P, Van Houten B, Vockley J, Evaluation of mitochondrial bioenergetics, dynamics, endoplasmic reticulum-mitochondria crosstalk, and reactive oxygen species in fibroblasts from patients with complex I deficiency. Sci Rep 8, 1165 (2018). [DOI] [PMC free article] [PubMed] [Google Scholar]
- 48.Grings M, Seminotti B, Karunanidhi A, Ghaloul-Gonzalez L, Mohsen AW, Wipf P, Palmfeldt J, Vockley J, Leipnitz G, ETHE1 and MOCS1 deficiencies: Disruption of mitochondrial bioenergetics, dynamics, redox homeostasis and endoplasmic reticulum-mitochondria crosstalk in patient fibroblasts. Sci Rep 9, 12651 (2019). [DOI] [PMC free article] [PubMed] [Google Scholar]
- 49.Seminotti B, Leipnitz G, Karunanidhi A, Kochersperger C, Roginskaya VY, Basu S, Wang Y, Wipf P, Van Houten B, Mohsen A-W, Vockley J, Mitochondrial energetics is impaired in very long-chain acyl-CoA dehydrogenase deficiency and can be rescued by treatment with mitochondria-targeted electron scavengers. Hum Mol Genet 28, 928–941 (2019). [DOI] [PMC free article] [PubMed] [Google Scholar]
- 50.Dobrowolski SF, Alodaib A, Karunanidhi A, Basu S, Holecko M, Lichter-Konecki U, Pappan KL, Vockley J, Clinical, biochemical, mitochondrial, and metabolomic aspects of methylmalonate semialdehyde dehydrogenase deficiency: Report of a fifth case. Mol Genet Metab 129, 272–277 (2020). [DOI] [PubMed] [Google Scholar]
- 51.Ebert RF, Amino acid analysis by HPLC: optimized conditions for chromatography of phenylthiocarbamyl derivatives. Anal Biochem 154, 431–435 (1986). [DOI] [PubMed] [Google Scholar]
- 52.Coulier L, Bas R, Jespersen S, Verheij E, van der Werf MJ, Hankemeier T, Simultaneous quantitative analysis of metabolites using ion-pair liquid chromatography-electrospray ionization mass spectrometry. Anal Chem 78, 6573–6582 (2006). [DOI] [PubMed] [Google Scholar]
- 53.Mohsen A-W, Vockley J, Kinetic and spectral properties of isovaleryl-CoA dehydrogenase and interaction with ligands. Biochimie 108, 108–119 (2015). [DOI] [PMC free article] [PubMed] [Google Scholar]
- 54.Vockley J, Mohsen A-W, Binzak B, Willard J, Fauq A, Mammalian branched-chain acyl-CoA dehydrogenases: molecular cloning and characterization of recombinant enzymes. Methods Enzymol 324, 241–258 (2000). [DOI] [PubMed] [Google Scholar]
- 55.Frerman FE, Goodman SI, Fluorometric assay of acyl-CoA dehydrogenases in normal and mutant human fibroblasts. Biochem Med 33, 38–44 (1985). [DOI] [PubMed] [Google Scholar]
- 56.Nguyen TV, Riggs C, Babovic-Vuksanovic D, Kim YS, Carpenter JF, Burghardt TP, Gregersen N, Vockley J, Purification and characterization of two polymorphic variants of short chain acyl-CoA dehydrogenase reveal reduction of catalytic activity and stability of the Gly185Ser enzyme. Biochemistry 41, 11126–11133 (2002). [DOI] [PubMed] [Google Scholar]
Associated Data
This section collects any data citations, data availability statements, or supplementary materials included in this article.
Supplementary Materials
Data Availability Statement
Additional data are submitted as Supplementary Data section.