



Abstract
Background and purpose
Loss of appetite contributes to weight loss and faster disease progression in amyotrophic lateral sclerosis (ALS). Impairment of appetite control in ALS may include altered production or action of orexigenic (i.e., ghrelin) and anorexigenic (i.e., liver‐expressed antimicrobial peptide 2 [LEAP2] and leptin) hormones. We aimed to determine if postprandial circulating ghrelin levels, LEAP2 levels, LEAP2:ghrelin molar ratio and leptin levels differ in ALS patients compared to non‐neurodegenerative disease controls, and whether they are associated with disease progression and body composition.
Methods
In this prospective natural history study, we assessed postprandial plasma levels of ghrelin, LEAP2 and leptin in patients with ALS (cases; n = 46) and controls (controls; n = 43). For cases, measures were compared to changes in body weight, body composition and clinical outcomes.
Results
Postprandial ghrelin level was decreased by 52% in cases compared to controls (p = 0.013). LEAP2:ghrelin molar ratio was increased by 249% (p = 0.009), suggesting greater ghrelin resistance. Patients with lower LEAP2:ghrelin tended to have better functional capacity at assessment, as inferred by the ALS Functional Rating Scale‐Revised (τ = −0.179, p = 0.086). Furthermore, ghrelin and LEAP2:ghrelin molar ratio correlated with diagnostic delay (ghrelin, τ = 0.223, p = 0.029; LEAP2:ghrelin, τ = −0.213, p = 0.037). Baseline ghrelin level, LEAP2 level, LEAP2:ghrelin ratio and leptin level were, however, not predictive of change in functional capacity during follow‐up. Also, patients with higher postprandial ghrelin levels (hazard ratio [HR] 1.375, p = 0.048), and lower LEAP2:ghelin ratios (HR 0.828, p = 0.051) had an increased risk of earlier death.
Conclusions
Reduced postprandial ghrelin levels, coupled with increased LEAP2:ghrelin molar ratios, suggests a loss of ghrelin action in patients with ALS. Given ghrelin's actions on appetite, metabolism and neuroprotection, reduced ghrelin and greater ghrelin resistance could contribute to impaired capacity to tolerate the physiological impact of disease. Comprehensive studies are needed to explain how ghrelin and LEAP2 contribute to body weight regulation and disease progression in ALS.
Keywords: amyotrophic lateral sclerosis, disease progression, functional decline, ghrelin, LEAP2, leptin
INTRODUCTION
Amyotrophic lateral sclerosis (ALS) is characterized by the loss of motor neurons in the cortex, brainstem and spinal cord, causing progressive muscle weakness, paralysis and death [1]. Faster disease progression is associated with dysregulated energy balance and weight loss [2]. Weight loss before or during disease, and/or throughout the disease course is associated with shorter survival [3, 4, 5, 6]. Moreover, faster fat mass loss is associated with faster disease progression [7] and earlier death [8]. By contrast, dietary intervention to prevent or slow weight loss in ALS is associated with longer survival in fast‐progressing patients [9]. Negative energy balance leading to loss of fat mass in ALS [10] results from dysphagia [11] and/or appetite loss [12]. Although appetite loss has multiple causes, it may relate to altered secretion/function of appetite regulating‐hormones [13] including ghrelin, liver‐expressed antimicrobial peptide‐2 (LEAP2) and leptin.
Ghrelin is best known for its orexigenic effects following binding and activation of the growth hormone secretagogue receptors (GHSRs) [14, 15, 16] (Figure 1). While levels of plasma ghrelin are dynamically affected by feeding status, rising preprandially and falling postprandially [17, 18], overall ghrelin levels are lower in obesity [19]. Treatment with ghrelin or ghrelin mimetics increases food intake, body weight and blood glucose [15, 20, 21], lowers energy expenditure, upregulates expression of fat storage‐promoting enzymes, and engages hedonic eating behaviours [20, 22, 23]. In contrast, neutralizing ghrelin or GHSR antagonism lowers body weight and/or food intake [24, 25, 26, 27]. LEAP2 acts as an endogenous GHSR antagonist and inverse agonist, blocking ghrelin action and decreasing constitutive GHSR activity [28, 29] (Figure 1). Accordingly, LEAP2 and/or LEAP2 analogues block ghrelin‐induced food intake [30, 31], leading to a reduction in food intake and body weight, and LEAP2 deletion augments ghrelin‐induced food intake [32]. Plasma LEAP2 levels change inversely to ghrelin under many conditions; LEAP2 levels decrease during fasting, increase in obesity, and increase postprandially [29, 32]. Importantly, high plasma LEAP2 levels, especially when coupled with a high plasma LEAP2:ghrelin molar ratio, are thought to be a key determinant of ghrelin resistance in which usual physiological and behavioural responses to ghrelin are blunted [29]. Recent evidence suggests that increases in LEAP2 levels may be more important than the suppression of ghrelin in promoting postprandial decreases in appetite [33].
FIGURE 1.

Peripherally produced and secreted ghrelin, liver‐expressed antimicrobial peptide‐2 (LEAP2) and leptin regulates appetite and body weight, acting within the hypothalamus to stimulate (ghrelin) or suppress (leptin) hunger. Binding to ghrelin's receptor (the growth hormone secretagogue receptor; GHSR), LEAP2 antagonizes the actions of ghrelin. LEPR, leptin receptor.
The anorexigenic actions of leptin are well‐established [34]. Leptin is produced by adipocytes and is found at higher levels in individuals with obesity [35]. In fasted and lean individuals, a fall in leptin results in increased appetite and hunger [36]. Leptin acts directly on neurons in the hypothalamic arcuate nucleus and elsewhere to suppress orexigenic signals while enhancing anorexigenic signals [34]. These actions oppose those of ghrelin; for instance, ghrelin acts on arcuate neurons to increase orexigenic signals whilst decreasing anorexigenic signals [34].
In this study, we aimed to determine if postprandial circulating ghrelin levels, LEAP2 levels, LEAP2:ghrelin molar ratio and leptin levels differ in ALS patients compared to non‐neurodegenerative disease controls. Within patients we assessed associations of ghrelin levels, LEAP2 levels, LEAP2:ghrelin molar ratio and leptin levels with body composition at baseline and during disease. We also investigated associations with disease severity and progression, and the prognostic value of baseline postprandial ghrelin level, LEAP2 level, LEAP2:ghrelin molar ratio and leptin level.
METHODS
Study design
This study was conducted between June 2015 and February 2022 as part of ongoing studies on metabolism in motor neuron disease (MND). Forty‐nine patients with MND were invited to participate. Three patients were excluded due to a final diagnosis other than ALS; thus, a total of 46 patients meeting the El Escorial criteria for probable or definite ALS were included and invited to return for follow‐up assessment of anthropometric and clinical measures. Assessments were completed at approximately 4‐month intervals (mean latency between assessments = 10.2 [7.0, 12.8] weeks). The median (1st quartile, 3rd quartile) duration of follow‐up was 28.4 (14.0, 60.1) weeks/patient. Forty‐three non‐neurodegenerative disease control participants were recruited as a convenience sample of partners, friends and family of patients with ALS. Study enrolment and participation is outlined in Figure 2. This study was approved by the Royal Brisbane and Women's Hospital (HREC/14/QRBW/495) and the University of Queensland (2015/HE000022) Human Research Ethics Committees. Participants provided written consent.
FIGURE 2.
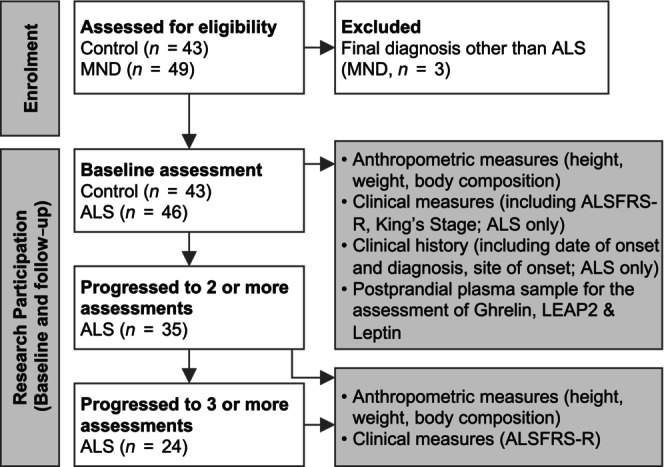
Patients were recruited from within ongoing studies on metabolism. Controls were recruited as a convenience sample of family and friends. ALS, amyotrophic lateral sclerosis; ALSFRS‐R, ALS Functional Rating Scale‐Revised; LEAP2, liver‐expressed antimicrobial peptide‐2; MND, motor neuron disease.
Clinical and anthropometric assessments
Participants fasted overnight for 12 h and avoided strenuous physical activity prior to assessment. Research visits commenced at 8:00 am, during which information on disease progression and measures of body composition were collected. Height was recorded using a stadiometer, and body weight, fat, and fat‐free mass were collected using the BODPOD Gold Standard system (COSMED) [37]. Body mass index (BMI) was calculated as an individual's body mass divided by the square of their height. Fat mass index (FMI) was calculated as fat mass divided by height squared. Clinical history was taken to ascertain disease duration and symptoms. A research nurse administered the ALS Functional Rating Scale‐Revised (ALSFRS‐R) on the morning of assessment. Total ALSFRS‐R scores were recorded, as well as combined limb (question [Q]4, Q5a/5b, Q8 and Q9), bulbar (Qs 1–3) and respiratory subscores (Qs 10–12). ΔFRS was calculated as the rate of decline in ALSFRS‐R points since disease onset and presented as the average points lost/month. Diagnostic delay was defined as the latency between symptom onset and diagnosis.
Assessment of postprandial venous ghrelin, LEAP2 and leptin levels
Following verbal confirmation of an overnight fast, patients consumed a liquid meal (SUSTAGEN® Ready to Drink Dutch Chocolate™) adjusted to 4.15 kJ/kg body weight. Venous blood was collected into a 10‐mL tube containing K2EDTA (BD Vacutainer®, #367525) 1 h after consumption of the meal. Blood was centrifuged at 3600g for 10 min, and plasma was snap‐frozen on dry ice and stored at −80°C for batch analysis. Samples were collected for assessment using a multiplex assay for simultaneous assessment of ghrelin and leptin levels, and so blood was not acidified at the time of collection. This may result in a reduction in measured ghrelin; however, we did not expect this to affect comparative assessments as all samples were collected in an identical manner. Baseline was defined as the day on which blood samples were collected.
Plasma ghrelin (the acylated form of ghrelin [38]) and leptin level were assessed using an enzyme‐linked immunosorbent assay (ELISA)‐based multiplex assay (Millipore, HMHEMAG‐34 K). Plasma was treated with a protease inhibitor cocktail immediately upon thawing (Calbiochem Set III, Merck #539134‐1ML, 1:100), dipeptidyl peptidase‐4 inhibitor (EMD Millipore #MPDPP4), aprotinin (Phoenix #PHRKAPRO) and AEBSF (Roche Pefabloc, Sigma‐Aldrich #111429868001). Plates were read using a Luminex® MAGPIX instrument. Plasma LEAP2 was assayed using a commercial ELISA kit (Phoenix Pharmaceuticals, #EK‐075‐40). The LEAP2:ghrelin molar ratio was determined by calculating the ratio of LEAP2 to ghrelin when both are expressed in mol/L.
Statistical analyses
Ghrelin, LEAP2 and leptin measures were natural log‐transformed; normality was assessed using Shapiro–Wilk tests. Continuous normally distributed data were compared between cases and controls using Student's t‐tests; Wilcoxon rank‐sum testing was employed for nonparametric data. Data are presented as mean (SD) and median (1st quartile, 3rd quartile). Chi‐squared testing compared proportional data, presented as amount (%). Within‐participant correlations utilized Kendall's τB. Longitudinal changes in body composition and disease status were assessed using linear mixed‐effects models in R (version 4.1.3). Estimated patient rates of change were compared to baseline hormone values or within patient groups. Survival probability was assessed using univariate Cox proportional hazard models. All statistical tests were performed using R (version 4.1.3). p values < 0.05 were taken to indicate statistical significance and 0.05 ≤ p < 0.1 to indicate a statistical trend.
RESULTS
Participant demographics and clinical features of patients with ALS are reported in Table 1. There was no difference in anthropometric measures (body weight, BMI, FMI, fat mass and fat‐free mass) in patients with ALS (cases) when compared to non‐neurodegenerative disease controls (controls). While cases were older than controls (59.2 ± 7.94 years vs. 54.2 ± 11.2 years; p = 0.019), age was not associated with other measures.
TABLE 1.
Baseline characteristics of patients with amyotrophic lateral sclerosis (cases) and controls at the time of collection of anthropometric, clinical and postprandial metabolic hormone measures.
| Controls (n = 43) | Cases (n = 46) | p | |
|---|---|---|---|
| Demographics | |||
| Age, years | 54.2 ± 11.2 | 59.2 ± 7.94 | 0.019 |
| Sex: female, n (%) | 23 (53.5) | 15 (32.6) | 0.076 |
| Body mass, kg | 78.1 [70.6;88.7] | 77.4 [70.4;86.1] | 0.712 |
| BMI, kg/m2 | 26.0 [23.7;29.4] | 26.2 [23.1;28.4] | 0.805 |
| FMI, kg/m2 | 7.84 [5.57;10.95] | 8.71 [6.32;11.77] | 0.496 |
| Fat mass, % | 31.9 ± 10.8 | 34.7 ± 12.6 | 0.252 |
| Fat mass, kg | 24.1 [17.9;31.8] | 26.2 [19.5;35.7] | 0.518 |
| Fat‐free mass, kg | 53.0 ± 10.1 | 50.7 ± 9.93 | 0.298 |
| Clinical characteristics | |||
| Site of onset: bulbar, n (%) | 11 (26.8) | ||
| ALSFRS‐R score | 37.0 ± 5.64 | ||
| Bulbar subscore | 11.0 [8.00;12.0] | ||
| Respiratory subscore | 12.0 [11.0;12.0] | ||
| Limb subscore | 11.0 [8.00;13.0] | ||
| ΔFRS | 0.57 [0.37;1.07] | ||
| Diagnostic delay, weeks | 41.1 [30.3;63.0] | ||
| Metabolic hormones | |||
| Ghrelin, pmol/L | 7.53 [3.29, 19.29] | 3.62 [2.29;6.71] | 0.013 |
| LEAP2, pmol/L | 2605 [2167;3378] | 2749 [2517;3787] | 0.074 |
| LEAP2:ghrelin molar ratio | 259 [133;864] | 903 [335;1420] | 0.009 |
| Leptin, pmol/L | 1850 [876;4365] | 2526 [1162;5159] | 0.255 |
Note: Data are mean ± standard deviation, where continuous and normally distributed, median [lower quartile; upper quartile] where continuous and non‐normally distributed, or n (%) where categorical. Factor variables were compared using chi‐squared tests with Yate's correction. Numerical variables were compared using two‐sided Student's t‐tests where data are normally distributed, or Wilcoxon rank‐sum where not. Bolded values are values that reached statistical significance.
Abbreviations: ALS, amyotrophic lateral sclerosis; ALSFRS‐R, ALS functional rating scale‐revised; BMI, body mass index; FMI, fat mass index; LEAP2, liver‐expressed antimicrobial peptide‐2; ΔFRS, decline in the ALSFRS‐R (points/month since date of symptom onset).
Baseline postprandial levels of ghrelin and LEAP2 are different in cases when compared to controls
Baseline postprandial ghrelin levels, LEAP2 levels, LEAP2:ghrelin molar ratio, and leptin levels in cases and controls are presented in Table 1. Ghrelin level was 52% lower, and LEAP2 was 6% higher in cases (p = 0.074). Consequently the mean LEAP2:ghrelin molar ratio was 249% higher in cases (p = 0.009). Postprandial leptin level was similar in cases and controls.
Associations of baseline ghrelin, LEAP2, LEAP2:ghrelin molar ratio and leptin level with anthropometric measures
Associations of baseline postprandial ghrelin, LEAP2, LEAP2:ghrelin molar ratio and leptin with baseline measures of body mass and composition are illustrated in Figure 3. Ghrelin was negatively correlated with body mass (τ = −0.226, p = 0.027) and BMI (τ = −0.314, p = 0.002) in cases, and with body mass (τ = −0.331, p = 0.002), BMI (τ = −0.236, p = 0.026) and fat mass (τ = −0.229, p = 0.030) in controls. Ghrelin was negatively correlated with LEAP2 in cases (τ = −0.311, p = 0.002) and controls (τ = −0.270, p = 0.010), and was weakly negatively correlated with leptin (τ = −0.226, p = 0.031) in cases only. LEAP2 was positively correlated with measures of fat mass (BMI, τ = 0.218, p = 0.032; FMI, τ = 0.268, p = 0.010; % fat mass, τ = 0.241, p = 0.020; and total fat mass, τ = 0.266, p = 0.010) in cases only. LEAP2 was positively correlated with leptin in cases (τ = 0.234, p = 0.025) but not in controls. LEAP2:ghrelin ratio was correlated with body mass (τ = 0.309, p = 0.003), BMI (τ = 0.236, p = 0.026), and total fat mass (τ = 0.212, p = 0.046) in controls, and with body mass (τ = 0.211, p = 0.039), BMI (τ = 0.322, p = 0.001), total fat mass (0.251, p = 0.015), and FMI (τ = 0.257, p = 0.013) in cases. Leptin was highly positively correlated with measures of fat mass in both cases (body mass, τ = 0.276, p = 0.008; BMI, τ = 0.495, p < 0.001; FMI, τ = 0.606, p < 0.001; % fat mass, τ = 0.561, p < 0.001; and total fat mass, τ = 0.555, p < 0.001) and controls (body mass, τ = 0.282, p = 0.007; BMI, τ = 0.480, p < 0.001; FMI, τ = 0.663, p < 0.001; % fat mass, τ = 0.686, p < 0.001; and total fat mass, τ = 0.606, p < 0.001).
FIGURE 3.

Correlation matrix illustrating associations between postprandial measures of ghrelin, leptin, liver‐expressed antimicrobial peptide‐2 (LEAP2) and LEAP2:ghrelin molar ratio, and measures of body composition in cases (grey shaded area) and controls (white area). Circles represent Kendall's t (where size and colour indicate the strength and direction of the correlation); only correlations with p values ≤ 0.05 are shown. BMI, body mass index; FMI, fat mass index.
Associations of baseline ghrelin, LEAP2, LEAP2:ghrelin molar ratio and leptin with baseline clinical measures of disease
Associations of baseline postprandial ghrelin, LEAP2, LEAP2:ghrelin molar ratio and leptin with clinical measures (ALSFRS‐R and ALSFRS‐R subscores, ΔFRS and diagnostic delay) obtained during the same visit as the blood draws are presented in Table 2. Ghrelin was positively correlated with diagnostic delay (τ = 0.223, p = 0.029); patients with a shorter delay in diagnosis had lower ghrelin levels. While not correlated to disease severity, as inferred by the ALSFRS‐R, we did observe a positive correlation between ghrelin and ALSFRS‐R limb subscore (τ = 0.201, p = 0.060) and a negative correlation with ALSFRS‐R bulbar subscore (τ = −0.213, p = 0.059). For LEAP2, negative correlations were observed with overall functional capacity (i.e., ALSFRS‐R; τ = −0.197, p = 0.058) and ALSFRS‐R limb subscores (τ = −0.314, p = 0.003). When considering the LEAP2:ghrelin molar ratio, negative correlations with ALSFRS‐R score (τ = −0.179, p = 0.086), limb subscore (τ = −0.296, p = 0.006) and diagnostic delay (τ = −0.213, p = 0.037) were observed. The LEAP2:ghrelin molar ratio increased alongside increases in bulbar subscores (τ = 0.202, p = 0.070). A negative correlation was observed between postprandial leptin and ALSFRS‐R (τ = −0.284, p = 0.008). This association was driven by a negative correlation between postprandial leptin and the ALSFRS‐R limb subscore (τ = −0.369, p < 0.001). A weak positive correlation was also observed between leptin and respiratory subscore (τ = 0.214, p = 0.083).
TABLE 2.
Correlations between postprandial metabolic hormone levels and clinical measures at baseline (top), and postprandial metabolic hormone levels and change in clinical and anthropometric measures during disease progression (bottom).
| Ghrelin | LEAP2 | LEAP2:ghrelin molar ratio | Leptin | |||||
|---|---|---|---|---|---|---|---|---|
| t | p | t | p | t | p | t | p | |
| At baseline | ||||||||
| ALSFRS‐R | 0.108 (−0.126, 0.334) | 0.301 | −0.197 (−0.417, 0.041) | 0.058 a | −0.179 (−0.388, 0.070) | 0.086 a | −0.284 (−0.482, ‐0.065) | 0.008 |
| Bulbar subscore | −0.213 (−0.463, 0.041) | 0.059 a | 0.071 (−0.130, 0.270) | 0.522 | 0.202 (−0.061, 0.452) | 0.07 a | 0.055 (−0.168, 0.274) | 0.632 |
| Respiratory subscore | −0.034 (−0.262, 0.198) | 0.776 | 0.151 (−0.057, 0.357) | 0.212 | 0.094 (−0.105, 0.288) | 0.436 | 0.214 (−0.035, 0.426) | 0.083 a |
| Limb subscore | 0.201 (−0.024, 0.416) | 0.060 a | −0.314 (−0.505, ‐0.091) | 0.003 | −0.296 (−0.505, ‐0.072) | 0.006 | −0.369 (−0.564, ‐0.142) | <0.001 |
| ΔFRS | 0.012 (−0.170, 0.214) | 0.910 | 0.059 (−1.667, 0.294) | 0.564 | 0.025 (−0.192, 0.239) | 0.806 | 0.158 (−0.084, 0.352) | 0.132 |
| Diagnostic delay | 0.223 (0.027, 0.409) | 0.029 | −0.092 (−0.294, 0.134) | 0.368 | −0.213 (−0.394, ‐0.023) | 0.037 | −0.005 (−0.254, 0.242) | 0.960 |
| During disease progression (longitudinal) | ||||||||
| Clinical measures | ||||||||
| ΔALSFRS‐R | −0.016 (−0.239, 0.202) | 0.872 | −0.027 (−0.204, 0.154) | 0.791 | 0.009 (−0.195, 0.228) | 0.932 | 0.038 (−0.191, 0.269) | 0.716 |
| ΔBulbar subscore | −0.105 (−0.352, 0.139) | 0.306 | 0.053 (−0.164, 0.252) | 0.602 | 0.122 (−0.121, 0.373) | 0.233 | 0.148 (−0.101, 0.392) | 0.160 |
| ΔRespiratory subscore | −0.071 (−0.297, 0.147) | 0.494 | 0.064 (−0.139, 0.258) | 0.539 | 0.086 (−0.120, 0.283) | 0.403 | 0.135 (−0.086, 0.328) | 0.204 |
| ΔLimb subscore | 0.007 (−0.204, 0.246) | 0.947 | −0.025 (−0.206, 0.164) | 0.806 | −0.022 (−0.220, 0.183) | 0.828 | 0.006 (−0.204, 0.233) | 0.951 |
| Anthropometric measures | ||||||||
| ΔBMI | −0.119 (−0.327, 0.094) | 0.250 | 0.155 (−0.027, 0.323) | 0.130 | 0.146 (−0.058, 0.340) | 0.156 | 0.129 (−0.080, 0.328) | 0.222 |
| ΔFMI, kg/m2 | −0.180 (−0.359, 0.002) | 0.083 a | 0.244 (0.084, 0.417) | 0.018 | 0.242 (0.063, 0.388) | 0.019 | 0.212 (0.018, 0.368) | 0.046 |
| ΔFat mass (%) | −0.170 (−0.345, 0.008) | 0.103 | 0.229 (0.057, 0.402) | 0.026 | 0.240 (0.067, 0.396) | 0.020 | 0.209 (0.018, 0.374) | 0.049 |
| ΔFat mass (kg) | −0.184 (−0.347, 0.006) | 0.077 a | 0.256 (0.081, 0.426) | 0.013 | 0.259 (0.091, 0.406) | 0.012 | 0.231 (0.057, 0.402) | 0.029 |
Note: For baseline correlations, data are presented as Kendall's tau‐b (95% confidence interval [CI]). For longitudinal outcomes, rate of change was calculated using linear mixed‐effects models with a random intercept and slope for time for each participant (package lme4 in R). This was compared to baseline hormone levels using Kendall's correlations; data are presented as Kendall's tau‐b (95% CI); CIs calculated using a bootstrapping approach (package NSM3 in R). Bolded values are values that reached statistical significance.
Abbreviations: ALS, amyotrophic lateral sclerosis; ALSFRS‐R, ALS functional rating scale‐revised; ΔFRS, decline in the ALSFRS‐R (points/month since date of symptom onset).
Statistical trend where 0.05 ≤ p < 0.1.
Baseline ghrelin, leptin, LEAP2 and LEAP2:ghrelin molar ratio levels as predictive measures of anthropometric and clinical and outcomes
Associations between baseline levels of postprandial ghrelin, LEAP2, LEAP2:ghrelin molar ratio, and leptin with the rate of change of anthropometric and clinical measures of functional decline (ALSFRS‐R and ALSFRS‐R subscores; Figure 4) are presented in Table 3. While BMI declined with disease progression (slope = −0.129 units/month; p < 0.001), % fat mass increased (slope = 0.194%/month; p = 0.016). Therefore, the change in BMI was primarily attributable to declines in fat‐free mass (data not presented; slope = −0.374 kg/month; p < 0.001), whereas absolute fat mass (and FMI) remained unchanged. On average, participants lost 0.910 points/month on the ALSFRS‐R (p < 0.001), of which 0.654 points/month were due to combined declines in limb (0.287 points/month; p < 0.001), bulbar (0.209 points/month; p < 0.001) and respiratory subscores (0.158 points/month; p < 0.001). Postprandial ghrelin (obtained at baseline) was not predictive of change in most anthropometric or clinical outcomes, however, we observed a negative correlation between ghrelin and change in total fat mass (τ = −0.184, p = 0.077) and FMI (τ = −0.180, p = 0.083). Baseline LEAP2 was predictive of change in FMI (τ = 0.244, p = 0.018), and total (τ = 0.256, p = 0.013) and % fat mass (τ = 0.228, p = 0.026) over the course of disease. Accordingly, we saw similar associations between starting LEAP2:ghrelin molar ratio and change in FMI (τ = 0.242, p = 0.019), and % (τ = 0.240, p = 0.012) and total fat mass (τ = 0.259, p = 0.012). Similarly, baseline leptin was predictive of change in FMI, and % and total fat mass during the course of disease (τ = 0.212, p = 0.046; τ = 0.209, p = 0.049; τ = 0.231, p = 0.029, respectively). None of these were predictive of functional decline.
FIGURE 4.

Longitudinal anthropometric (top line) and clinical (bottom line) outcomes in patients with amyotrophic lateral sclerosis. Significance determined using the likelihood‐ratio test. m = slope of regression. ALSFRS‐R, Amyotrophic Lateral Sclerosis Functional Rating Scale‐Revised; BMI, body mass index; FMI, fat mass index.
TABLE 3.
Hazard ratios of risk factors at baseline.
| HR (95% CI) | p | |
|---|---|---|
| Ln (Ghrelin) | 1.375 (1.002, 1.886) | 0.048 |
| Ln (LEAP2) | 0.576 (0.202, 1.648) | 0.304 |
| LEAP2:ghrelin molar ratio | 0.828 (0.685, 1.000) | 0.051 |
| Ln (Leptin) | 1.018 (0.745, 1.296) | 0.900 |
| BMI | 0.983 (0.918, 1.051) | 0.612 |
| FMI | 0.988 (0.925, 1.056) | 0.724 |
| Fat mass (kg) | 0.997 (0.976, 1.020) | 0.823 |
| Fat mass (%) | 0.996 (0.962, 1.023) | 0.770 |
| ΔFRS | 2.138 (1.182, 3.867) | 0.012 |
Note: Hazard ratios were extracted from univariate Cox proportional hazard models. Bolded values are values that reached statistical significance.
Abbreviations: BMI, body mass index; FMI, fat mass index; ΔFRS, decline in the ALSFRS‐R (points/month since date of symptom onset).
Survival outcomes relative to baseline postprandial levels of ghrelin, leptin, LEAP2 and LEAP2:ghrelin molar ratio
Thirty‐eight deaths were recorded during this study. The median survival since onset in this cohort of patients with ALS was 43.5 months. Univariate Cox proportional hazard modelling showed that ΔFRS was predictive of earlier death (Table 3); a doubling of risk for earlier death was observed for every 1 point lost on the ALSFRS‐R/month: hazard ratio (HR) 2.138 (p = 0.012). Increases in ghrelin were associated with increased risk of earlier death: HR for ln (ghrelin [pg/mL]) 1.375 (p = 0.048). Also, lower LEAP2:ghrelin molar ratio was associated with an increased risk of earlier death: HR 0.828 (p = 0.051). To investigate this further, we stratified patients based on quartile of ghrelin levels or LEAP2:ghrelin molar ratios, and considered survival using Kaplan–Meier plots (Figure 5). Although we observed an overall reduction in postprandial ghrelin in cases as compared to controls (Table 1), cases with higher postprandial ghrelin compared to those with lower levels of postprandial ghrelin had an increased risk of earlier death: HR 3.571 (p = 0.011). Median survival for cases with higher ghrelin levels was 16 months post assessment, and 30.5 months in those with lower ghrelin levels. Patients with greater risk of earlier death had lower body mass and BMI, and lower fat mass (Table 4).
FIGURE 5.

Survival probability for patients with amyotrophic lateral sclerosis relative to postprandial ghrelin levels and the liver‐expressed antimicrobial peptide‐2 (LEAP2) (LEAP2):ghrelin molar ratio. Crude Kaplan–Meier curves for participants stratified by (a) ghrelin and (b) LEAP2:ghrelin molar ratio, where ‘lower’ values represent the first quartile, ‘intermediate’ values are the combined second and third quartiles, and ‘higher’ values are the fourth quartile. + indicate censors.
TABLE 4.
Demographics, antropmetric and clinical characteristics of patients with amyotrophic lateral sclerosis based on postprandial levels of ghrelin, and LEAP2:ghrelin molar ratio, as indicated in Figure 5.
| High ghrelin (n = 11) | Medium ghrelin (n = 23) | Low ghrelin (n = 12) | p | High LEAP2:ghrelin ratio (n = 11) | Medium LEAP2:ghrelin ratio (n = 23) | Low LEAP2:ghrelin ratio (n = 12) | p | |
|---|---|---|---|---|---|---|---|---|
| Age, years | 60.3 (5.68) | 58.2 (8.82) | 60.1 (8.30) | 0.703 | 60.4 (8.91) | 57.7 (8.26) | 60.8 (6.35) | 0.477 |
| Sex: female, n (%) | 3 (27.3) | 9 (39.1) | 3 (25.0) | 0.711 | 4 (36.4) | 8 (34.8) | 3 (25.0) | 0.843 |
| Mass, kg | 70.2 [66.0;75.2] | 78.7 [71.9;90.7] | 83.1 [76.6;88.4] | 0.020 | 83.5 [75.3;89.3] | 77.5 [70.3;91.2] | 74.0 [68.5;77.7] | 0.098 a |
| BMI, kg/m2 | 22.2 [21.8;22.8] | 27.4 [24.4;29.4] | 27.4 [26.4;28.7] | <0.001 | 27.4 [26.0;28.6] | 27.2 [23.2;29.4] | 22.7 [22.0;25.4] | 0.013 a |
| FMI, kg/m2 | 6.25 [4.48;8.32] | 10.1 [7.99;11.4] | 9.66 [7.36;14.4] | 0.015 | 9.03 [7.87;10.9] | 10.3 [6.31;14.4] | 7.04 [5.05;8.93] | 0.092 a |
| Fat mass, % | 27.4 (10.6) | 37.4 (14.2) | 36.5 (7.74) | 0.076 a | 35.3 (8.05) | 37.2 (15.0) | 29.6 (9.41) | 0.234 |
| Fat mass, kg | 19.9 [14.6;24.0] | 31.7 [19.9;38.5] | 30.4 [24.5;35.7] | 0.020 | 27.6 [23.9;33.4] | 35.0 [17.8;38.5] | 21.2 [16.6;26.4] | 0.092 a |
| Fat‐free mass, kg | 51.2 (10.2) | 50.3 (11.3) | 51.1 (7.08) | 0.962 | 52.1 (7.90) | 50.0 (11.1) | 51.1 (9.59) | 0.846 |
| Ghrelin, pmol/L | 19.5 [9.51;28.3] | 3.90 [2.75;5.61] | 1.83 [1.77;2.09] | <0.001 | 1.83 [1.75;2.14] | 3.35 [2.57;5.52] | 18.7 [7.67;28.1] | <0.001 |
| LEAP2, pmol/L | 2639 [2369;2693] | 2790 [2544;3670] | 3841 [2677;4710] | 0.080 a | 4004 [3841;4920] | 2790 [2544;3567] | 2373 [1887;2642] | <0.001 |
| LEAP2:ghrelin molar ratio | 112 [95.1;285] | 875 [448;1112] | 2127 [1463;2644] | <0.001 | 2168 [1910;2664] | 931 [499;1106] | 129 [96.2;277] | <0.001 |
| Leptin, pmol/L | 1731 [1337;3925] | 6424 [3223;16,897] | 5516 [4266;10,191] | 0.007 | 7628 [4054;10,216] | 5572 [3035;16,897] | 3053 [1445;4924] | 0.060 a |
| ALSFRS‐R | 39.3 (5.26) | 37.1 (4.92) | 34.8 (6.81) | 0.170 | 34.9 (7.06) | 36.5 (4.89) | 39.9 (4.78) | 0.084 a |
| Bulbar subscore | 9.00 [6.50;12.0] | 10.0 [9.00;11.5] | 12.0 [9.00;12.0] | 0.269 | 12.0 [9.00;12.0] | 10.0 [9.00;12.0] | 9.00 [7.00;12.0] | 0.653 |
| Respiratory subscore | 12.0 [11.0;12.0] | 12.0 [11.5;12.0] | 12.0 [11.8;12.0] | 0.720 | 12.0 [12.0;12.0] | 12.0 [11.0;12.0] | 12.0 [11.0;12.0] | 0.599 |
| Limb subscore | 12.0 (3.46) | 10.2 (3.31) | 8.83 (3.35) | 0.100 | 9.00 (4.20) | 9.78 (3.15) | 12.4 (2.50) | 0.047 |
| ΔFRS | 0.75 [0.40;1.00] | 0.57 [0.33;0.95] | 0.51 [0.37;1.17] | 0.963 | 0.50 [0.37;1.08] | 0.57 [0.40;1.07] | 0.65 [0.33;0.96] | 0.965 |
Note: Data are mean ± standard deviation, where continuous and normally distributed, median [lower quartile; upper quartile] where continuous and non‐normally distributed, or n (%) where categorical. Factor variables were compared using chi‐squared tests with Yate's correction. Numerical variables were compared using two‐sided Student's t‐tests where data are normally distributed, or Wilcoxon rank‐sum where not. Bolded values are values that reached statistical significance.
Abbreviations: ALS, amyotrophic lateral sclerosis; ALSFRS‐R, ALS Functional Rating Scale‐Revised; BMI, body mass index; FMI, fat mass index; LEAP2, liver‐expressed antimicrobial peptide‐2; ΔBMI, change in BMI during follow‐up; ΔFMI, change in FMI during follow‐up, Δ fat mass, change in fat mass during follow‐up; ΔFRS, decline in the ALSFRS‐R (points/month since date of symptom onset).
Statistical trend where 0.05 ≤ p < 0.1.
DISCUSSION
Weight loss is an important prognostic factor in ALS [2] and may occur due to loss of appetite [12]. Impaired release and function of appetite‐regulating hormones is proposed to contribute to loss of appetite in ALS [13]. We show 52% lower postprandial levels of the orexigenic hormone ghrelin (p = 0.013), and a 249% higher plasma LEAP2:ghrelin molar ratio in patients with ALS (p = 0.009). Given the physiological actions of ghrelin in promoting body weight gain, decreases in ghrelin and/or greater ghrelin resistance due to increased LEAP2:ghrelin molar ratio [29, 32] might compromise the capacity of ghrelin to modulate energy balance in ALS.
We assessed circulating levels of ghrelin following a calorie‐controlled liquid meal and found lower postprandial ghrelin levels in ALS. This implies greater meal‐induced suppression of ghrelin release, a delay in recovery of ghrelin to preprandial levels, and/or lower pre‐meal ghrelin levels. This observation builds on earlier insights from prior reports on ghrelin levels in patients with ALS. The first showed decreased ghrelin in patients with ALS [39], however, did not account for the timing of blood collection relative to a meal; thus, it is not clear if fasting or postprandial states impacted results. The second found no change in fasting levels of ghrelin in cases, but noted decreased fasting ghrelin in male patients with ALS [40]. This study also reported a decrease in the proportion of ghrelin‐producing enteroendocrine cells of some patients with ALS. The emerging consensus is that the production and/or release of ghrelin is compromised in some patients with ALS, and that this may result in a delay or impaired postprandial recovery of ghrelin.
Adding to measures of ghrelin, we also found higher postprandial LEAP2 levels in patients, with the resulting higher LEAP2:ghrelin molar ratio suggesting greater ghrelin resistance. LEAP2 functions as an antagonist and inverse agonist of the ghrelin receptor [29], and the LEAP2:ghrelin molar ratio serves as an indicator of ghrelin's physiological capacity [29]. Considering the role of ghrelin in promoting positive energy balance, coupled with its neuroprotective [41, 42] properties, we anticipate that decreased ghrelin levels and greater ghrelin resistance would negatively impact ghrelin's capacity to regulate hunger and other physiological actions in ALS. This would contribute to weight loss, accelerated disease progression, and earlier death. This is relevant given speculation of ghrelin‐axis modulation as a potential treatment in ALS [14, 43, 44], and recent findings suggesting that increased LEAP2:ghrelin ratios may contribute to impaired neuronal function [45]. Results provide impetus for the conduct of studies aimed at improving understanding of ghrelin biology in ALS.
To explore the relationship between ghrelin, ghrelin resistance, and disease outcome, we examined postprandial ghrelin levels and LEAP2:ghrelin molar ratios relative to disease severity and survival. At baseline, a higher LEAP2:ghrelin molar ratio was generally associated with lower functional capacity, as inferred by lower total ALSFRS‐R scores. Baseline ghrelin and the LEAP2:ghrelin ratio were also correlated with diagnostic delay. A shorter diagnostic delay in ALS is associated with earlier death [46], and has been used to infer disease severity. Patients with a shorter delay between symptom onset and diagnosis had lower levels of ghrelin and an increase in LEAP2:ghrelin ratio, suggesting that reduced ghrelin action is associated with more aggressive disease. This is consistent with the anticipated neuroprotective effects of ghrelin. Despite this, higher baseline postprandial ghrelin levels and lower baseline ghrelin resistance (i.e., lower LEAP2:ghrelin molar ratio) were linked to increased risk of earlier death. Patients with greater risk of earlier death had lower body weight and fat mass, which implies greater risk of malnutrition. Therefore, apparent discordant observation between ghrelin action and risk of earlier death can be explained by the well‐established notion that poor nutritional status is associated with faster progression in ALS. We note that Nagaoka et al. previously found reduced risk of earlier death in some patients with higher fasting levels of ghrelin [40]. Differences in study outcomes are probably due to differences between ghrelin measures (i.e., fasting vs. postprandial), but also to differences in nutritional status of study participants. Nagaoka et al. considered patients with much lower BMIs (18.7 [16.9;21.2] vs. 26.2 [23.1;28.4]) and so explored associations between fasting ghrelin and survival in patients who were at a much greater risk of malnutrition. The finding that higher levels of baseline ghrelin and lower ghrelin resistance in the present study did not lead to increased fat mass and weight gain as the disease progressed was, however, unexpected, especially if those relative levels were to persist as the disease progressed.
Hypothalamic atrophy and dysfunction have been reported in ALS, and ghrelin acts via the hypothalamus to promote hunger. Combined with our findings of overall higher ghrelin resistance in ALS, we speculate that ghrelin might be unable to restore a positive energy balance in some patients. Consequently, the loss of ghrelin signalling, and increased LEAP2:ghrelin molar ratio reflective of higher malnutrition, coupled with the inability of ghrelin to act as a result of presumed progressive hypothalamic dysfunction could place these individuals at a higher risk of earlier death.
Leptin levels were comparable between cases and controls, were highly correlated with fat mass, and were predictive of change in fat mass. Thus, leptin may serve as a useful biomarker of adiposity in ALS. This is consistent with leptin's properties as an adipokine as it is released by adipocytes proportionally to adiposity. Moreover, results suggest that leptin production and release may not be disrupted, as was seen for ghrelin. However, given that levels of other appetite‐regulating hormones, including adiponectin and pancreatic polypeptide, are changed in ALS [39], we cannot assume ghrelin‐specific changes in ALS; further investigation through carefully controlled studies is needed to determine if other appetite‐regulating factors are compromised in ALS.
We note several limitations to this study. Due to the dynamic nature of appetite‐signalling hormones, serial measurements tracking changes in these hormones in response to a meal are needed to elucidate mechanisms of appetite dysregulation. Studies should also consider the actions of ghrelin O‐acyltransferase and levels of desacyl‐ghrelin to determine whether alterations in ghrelin biosynthesis, post‐translational modification or release contribute to the levels of ghrelin observed. Apparent contradictions between baseline correlations (where higher ghrelin levels and lower ghrelin resistance correlated with less severe disease) and survival (where higher ghrelin levels and lower ghrelin resistance correlated with earlier death) require further exploration. While associations with body weight and fatness might explain the greater risk of earlier death, it is not clear if or how endogenous ghrelin actions might contribute to improved functional capacity, acting through its non‐metabolic actions. To address this, studies should determine whether levels of ghrelin and LEAP2:ghrelin molar ratios change throughout disease progression, and whether this is associated with changes in functional capacity, disease progression, and survival. From a mechanistic perspective, this can be addressed through experimental modulation of ghrelin, or the LEAP2:ghrelin molar ratio, using models of ALS, to better understand the actions of LEAP2 and ghrelin in modulating functional capacity and disease outcome. Finally, while outcomes were the same in male and female participants, female participants tended to have greater fat mass, and as such, associations with ghrelin, LEAP2:ghrelin molar ratio, and leptin may be different between males and females. We note that differences between sexes are not unexpected, and that prior studies on fasting ghrelin found decreases in ghrelin in male and not female participants [40]. Given the small size of this cohort, we were unable to explore this.
Overall, these results suggest that altered levels of endocrine modulators of energy homeostasis could impact physiological responses to disease, and that this could, in turn, impact disease outcome. While our findings suggest that impaired ghrelin release/action might alter disease outcome, a more comprehensive exploration of the unique aspects and relationships between ghrelin signalling, energy balance and prognosis in ALS is needed.
AUTHOR CONTRIBUTIONS
Stephanie L. Howe: Conceptualization; writing—original draft; methodology; investigation; writing—review and editing; formal analysis. Cory J. Holdom: Data curation; formal analysis; writing—review and editing. Pamela A. McCombe: Conceptualization; investigation. Robert D. Henderson: Investigation; writing—review and editing; data curation. Jeffrey M. Zigman: Conceptualization; writing—original draft; writing—review and editing; supervision. Shyuan T. Ngo: Conceptualization; writing—original draft; investigation; supervision; writing—review and editing; funding acquisition; resources. Frederik J. Steyn: Conceptualization; data curation; formal analysis; visualization; writing—original draft; methodology; investigation; supervision; project administration; writing—review and editing; funding acquisition; resources.
FUNDING INFORMATION
This research was supported through funding from the Royal Brisbane and Women's Hospital Foundation. Shyuan T. Ngo is supported by a FightMND Mid‐career Fellowship and the Australian Institute for Bioengineering and Nanotechnology at the University of Queensland. Research was supported with funding from MND Research Australia to Frederik J. Steyn and Shyuan T. Ngo. Jeffrey M. Zigman is supported by the National Institutes of Health (2R01DK103884).
CONFLICT OF INTEREST STATEMENT
Frederik J. Steyn and Shyuan T. Ngo receive funding from Aeterna Zentaris GmbH. Frederik J. Steyn and Shyuan T. Ngo has consulted for Cytokinetics Inc. Jeffrey M. Zigman has consulted for Helsinn Healthcare S.A. and Dexcel Pharma Technologies Ltd and receives research funding from Novo Nordisk. The authors alone are responsible for the content and writing of this article.
ACKNOWLEDGEMENTS
The authors thank all the people living with ALS and control participants included in this study. The LEAP2 ELISA was performed by Dr Raji Baidya. Open access publishing facilitated by The University of Queensland, as part of the Wiley ‐ The University of Queensland agreement via the Council of Australian University Librarians.
Howe SL, Holdom CJ, McCombe PA, et al. Associations of postprandial ghrelin, liver‐expressed antimicrobial peptide 2 and leptin levels with body composition, disease progression and survival in patients with amyotrophic lateral sclerosis. Eur J Neurol. 2024;31:e16052. doi: 10.1111/ene.16052
DATA AVAILABILITY STATEMENT
The data that support the findings of this study are available from the corresponding author upon reasonable request.
REFERENCES
- 1. Chio A, Logroscino G, Hardiman O, et al. Prognostic factors in ALS: a critical review. Amyotroph Lateral Scler. 2009;10(5–6):310‐323. [DOI] [PMC free article] [PubMed] [Google Scholar]
- 2. Ngo ST, Steyn FJ, McCombe PA. Body mass index and dietary intervention: implications for prognosis of amyotrophic lateral sclerosis. J Neurol Sci. 2014;340(1–2):5‐12. [DOI] [PubMed] [Google Scholar]
- 3. Shimizu T, Nagaoka U, Nakayama Y, et al. Reduction rate of body mass index predicts prognosis for survival in amyotrophic lateral sclerosis: a multicenter study in Japan. Amyotroph Lateral Scler. 2012;13(4):363‐366. [DOI] [PubMed] [Google Scholar]
- 4. O'Reilly EJ, Wang H, Weisskopf MG, et al. Premorbid body mass index and risk of amyotrophic lateral sclerosis. Amyotroph Lateral Scler Frontotemporal Degener. 2013;14(3):205‐211. [DOI] [PMC free article] [PubMed] [Google Scholar]
- 5. O'Reilly EJ, Wang M, Adami HO, et al. Prediagnostic body size and risk of amyotrophic lateral sclerosis death in 10 studies. Amyotroph Lateral Scler Frontotemporal Degener. 2018;19(5–6):396‐406. [DOI] [PMC free article] [PubMed] [Google Scholar]
- 6. Janse van Mantgem MR, van Eijk RPA, van der Burgh HK, et al. Prognostic value of weight loss in patients with amyotrophic lateral sclerosis: a population‐based study. J Neurol Neurosurg Psychiatry. 2020;91(8):867‐875. [DOI] [PubMed] [Google Scholar]
- 7. Lee I, Kazamel M, McPherson T, et al. Fat mass loss correlates with faster disease progression in amyotrophic lateral sclerosis patients: exploring the utility of dual‐energy x‐ray absorptiometry in a prospective study. PloS One. 2021;16(5):e0251087. [DOI] [PMC free article] [PubMed] [Google Scholar]
- 8. Park JW, Kim M, Baek SH, Sung JH, Yu JG, Kim BJ. Body fat percentage and availability of Oral food intake: prognostic factors and implications for nutrition in amyotrophic lateral sclerosis. Nutrients. 2021;13(11):3704. [DOI] [PMC free article] [PubMed] [Google Scholar]
- 9. Ludolph AC, Dorst J, Dreyhaupt J, et al. Effect of high‐caloric nutrition on survival in amyotrophic lateral sclerosis. Ann Neurol. 2020;87(2):206‐216. [DOI] [PubMed] [Google Scholar]
- 10. Ngo ST, van Eijk RPA, Chachay V, et al. Loss of appetite is associated with a loss of weight and fat mass in patients with amyotrophic lateral sclerosis. Amyotroph Lateral Scler Frontotemporal Degener. 2019;20(7–8):497‐505. [DOI] [PubMed] [Google Scholar]
- 11. Moglia C, Calvo A, Grassano M, et al. Early weight loss in amyotrophic lateral sclerosis: outcome relevance and clinical correlates in a population‐based cohort. J Neurol Neurosurg Psychiatry. 2019;90(6):666‐673. [DOI] [PubMed] [Google Scholar]
- 12. Mezoian T, Belt E, Garry J, et al. Loss of appetite in amyotrophic lateral sclerosis is associated with weight loss and decreased calorie consumption independent of dysphagia. Muscle Nerve. 2020;61(2):230‐234. [DOI] [PubMed] [Google Scholar]
- 13. Ngo ST, Mi JD, Henderson RD, McCombe PA, Steyn FJ. Exploring targets and therapies for amyotrophic lateral sclerosis: current insights into dietary interventions. Degener Neurol Neuromuscul Dis. 2017;7:95‐108. [DOI] [PMC free article] [PubMed] [Google Scholar]
- 14. Ngo ST, Wang H, Henderson RD, Bowers C, Steyn FJ. Ghrelin as a treatment for amyotrophic lateral sclerosis. J Neuroendocrinol. 2021;33(7):e12938. [DOI] [PubMed] [Google Scholar]
- 15. Mani BK, Zigman JM. Ghrelin as a survival hormone. Trends Endocrinol Metab. 2017;28(12):843‐854. [DOI] [PMC free article] [PubMed] [Google Scholar]
- 16. Gupta D, Ogden SB, Shankar K, Varshney S, Zigman JM. A LEAP 2 conclusions? Targeting the ghrelin system to treat obesity and diabetes. Mol Metab. 2021;46:101128. [DOI] [PMC free article] [PubMed] [Google Scholar]
- 17. Cummings DE, Purnell JQ, Frayo RS, Schmidova K, Wisse BE, Weigle DS. A preprandial rise in plasma ghrelin levels suggests a role in meal initiation in humans. Diabetes. 2001;50(8):1714‐1719. [DOI] [PubMed] [Google Scholar]
- 18. Liu J, Prudom CE, Nass R, et al. Novel ghrelin assays provide evidence for independent regulation of ghrelin acylation and secretion in healthy young men. J Clin Endocrinol Metab. 2008;93(5):1980‐1987. [DOI] [PMC free article] [PubMed] [Google Scholar]
- 19. Wang Y, Wu Q, Zhou Q, et al. Circulating acyl and des‐acyl ghrelin levels in obese adults: a systematic review and meta‐analysis. Sci Rep. 2022;12(1):2679. [DOI] [PMC free article] [PubMed] [Google Scholar]
- 20. Muller TD, Nogueiras R, Andermann ML, et al. Ghrelin. Mol Metab. 2015;4(6):437‐460. [DOI] [PMC free article] [PubMed] [Google Scholar]
- 21. Tschop M, Smiley DL, Heiman ML. Ghrelin induces adiposity in rodents. Nature. 2000;407(6806):908‐913. [DOI] [PubMed] [Google Scholar]
- 22. Asakawa A, Inui A, Kaga T, et al. Ghrelin is an appetite‐stimulatory signal from stomach with structural resemblance to motilin. Gastroenterology. 2001;120(2):337‐345. [DOI] [PubMed] [Google Scholar]
- 23. Theander‐Carrillo C, Wiedmer P, Cettour‐Rose P, et al. Ghrelin action in the brain controls adipocyte metabolism. J Clin Invest. 2006;116(7):1983‐1993. [DOI] [PMC free article] [PubMed] [Google Scholar]
- 24. Barnett BP, Hwang Y, Taylor MS, et al. Glucose and weight control in mice with a designed ghrelin O‐acyltransferase inhibitor. Science. 2010;330(6011):1689‐1692. [DOI] [PMC free article] [PubMed] [Google Scholar]
- 25. Esler WP, Rudolph J, Claus TH, et al. Small‐molecule ghrelin receptor antagonists improve glucose tolerance, suppress appetite, and promote weight loss. Endocrinology. 2007;148(11):5175‐5185. [DOI] [PubMed] [Google Scholar]
- 26. Shearman LP, Wang SP, Helmling S, et al. Ghrelin neutralization by a ribonucleic acid‐SPM ameliorates obesity in diet‐induced obese mice. Endocrinology. 2006;147(3):1517‐1526. [DOI] [PubMed] [Google Scholar]
- 27. Zorrilla EP, Iwasaki S, Moss JA, et al. Vaccination against weight gain. Proc Natl Acad Sci U S A. 2006;103(35):13226‐13231. [DOI] [PMC free article] [PubMed] [Google Scholar]
- 28. Ge X, Yang H, Bednarek MA, et al. LEAP2 is an endogenous antagonist of the ghrelin receptor. Cell Metab. 2017;27:461‐469.e6. doi: 10.1016/j.cmet.2017.10.016 [DOI] [PubMed] [Google Scholar]
- 29. Mani BK, Puzziferri N, He Z, et al. LEAP2 changes with body mass and food intake in humans and mice. J Clin Invest. 2019;129(9):3909‐3923. [DOI] [PMC free article] [PubMed] [Google Scholar]
- 30. Islam MN, Mita Y, Maruyama K, et al. Liver‐expressed antimicrobial peptide 2 antagonizes the effect of ghrelin in rodents. J Endocrinol. 2020;244(1):13‐23. [DOI] [PMC free article] [PubMed] [Google Scholar]
- 31. Cornejo MP, Castrogiovanni D, Schioth HB, et al. Growth hormone secretagogue receptor signalling affects high‐fat intake independently of plasma levels of ghrelin and LEAP2, in a 4‐day binge eating model. J Neuroendocrinol. 2019;31(10):e12785. [DOI] [PubMed] [Google Scholar]
- 32. Shankar K, Metzger NP, Singh O, et al. LEAP2 deletion in mice enhances ghrelin's actions as an orexigen and growth hormone secretagogue. Mol Metab. 2021;53:101327. [DOI] [PMC free article] [PubMed] [Google Scholar]
- 33. Bhargava R, Luur S, Rodriguez Flores M, Emini M, Prechtl CG, Goldstone AP. Post‐prandial increases in liver‐gut hormone LEAP2 correlate with attenuated eating behaviour in adults without obesity. Journal of the endocrine. Society. 2023;7:bvad061. [DOI] [PMC free article] [PubMed] [Google Scholar]
- 34. Klok MD, Jakobsdottir S, Drent ML. The role of leptin and ghrelin in the regulation of food intake and body weight in humans: a review. Obes Rev. 2007;8(1):21‐34. [DOI] [PubMed] [Google Scholar]
- 35. Myers MG, Cowley MA, Munzberg H. Mechanisms of leptin action and leptin resistance. Annu Rev Physiol. 2008;70:537‐556. [DOI] [PubMed] [Google Scholar]
- 36. Ahima RS, Saper CB, Flier JS, Elmquist JK. Leptin regulation of neuroendocrine systems. Front Neuroendocrinol. 2000;21(3):263‐307. [DOI] [PubMed] [Google Scholar]
- 37. Steyn FJ, Ioannides ZA, van Eijk RPA, et al. Hypermetabolism in ALS is associated with greater functional decline and shorter survival. J Neurol Neurosurg Psychiatry. 2018;89(10):1016‐1023. [DOI] [PMC free article] [PubMed] [Google Scholar]
- 38. Perelló M, Dickson SL, Zigman JM, Leggio L, Ghrelin Nomenclature Consensus Group . Toward a consensus nomenclature for ghrelin, its non‐acylated form, liver expressed antimicrobial peptide 2 and growth hormone secretagogue receptor. J Neuroendocrinol. 2023;35(1):e13224. [DOI] [PMC free article] [PubMed] [Google Scholar]
- 39. Ngo ST, Steyn FJ, Huang L, et al. Altered expression of metabolic proteins and adipokines in patients with amyotrophic lateral sclerosis. J Neurol Sci. 2015;357(1–2):22‐27. [DOI] [PubMed] [Google Scholar]
- 40. Nagaoka U, Shimizu T, Uchihara T, Komori T, Hosoda H, Takahashi K. Decreased plasma ghrelin in male ALS patients is associated with poor prognosis. Neurosci Res. 2022;177:111‐117. [DOI] [PubMed] [Google Scholar]
- 41. Lee S, Kim Y, Li E, Park S. Ghrelin protects spinal cord motoneurons against chronic glutamate excitotoxicity by inhibiting microglial activation. Korean J Physiol Pharmacol. 2012;16(1):43‐48. [DOI] [PMC free article] [PubMed] [Google Scholar]
- 42. Lim E, Lee S, Li E, Kim Y, Park S. Ghrelin protects spinal cord motoneurons against chronic glutamate‐induced excitotoxicity via ERK1/2 and phosphatidylinositol‐3‐kinase/Akt/glycogen synthase kinase‐3beta pathways. Exp Neurol. 2011;230(1):114‐122. [DOI] [PubMed] [Google Scholar]
- 43. Matsuo T, Murayama N, Ogino R, et al. Ghrelin attenuates disease progression in a mouse model of amyotrophic lateral sclerosis. Poster, presented at International Symposium on Amyotrophic Lateral Sclerosis and Motor Neurone Disease 2013.
- 44. Meanti R, Licata M, Rizzi L, et al. Protective effects of Hexarelin and JMV2894 in a human neuroblastoma cell line expressing the SOD1‐G93A mutated protein. Int J Mol Sci. 2023;24(2):993. [DOI] [PMC free article] [PubMed] [Google Scholar]
- 45. Tian J, Guo L, Wang T, et al. Liver‐expressed antimicrobial peptide 2 elevation contributes to age‐associated cognitive decline. JCI Insight. 2023;8(10):e166175. [DOI] [PMC free article] [PubMed] [Google Scholar]
- 46. Wolf J, Safer A, Wohrle JC, et al. Factors predicting one‐year mortality in amyotrophic lateral sclerosis patients – data from a population‐based registry. BMC Neurol. 2014;14:197. [DOI] [PMC free article] [PubMed] [Google Scholar]
Associated Data
This section collects any data citations, data availability statements, or supplementary materials included in this article.
Data Availability Statement
The data that support the findings of this study are available from the corresponding author upon reasonable request.