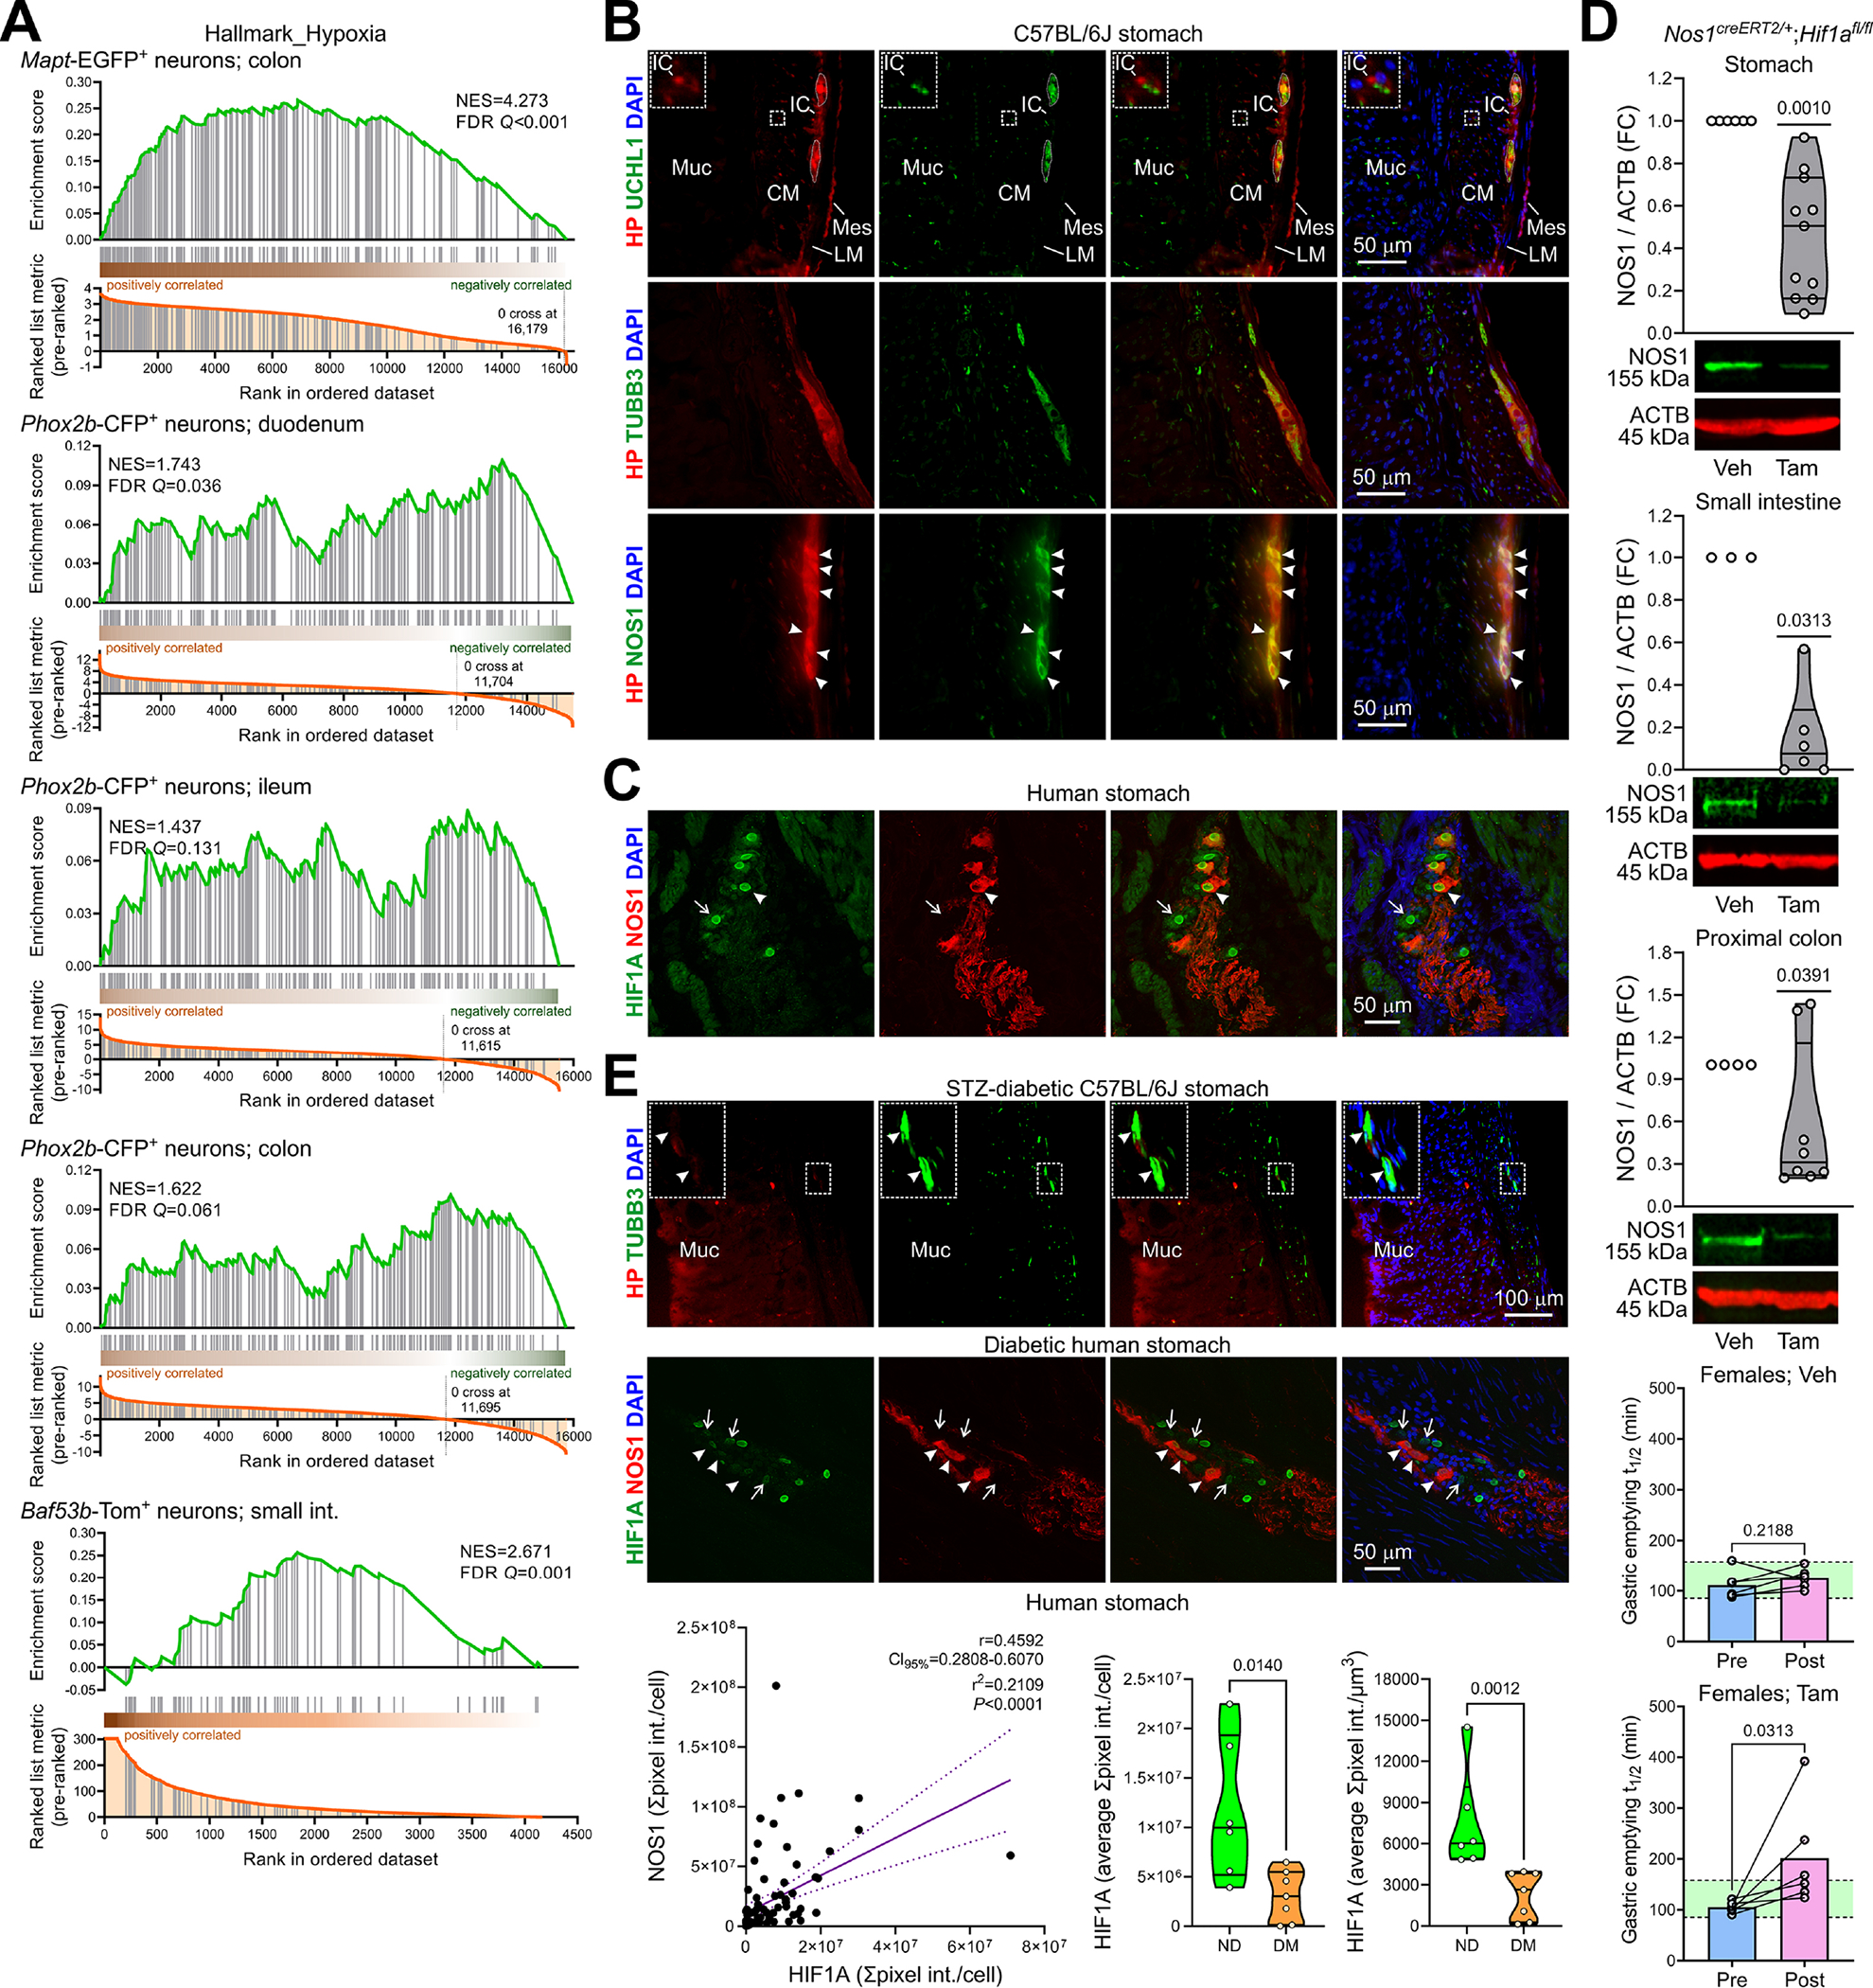
Figure 1. HIF1A from intracellular hypoxia is required for normal NOS1 levels in enteric neurons and for normal gastric emptying in female mice and is reduced in diabetes.

(A) Pre-ranked GSEA of hypoxia-related genes in enteric neurons. (B) Wide-field images of cryosections from nondiabetic mouse stomachs (n=2) showing Hypoxyprobe™ (HP)+ cells. UCHL1, TUBB3, NOS1: neuronal markers. DAPI, 4’,6-diamidino-2-phenylindole. IC, interstitial cells; Muc, mucosa; CM, circular muscle; LM, longitudinal muscle; Mes, mesothelial cells. Inset: enlargement of the outlined area showing a hypoxic IC adjacent to a nerve fiber. Dotted lines: enteric ganglia. Arrowheads: hypoxic NOS1+ neurons. (C) Confocal images of cryosections from 4 nondiabetic patients showing predominantly nuclear HIF1A (antibody: Thermo Fisher 700505) in NOS1+ (arrowhead) and NOS1− (arrow) neurons. (D) Top panels: Reduction of NOS1 by genomic deletion of Hif1a in tamoxifen (Tam) vs. vehicle (Veh)-treated Nos1creERT2/+;Hif1afl/fl mice (nVeh=6, 3, 4; nTam=11, 6, 8). P, Wilcoxon signed rank tests. Bottom panels: Increase in GE t1/2 by genomic deletion of Hif1a in female mice (n=6/group). Green area: strain- and sex-specific normal range. P, ratio-paired t tests. (E) Top: Wide-field images of cryosections from 2 STZ-diabetic mouse stomachs. Note reduced HP in TUBB3+ enteric neurons (outlined area enlarged in the inset) and preserved HP in the luminal epithelium. Middle: Confocal images of cryosections from 4 diabetic patients showing reduced HIF1A (Thermo Fisher 700505) in NOS1+ (arrowhead) and NOS1− (arrow) neurons. Bottom left: Direct linear relationship between HIF1A and NOS1 immunofluorescence in nitrergic neurons of 6 nondiabetic (n=37) and 7 diabetic patients (n=55). CI95%, 95% confidence interval. P is from linear regression and Pearson correlation. Right: HIF1A immunofluorescence/cell and immunofluorescence concentration were reduced in nitrergic neurons of the diabetic (DM) vs. nondiabetic (ND) patients. P, Mann-Whitney tests.
