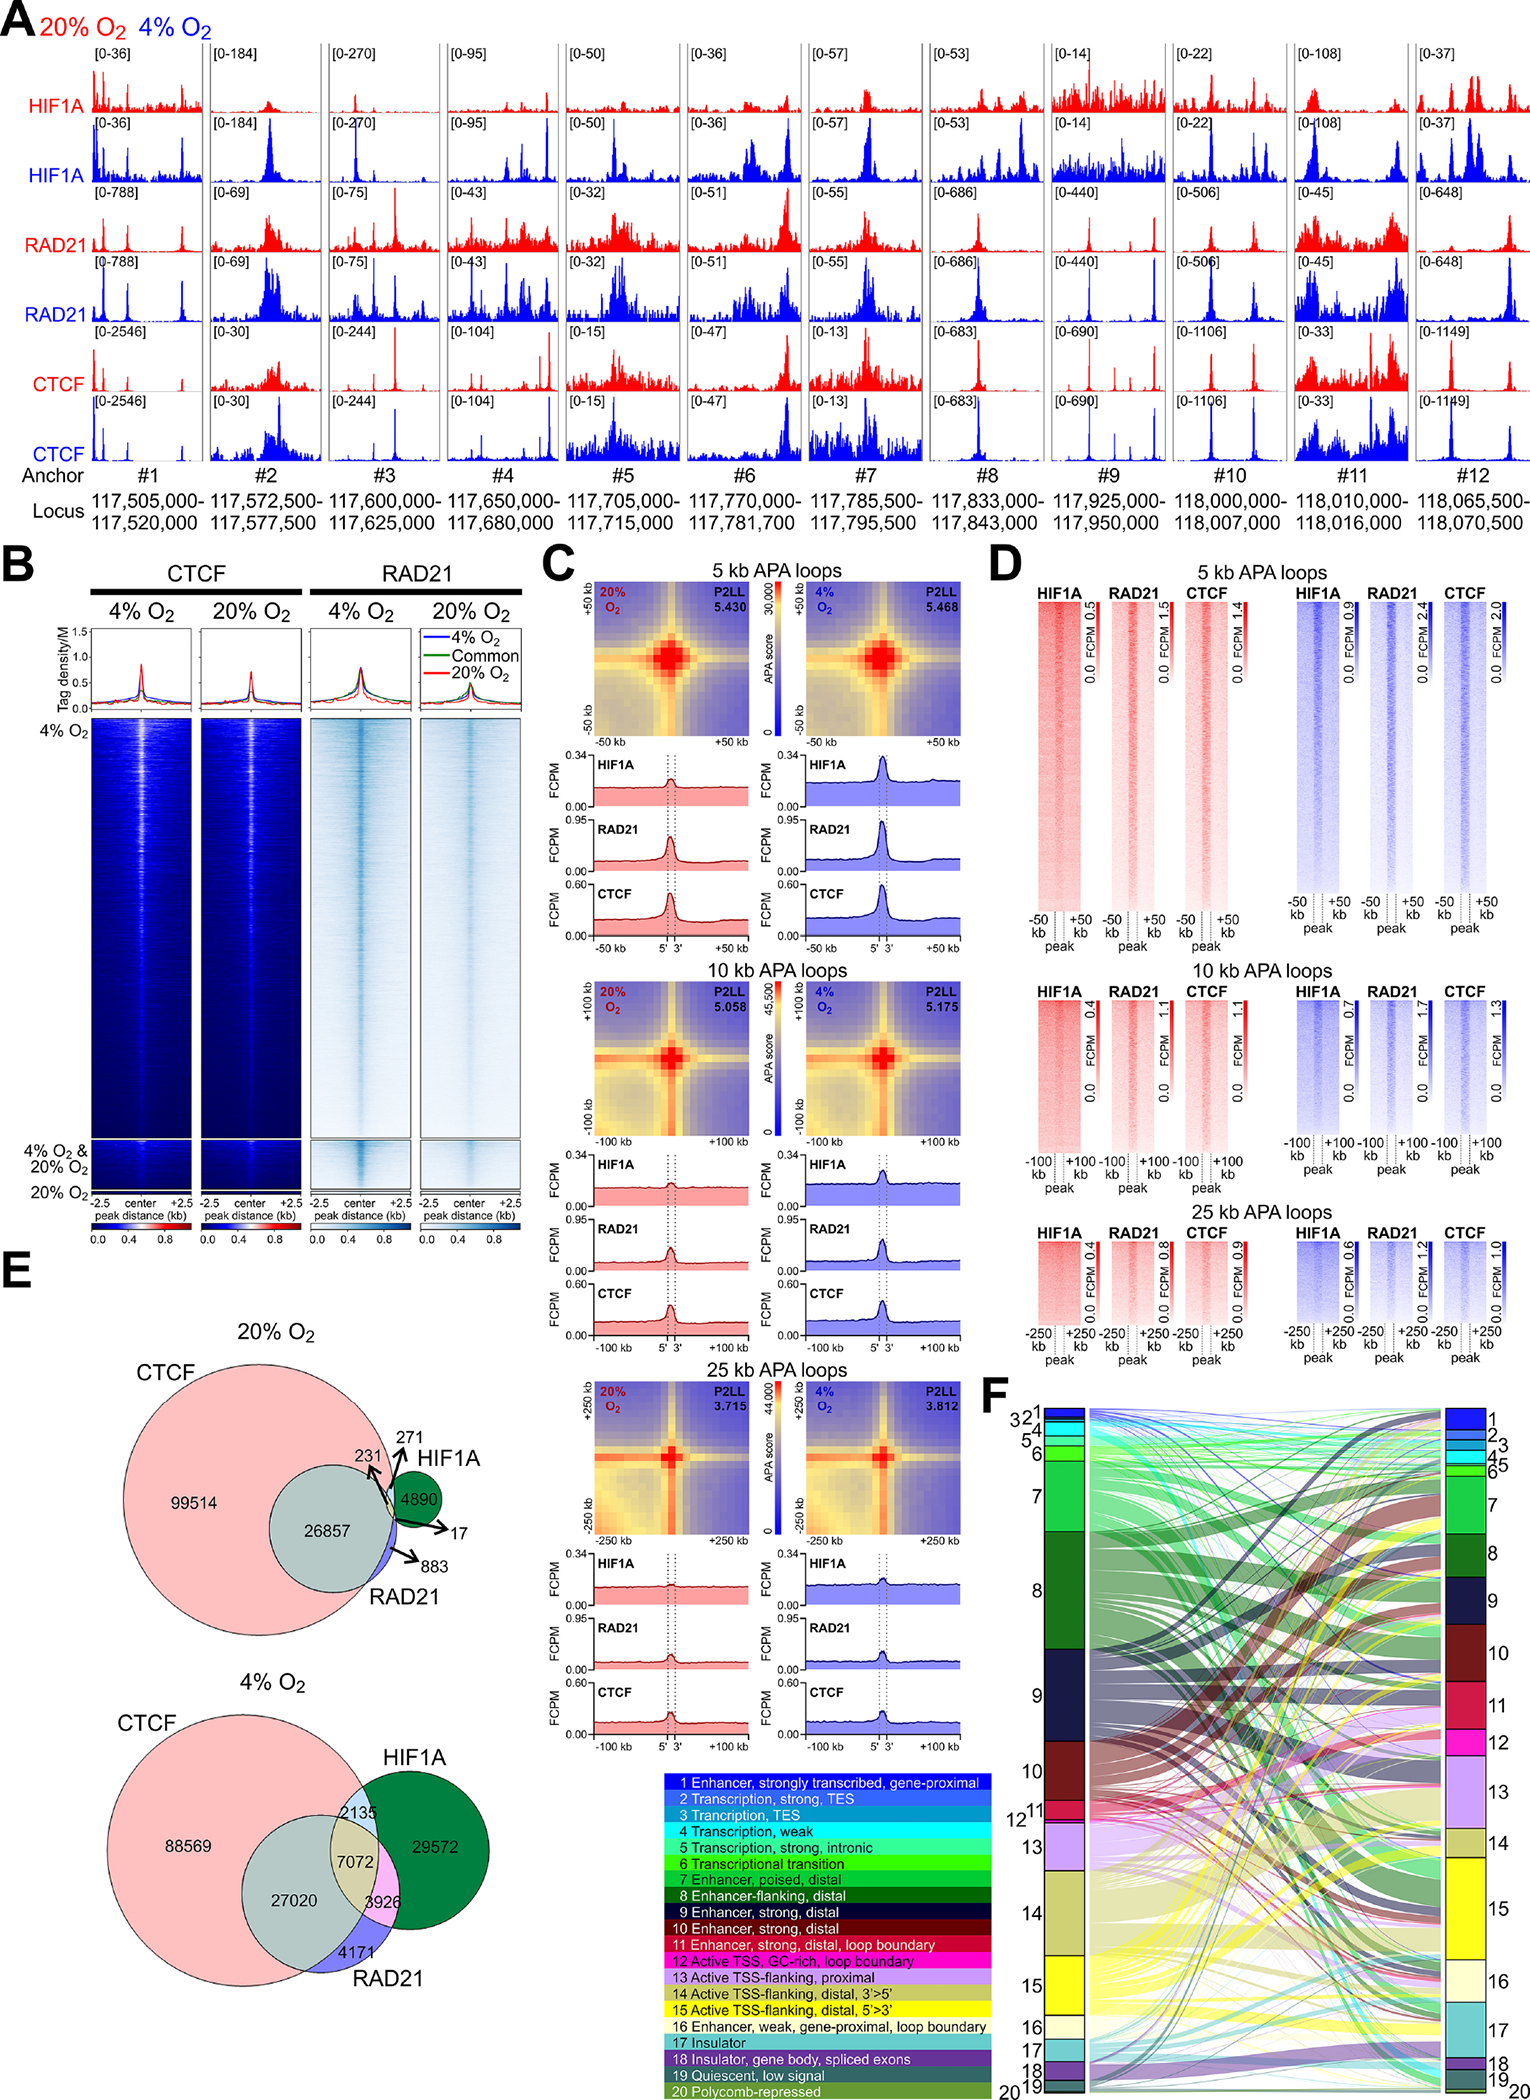
Figure 6. HIF1A alters chromosome topology genomewide.

(A) HIF1A, RAD21, and CTCF binding (aggregate data from 2 replicates/condition) in N1E-115 cells within 12 clusters of HiC loop anchors identified in Figure 5. (B) Heatmaps and average tag density plots of CTCF and RAD21 ChIP-seq data aligned to the centers of HIF1A peaks±2.5 kb (see in Figure 3C) are shown for HIF1A peaks unique to cells cultured at 4% O2 (blue lines, top heatmap panels) or 20% O2 (red lines, bottom heatmap panels) or common to cells maintained at 4% O2 or 20% O2 (green lines, middle heatmap panels). (C) Heatmaps of standard APA results obtained at 5-, 10-, and 25-kb resolution. P2LL, peak-to-lower-left-quadrant enrichment values. Below the APA plots, HIF1A, RAD21, and CTCF average tag density plots centered around all detected APA loop anchors are shown. Dashed vertical lines demarcate the central APA bins. (D) Heatmaps corresponding to the average tag density plots in C. (E) Venn diagrams showing overlaps of HIF1A, CTCF, and RAD21 peaks at 20% O2 and 4% O2. (F) Sankey plot showing chromatin state changes from 20% O2 (left) to 4% O2 (right) in N1E-115 cells. The colored ribbons show the relative frequencies of epigenetic states discovered by ChromHMM using a 20-state model.
