

Summary
Cold-induced thermogenesis (CIT) is widely studied as a potential avenue to treat obesity, but a thorough understanding of the metabolic changes driving CIT is lacking. Here, we present a comprehensive and quantitative analysis of the metabolic response to acute cold exposure, leveraging metabolomic profiling and minimally-perturbative isotope tracing studies in unanesthetized mice. During cold exposure, brown adipose tissue (BAT) primarily fueled the tricarboxylic acid (TCA) cycle with fat in fasted mice and glucose in fed mice, underscoring BAT’s metabolic flexibility. BAT minimally used branched chain amino acids or ketones, which were instead avidly consumed by muscle during cold exposure. Surprisingly, isotopic labeling analyses revealed that BAT uses glucose largely for TCA anaplerosis via pyruvate carboxylation. Finally, we find that cold-induced hepatic gluconeogenesis is critical for CIT during fasting, demonstrating a key functional role for glucose metabolism. Together, these findings provide a detailed map of the metabolic rewiring driving acute CIT.
Graphical Abstract

eTOC Blurb
Using 13C-isotope tracing, Bornstein, et al. quantify metabolic flux during cold stress in awake mice. Results detail the cold-induced changes in systemic nutrient flux and organ-specific fuel preference in both fasting and feeding conditions. The authors also elucidate key roles for glucose and hepatic gluconeogenesis in maintaining cold tolerance.
Introduction
Thermogenesis allows warm-blooded animals, including mammals, to adapt to and survive in cold environments1,2. When ambient temperature drops, organisms undergo a complex, coordinated response to maintain body temperature by internally generating heat3. Heat is generated via specific, evolutionarily conserved mechanisms that promote futile nutrient oxidation and dissipation of the released chemical energy as heat4. The ability of these mechanisms to increase resting metabolic rate have made them attractive therapeutic targets to treat obesity and cardiometabolic diseases, which stem from an imbalance between nutrient intake and energy expenditure5,6.
Cold-induced thermogenesis (CIT) is mediated by two distinct processes: shivering and non-shivering thermogenesis. Shivering thermogenesis releases heat via rapid contraction and relaxation of skeletal muscle7. Non-shivering thermogenesis, thought to occur primarily in brown adipose tissue (BAT), produces heat via UCP1-mediated uncoupling of the mitochondrial proton gradient, as well as other mechanisms8–11. Both shivering and non-shivering thermogenesis rely on the oxidation of nutrients to fuel heat generation12,13. Thus, understanding the metabolic changes that underpin CIT is critical. However, previous metabolic studies of CIT have been limited in scope and focused almost exclusively on BAT. Furthermore, the lack of quantitative in vivo flux measurements has left unanswered important questions about fuel preference, both systemically and in specific tissues, during CIT. In particular, which nutrients are utilized by BAT, and for what purposes, remain debated questions13,14.
Here, we leverage recent advances in mass spectrometry and stable isotope tracing approaches to quantify the metabolic changes that occur during acute cold exposure in mice. First, we measure the cold-induced changes in metabolite levels in both plasma and different organs. Then, we employ a minimally perturbative stable isotope tracing approach using steady-state infusions of 13C-labeled nutrients to quantify systemic nutrient flux and organ-specific fuel preference during cold exposure. Finally, we focus on glucose and explore its functional role in the thermogenic response to cold exposure.
Results
Cold exposure induces broad and systemic metabolic changes beyond BAT
To evaluate the effects of cold exposure on systemic metabolism, we first performed untargeted metabolomic analyses of arterial plasma samples from live, unanesthetized mice housed without food at room temperature (RT) or 4°C for 6 hours. Using liquid chromatography-mass spectrometry (LC-MS), we measured a total of 605 metabolites (Table S1). Of these, 153 were increased and 164 were decreased in the plasma of cold-exposed mice (Figure 1A–B). Cold exposure induced broad increases in the levels of free fatty acids (FFAs), especially unsaturated FFAs (Figure 1C). In particular, the most abundant fatty acid species, palmitate (C16:0), oleate (C18:1), and linoleate (C18:2)15, each increased by 55-70%. In contrast, cold exposure led to decreases in the levels of both lysophospholipid (Figure S1A) and triglyceride species (Figure 1D). Among the most highly-induced metabolites during cold were polyunsaturated monoacylglycerols (Figure 1E), including, notably, MG(20:4), also known as 2-arachidonoylglycerol (2-AG), an endogenous ligand of the cannabinoid receptor16 (Figure S1B). 2-AG-mediated cannabinoid receptor signaling in the hypothalamus inhibits thermogenesis and energy expenditure17–19, and its rise here suggests that it may act as a feedback suppressor of CIT. Cold exposure also induced broad changes in non-lipid metabolites (Figure S1C), some of which are known to promote non-shivering thermogenesis, including 3-hydroxyisobutyrate (3-HIB)20,21 and aminoadipic acid22. Changes in amino acid levels were varied, with increases in some, particularly alanine and the branched-chain amino acids (BCAAs: leucine, isoleucine, and valine), and decreases in many others (Figure 1F).
Figure 1: Cold exposure induces broad and systemic metabolic changes.
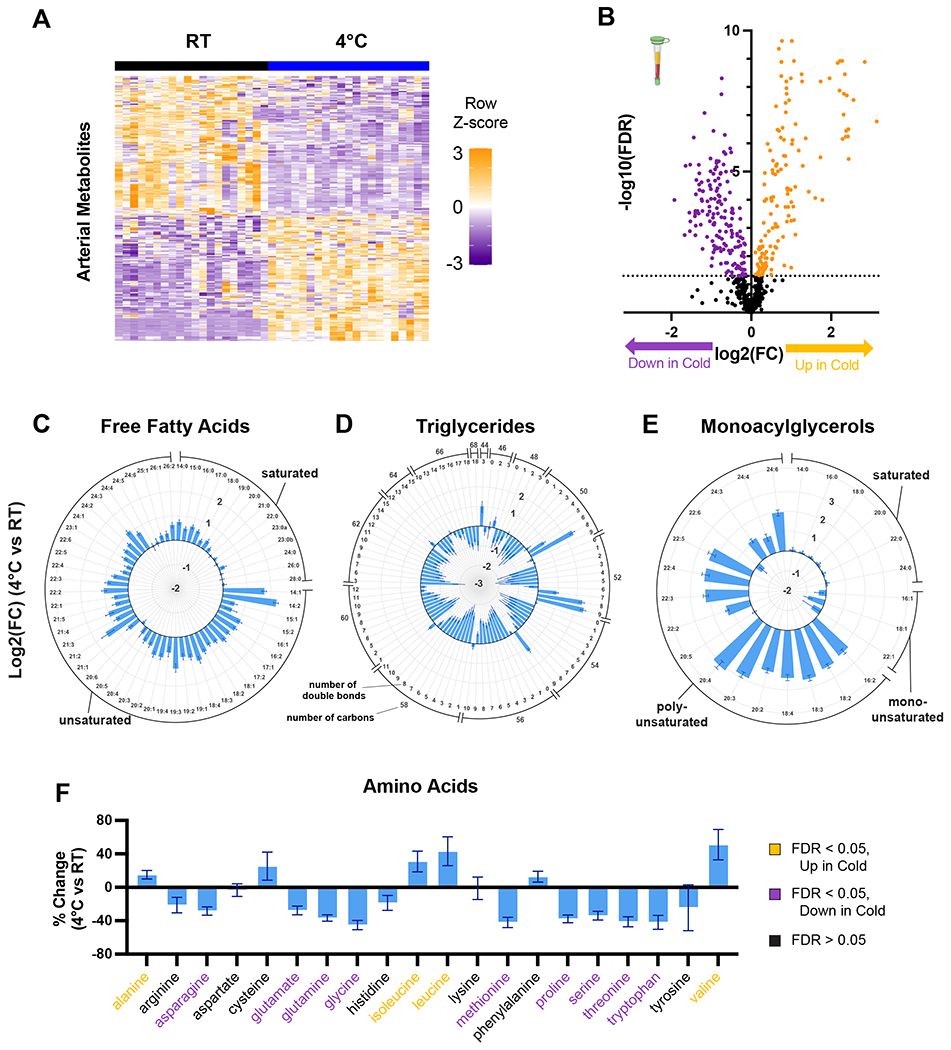
Arterial plasma metabolite concentrations from male, 14-15 week-old mice housed without food for 6 hours at room temperature (RT, n=20) or 4°C (n=21). (A) Heatmap of differentially abundant metabolites. (B) Volcano plot comparing plasma metabolite levels in mice at 4°C or RT. (C-E) Log2 fold change of individual (C) free fatty acids, (D) triglycerides, and (E) monoacylglycerols in plasma from mice at 4°C vs. RT. (F) Percent change in individual amino acids in plasma from mice at 4°C compared to RT. Error bars represent standard error.
We next performed untargeted metabolomic analyses of 6 different organs - BAT, heart, liver, quadriceps (quad), diaphragm, and gonadal white adipose tissue (g-WAT) - from mice similarly housed at room temperature or acutely exposed to 4°C (Table S2). Cold exposure induced substantial metabolic changes in all organs studied, not just in canonical thermogenic organs like BAT, and these changes varied strongly across tissues (Figure 2A–G, Figure S1D). Only two metabolites – phenylalanine and 3-hydroxybutyrate (3HB) – were significantly increased by cold in all tissues, and none were decreased in all tissues (Figure S1D). FFA levels were broadly increased in all organs except BAT, consistent with their circulatory rise and avid burning in BAT (Figure S1E). Citrate was increased exclusively in BAT, in alignment with strong activation of BAT tricarboxylic acid (TCA) cycle by cold (Figure S1F). The essential amino acids were generally elevated in the liver, suggestive of significant cold-induced liver proteolysis (Figure S1G). Together, these data indicate the existence of a coordinated, extensive, and complex system-wide metabolic response to cold exposure in mice.
Figure 2: Metabolic rewiring across organs in response to cold stress.
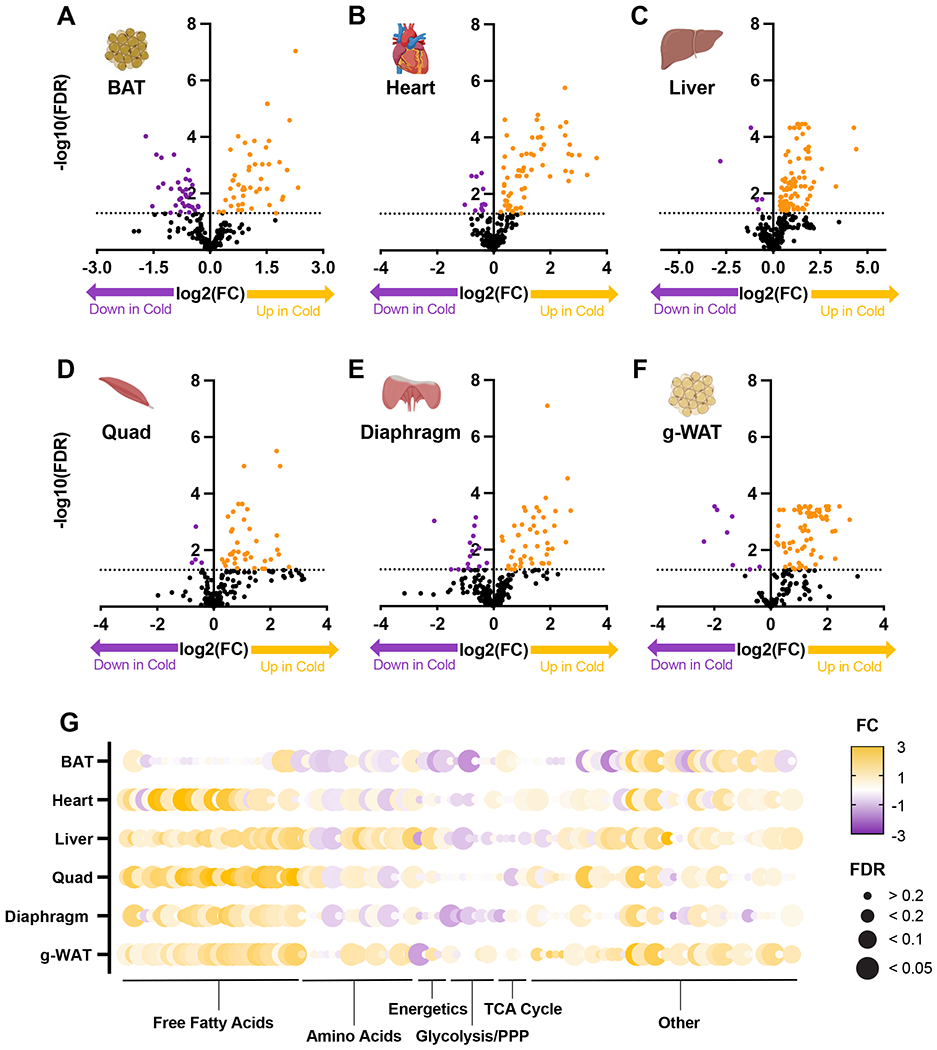
Tissue metabolite concentrations from male, 14-15 week-old mice housed without food for 6 hours at RT or 4°C (n=6). (A-F) Volcano plots comparing metabolite levels in (A) BAT, (B) Heart, (C) Liver, (D) Quadriceps muscle (Quad), (E) Diaphragm, and (F) gonadal WAT (g-WAT) from mice at 4°C vs. RT. (G) Fold-changes and FDR-adjusted p-values of broadly-detected detected metabolites in each organ.
Quantifying cold-induced changes in whole-body carbon flux in fasted mice
Acute cold exposure dramatically increases systemic metabolic rate4,23. To supply nutrients to sustain this cold-induced metabolic rate, organisms activate various metabolic programs across different organs, including lipolysis in adipose tissue24,25, gluconeogenesis and glycogenolysis in the liver26,27, and proteolysis in muscle and potentially other tissues28. However, quantitative evaluations of whether, and to what extent, these pathways contribute to increased nutrient flux and metabolic rate are lacking. To address this question, we established in mice a double-line in vivo steady-state heavy isotope labeling scheme (Figure 3A). Trace amounts of uniformly 13C-labeled fuels were separately infused intravenously into awake, freely-moving mice, either maintained at RT or acutely exposed to 4°C, while taking intermittent blood samples from an arterial catheter. The use of this approach is critical for several reasons: (1) low-dose steady-state tracer infusions allow for quantitative determinations of flux, in contrast to experiments using bolus injections; (2) the infusions are minimally perturbative to host metabolism, again in contrast to bolus studies; (3) flux into secondary metabolites can be quantified, e.g. lactate to glucose flux (gluconeogenesis); (4) blood draws via an indwelling arterial line minimally perturb the mice, thereby minimizing undesired effects such as catecholamine surges generated by drawing blood by other means (e.g. tail vein)29; (5) arterial blood reflects systemic metabolism and avoids potentially misleading conclusions generated by sampling venous or mixed blood from a specific source, e.g. tail vein, that are disproportionally affected by local tissue activity.
Figure 3: Quantifying cold-induced changes in whole-body carbon flux in fasted mice.
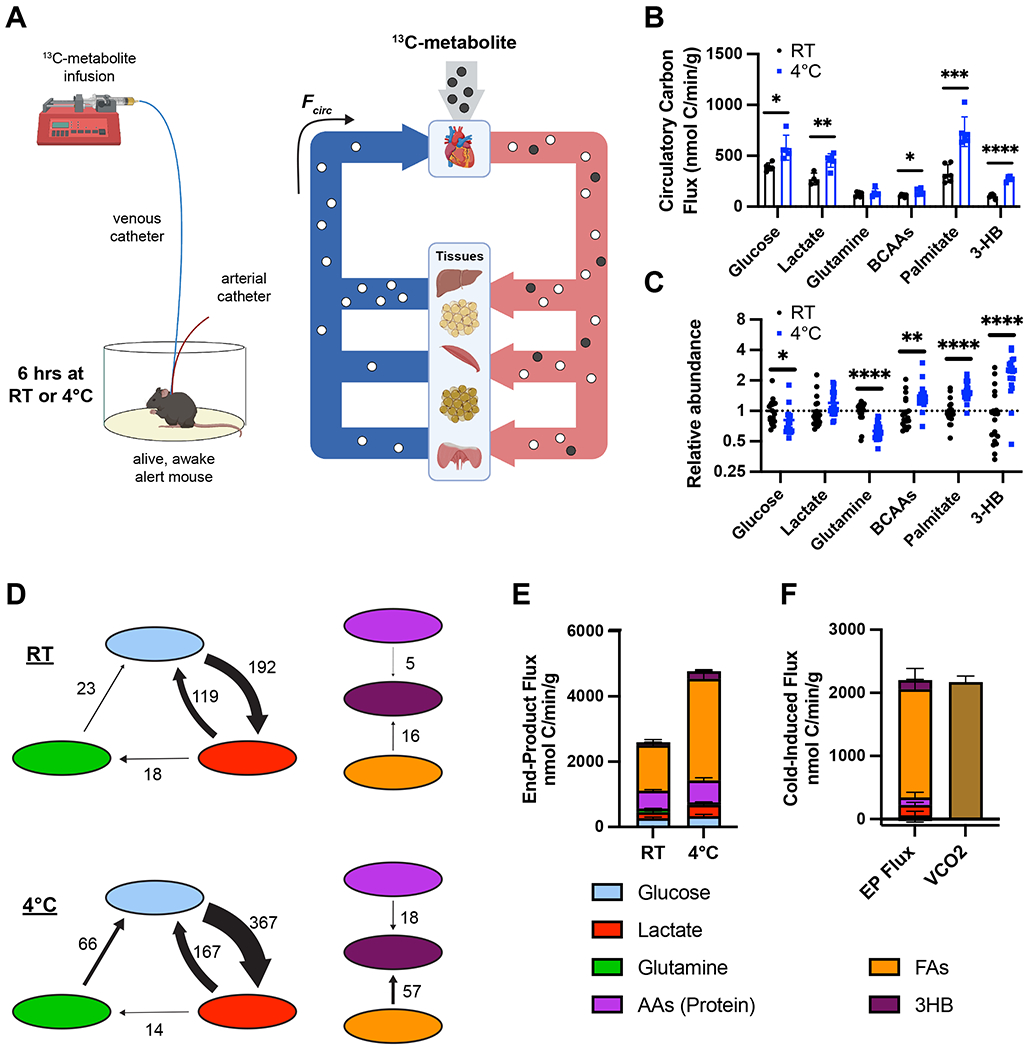
(A) Model demonstrating 13C-metabolite infusion system. (B) Circulatory carbon flux (n=4-6), and (C) metabolite abundance in arterial plasma (n=20-21) for key metabolites in mice at room temperature (RT) or acutely exposed to 4°C without access to food. (D) Select absolute flux rates between circulating nutrients in nmol carbon/min/g. (E) End-product flux rates of key metabolites in mice at RT or 4°C. (F) Cold-induced increase in end-product flux rates and VCO2. Error bars represent standard error. *p<0.05, **p<0.01, ***p<0.001, ****p<0.0001 by two-tailed t-test.
To generate a comprehensive picture of cold-induced changes in metabolic fluxes, we selected a diverse set of abundant nutrients comprising carbohydrates (glucose and lactate), amino acids (glutamine and the BCAAs), fatty acids (palmitate), and ketone bodies (3HB). We first performed these infusions in mice fasted for the duration of their exposure to RT or 4°C (6 hours). For each of these separate infusions, we achieved stable, steady-state fractional enrichment of each infused nutrient (Figure S2A–F). From the 13C fractional enrichment and the known infusion rate we calculated the infused metabolite’s total circulatory flux , (rate of appearance of the intact molecule Ra) (Figure S2G). We additionally calculated the atom-weighted circulatory carbon flux for each nutrient (average rate of appearance of its carbon atoms) (Figure 3B)30. Observed flux changes in response to cold partially aligned with changes in plasma abundance (Figure 3C). Circulatory fluxes of glucose, lactate, BCAAs, palmitate, and 3HB (but not glutamine) were increased in response to cold exposure, especially palmitate and 3HB. The increased circulatory flux of BCAAs, which are essential amino acids, reflect systemic proteolysis, and the flux of palmitate reflects systemic lipolysis.
For each set of infusions, we next examined the fractional labeling of secondary metabolites. Using linear algebra analyses31 (STAR Methods), we corrected for indirect labeling to calculate the direct contributions of each metabolite to the flux of each of the other metabolites, ultimately yielding absolute fluxes between circulating nutrients (Figure 3D, Table S3). We find that cold exposure promotes a large increase in glycolytic (glucose-to-lactate) flux as well as an increase in glucose generation from the gluconeogenic substrates lactate and glutamine. We also observed an increase in 3HB production from multiple sources including fatty acids like palmitate and amino acids like the BCAAs (presumably leucine and isoleucine, which are ketogenic, unlike valine).
We next compared the sum of our calculated nutrient carbon fluxes to whole-body carbon metabolism (VCO2) measured with comprehensive laboratory animal metabolic system (CLAMS). We first corrected for interconversion fluxes so as not to double-count carbons; for example, glucose flux to lactate prior to oxidation would count toward circulatory flux of both glucose and lactate. We thus define a new parameter, end-product (EP) flux , as the circulatory carbon flux of a metabolite that does not flow into other measured circulating metabolites (Figure S2H–I) (STAR methods). The fluxes of unmeasured fatty acids (FAs) and protein-liberated amino acids were extrapolated from the measured fluxes of palmitate and BCAAs using published ratios31,32 (STAR methods) to generate a model of whole-body end-product flux at RT and during acute cold exposure (Figure 3E). The estimated cumulative end-product flux is higher than measured VCO2, indicating non-oxidative fates of some nutrients (e.g. anabolic metabolism) (Figure S2J). Net anabolism is improbable in the fasted state, so this likely reflects significant amounts of nutrient cycling through intracellular macromolecule stores, e.g. esterification of fatty acids into triglyceride pools coupled with lipolysis of these same stores. In contrast, the cold-induced rise in end-product flux precisely matches the increase in CO2 production (Figure 3F), implying that cold-induced nutrient flux is directed fully to oxidation without an increase in macromolecule cycling. Strikingly, the rise in end-product flux is predominantly fatty acid burning, suggesting that fatty acids are the main heat-producing fuel in cold-exposed, fasting mice.
Quantifying organ-specific fuel preference during acute cold exposure in fasted mice
Next, to investigate how cold exposure affects fuel use in individual organs, we measured the 13C-fractional enrichment of TCA cycle metabolites in different tissues following each labeled-nutrient infusion to calculate the fraction of TCA cycle carbons that are derived from each nutrient (Figure S3A–F). We then used linear algebra analyses31 (STAR Methods) to correct for indirect labeling via secondary metabolites to determine the direct contribution of each nutrient to the TCA cycle in each tissue at RT and 4°C (Figure 4A–F).
Figure 4: Quantifying organ-specific fuel preference during acute cold exposure in fasted mice.
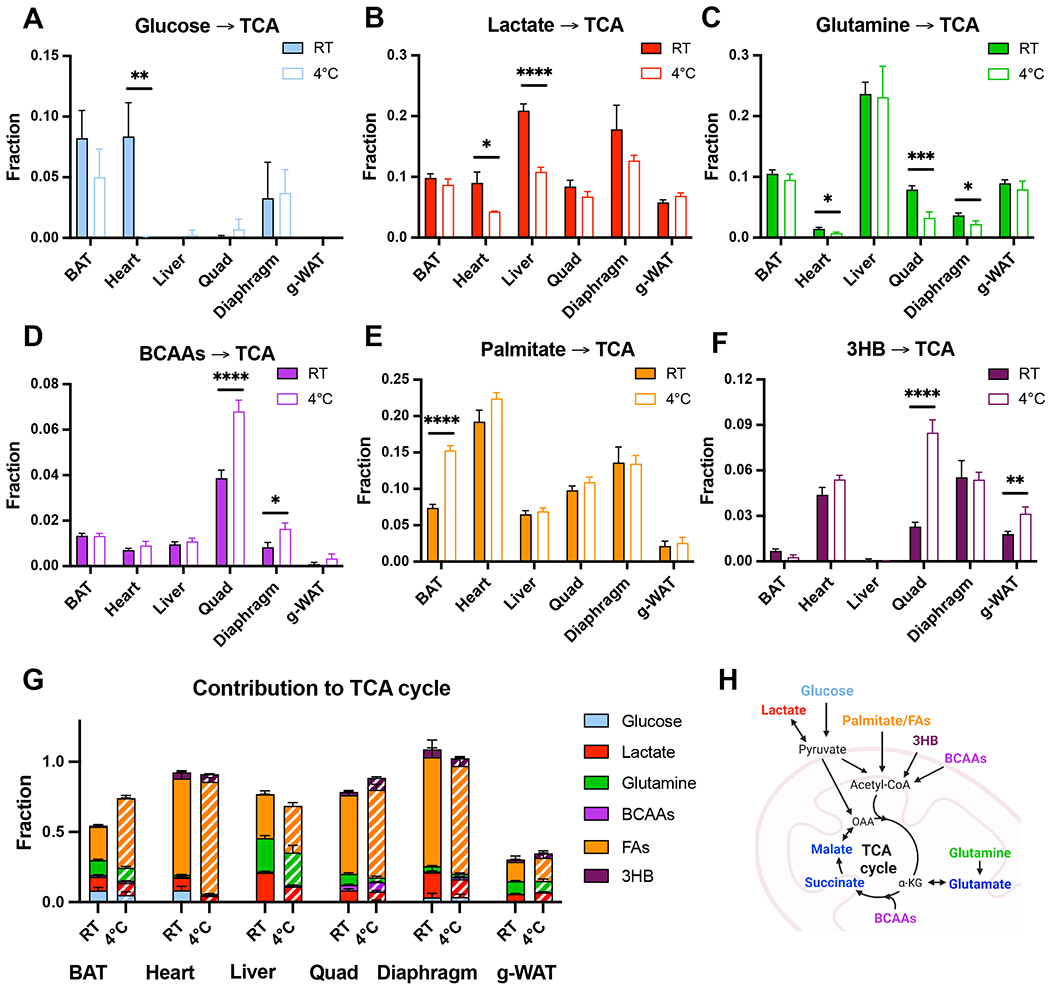
(A-G) Direct contributions of (A) Glucose, (B) Lactate, (C) Glutamine, (D) BCAAs, (E) Palmitate, (F) 3-hydroxybutyrate, and (G) all nutrients combined, including an estimation of total FAs, to the TCA cycle (malate, succinate, and glutamate) in different organs in mice at RT or acutely exposed to 4°C for 6 hours without food. (H) Diagram of nutrient contribution to the TCA cycle. Error bars represent standard error. *p<0.05, **p<0.01, ***p<0.001, ****p<0.0001 by two-tailed t-test.
As previously reported33, many tissues do not use glucose directly to fuel the TCA cycle in fasted animals, and in our data, direct glucose oxidation is restricted to highly oxidative tissues like BAT, heart, and red muscles like the diaphragm (Figure 4A). Strikingly, cardiac glucose use is nearly completely suppressed during fasted cold exposure. Lactate preference was also significantly decreased in the heart during cold exposure (Figure 4B), suggesting that the decrease in carbohydrate use may at least partially be regulated at the level of pyruvate utilization. In contrast, the relative use of glucose in BAT is unaffected. As absolute TCA cycle flux in BAT is substantially increased by cold exposure8, the unchanged relative use of glucose by BAT likely indicates a large increase in absolute glucose use. Cardiac suppression of carbohydrate utilization may therefore reflect a cold-induced adaptive mechanism to spare glucose for BAT.
Amino acid metabolism is similarly rewired in a manner that could help direct glucose to BAT. In response to cold, preference for glutamine use by muscle declines (Figure 4C), and glutamine is instead diverted toward gluconeogenesis (Figure S3G–H). Conversely, cold exposure markedly increases muscle preference for oxidation of BCAAs, which are not a favored substrate for BAT (Figure 4D). Increased muscle BCAA utilization is not mediated by changes in enzyme gene expression (Figure S3I) or phosphorylation of the rate-limiting BCKDH complex (Figure S3J). However, plasma BCAA levels rise substantially during cold exposure (Figure 1F), potentially implicating a mass action effect and suggesting that BCAA oxidation in skeletal muscle may be more responsive to changes in availability than in other organs. Based on the dilution of labeled plasma BCAAs by unlabeled pools liberated via proteolysis in each tissue, we infer that the increased circulating flux and concentrations of BCAAs emanates substantially from liver proteolysis (Figure S3K).
Consistent with our circulatory flux analyses pointing to fatty acids as the primary heat-generating fuel during fasted cold stress, BAT increases its preference for palmitate oxidation in response to cold (Figure 4E). This response is both substantial and unique to BAT. Expression of fatty acid uptake-related genes are largely unaffected by cold (Figure S3L), indicating control of consumption by other means, perhaps energy demand. Combined with the greater BAT TCA turning rate in cold, the doubling of the fat contribution reflects a dramatic cold-induced upregulation of fat burning by BAT. 3HB, on the other hand, is minimally oxidized in BAT, and instead used substantially by muscle tissue, with a marked increase during cold exposure in the quad (Figure 4F).
Combining these data together and extrapolating palmitate data to predict total fatty acid utilization, we estimate total nutrient contributions to the TCA cycle in each tissue both at room temperature and 4°C (Figure 4G–H). Across tissues and conditions, we account for an average of ~75% of TCA cycle carbons, with the rest presumably coming from intracellular fuel stores such as glycogen and triglycerides. The large portions of unexplained TCA cycle carbons in BAT and especially g-WAT likely reflect oxidation of the large intracellular triglyceride pools in these tissues. These data therefore imply that during fasting, BAT relies heavily on fatty acid oxidation, with intracellular lipids serving as a key substrate under basal conditions and with acutely activated BAT shifting to primarily consume exogenous fatty acids. Together with previous findings that lipolysis in WAT but not in BAT is required for acute cold tolerance24,25, these data suggest that WAT lipolysis produces circulating free fatty acids which, in fasted mice, are the main TCA energy source in cold-stressed BAT.
Evaluating the metabolic effects of acute cold exposure in mice fed ad libitum
We next carried out similar flux analyses in mice fed ad libitum (Figure S4A–F). Cold-exposed mice ate more than double the food compared to mice maintained at RT (Figure 5A). Like the fasted mice, they demonstrated circulatory flux increases for glucose, lactate, BCAAs, palmitate, and 3HB, but not glutamine (Figure 5B, S4G). Despite this similarity, the quantitative magnitude of cold-induced changes differed substantially between fasted and fed conditions. In contrast to fasted mice, fed mice increased circulatory flux of carbohydrates more than fatty acids. 3HB circulatory flux was lower in fed than fasted mice, though it increased by a similar magnitude during cold exposure, while BCAA flux was both higher at baseline and increased to a greater extent during cold exposure in fed mice. Increased 3HB and BCAA flux during cold exposure was also associated with increased plasma levels, while the abundances of the other nutrients were unchanged (Figure 5C).
Figure 5: Quantifying substrate use during acute cold stress in ad libitum fed mice.
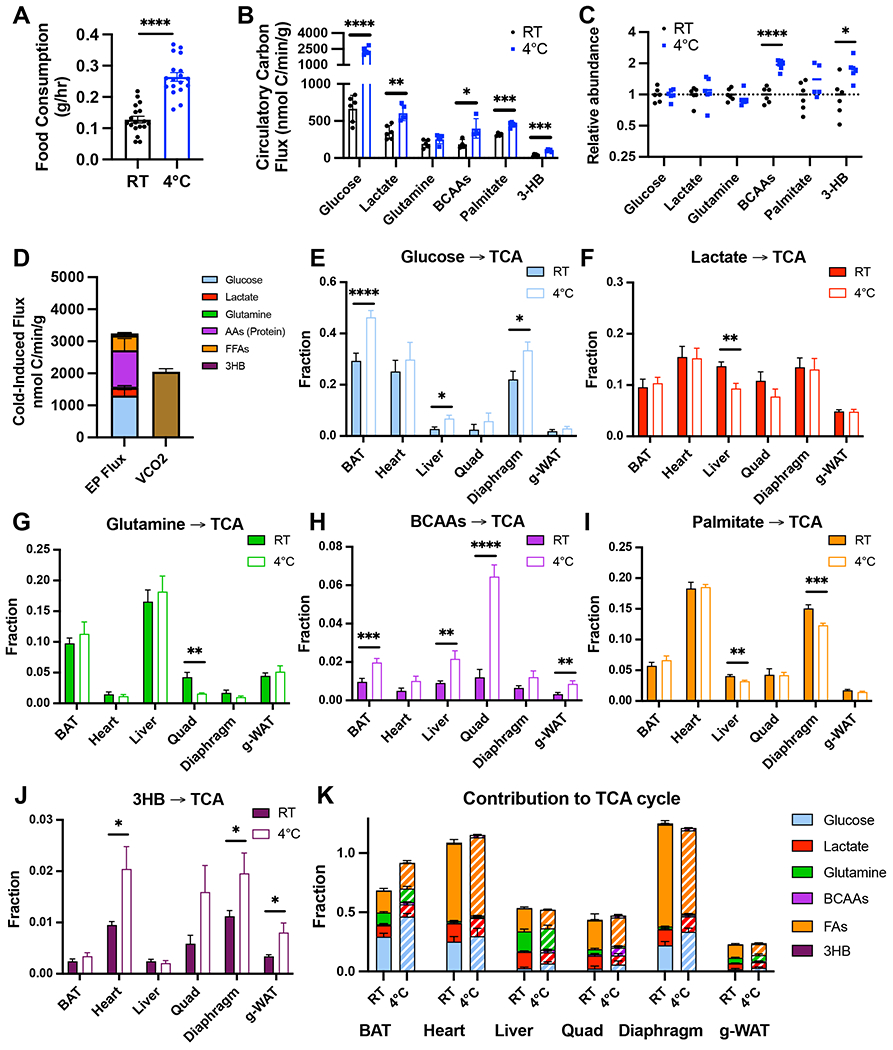
(A) Food consumption by ad libitum fed mice housed at room temperature (RT) or acutely exposed to 4°C for 6 hours. (B) Circulatory carbon flux (n=4-6), and (C) metabolite abundance in arterial plasma (n=5-6) for key metabolites in fed mice at RT or acutely exposed to 4°C. (D) Cold-induced increase in end-product flux rates and VCO2 during ad lib feeding. (E-K) Direct contributions of (E) Glucose, (F) Lactate, (G) Glutamine, (H) BCAAs, (I) Palmitate, (J) 3-hydroxybutyrate, and (K) all nutrients combined, including an estimation of total FAs, to the TCA cycle (malate, succinate, and glutamate) in different organs in ad lib fed mice at RT or acutely exposed to 4°C for 6 hours. Error bars represent standard error. *p<0.05, **p<0.01, ***p<0.001, ****p<0.0001 by two-tailed t-test.
We again quantified interconversion fluxes between circulating nutrients (Table S3) and calculated end-product fluxes for each (Figure S4H). Comparison of end product fluxes to VCO2 (using the methods above) revealed that the cold-induced rise in flux exceeds that of VCO2, unlike in fasted mice, indicative of substantial cold-induced anabolic flux in fed mice (Figure 5D, Figure S4I). Interestingly, food intake closely matched measured metabolic rate (Figure S4J–K), suggesting that, systemically, anabolic macromolecule synthesis must be matched by catabolic breakdown. In sum, these data implicate a role for nutrient cycling through intracellular macromolecule stores in the response to cold specifically in the fed state.
The effects of cold exposure on tissue fuel preference, as calculated by 13C fractional enrichment in TCA cycle intermediates, are also substantially different in ad libitum fed mice (Figure 5E–J, Figure S5). Fed mice demonstrate higher contribution of glucose to the TCA cycle in all tissues, especially highly oxidative organs like BAT, heart, and diaphragm (Figure 5E). Importantly, while BAT in fasted mice mainly burns fatty acids, glucose is the main TCA substrate in fed mice. Further, just as BAT’s basal fasted preference for fat is augmented by cold exposure (while its preference for glucose use is unchanged), so too is BAT’s basal fed-state preference for glucose augmented by cold exposure (while its preference for palmitate is unchanged). Together with the increased overall BAT TCA cycling in the cold, these data reflect consistent upregulation of both fat and glucose consumption in the cold, especially for the preferred substrate (fat during fasting and glucose during feeding).
Cold exposure also induces a variety of other fuel preference changes in fed mice, some similar to and some different from those seen in fasted mice. Unlike fasted mice, carbohydrate use is preserved in the heart during cold stress in fed mice. In contrast, fed animals, like fasted animals, show a decrease in preference for glutamine and a large increase in preference for BCAAs in the quad during cold exposure (Figure 5G–H). In fed mice, the contribution of BCAAs to the TCA cycle also increases in most other organs, including BAT, but remains below ~2% everywhere except the quad. Preference for palmitate oxidation decreases in both diaphragm and liver in response to cold exposure in fed animals (Figure 5I). 3HB contribution to the TCA cycle is consistently lower in fed mice compared to fasted mice but increases in several tissues with cold exposure (Figure 5J).
Combining these data together, we estimated total nutrient contributions to the TCA cycle across tissues at both RT and 4°C in fed animals (Figure 5K). As with fasted animals, the unexplained portion of nutrient contribution to the TCA cycle in BAT decreases with cold, indicating decreased reliance on internal fuel stores. However, in fed mice, this shift is driven by increased use of carbohydrates rather than fatty acids, underscoring that nutrient preference in BAT is flexible and influenced heavily by feeding status.
Mapping glucose fate during acute cold exposure
While fatty acid oxidation has been extensively studied in the context of cold-induced thermogenesis34–39, the role of glucose utilization in this process is less well understood. It is well-established that cold exposure induces glucose uptake in BAT40–45, and glucose uptake is used to measure BAT mass and activity in humans46. Cold exposure also promotes glucose uptake in skeletal muscle47,48. However, these studies could not elucidate the destination of glucose-derived carbons. We thus sought to use our steady-state infusion system to quantitatively map glucose fate during cold exposure.
We first examined the flux from glucose to lactate in the circulation. Concomitant with large increases in total glucose flux during cold exposure, there is substantially more glucose flux to lactate in the cold in both fasted and fed mice (Figure 6A). However, only ~22% of cold-induced glucose flux in fed animals is devoted to lactate generation, in contrast to ~74% in fasted animals (Figure 6A–B). Systemic cold-induced glucose flux is thus primarily used for lactate generation in fasted but not fed animals.
Figure 6: Liver gluconeogenesis fuels anaplerosis in BAT and is required for cold tolerance.
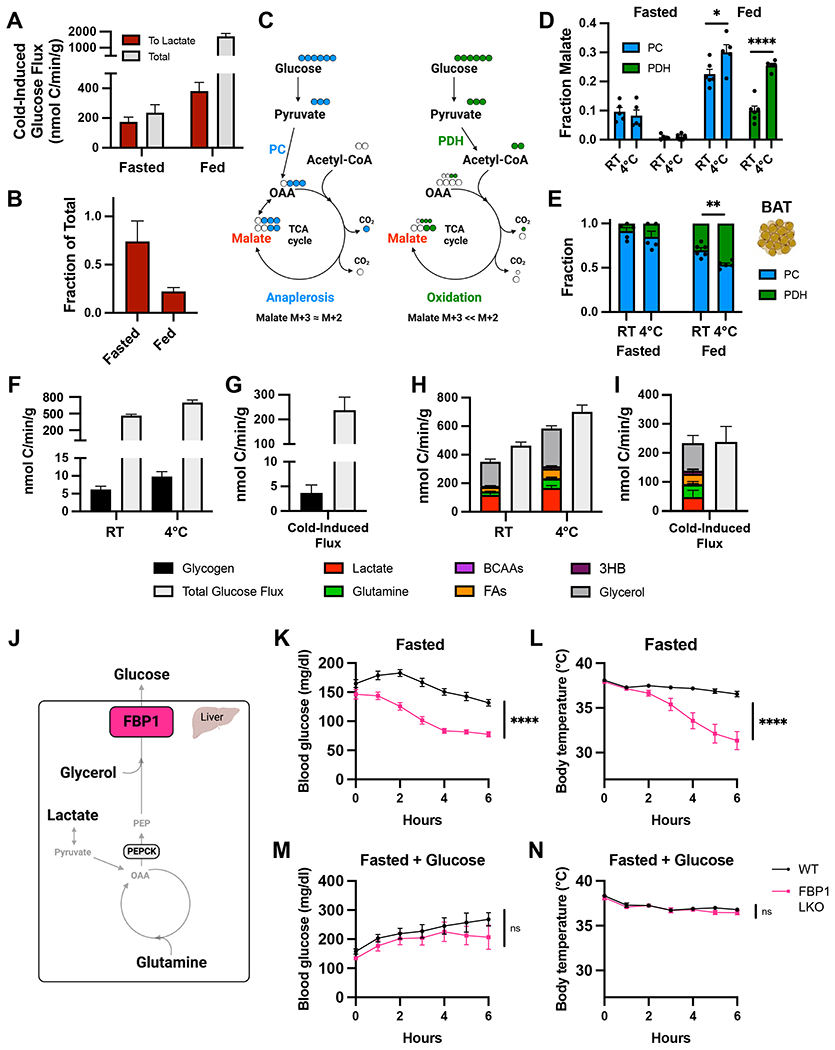
(A) Cold induced increase in flux from glucose to lactate and total glucose flux in fasted or ad libitum fed mice. (B) Fraction of total cold-induced increase in glucose flux that can be accounted for by generation of lactate. (C) Schematic showing carbon tracing from glucose to malate via either pyruvate carboxylation (PC) or oxidation by pyruvate dehydrogenase (PDH). (D) Fraction of malate derived from glucose via either PC or PDH flux in BAT of fasted and ad libitum fed mice at room temperature (RT) or 4°C (n=5-6). (E) Fraction of total glucose flux to malate via PC vs. PDH pathways in BAT (n=5-6). (F) Flux of glucose attributable to the net decrease in glycogen from 3 to 6 hours compared total glucose flux in fasting mice at RT or 4°C. (G) Cold-induced increase in glucose flux from glycogen and total glucose flux. (H) Flux from various nutrients to glucose compared to total glucose flux from fasting mice housed at RT or 4°C. (I) Cold-induced increase in flux from various nutrients to glucose and total glucose flux. (J) Schematic showing FBP1-mediated gluconeogenesis in liver. (K) Blood glucose levels (n=9-11) and (L) body temperatures (n=12-15) of FBP1 Liver-knockout (FBP1 LKO) and control (WT) mice acutely exposed to 4°C without food. (K) Blood glucose levels (n=7-8) and (L) body temperatures (n=7-8) of FBP1 LKO and WT mice acutely exposed to 4°C without food but with 15% glucose provided in drinking water. Error bars represent standard error. *p<0.05, **p<0.01, ***p<0.001, ****p<0.0001 by two-tailed t-test.
Instead of being converted to lactate, glucose-derived pyruvate can be transported into the mitochondria to supply carbons to the TCA cycle (Figures 4A, 5E), and can do so in two ways: (1) pyruvate can be oxidized and decarboxylated by pyruvate dehydrogenase (PDH) to acetyl-coA for complete oxidation via the TCA cycle, or (2) it can be carboxylated by pyruvate carboxylase or other enzymes (which we will collectively refer to as PC) to generate the TCA cycle intermediates oxaloacetate or malate (Figure 6C). The latter anaplerotic reaction helps maintain the TCA cycle pool. Flux through these two pathways is distinguishable using isotopologue analysis and 13C-labeled glucose, because PDH releases one pyruvate carbon as CO2 to generate the two-carbon unit of acetyl-coA while oxaloacetate/malate generated via PC retains all three original pyruvate carbons (Figure 6C). Using this basic framework, we developed a method to quantify relative flux through each pathway in vivo, using data from our infusions with universally labeled U-13C-glucose (STAR Methods). Surprisingly, we find that in fasted mice, either housed at room temperature or acutely exposed to 4°C, BAT incorporates glucose-derived carbons into the TCA cycle almost exclusively via PC flux (Figure 6D–E). In mice fed ad lib, PDH flux in BAT is engaged, but pyruvate carboxylation remains the primary mechanism of glucose carbon entry into the TCA cycle, in RT as well as during cold exposure. Pyruvate carboxylation flux in BAT is thus substantial, representing up to a third of total TCA cycle turnover. In contrast, the diaphragm, which also substantially utilizes glucose for TCA cycle metabolism, does so primarily via PDH flux in both fasted and fed states, and PC flux is fully abolished during cold exposure (Figure S6A–B).
To validate these conclusions, we employed an orthogonal tracing method, using a steady-state infusion of 3-13C-glucose in ad lib fed mice. The labeled carbon on 3-13C-glucose is positioned such that it is lost to CO2 when glucose-derived pyruvate is oxidized by PDH but retained when incorporated into malate via pyruvate carboxylation (Figure S6C)49. The fraction of malate generated by glucose-derived pyruvate carboxylation calculated by this method was highly concordant with the previous results in both BAT and diaphragm (Figure S6D). We conclude that BAT utilizes glucose largely to replenish TCA cycle intermediates.
Liver gluconeogenesis maintains glucose supply and is required for cold tolerance in fasted mice
In fed mice, dietary carbohydrates supply circulating glucose, and the cold-induced increase in glucose flux can be accounted for almost entirely by increased carbohydrate consumption (Figure S6E). In the fasted state, however, glucose must be supplied by alternative sources, principally glycogen breakdown or gluconeogenesis. To determine the contribution of liver glycogen breakdown to circulating glucose flux, we measured the decline in liver glycogen content in mice fasted either at room temperature or at 4°C for 6 hours (Figure S6F). By 3 hours, liver glycogen content decreased by more than 70% in both conditions. By 6 hours, liver glycogen was further lowered, and more so in mice exposed to 4°C. However, the net glycogen depletion during this latter 3-hour time interval only accounted for ~1% of measured systemic glucose flux (Figure 6F–G), indicating that by 3-6 hours of cold exposure, liver glycogen minimally contributes to circulating glucose supply.
We showed above that various nutrients, especially lactate and glutamine, contribute to circulating glucose in fasted animals (Figure 3D). However, these substrates alone are insufficient to account for all glucose flux during cold exposure. We thus conducted an additional steady-state infusion with 13C-labeled glycerol, another important gluconeogenic substrate (Figure S6G)50. Circulatory flux of glycerol increases during cold exposure (Figure S6H), consistent with lipolysis-induced glycerol release. Gluconeogenic flux from glycerol also increases during cold exposure and matches total glycerol flux at both RT and 4°C (Figure S6I), indicating that gluconeogenesis is the primary fate of circulating glycerol. The summed calculated gluconeogenic flux from glycerol and other measured substrates accounts for almost all glucose flux, both basally and during acute cold exposure (Figure 6H). And, importantly, the increased gluconeogenic flux from these substrates accounts entirely for measured cold-induced glucose flux (Figure 6I). Thus, gluconeogenesis is the predominant source of cold-induced glucose flux in fasted mice.
Gluconeogenesis occurs primarily in the liver, and to a lesser extent in the kidney. Cold exposure increases liver protein levels of key gluconeogenic enzymes Pepck and Fbp1 (Figure S6J–K). mRNA levels of Pepck, but not Fbp1, are also increased (Figure S6L), suggesting this response is only partially transcriptionally regulated. To test if glucose supply is required for cold-induced thermogenesis, we generated mice with hepatocyte-specific deletion of Fbp1, which, unlike Pepck, is required for gluconeogenesis from all substrates including glycerol (Figure 6J). Liver-specific knockout mice were generated by injecting Fbp1flox/flox mice with AAV8-Tbg-Cre (FBP1 LKO)51, and AAV8-Tbg-GFP-injected Fbp1flox/flox mice (WT) were used as controls (Figure S6M). FBP1 LKO mice maintained normal body weight (Figure S6N) and had normal liver glycogen levels (Figure S6O). When fasted FBP1 LKO mice were exposed to 4°C, their blood glucose levels fell relative to controls (Figure 6K), confirming liver gluconeogenesis as a key source of glucose flux. However, blood glucose levels remained above severe hypoglycemia (<60 mg/dL), likely maintained by gluconeogenesis in the kidney. Strikingly, fasted FBP1 LKO mice fail to maintain body temperature upon acute exposure to 4°C (Figure 6L). In contrast, FBP1 LKO mice provided with drinking water supplemented with 15% glucose or with food ad libitum maintain both their blood glucose levels (Figure 6M, Figure S6P) and their body temperatures (Figure 6N, Figure S6Q) during acute cold exposure. Together, these data demonstrate that liver gluconeogenesis maintains glucose supply in cold-exposed fasted mice and that gluconeogenesis is required to support thermogenesis in these mice.
Discussion
Cold-induced thermogenesis plays a vital role in regulating organismal energy expenditure4,8. Growing efforts to exploit the thermogenic program to prevent or treat cardiometabolic diseases5,6 underscores the need for a better understanding of the metabolic changes driving this process. Here, we present a comprehensive, quantitative analysis of the metabolic response to acute cold exposure in mice.
Metabolomic analyses identified substantial and systemic metabolic changes during cold exposure, with unique perturbations not limited to thermogenic organs. We find increased plasma levels of lipid (e.g. 2-AG17,18) and non-lipid (e.g. aminoadipic acid22) metabolites with known signaling roles in thermogenesis, providing validation of this approach to identify other functionally significant metabolites in the thermogenic response. We identify hundreds of other metabolites that are up- or down-regulated during cold exposure and that have yet to be studied in this context, providing a comprehensive resource for further functional studies.
In fasted mice, cold exposure led to broad increases in plasma levels of non-esterified free fatty acids. Flux studies using 13C-palmitate revealed a large increase in circulatory flux of fatty acids during cold exposure. We find that the estimated increase in fatty acid flux accounts for almost all of the cold-induced increase in systemic CO2 production, demonstrating that fatty acids are the primary recruited oxidative fuel during the acute cold response in fasted mice. Interestingly, we also note large increases in free fatty acid levels across most organs, with the notable exception of BAT. Also unlike other tissues, BAT dramatically increases its relative contribution of circulating fatty acids to the TCA cycle during cold exposure. These data imply that cold exposure substantially increases fatty acid oxidation capacity uniquely in BAT, promoting elevated oxidative flux despite no change in fatty acid abundance in the tissue. Fed mice, in contrast, demonstrated a modest increase in systemic fatty acid flux during cold stress, accounting for only a small portion of the cold-induced increase in whole-body carbon flux. Also in contrast to fasted mice, the contribution of fatty acids to the TCA cycle in BAT was unchanged by cold stress in fed mice. Nevertheless, because our findings suggest that carbohydrate flux into the TCA cycle in BAT is largely anaplerotic (see discussion below), fatty acids are likely a major source of acetyl-CoA and therefore oxidative fuel even in the fed state. These findings are consistent with established functional data detailing the thermogenic requirement for fatty acid oxidation in BAT34,35,39, and provide useful quantitative flux measurements to support future investigation in this area.
Elevated circulatory flux of the essential BCAAs indicated a ~30% increase in systemic proteolysis during acute cold exposure in fasted mice. This liberation of amino acids from protein was likely driven at least in part by the liver, which uniquely showed elevated levels of almost all essential amino acids during cold exposure, and the lowest proportion of BCAAs derived from plasma. Flux of BCAAs was increased to an even greater extent by cold exposure in fed mice, driven at least in part by increased food intake. BCAA oxidation has been reported to play an important role in non-shivering thermogenesis in both BAT52 and WAT53 depots, but we find BCAA oxidation to be low in BAT and minimal in WAT. The contribution of BCAAs to the TCA cycle in BAT and WAT did increase during cold exposure in fed mice but never accounted for more than 2% of TCA cycle metabolism. BCAA oxidation may contribute to adipose tissue thermogenesis via mechanisms other than complete oxidation, e.g. by signaling via metabolites like 3-HIB, propionyl-CoA, or branched-chain fatty acids, each of which have known regulatory functions54–56. In contrast to adipose tissues, utilization of BCAAs was substantially elevated in skeletal muscle, especially the quad, during cold exposure under both fasted and feeding conditions, suggesting an important role in shivering thermogenesis.
Levels of 3-hydroxybutyrate (3HB), often suggested as an important alternative fuel source57, increased in plasma and tissues during cold exposure, and circulatory flux of 3HB was increased by cold in both fasted and fed mice. Strikingly however, BAT used minimal amounts of 3HB both at baseline and during cold exposure. Ketones are thus not an important fuel source for BAT during acute cold-induced thermogenesis. These surprising data underscore the need to perform tracing studies, rather than rely on static measures, to determine flux of metabolites. In contrast to BAT, 3HB consumption was substantial in muscle tissue, increasing to almost 10% of TCA cycle carbons in the quadriceps of cold-exposed fasted mice. Ketones may thus be an important fuel source for thermogenesis in muscle but not in BAT.
Systemic glucose flux is substantially increased during cold exposure, despite unchanged plasma levels. This is consistent with the long-established observation that cold exposure promotes glucose uptake in BAT44,58,59, which has made glucose utilization in the thermogenic response an area of particular interest and debate60. Previous experiments in mice using perturbative non-steady state bolus injections of 13C-glucose suggest that glucose may be used for various different metabolic processes in BAT61. We find here that at the systemic level, lactate production is a major fate of cold-induced glucose flux, especially in fasted animals. Tissue resolution of glycolytic flux remains a technical challenge due to the rapid kinetics of the pathway, but FDG-PET imaging studies62,63 suggest BAT is a likely driver of this glycolytic flux during cold stress.
It has also been shown that loss of the mitochondrial pyruvate carrier MPC1 impairs BAT thermogenesis64, suggesting that mitochondrial pyruvate utilization is also necessary for heat generation. Surprisingly, we find here that mitochondrial pyruvate in BAT is largely used to sustain anaplerosis of TCA cycle intermediates via pyruvate carboxylation. This reaction is likely mediated by pyruvate carboxylase, but we cannot exclude a contribution from reverse malic enzyme flux. PC flux in isolated brown adipocyte mitochondria was reported decades ago65, and more recent work using human embryonic stem cell-derived brown adipocytes demonstrated that knockout of pyruvate carboxylase causes a measurable, albeit modest, impairment in respiration66 (though the effect may have been underestimated due to non-physiologic cell culture conditions, e.g. supraphysiologic glutamine concentrations that could provide an alternative anaplerotic source). Our work considerably expands on these observations, demonstrating substantial PC flux in BAT under physiologically relevant conditions in intact and awake animals. We also quantify the fractional contribution of PC vs PDH flux to the TCA cycle in BAT in these animals, and we demonstrate that under most conditions PC flux vastly exceeds PDH flux, in sharp contrast to, for example, the diaphragm. While the functional role of such high PC flux in BAT remains unclear, it could help support amino acid synthesis necessary for thermogenic function or could be used for the synthesis and secretion of TCA cycle intermediates themselves, several of which have known autocrine, paracrine, and/or endocrine functions67. In particular, succinate has known roles in thermogenesis68 and is highly secreted by BAT69. However, these pathways alone are unlikely to account for such high PC flux. Therefore, it is likely that pyruvate carboxylation contributes to a metabolic futile cycle, e.g. pyruvate -> oxaloacetate -> malate -> pyruvate or pyruvate -> oxaloacetate -> PEP -> pyruvate, each cycle of which would consume one ATP. The engagement of malic enzyme 1 in such a cycle could also generate cytosolic NADPH to support fatty acid synthesis and another potential thermogenic futile cycle comprised of simultaneous synthesis and oxidation of fatty acids40.
Increased glucose uptake by BAT is a key feature of the thermogenic response, although it has been proposed that it does not necessarily drive the thermogenic program (for example because under certain conditions UCP1 deficient mice have impaired thermogenesis but preserved glucose uptake into BAT70,71). On the other hand, emerging evidence suggests glucose uptake in BAT may be required for cold tolerance72,73, though definitive data is lacking. We find here that under both fed and fasted conditions, cold-activated BAT incorporates glucose-derived carbons into the TCA cycle more avidly than do other tissues. Cardiac use of glucose for TCA cycle metabolism is in fact abolished upon cold exposure in fasted mice, perhaps sparing glucose for use by BAT. Finally, we find that disrupting hepatic glucose production profoundly impairs cold tolerance in fasting mice, despite the low contribution of gluconeogenic flux to overall nutrient flux and the inconsequential contribution to cold-induced increases in systemic oxidative metabolism. Our data thus indicate a uniquely important role for glucose-utilizing pathways in cold-induced thermogenesis.
Concurrent work recently reported by Park, et al.69 using arteriovenous (A/V) metabolomic profiling across the capillary bed containing interscapular BAT in mice fed ad libitum, is largely consistent with our studies. Park et al. found glucose to be the primary source of net carbon uptake in BAT, which greatly increased during cold exposure. Consistent with this, we find that glucose is the primary contributor to TCA cycle metabolism in fed mice, and cold exposure further increases this preference. We also show that, in fasted mice, fatty acids replace glucose as the primary source of TCA cycle carbons in BAT, suggesting that BAT is highly flexible with respect to fuel selection. Our studies also reveal that entry of glucose carbons into the TCA cycle occurs largely via pyruvate carboxylation (see discussion above). Interestingly, Park et al. observe only modest uptake of lipids by BAT in their A/V data, while we find that fatty acids contribute meaningfully to TCA cycle metabolism even in fed mice. This may reflect a confounding contribution to A/V measurements by fatty acids secreted by white adipose tissue that is also drained by the same venous system. Alternatively, there may be substantial fatty acid cycling in BAT with simultaneous oxidation and synthesis, as has been suggested previously40. Park et al. also find evidence in BAT for glutamine cycling, i.e. simultaneous glutaminolysis and glutamine synthesis, which is consistent with our data showing substantial contribution of glutamine carbons to the TCA cycle in BAT. Our work also identified robust changes in fuel selection across several other organs including liver and heart, and future A/V studies will be of interest to complement these data.
In summary, our work provides a comprehensive, quantitative, system-wide and tissue-specific map of the changes in metabolic flux that underlie the thermogenic response to acute cold exposure and reveals a critical role for hepatic gluconeogenesis.
Limitations of this Study
Our study was focused on mice acutely exposed to cold. Further work will be required to investigate metabolic changes following chronic adaptation to cold exposure. We also focused on six key metabolites for flux analyses, accounting for some unmeasured nutrients by extrapolation. Taken together, our data do account for most of the systemic flux and TCA cycle contributions, but flux of other less-abundant metabolites may also prove to be important during cold exposure. Finally, room temperature is below the thermoneutral zone for mice74, meaning that at baseline, the mice in these experiments were partially cold-adapted. This partial priming of BAT likely enabled a more robust assessment of acute cold-induced BAT activation. However, the metabolic landscape at thermoneutrality cannot be inferred, and it is possible results could be different if mice were adapted to thermoneutrality prior to acute cold exposure.
STAR Methods
Resource Availability
Lead Contact.
Further information and requests for resources and reagents should be directed to and will be fulfilled by the Lead Contact, Zoltan Arany (zarany@pennmedicine.upenn.edu).
Materials Availability.
This study did not generate new unique reagents.
Data and Code Availability.
Metabolomics data have been deposited at the National Metabolomics Data Repository with Study ID: ST002813.
Unprocessed source data underlying all plots and graphs is available in Data S1.
All original code is available in this paper’s supplemental information.
Any additional information required to reanalyze the data reported in this paper is available from the lead contact upon request.
Experimental Model and Study Participant Details
Unless otherwise noted, all experiments were performed using 14-15 week-old, male C57BL/6J mice ordered from the Jackson Laboratory. Liver-FBP1 knockout and control mice were generated via delivery of AAV8-Tbg-Cre or AAV8-Tbg-GFP respectively into male Fbp1flox/flox mice51; mice were allowed to recover for at least 3 weeks before beginning any experiments. Prior to experiments, all mice were housed at room temperature (~22°C) in a facility on a 12:12-hour light-dark cycle (light cycle starting at 7am) with free access to water and standard chow (LabDiet 5010). All experiments began at 9am, with 6-hour experiments concluding at 3pm. All animal studies followed protocols approved by the Institutional Animal Care and Use Committee (IACUC) at the University of Pennsylvania.
Method Details
AAV vectors and administration.
Custom AAV8 vectors used to knockout FBP1 in the liver were obtained from the Penn Vector Core at the University of Pennsylvania: AAV8:TBG.PI.Cre.rBG (AAV8-Tbg-Cre), AAV8:TBG.PI.eGFP.WPRE.bGH (AAV8-Tbg-GFP). Vectors were diluted and retro-orbitally injected into isoflurane-anesthetized mice at a dose of 1.5e11 genome copies per mouse in 50 uL saline.
Arterial plasma collection and infusion experiments.
Surgery was performed to implant two catheters into the mouse, one in the jugular vein and one in the carotid artery. Mice were anesthetized with isoflurane prior to surgery. After surgery, mice were given at least 4 days to recover before any experiments. For metabolomic analysis of arterial plasma, mice were individually housed without food or nestlets for 6 hours at room temperature (RT, ~22°C) or 4°C. At this time, without perturbing the mouse, 40 uL of blood was wasted from the arterial catheter followed by collection of blood in heparinized tubes. For infusion experiments, mice were individually housed at RT or 4°C without nestlets, with or without food, for 4-4.5 hours. An initial arterial blood sample was collected as described above, and an infusion of 13C-labeled metabolites was initiated via the jugular venous catheter using a tether and swivel system allowing for free movement by the mouse. Unless otherwise specified, all infused metabolites were universally 13C-labeled. Infusions lasted 1.5-2 hours for a total experiment time of 6 hours. Arterial blood samples were collected 30 and 0 minutes prior to infusion end. At the end of the infusion, mice were euthanized with pentobarbital followed by cervical dislocation, and tissues were rapidly freeze-clamped in liquid nitrogen. All blood was centrifuged at 4°C for 15min at 10,000 x g, and plasma was collected for downstream metabolic analysis. See Table S4 for infusion rates and concentrations.
Cold tolerance tests.
Liver-FBP1 KO and control mice aged 11-16 weeks were individually housed at 4°C either with food, without food, or without food but with drinking water containing 15% glucose. Body temperature was measured hourly via rectal thermometer. Mice were euthanized if body temperature fell by 10°C from baseline in accordance with IACUC-approved humane endpoints, and this value was used for subsequent analysis. For relevant experiments, blood glucose levels were also measured hourly via tail snip using a OneTouch Ultra glucometer.
Western blotting.
Rapidly-frozen tissue samples were lysed in 1x RIPA buffer containing protease and phosphatase inhibitors. Samples were homogenized and centrifuged, and supernatant was collected. Protein concentrations were quantified with a BCA protein assay kit. Samples were diluted to 2 mg/mL and boiled in 1x Laemmli sample buffer with 2-mercaptoethanol. 10 uL of sample was then loaded onto a 4-20% gradient Tris-glycine polyacrylamide gel (Bio-Rad) and electrophoresed (SDS-PAGE) for 90 minutes at 100 mV. The protein gel was then transferred to PVDF membrane (Millipore) for 90 minutes at 500 mA. Following transfer, membranes were blocked with 5% milk for 1 hour, washed with TBST, and then incubated with primary antibody overnight at 4°C. Membranes were then washed, incubated with HRP-conjugated secondary antibody for 1 hour, washed again, and then imaged by chemiluminescence with a digital imager.
Isolation and Quantification of RNA (RT-qPCR).
Rapidly-frozen tissue samples were lysed in TRIzol Reagent, homogenized and centrifuged, and the supernatant was incubated at room temperature for 5 minutes. 0.2 volumes of chloroform were added, and samples were mixed thoroughly and allowed to sit for 3 minutes. The aqueous phase was collected and mixed with 1 volume of 70% ethanol. Up to 700μL of sample was added to an RNeasy mini column (Qiagen) which was centrifuged for 30 seconds at 8,000 x g. The column was washed and the sample was eluted per the RNeasy mini column protocol. Samples were diluted to the same concentration, and cDNA was generated using High Capacity cDNA Reverse Transcription kit (ThermoFischer). RT-qPCR was performed on cDNA using SYBR Green and selected primers.
36B4 (GGAGCCAGCGAGGCCACACTGCTG, CTGGCCACGTTGCGGACACCCTCC)
Gapdh (AGGTCGGTGTGAACGGATTTG, TGTAGACCATGTAGTTGAGGTCA)
Bcat2 (CTCATCCTGCGCTTCCAG, TCACACCCGAAACATCCAATC)
Bckdha (ATCTACCGTGTCATGGACCG, ATGGTGTTGAGCAGCGTCAT)
Bckdhb (AGCTATTGCGGAAATCCAGTTT, ACAGTTGAAAAGATCACCTGAGC)
Dbt (AGACTGACCTGTGTTCGCTAT, GAGTGACGTGGCTGACTGTA)
Dld (GAGCTGGAGTCGTGTGTACC, CCTATCACTGTCACGTCAGCC)
Bckdk (ACATCAGCCACCGATACACAC, GAGGCGAACTGAGGGCTTC)
Ppm1k (ATGTTATCAGCGGCCTTCATTAC, GTGGAGAAGTAGCAGGCAGG)
Fatp1 (TCAATGTACCAGGAATTACAGAAGG, GAGTGAGAAGTCGCCTGCAC)
Fatp4 (ACTGTTCTCCAAGCTAGTGCT, GATGAAGACCCGGATGAAACG)
Acsl1 (TGCCAGAGCTGATTGACATTC, GGCATACCAGAAGGTGGTGAG)
Acsl3 (CCAGCCATTGTTCATGGACTG, TGGGACCAAAGAGACTATTTCCT)
Acsl5 (TCCTGACGTTTGGAACGGC, CTCCCTCAATCCCCACAGAC)
Fabp2 (GTGGAAAGTAGACCGGAACGA, CCATCCTGTGTGATTGTCAGTT)
Fabp4 (GGGGCCAGGCTTCTATTCC, GGAGCTGGGTTAGGTATGGG)
Fabp5 (TGAAAGAGCTAGGAGTAGGACTG, CTCTCGGTTTTGACCGTGATG)
Cd36 (GGCACAGACGCAGCCTCCTTTCCACC, GGTGATGCAAAGGCATTGGCTGG)
VCO2 Measurements.
Mice were placed with or without food for 6 hours in CLAMS (Columbus Instruments) metabolic cages housed within environment-controlled incubators set to 22°C (RT) or 4°C. VCO2 measurements over the last 60 minutes of the experiment were averaged. Measurements were converted to nmol C/min/g using the ideal gas law PV=nRT. Samples sizes were RT (n=4) and 4°C (n=3) for fasted animals and n=5 per group for fed animals.
Liver Glycogen Measurements.
Liver glycogen content was determined as previously described75,76. Briefly, 2 rapidly-frozen liver samples (~10 mg each) were homogenized in 30 uL/mg of 2 M HCl or NaOH. Samples were boiled at 100°C for 5 minutes and cooled to room temperature before neutralization with equal volumes of 2 M NaOH or HCl. Neutralized samples were centrifuged at 16,000 x g for 10 minutes at 4°C, and supernatants were transferred to new tubes for glucose quantification by hexokinase-coupled enzymatic assay (Sigma Glucose HK kit) per manufacturer’s protocol. Glycogen content was determined by calculating the glucose levels in acid-hydrolyzed samples (glycogen-liberated glucose + free glucose) and subtracting the glucose levels in the base-homogenized samples (free glucose).
Water Soluble Metabolite Extraction of Plasma.
For extraction of water-soluble metabolites from plasma samples, 150-200 μl of extraction solution (methanol or 40:40:20 methanol:acetonitrile:water) was added to 5 μl plasma. This mixture was incubated on ice for 10 minutes, then centrifuged at 17,000g for 10 minutes at 4°C. The supernatant was transferred to an MS vial to run on LCMS.
Water Soluble Metabolite Extraction of Tissues.
For extraction of water-soluble metabolites from tissue samples, frozen tissues were first ground to a powder using a cryomill (Restch, Newtown, PA). Extraction solution kept on ice (40:40:20 methanol:acetonitrile:water) was added to ~10 mg of ground tissue (40 μl solution per mg tissue), vortexed, and kept on ice for 10 minutes, then centrifuged at 17,000g for 10 minutes at 4°C. The supernatant was collected and centrifuged again at the same speed for 10 minutes, and this second supernatant was transferred to an MS vial to run on LCMS.
Lipid Extraction of Plasma.
For extraction of hydrophobic metabolites (lipids) from plasma samples, 120 μl of isopropanol kept on dry ice was added to 3 μl plasma. This mixture was vortexed for 10 seconds and kept on dry ice for 10 minutes, then centrifuged at 17,000g for 10 minutes at 4°C. The supernatant was loaded into glass inserts in an MS vial to run on LCMS.
Water Soluble Metabolite Quantification by Liquid Chromatograph-Mass Spectrometry (LC-MS).
Water soluble metabolites were measured on a quadrupole orbitrap mass spectrometer (Q Exactive, Q Exactive Plus, Exploris 240, or Exploris 480) coupled to a Vanquish UHPLC system (Thermo Fisher Scientific) with electrospray ionization and scan range m/z between 60 and 1000 at 1 Hz, with at least a 140,000 resolution. LC separation was performed on an XBridge BEH Amide column (2.1x150 mm, 2.5 μm particle size, 130 Å pore size; Waters Corporation) using a gradient of solvent A (95:5 water: acetonitrile with 20 mM of ammonium acetate and 20 mM of ammonium hydroxide, pH 9.45) and solvent B (acetonitrile). Flow rate was 150 μl/min. Example LC gradient: 0 min, 85% B; 2 min, 85% B; 3 min, 80% B; 5 min, 80% B; 6 min, 75% B; 7 min, 75% B; 8 min, 70% B; 9 min, 70% B; 10 min, 50% B; 12 min, 50% B; 13 min, 25% B; 16 min, 25% B; 18 min, 0% B; 23 min, 0% B; 24 min, 85% B; and 30 min, 85% B. Injection volume was 5-10 μl and autosampler temperature was set at 4°C. Untargeted metabolomics data from arterial plasma samples was generated using both negative and positive ion mode. All other data was generated using negative ion mode.
Lipid Quantification by LC-MS.
Triglycerides and other lipids were measured on a Q Exactive Plus mass spectrometer coupled to a Vanquish UHPLC system (Thermo Fisher Scientific) using positive-mode electrospray ionization. The LC separation was achieved on an Agilent Poroshell 120 EC-C18 column (150 × 2.1mm, 2.7 μm particle size) at a flow rate of 150 μl per minute. The gradient was 0 minutes, 25% B; 2 minutes, 25% B; 4 minutes, 65% B; 16 minutes, 100% B; 20 minutes, 100% B; 21 minutes, 25% B; 27 minutes, 25% B. Solvent A is 1mM ammonium acetate + 0.2% acetic acid in water:methanol (90:10). Solvent B is 1 mM ammonium acetate + 0.2% acetic acid in methanol:2-propanol (2:98). Untargeted metabolomics data from arterial plasma samples was generated using both negative and positive ion mode. All other data was generated using negative ion mode.
Quantification and Statistical Analysis.
Metabolomic Analysis.
Data were analyzed in R, and statistical analyses used were unpaired two-tailed t-tests with FDR-adjustment for multiple hypothesis testing. Arterial plasma metabolomics data was normalized to metabolite mean, and resultant values were then normalized to sample run median prior to statistical analyses. All data was normalized to mean of room temperature samples.
Circulatory and Interconverting Flux Calculations.
Calculations of circulatory flux and interconverting flux values were performed as previously described31. In brief, for infusion of uniformly 13C-labeled metabolite X, flux values are defined as:
where R is the rate of infusion, C is the number of carbon atoms in metabolite X, is the fraction of metabolite X that is of the labeled form , and
Interconverting fluxes were calculated as follows:
where and are the fraction of labeled carbons in metabolites Y and X during the infusion of uniformly 13C-labeled metabolite X as defined above. Direct contribution of each metabolite to other metabolites is then calculated by setting up the follow set of linear equations
where is the fraction of k derived directly from i, M is the square matrix such that entry (X, Y) represents , and is the submatrix of M with both the row and column corresponding to k removed. Direct contributions were then calculated by performing an optimization procedure conditional on non-negative values by finding with respect to f such that . Standard error was estimated using a bootstrapping method (n=100 simulations) by selecting values for M and L from normal distributions with means and standard deviations equal to calculated values for those parameters based on measured data. Interconverting fluxes were then calculated as:
where is the total circulatory carbon flux corrected for carbon cycling using the factor 31:
Optimization, carbon cycling correction, and calculation of interconverting fluxes with standard errors were performed in MatLab using published code (Flux_CircMet).
Since contributions of other nutrients to glycerol were not measured, glycerol was not able to be included in the optimization analysis. There is minimal flux between glycerol and other nutrients with the exception of glycerol-to-glucose flux31, and all glycerol flux can be explained by flux to glucose (Figure S4F), suggesting there is minimal indirect gluconeogenic flux from glycerol. As such, this flux was calculated as: .
End-Product Flux.
We define end-product flux as the total corrected circulatory carbon flux that cannot be accounted for by the generation of other measured metabolites:
Standard errors were calculated as:
Nutrient Contributions to TCA Cycle.
For each tissue, total nutrient contributions to the TCA cycle were calculated by measuring the normalized labeling of malate, succinate, and glutamate (which is in equilibrium with a-ketoglutarate but is more easily measured) by each infused metabolite, as defined above, and calculating the mean, to give
Direct contributions were then calculated by setting up the system of linear equations,
where M is defined as above. Direct contributions and standard errors were once again calculated by optimization conditional on non-negative values and bootstrapping analysis as previously described31 using published MatLab code (Flux_CircMet). For some experiments, only malate and glutamate were used to calculated TCA cycle labeling.
Total Fatty Acid and Protein-Liberated Amino Acid Flux Calculations.
End-product flux of fatty acids and total fatty acid flux to glucose were calculated by dividing relevant flux values using palmitate by the published ratio (0.2111)31 of circulatory palmitate flux to the sum of the circulatory flux values for palmitate, oleate, and lineolate, which together represent the vast majority of whole-body fatty acids15. Direct contribution of total fatty acids to the TCA cycle were calculated by dividing the measured contribution of palmitate by the published ratios of palmitate contribution to the sum of the contributions of palmitate, oleate, and linoleate for BAT (0.3092), heart (0.2806), liver (0.2081), quad and diaphragm (muscle: 0.1751), and WAT (0.1562), respectively31. Total end-product flux of protein-liberated amino acids was calculated by dividing the flux of BCAAs (which are essential amino acids and therefore can only be produced by dietary or endogenous protein breakdown) by the proportion of BCAAs in protein (0.18)32.
Determination of Carbon Flux from Dietary Fuel.
Carbon flux from dietary fuel was calculated based on the measured food consumption over 6 hours at either RT or 4°C by estimating the average number of carbons per gram consumed of protein (0.04), fat (0.064), and sugar (0.033) and the portion of food that is composed of metabolizable protein, fat (ether extract), and carbohydrates (nitrogen-free extract) per the diet product sheet (LabDiet). Total flux was calculated by taking the sum of the three.
Determination of PC vs PDH Flux using U-13C-Glucose.
Determination of PC Flux using 3-13C-Glucose.
To calculate the fraction of malate generated by glucose-derived pyruvate carboxylation, M+1 fractional enrichment of malate was measured following steady-state infusion of 3-13C-glucose in ad libitum fed mice housed at room temperature. This was then normalized to M+1 fractional enrichment of glucose in the plasma and multiplied by 2 because 3-13C-glucose generates a 1:1 mix of M+1 (labeled) and M+0 (unlabeled) pyruvate:
Additional Statistical Analyses.
Unless otherwise noted, data were analyzed using GraphPad Prism and are presented as mean ± standard error. P-values were calculated using unpaired, two-tailed t-tests, with significance defined as *p<0.05, **p<0.01, ***p<0.001, ***p<0.0001. Increases in flux values during cold exposure (cold-induced fluxes) were calculated as the difference between flux at 4°C and flux at RT, with standard error calculated as the square root of the sum of the squared standard errors for each flux value. Comparisons to total flux or calculations of percent of total flux use (for glycerol) or (for all other nutrients) as the measure of total flux.
Supplementary Material
Data S1. Unprocessed source data underlying all plots and graphs, related to Figures 2, 3, 4, 5, 6 and Supplemental Figures 3, 4, 5, 6.
Table S1 – Arterial Metabolomics Data, related to Figure 1.
Table S2 – Tissue Metabolomics Data, related to Figure 1.
Key resources table
| REAGENT or RESOURCE | SOURCE | IDENTIFIER |
|---|---|---|
| Antibodies | ||
| Anti-FBP1 antibody produced in rabbit | MilliporeSigma | Cat# HPA005857 |
| Anti-PCK1/PEPC antibody | Abcam | Cat# ab70358 |
| Rabbit anti-BCKDHA antibody | Bethyl | Cat# A303-790A |
| Rabbit anti-BCKDHA, Phospho (S292) antibody | Bethyl | Cat# A304-672A |
| Anti-14-3-3 antibody | Cell Signaling Technology | Cat# 8312S |
| Anti-B-actin rabbit antibody | Cell Signaling Technology | Cat# 4970S |
| Anti-rabbit IgG, HRP-linked Antibody | Cell Signaling Technology | Cat# 7074S |
| Bacterial and virus strains | ||
| Biological samples | ||
| Chemicals, peptides, and recombinant proteins | ||
| D-GLUCOSE (U-13C6, 99%) | Cambridge Isotope Laboratories | Cat# CLM-1396-5 |
| SODIUM L-LACTATE (13C3, 98%) 20% W/W in H2O | Cambridge Isotope Laboratories | Cat# CLM-1579-PK |
| L-GLUTAMINE (13C5, 99%) | Cambridge Isotope Laboratories | Cat# CLM-1822-H-0.1 |
| L-LEUCINE (13C6, 99%) | Cambridge Isotope Laboratories | Cat# CLM-2262-H-0.25 |
| L-VALINE (13C5, 99%) | Cambridge Isotope Laboratories | Cat# CLM-2249-H-0.25 |
| L-ISOLEUCINE (13C6, 99%) | Cambridge Isotope Laboratories | Cat# CLM-2248-H-PK |
| SODIUM PALMITATE (U-13C16, 98%+) | Cambridge Isotope Laboratories | Cat# CLM-6059-1 |
| SODIUM D-3-HYDROXYBUTYRATE (13C4, 99%) | Cambridge Isotope Laboratories | Cat# CLM-3853-0.5 |
| GLYCEROL (13C3, 99%) | Cambridge Isotope Laboratories | Cat# CLM-1510-1 |
| D-GLUCOSE (3-13C, 99%) | Cambridge Isotope Laboratories | Cat# CLM-1393-0.5 |
| D-(+)-Glucose, anhydrous, 99% | ThermoFisher Scientific | Cat# A16828 |
| RIPA Buffer, 2x Solution | Research Products International | Cat# R26200 |
| cOmplete Mini, EDTA-free Protease inhibitor cocktail | Roche | Cat# 11836170001 |
| Phosstop – phosphatase inhibitor tablets | Roche | Cat# 04906837001 |
| 2-Mercaptoethanol | Bio-Rad | Cat# 1610710 |
| 4x Laemmli Sample Buffer | Bio-Rad | Cat# 1610747 |
| TRIzol Reagent | Invitrogen | Cat# 15596026 |
| Critical commercial assays | ||
| Glucose (HK) Assay Kit | MilliporeSigma | Cat# GAHK20 |
| Pierce BCA Porotein Assay Kit | ThermoFischer Scientific | Cat# 23227 |
| RNeasy Mini Kit | Qiagen | Cat# 74104 |
| High Capacity cDNA Reverse Transcription kit | ThermoFischer Scientific | Cat# 4368814 |
| Deposited data | ||
| Metabolomics Data | This paper | NMDR StudyID ST002813 |
| Data S1: Source data underlying plots and figures | This paper | N/A |
| Experimental models: Cell lines | ||
| Experimental models: Organisms/strains | ||
| Mouse: C57BL/6J | The Jackson Laboratory | Cat# 000664 |
| Mouse: Fbp1flox/flox | Laboratory of M. Celeste Simon | N/A |
| Oligonucleotides | ||
| Primers for RT-qPCR, see Method Details | This paper | N/A |
| Recombinant DNA | ||
| Software and algorithms | ||
| El-MAVEN software | Elucidata | https://resources.elucidata.io/elmaven |
| R, version 4.2.2 | CRAN | https://cran.r-project.org/ |
| MatLab R2022b | MathWorks | https://www.mathworks.com/products/matlab.html |
| Graphpad Prism | Graphpad Prism | https://www.graphpad.com/scientific-software/prism/ |
| Accucor | GitHub | https://github.com/XiaoyangSu/AccuCor |
| Flux_CircMet | GitHub | https://github.com/tonyshenghui/Flux_CircMet |
| Other | ||
| Digi-Sense Temp-10 Single-Input Type T Thermocouple | Cole-Parmer | Cat# EW-91428-02 |
| Mice, 3/4” L .028dia. .065 tip Rectal Probe | Braintree Scientific | Cat# RET-3 |
Highlights:
Comprehensive isotope tracer studies quantify cold-induced metabolic flux changes
BAT fuels TCA cycle flux with glucose during feeding and fatty acids during fasting
Pyruvate carboxylation is a major metabolic fate for glucose in BAT
Liver gluconeogenesis is required to maintain cold tolerance in fasted mice
Acknowledgements
We thank Celeste Simon for sharing the FBP1flox/flox mice. MRB was supported by NIH (2T32DK007314-41, 1F30DK131829-01A1). ZA was supported by NIH (DK107667, DK135958). We also thank the Penn Vector Core at the University of Pennsylvania for the production of the custom AAV8 vectors, and the Metabolomics Core of the University of Pennsylvania Diabetes Research Center (NIH DK19525). Several figures were created with BioRender.com.
Footnotes
Publisher's Disclaimer: This is a PDF file of an unedited manuscript that has been accepted for publication. As a service to our customers we are providing this early version of the manuscript. The manuscript will undergo copyediting, typesetting, and review of the resulting proof before it is published in its final form. Please note that during the production process errors may be discovered which could affect the content, and all legal disclaimers that apply to the journal pertain.
Declaration of Interests
The authors declare no competing interests.
References
- 1.Oelkrug R, Polymeropoulos ET, and Jastroch M (2015). Brown adipose tissue: physiological function and evolutionary significance. J. Comp. Physiol. B Biochem. Syst. Environ. Physiol 185, 587–606. 10.1007/s00360-015-0907-7. [DOI] [PubMed] [Google Scholar]
- 2.Hayes JP, and Garland Jnr T (1995). The evolution of endothermy: Testing the aerobic capacity model. Evolution (N. Y) 49, 836–847. 10.1111/j.1558-5646.1995.tb02320.x. [DOI] [PubMed] [Google Scholar]
- 3.Nakamura K, and Morrison SF (2008). A thermosensory pathway that controls body temperature. Nat. Neurosci 11, 62–71. 10.1038/nn2027. [DOI] [PMC free article] [PubMed] [Google Scholar]
- 4.Commission IT (2003). Glossary of terms for thermal physiology. J. Therm. Biol 28, 75–106. 10.1152/jappl.1973.35.6.941. [DOI] [Google Scholar]
- 5.Yoneshiro T, Aita S, Matsushita M, Kayahara T, Kameya T, Kawai Y, Iwanaga T, and Saito M (2013). Recruited brown adipose tissue as an antiobesity agent in humans. J. Clin. Invest 123, 3404–3408. 10.1172/JCI67803. [DOI] [PMC free article] [PubMed] [Google Scholar]
- 6.Cypess AM, and Kahn CR (2010). Brown fat as a therapy for obesity and diabetes. Curr. Opin. Endocrinol. Diabetes Obes 17, 143–149. 10.1097/MED.0b013e328337a81f. [DOI] [PMC free article] [PubMed] [Google Scholar]
- 7.Haman F, and Blondin DP (2017). Shivering thermogenesis in humans: Origin, contribution and metabolic requirement. Temperature 4, 217–226. 10.1080/23328940.2017.1328999. [DOI] [PMC free article] [PubMed] [Google Scholar]
- 8.CANNON B, and NEDERGAARD J (2004). Brown Adipose Tissue: Function and Physiological Significance. Physiol. Rev 84, 277–359. 10.1152/physrev.00015.2003. [DOI] [PubMed] [Google Scholar]
- 9.Weir G, Ramage LE, Akyol M, Rhodes JK, Kyle CJ, Fletcher AM, Craven TH, Wakelin SJ, Drake AJ, Gregoriades M-LL, et al. (2018). Substantial Metabolic Activity of Human Brown Adipose Tissue during Warm Conditions and Cold-Induced Lipolysis of Local Triglycerides. Cell Metab. 27, 1348–1355.e4. 10.1016/j.cmet.2018.04.020. [DOI] [PMC free article] [PubMed] [Google Scholar]
- 10.Fedorenko A, Lishko PV, and Kirichok Y (2012). Mechanism of fatty-acid-dependent UCP1 uncoupling in brown fat mitochondria. Cell 151, 400–413. 10.1016/j.cell.2012.09.010. [DOI] [PMC free article] [PubMed] [Google Scholar]
- 11.Kazak L, Chouchani ET, Jedrychowski MP, Erickson BK, Shinoda K, Cohen P, Vetrivelan R, Lu GZ, Laznik-Bogoslavski D, Hasenfuss SC, et al. (2015). A Creatine-Driven Substrate Cycle Enhances Energy Expenditure and Thermogenesis in Beige Fat. Cell 163, 643–655. 10.1016/j.cell.2015.09.035. [DOI] [PMC free article] [PubMed] [Google Scholar]
- 12.Haman F. (2006). Shivering in the cold: From mechanisms of fuel selection to survival. J. Appl. Physiol 100, 1702–1708. 10.1152/japplphysiol.01088.2005. [DOI] [PubMed] [Google Scholar]
- 13.Townsend KL, and Tseng YH (2014). Brown fat fuel utilization and thermogenesis. Trends Endocrinol. Metab 25, 168–177. 10.1016/j.tem.2013.12.004. [DOI] [PMC free article] [PubMed] [Google Scholar]
- 14.McNeill BT, Morton NM, and Stimson RH (2020). Substrate Utilization by Brown Adipose Tissue: What’s Hot and What’s Not? Front. Endocrinol. (Lausanne) 11, 1–8. 10.3389/fendo.2020.571659. [DOI] [PMC free article] [PubMed] [Google Scholar]
- 15.Zhang Z, TeSlaa T, Xu X, Zeng X, Yang L, Xing G, Tesz GJ, Clasquin MF, and Rabinowitz JD (2021). Serine catabolism generates liver NADPH and supports hepatic lipogenesis. Nat. Metab 3, 1608–1620. 10.1038/s42255-021-00487-4. [DOI] [PMC free article] [PubMed] [Google Scholar]
- 16.Mechoulam R, Ben-Shabat S, Hanus L, Ligumsky M, Kaminski NE, Schatz AR, Gopher A, Almog S, Martin BR, Compton DR, et al. (1995). Identification of an endogenous 2-monoglyceride, present in canine gut, that binds to cannabinoid receptors. Biochem. Pharmacol 50, 83–90. 10.1016/0006-2952(95)00109-D. [DOI] [PubMed] [Google Scholar]
- 17.Krott LM, Piscitelli F, Heine M, Borrino S, Scheja L, Silvestri C, Heeren J, and Di Marzo V (2016). Endocannabinoid regulation in white and brown adipose tissue following thermogenic activation. J. Lipid Res 57, 464–473. 10.1194/jlr.M065227. [DOI] [PMC free article] [PubMed] [Google Scholar]
- 18.Quarta C, Bellocchio L, Mancini G, Mazza R, Cervino C, Braulke LJ, Fekete C, Latorre R, Nanni C, Bucci M, et al. (2010). CB1 Signaling in Forebrain and Sympathetic Neurons Is a Key Determinant of Endocannabinoid Actions on Energy Balance. Cell Metab. 11, 273–285. 10.1016/j.cmet.2010.02.015. [DOI] [PubMed] [Google Scholar]
- 19.Silvestri C, and Di Marzo V (2013). The endocannabinoid system in energy homeostasis and the etiopathology of metabolic disorders. Cell Metab. 17, 475–490. 10.1016/j.cmet.2013.03.001. [DOI] [PubMed] [Google Scholar]
- 20.Whitehead A, Krause FN, Moran A, MacCannell ADV, Scragg JL, McNally BD, Boateng E, Murfitt SA, Virtue S, Wright J, et al. (2021). Brown and beige adipose tissue regulate systemic metabolism through a metabolite interorgan signaling axis. Nat. Commun 12, 1–21. 10.1038/s41467-021-22272-3. [DOI] [PMC free article] [PubMed] [Google Scholar]
- 21.Nilsen MS, Jersin RÅ, Ulvik A, Madsen A, McCann A, Svensson P-A, Svensson MK, Nedrebø BG, Gudbrandsen OA, Tell GS, et al. (2020). 3-Hydroxyisobutyrate, A Strong Marker of Insulin Resistance in Type 2 Diabetes and Obesity That Modulates White and Brown Adipocyte Metabolism. Diabetes 69, 1903–1916. 10.2337/db19-1174. [DOI] [PMC free article] [PubMed] [Google Scholar]
- 22.Xu WY, Shen Y, Zhu H, Gao J, Zhang C, Tang L, Lu SY, Shen CL, Zhang HX, Li Z, et al. (2019). 2-Aminoadipic acid protects against obesity and diabetes. J. Endocrinol 243, 111–123. 10.1530/JOE-19-0157. [DOI] [PubMed] [Google Scholar]
- 23.Haman F, Péronnet F, Kenny GP, Massicotte D, Lavoie C, Scott C, and Weber JM (2002). Effect of cold exposure on fuel utilization in humans: Plasma glucose, muscle glycogen, and lipids. J. Appl. Physiol 93, 77–84. 10.1152/japplphysiol.00773.2001. [DOI] [PubMed] [Google Scholar]
- 24.Shin H, Ma Y, Chanturiya T, Cao Q, Wang Y, Anil KG, Jackson R, Rumore D, Xue B, and Shi H (2017). Lipolysis in Brown Adipocytes Is Not Essential for Cold-Induced Thermogenesis in Mice. Cell Metab. 26, 764–777. 10.1016/j.cmet.2017.09.002.Lipolysis. [DOI] [PMC free article] [PubMed] [Google Scholar]
- 25.Schreiber R, Diwoky C, Schoiswohl G, Feiler U, Wongsiriroj N, Abdellatif M, Kolb D, Hoeks J, Kershaw EE, Sedej S, et al. (2017). Cold-Induced Thermogenesis Depends on ATGL-Mediated Lipolysis in Cardiac Muscle, but Not Brown Adipose Tissue. Cell Metab. 26, 753–763.e7. 10.1016/j.cmet.2017.09.004. [DOI] [PMC free article] [PubMed] [Google Scholar]
- 26.Nakagawa Hachiro & Nagai K. (1971). Effect of Cold-exposure in Gluconeogenesis. J. Biochem 69, 923–934. [DOI] [PubMed] [Google Scholar]
- 27.Meneghini A, Ferreira C, Abreu L.C. de, Ferreira M, Ferreira Filho C, Valenti VE, and Murad N (2008). Cold stress effects on cardiomyocytes nuclear size in rats: light microscopic evaluation. Rev. Bras. Cir. Cardiovasc 23, 530–533. 10.1590/s0102-76382008000400013. [DOI] [PubMed] [Google Scholar]
- 28.Manfredi LH, Zanon NM, Garófalo MA, Navegantes LCC, and Kettelhut IC (2013). Effect of short-term cold exposure on skeletal muscle protein breakdown in rats. J. Appl. Physiol 115, 1496–1505. 10.1152/japplphysiol.00474.2013. [DOI] [PubMed] [Google Scholar]
- 29.Lee WD, Liang L, AbuSalim J, Jankowski CSR, Samarah LZ, Neinast MD, and Rabinowitz JD (2023). Impact of acute stress on murine metabolomics and metabolic flux. Proc. Natl. Acad. Sci 120, 2017. 10.1073/pnas.2301215120. [DOI] [PMC free article] [PubMed] [Google Scholar]
- 30.Bartman CR, TeSlaa T, and Rabinowitz JD (2021). Quantitative flux analysis in mammals. Nat. Metab 3, 896–908. 10.1038/s42255-021-00419-2. [DOI] [PMC free article] [PubMed] [Google Scholar]
- 31.Hui S, Cowan AJ, Zeng X, Yang L, TeSlaa T, Li X, Bartman C, Zhang Z, Jang C, Wang L, et al. (2020). Quantitative Fluxomics of Circulating Metabolites. Cell Metab. 32, 676–688.e4. 10.1016/j.cmet.2020.07.013. [DOI] [PMC free article] [PubMed] [Google Scholar]
- 32.Neinast M, Murashige D, and Arany Z (2019). Branched Chain Amino Acids. Annu. Rev. Physiol 81, 139–164. 10.1146/annurev-physiol-020518-114455. [DOI] [PMC free article] [PubMed] [Google Scholar]
- 33.Hui S, Ghergurovich JM, Morscher RJ, Jang C, Teng X, Lu W, Esparza LA, Reya T, Zhan L, Yanxiang Guo J, et al. (2017). Glucose feeds the TCA cycle via circulating lactate. Nature 551, 115–118. 10.1038/nature24057. [DOI] [PMC free article] [PubMed] [Google Scholar]
- 34.Ellis JM, Li LO, Wu PC, Koves TR, Ilkayeva O, Stevens RD, Watkins SM, Muoio DM, and Coleman RA (2010). Adipose Acyl-CoA synthetase-1 directs fatty acids toward β-oxidation and is required for cold thermogenesis. Cell Metab. 12, 53–64. 10.1016/j.cmet.2010.05.012. [DOI] [PMC free article] [PubMed] [Google Scholar]
- 35.Lee J, Ellis JM, and Wolfgang MJ (2015). Adipose fatty acid oxidation is required for thermogenesis and potentiates oxidative stress-induced inflammation. Cell Rep. 10, 266–279. 10.1016/j.celrep.2014.12.023. [DOI] [PMC free article] [PubMed] [Google Scholar]
- 36.Schuler AM, Gower BA, Matern D, Rinaldo P, Vockley J, and Wood PA (2005). Synergistic heterozygosity in mice with inherited enzyme deficiencies of mitochondrial fatty acid β-oxidation. Mol. Genet. Metab 85, 7–11. 10.1016/j.ymgme.2004.09.006. [DOI] [PubMed] [Google Scholar]
- 37.Guerra C, Koza RA, Walsh K, Kurtz DM, Wood PA, and Kozak LP (1998). Abnormal nonshivering thermogenesis in mice with inherited defects of fatty acid oxidation. J. Clin. Invest 102, 1724–1731. 10.1172/JCI4532. [DOI] [PMC free article] [PubMed] [Google Scholar]
- 38.Tolwani RJ, Hamm DA, Tian L, Sharer JD, Vockley J, Rinaldo P, Matern D, Schoeb TR, and Wood PA (2005). Medium-chain acyl-CoA dehydrogenase deficiency in gene-targeted mice. PLoS Genet. 1, 0205–0212. 10.1371/journal.pgen.0010023. [DOI] [PMC free article] [PubMed] [Google Scholar]
- 39.Gonzalez-Hurtado E, Lee J, Choi J, and Wolfgang MJ (2018). Fatty acid oxidation is required for active and quiescent brown adipose tissue maintenance and thermogenic programing. Mol. Metab 7, 45–56. 10.1016/j.molmet.2017.11.004. [DOI] [PMC free article] [PubMed] [Google Scholar]
- 40.Sanchez-Gurmaches J, Tang Y, Jespersen NZ, Wallace M, Martinez Calejman C, Gujja S, Li H, Edwards YJK, Wolfrum C, Metallo CM, et al. (2018). Brown Fat AKT2 Is a Cold-Induced Kinase that Stimulates ChREBP-Mediated De Novo Lipogenesis to Optimize Fuel Storage and Thermogenesis. Cell Metab. 27, 195–209.e6. 10.1016/j.cmet.2017.10.008. [DOI] [PMC free article] [PubMed] [Google Scholar]
- 41.Greco-Perotto R, Zaninetti D, Assimacopoulos-Jeannet F, Bobbioni E, and Jeanrenaud B (1987). Stimulatory effect of cold adaptation on glucose utilization by brown adipose tissue. Relationship with changes in the glucose transporter system. J. Biol. Chem 262, 7732–7736. 10.1016/s0021-9258(18)47629-6. [DOI] [PubMed] [Google Scholar]
- 42.Virtanen KA, Lidell ME, Orava J, Heglind M, Westergren R, Niemi T, Taittonen M, Laine J, Savisto N, Enerbäck S, et al. (2009). Functional Brown Adipose Tissue in Healthy Adults. N. Engl. J. Med 360, 1518–1525. 10.1056/NEJMoa0808949. [DOI] [PubMed] [Google Scholar]
- 43.van Marken Lichtenbelt WD, Vanhommerig JW, Smulders NM, Drossaerts JMAFL, Kemerink GJ, Bouvy ND, Schrauwen P, and Teule GJJ (2009). Cold-Activated Brown Adipose Tissue in Healthy Men. N. Engl. J. Med 360, 1500–1508. 10.1056/nejmoa0808718. [DOI] [PubMed] [Google Scholar]
- 44.Ouellet V, Richard D, Carpentier AC, Ouellet V, Labbé SM, Blondin DP, Phoenix S, Guérin B, Haman F, Turcotte EE, et al. (2012). Brown adipose tissue oxidative metabolism contributes to energy expenditure during acute cold exposure in humans. J. Clin. Invest 122, 545–552. 10.1172/JCI60433.The. [DOI] [PMC free article] [PubMed] [Google Scholar]
- 45.Saito M, Okamatsu-Ogura Y, Matsushita M, Watanabe K, Yoneshiro T, Nio-Kobayashi J, Iwanaga T, Miyagawa M, Kameya T, Nakada K, et al. (2009). High incidence of metabolically active brown adipose tissue in healthy adult humans: Effects of cold exposure and adiposity. Diabetes 58, 1526–1531. 10.2337/db09-0530. [DOI] [PMC free article] [PubMed] [Google Scholar]
- 46.Chen KY, Cypess AM, Laughlin MR, Haft CR, Hu HH, Bredella MA, Enerbäck S, Kinahan PE, Lichtenbelt W. van M., Lin FI, et al. (2016). Brown Adipose Reporting Criteria in Imaging STudies (BARCIST 1.0): Recommendations for Standardized FDG-PET/CT Experiments in Humans. Cell Metab. 24, 210–222. 10.1016/j.cmet.2016.07.014. [DOI] [PMC free article] [PubMed] [Google Scholar]
- 47.Smith OLK, and Davidson SB (1982). Shivering thermogenesis and glucose uptake by muscles of normal or diabetic rats. Am. J. Physiol. - Regul. Integr. Comp. Physiol 11. 10.1152/ajpregu.1982.242.1.r109. [DOI] [PubMed] [Google Scholar]
- 48.Blondin DP, Labbé SM, Phoenix S, Guérin B, Turcotte é.E., Richard D, Carpentier AC, and Haman F (2015). Contributions of white and brown adipose tissues and skeletal muscles to acute cold-induced metabolic responses in healthy men. J. Physiol 593, 701–714. 10.1113/jphysiol.2014.283598. [DOI] [PMC free article] [PubMed] [Google Scholar]
- 49.Jang C, Chen L, and Rabinowitz JD (2018). Metabolomics and Isotope Tracing. Cell 173, 822–837. 10.1016/j.cell.2018.03.055. [DOI] [PMC free article] [PubMed] [Google Scholar]
- 50.Wang Y, Kwon H, Su X, and Wondisford FE (2020). Glycerol not lactate is the major net carbon source for gluconeogenesis in mice during both short and prolonged fasting. Mol. Metab 31, 36–44. 10.1016/j.molmet.2019.11.005. [DOI] [PMC free article] [PubMed] [Google Scholar]
- 51.Li F, Huangyang P, Burrows M, Guo K, Riscal R, Godfrey J, Lee KE, Lin N, Lee P, Blair IA, et al. (2020). FBP1 loss disrupts liver metabolism and promotes tumourigenesis through a hepatic stellate cell senescence secretome. Nat. Cell Biol 22, 728–739. 10.1038/s41556-020-0511-2.FBP1. [DOI] [PMC free article] [PubMed] [Google Scholar]
- 52.Yoneshiro T, Wang Q, Tajima K, Matsushita M, Maki H, Igarashi K, Dai Z, White PJ, McGarrah RW, Ilkayeva OR, et al. (2019). BCAA catabolism in brown fat controls energy homeostasis through SLC25A44. Nature 572, 614–619. 10.1038/S41586-019-1503-x. [DOI] [PMC free article] [PubMed] [Google Scholar]
- 53.Ma QX, Zhu WY, Lu XC, Jiang D, Xu F, Li JT, Zhang L, Wu YL, Chen ZJ, Yin M, et al. (2022). BCAA–BCKA axis regulates WAT browning through acetylation of PRDM16. Nat. Metab 4, 106–122. 10.1038/s42255-021-00520-6. [DOI] [PubMed] [Google Scholar]
- 54.Jang C, Oh SF, Wada S, Rowe GC, Liu L, Chan MC, Rhee J, Hoshino A, Kim B, Ibrahim A, et al. (2016). A branched-chain amino acid metabolite drives vascular fatty acid transport and causes insulin resistance. Nat. Med 22, 421–426. 10.1038/nm.4057. [DOI] [PMC free article] [PubMed] [Google Scholar]
- 55.Xu Y, Jiang H, Li L, Chen F, Liu Y, Zhou M, Wang J, Jiang J, Li X, Fan X, et al. (2020). Branched-Chain Amino Acid Catabolism Promotes Thrombosis Risk by Enhancing Tropomodulin-3 Propionylation in Platelets. Circulation, 49–64. 10.1161/CIRCULATIONAHA.119.043581. [DOI] [PubMed] [Google Scholar]
- 56.Czumaj A, Śledziński T, and Mika A (2022). Branched-Chain Fatty Acids Alter the Expression of Genes Responsible for Lipid Synthesis and Inflammation in Human Adipose Cells. Nutrients 14. 10.3390/nu14112310. [DOI] [PMC free article] [PubMed] [Google Scholar]
- 57.Puchalska P, and Crawford PA (2019). Multi-dimensional roles of ketone bodies. Physiol. Behav 176, 139–148. 10.1016/j.cmet.2016.12.022.Multi-dimensional. [DOI] [PMC free article] [PubMed] [Google Scholar]
- 58.Olsen JM, Sato M, Dallner OS, Sandström AL, Pisani DF, Chambard JC, Amri EZ, Hutchinson DS, and Bengtsson T (2014). Glucose uptake in brown fat cells is dependent on mTOR complex 2-promoted GLUT1 translocation. J. Cell Biol 207, 365–374. 10.1083/jcb.201403080. [DOI] [PMC free article] [PubMed] [Google Scholar]
- 59.Orava J, Nuutila P, Lidell ME, Oikonen V, Noponen T, Viljanen T, Scheinin M, Taittonen M, Niemi T, Enerbäck S, et al. (2011). Different metabolic responses of human brown adipose tissue to activation by cold and insulin. Cell Metab. 14, 272–279. 10.1016/j.cmet.2011.06.012. [DOI] [PubMed] [Google Scholar]
- 60.Hankir MK, and Klingenspor M (2018). Brown adipocyte glucose metabolism: a heated subject. EMBO Rep. 19, 1–13. 10.15252/embr.201846404. [DOI] [PMC free article] [PubMed] [Google Scholar]
- 61.Jung SM, Doxsey WG, Le J, Haley JA, Mazuecos L, Luciano AK, Li H, Jang C, and Guertin DA (2021). In vivo isotope tracing reveals the versatility of glucose as a brown adipose tissue substrate. Cell Rep. 36, 109459. 10.1016/j.celrep.2021.109459. [DOI] [PMC free article] [PubMed] [Google Scholar]
- 62.van der Lans AAJJ, Hoeks J, Brans B, Vijgen GHEJ, Visser MGW, Vosselman MJ, Hansen J, Jörgensen JA, Wu J, Mottaghy FM, et al. (2013). Cold acclimation recruits human brown fat and increases nonshivering thermogenesis. J. Clin. Invest 123, 3395–3403. 10.1172/JCI68993. [DOI] [PMC free article] [PubMed] [Google Scholar]
- 63.Jeanguillaume C, Metrard G, Ricquier D, Legras P, Bouchet F, Lacoeuille F, Hindre F, Morel O, and Rakotonirina H (2013). Visualization of Activated BAT in Mice, with FDG-PET and Its Relation to UCP1. Adv. Mol. Imaging 03, 19–22. 10.4236/ami.2013.33004. [DOI] [Google Scholar]
- 64.Panic V, Pearson S, Banks J, Tippetts TS, Velasco-Silva JN, Lee S, Simcox J, Geoghegan G, Bensard C, Ry T. van, et al. (2020). Mitochondrial pyruvate carrier is required for optimal brown fat thermogenesis. Elife 9, 1–27. 10.7554/ELIFE.52558. [DOI] [PMC free article] [PubMed] [Google Scholar]
- 65.Cannon B, and Nedergaard J (1979). The Physiological Role of Pyruvate Carboxylation in Hamster Brown Adipose Tissue. Eur. J. Biochem 94, 419–426. 10.1111/j.1432-1033.1979.tb12909.x. [DOI] [PubMed] [Google Scholar]
- 66.Lao-On U, Cliff TS, Dalton S, and Jitrapakdee S (2021). Pyruvate carboxylase supports basal ATP-linked respiration in human pluripotent stem cell-derived brown adipocytes. Biochem. Biophys. Res. Commun 569, 139–146. 10.1016/j.bbrc.2021.06.096. [DOI] [PubMed] [Google Scholar]
- 67.Maurer J, Hoene M, and Weigert C (2021). Signals from the circle: Tricarboxylic acid cycle intermediates as myometabokines. Metabolites 11. 10.3390/metabo11080474. [DOI] [PMC free article] [PubMed] [Google Scholar]
- 68.Mills EL, Pierce KA, Jedrychowski MP, Garrity R, Winther S, Vidoni S, Yoneshiro T, Spinelli JB, Lu GZ, Kazak L, et al. (2018). Accumulation of succinate controls activation of adipose tissue thermogenesis. Nature 560, 102–106. 10.1038/S41586-018-0353-2. [DOI] [PMC free article] [PubMed] [Google Scholar]
- 69.Park G, Haley JA, Le J, Jung SM, Fitzgibbons TP, Korobkina ED, Li H, Fluharty SM, Chen Q, Spinelli JB, et al. (2023). Quantitative analysis of metabolic fluxes in brown fat and skeletal muscle during thermogenesis. Nat. Metab 10.1038/s42255-023-00825-8. [DOI] [PMC free article] [PubMed] [Google Scholar]
- 70.Hankir MK, Kranz M, Keipert S, Weiner J, Andreasen SG, Kern M, Patt M, Klöting N, Heiker JT, Brust P, et al. (2017). Dissociation between brown adipose tissue 18F-FDG uptake and thermogenesis in uncoupling protein 1-deficient mice. J. Nucl. Med 58, 1100–1103. 10.2967/jnumed.116.186460. [DOI] [PubMed] [Google Scholar]
- 71.Olsen JM, Csikasz RI, Dehvari N, Lu L, Sandström A, Öberg AI, Nedergaard J, Stone-Elander S, and Bengtsson T (2017). β3-Adrenergically induced glucose uptake in brown adipose tissue is independent of UCP1 presence or activity: Mediation through the mTOR pathway. Mol. Metab 6, 611–619. 10.1016/j.molmet.2017.02.006. [DOI] [PMC free article] [PubMed] [Google Scholar]
- 72.Albert V, Svensson K, Shimobayashi M, Colombi M, Muñoz S, Jimenez V, Handschin C, Bosch F, and Hall MN (2016). mTORC 2 sustains thermogenesis via Akt-induced glucose uptake and glycolysis in brown adipose tissue . EMBO Mol. Med 8, 232–246. 10.15252/emmm.201505610. [DOI] [PMC free article] [PubMed] [Google Scholar]
- 73.Jeong JH, Chang JS, and Jo YH (2018). Intracellular glycolysis in brown adipose tissue is essential for optogenetically induced nonshivering thermogenesis in mice. Sci. Rep 8, 1–14. 10.1038/s41598-018-25265-3. [DOI] [PMC free article] [PubMed] [Google Scholar]
- 74.Ganeshan K, and Chawla A (2017). Warming the mouse to model human diseases. Nat. Rev. Endocrinol 13, 458–465. 10.1038/nrendo.2017.48. [DOI] [PMC free article] [PubMed] [Google Scholar]
- 75.Passonneau JV, and Lauderdale VR (1974). A comparison of three methods of glycogen measurement in tissues. Anal. Biochem 60, 405–412. 10.1016/0003-2697(74)90248-6. [DOI] [PubMed] [Google Scholar]
- 76.Zhang P. (2012). Analysis of Mouse Liver Glycogen Content. Bio Protoc. 2. [Google Scholar]
Associated Data
This section collects any data citations, data availability statements, or supplementary materials included in this article.
Supplementary Materials
Data S1. Unprocessed source data underlying all plots and graphs, related to Figures 2, 3, 4, 5, 6 and Supplemental Figures 3, 4, 5, 6.
Table S1 – Arterial Metabolomics Data, related to Figure 1.
Table S2 – Tissue Metabolomics Data, related to Figure 1.
Data Availability Statement
Metabolomics data have been deposited at the National Metabolomics Data Repository with Study ID: ST002813.
Unprocessed source data underlying all plots and graphs is available in Data S1.
All original code is available in this paper’s supplemental information.
Any additional information required to reanalyze the data reported in this paper is available from the lead contact upon request.