

Abstract
Background:
Metabolic conditions may worsen asthma. There is a need to define a composite biomarker of metabolic dysfunction that has relevance to asthma outcomes.
Objective:
To determine the association of the triglyceride-glucose index (TyG), a biomarker of metabolic syndrome and insulin resistance, with risk of severe asthma exacerbation.
Methods:
A five-year retrospective cohort of patients with asthma receiving healthcare from the US Veterans Health Administration from January 1, 2015, to December 31, 2019, was constructed. Fasting TyG indices were extracted. Patients were followed for a severe asthma exacerbation, defined as an asthma-related corticosteroid prescription fill or an emergency encounter or hospitalization for asthma. Adjusted models estimated relative hazard of exacerbation associated with elevated TyG accounting for known exacerbation risk factors.
Results:
108,219 patients fulfilled study criteria. Over 286,343 person-years of follow-up, 21,467 exacerbations were identified, corresponding to a crude rate of 7.5 exacerbations/100 person-years. In exploratory analysis, we found a threshold effect at a TyG of 8.3, which was defined as elevated. In a fully adjusted model, patients with an elevated TyG had a 6% (95% confidence interval, 3%, 10%) higher hazard for severe asthma exacerbation, independent of eosinophil count, smoking, obesity, and asthma treatment intensity.
Conclusion:
Elevated TyG is a risk factor for severe asthma exacerbation independent of conventional predictors. Elevated TyG may identify patients who warrant more intensive asthma treatment and who are candidates for future clinical trials of metabolic intervention for purposes of improving asthma morbidity.
Keywords: Epidemiology, exacerbations, non-allergic asthma, metabolism, risk factors
INTRODUCTION
Metabolic comorbidities, especially dyslipidemia and diabetes, are common among individuals with asthma and associate with impaired lung function, higher respiratory symptom burden, and increased risk of disease exacerbation.1,2 These conditions co-cluster as part of the metabolic syndrome, a grouping of diseases that arise from insulin resistance and low-grade systemic inflammation.3 Treatment of metabolic dysfunction has been proposed as a novel option to improve asthma morbidity within the “treatable traits” paradigm to asthma care.4 However, determining the efficacy of this approach is hindered by an unclear definition of metabolic dysfunction, especially among pre-clinical patients without frank metabolic disease. How metabolic dysfunction can be ascertained and classified as part of an asthma treatment strategy is unknown.
The triglyceride-glucose index (TyG), calculated by a logarithmic transformation of the product of fasting glucose and triglycerides, is an epidemiologic biomarker of metabolic dysfunction that has a strong correlation with insulin resistance, metabolic syndrome, and systemic inflammation.5–7 This index is based on the rationale that glucose and lipid trafficking are regulated by insulin sensitivity and influenced by low-level metabolic inflammation. Elevated TyG predicts incident cardiovascular and cerebrovascular disease.8,9 In the general population, elevated TyG associates with respiratory symptoms and a restrictive (a.k.a. non-specific) spirometry pattern independent of body mass index and comorbid cardiovascular disease, suggesting that this biomarker is relevant in lung health.10 Whether TyG is valid within asthma and associates with disease outcomes has not been investigated.
We sought to determine the relationship between TyG and risk of severe asthma exacerbation. We hypothesized that elevated TyG would be associated with higher risk of asthma exacerbation independent of traditional risk factors for disease flare.
METHODS
Source population and cohort derivation
The source population for this study was patients who receive care from the Veterans Health Administration (VHA), a national integrated healthcare system operated by the Department of Veterans Affairs comprising of 171 VA medical centers and over 1,000 outpatient care sites. US servicemembers who separated from military duty other than dishonorably, completed time-in-service requirements, and are within income thresholds or have other special status, are eligible for VHA services; approximately 9 million veterans were enrolled as of 2019.
We examined all adults with asthma who received regular care from VHA between January 1, 2015 – December 31, 2019. This period was chosen due to relative stability in the electronic health record data structure and before secular biases attributable to the COVID-19 pandemic. Regular care was defined by the receipt of at least one episode of outpatient care per annum during the project period. This requirement established a “surveillance floor” to homogenize and optimize the likelihood that asthma-related events would be captured in the electronic health record among this population.
Asthma was defined by the presence of one inpatient or two separate-day outpatient International Classification of Diseases (ICD) code for asthma.11 We also tested a more specific definition requiring a prescription for an asthma controller in sensitivity analyses.
From this group, we isolated all patients who had a same-day measurement of triglyceride and glucose between 6 and 10 am to calculate TyG. Because fasting status is not recorded, this time caliper was utilized to increase likelihood of a fasting measurement, as validated elsewhere.12 We also examined a larger population of patients who had triglyceride and glucose measurements within four hours, irrespective of time of the day, in a subsidiary analysis.
This study was conducted with ethics approval from the Institutional Review Board of Baylor College of Medicine and the Research and Data Committee of the Michael E. DeBakey VA Medical Center.
Exposure and outcome definitions
The primary independent variable was the first TyG obtained after January 1, 2016, calculated by ln(fasting glucose×fasting triglycerides/2).5 There was little temporal variation within patients who had more than one qualifying TyG during the study period (average within-person standard deviation of 0.33), so we modeled TyG as time-invariant and recorded the first qualifying measurement for each patient.
Patients were followed from their baseline TyG measurement for the occurrence of a severe asthma exacerbation, defined as an emergency department or urgent care visit where asthma was the primary diagnosis, a hospitalization where asthma was the principal diagnosis, or a prescription for oral corticosteroids within 14 days of an outpatient visit where asthma was any diagnosis.13
Covariate definitions
For purposes of multivariable adjustment, we extracted factors which we believed would be related to TyG and the risk of severe asthma exacerbation. The selection of predictors was guided by review of existing literature of factors which may represent confounders on a causal pathway between TyG and asthma morbidity and factors which may predict asthma exacerbation.14
We measured age, sex, race, ethnicity, body mass index (BMI), statin and diabetes medication use, asthma medication use, eosinophil count, frequency of baseline exacerbation, smoking status, and all Elixhauser comorbidities based on International Classification of Diseases (ICD) code.15 Because cardiovascular disease may be especially critical confounders of the relationship to TyG and exacerbation, in addition to total Elixhauser comorbidities, we separately estimated associations with congestive heart failure, valvular disease, and arrhythmia. We applied a validated approach to identify smoking status from patient “health factors,” an ancillary data source unique to the VHA electronic health record.16 Based on data quality recommendations, BMI was smoothed by averaging at the year level. We also extracted immunoglobulin E (IgE) and hemoglobin A1c for purposes of cohort description; few individuals had these measurements and so they were not included in the analytic model. Additionally, fibrate use was not included as we did not consider it to be a confounding factor; its cohort prevalence was also rare (<2%). All factors were calculated at the time of TyG measurement, and for comorbidities, medication use, and laboratory values, based on occurrences collected in the one-year period before the TyG measurement.
Statistical analysis
Cox proportional hazards regression was used to determine whether fasting TyG was associated with severe asthma exacerbation events. Patients who did not have any events were censored on December 31, 2019, or on the day prior to death, whichever came first. We present adjusted estimates with three sequential layers of covariates, ending with a fully adjusted model including age, sex, race/ethnicity, diabetes medication use, statin medication use, asthma medication use, smoking status, BMI, comorbidities, presence of an asthma exacerbation in prior year, and eosinophil count >150 cells/uL.
We did six sensitivity analyses, (1) excluding all individuals who had an asthma exacerbation within two weeks prior to their TyG measurement to explore possible reverse causation bias by an exacerbation causing worse glycemic control, (2) excluding all individuals who were not clearly on an asthma controller at the time of TyG measurement to explore possible misclassification of asthma, (3) excluding all individuals age 65 years or older to explore possible differential misclassification of outcomes due to Medicare dual enrollment, (4) excluding all individuals who did not have an asthma flare in the preceding year to identify a more severe asthma cohort also more likely to have detection of an outcome, (5) excluding all individuals who were taking diabetes medications or statins to identify a potentially treatable population, and (6) excluding all individuals who were current or former smokers to explore possible misclassification from chronic obstructive pulmonary disease. We also tested for effect measure modification by sex, elevated eosinophil count, use of asthma controller, and having an exacerbation in the preceding year.
All analyses were performed in Stata MP 17 (StataCorp; College Station, TX) within the VA Informatics and Computing Infrastructure. A two-sided p-value of <0.05 defined statistical significance.
RESULTS
Characteristics of the cohort
We identified 208,382 patients who fulfilled criteria for asthma and received regular care within VHA between January 1, 2015, and December 31, 2019. From this population, 175,002 patients had a calculable TyG at some point after January 1, 2016, of whom 108,219 had available covariates for multivariable adjustment and eligible person-time, comprising the analytic dataset.
The median (25th, 75th percentile) age was 61 (49, 69) years. 20,519 (19%) were female, and 70,203 (65%) were of Caucasian race (Table 1). Most patients (53%) were taking some type of asthma controller medication, and 9% experienced an asthma exacerbation in the year preceding their index TyG measurement. Overall comorbidity burden was high, with 99,413 (92%) patients having at least one Elixhauser comorbidity.
TABLE 1.
Cohort characteristics (N=108219)
| Characteristic | Median (25th, 75th percentile) or N (%) |
|---|---|
|
| |
| Age (years) | 60.9 (49.4, 69.2) |
|
| |
| Female sex | 20519 (19.0) |
| Race and ethnicity | |
| American Indian or Alaskan Native | 1013 (0.9) |
| Asian/Asian Pacific Islander | 1981 (1.8) |
| Hispanic | 10492 (8.7) |
| Non-Hispanic Black | 24530 (22.7) |
| Non-Hispanic White | 70203 (64.9) |
|
| |
| Body mass index (kg/m3) | 30.8 (27.2, 35.2) |
|
| |
| Smoking status | |
| Current smoker | 22615 (20.9) |
| Former smoker | 35999 (33.3) |
| Never smoker | 49605 (45.8) |
|
| |
| Asthma treatment intensity | |
| No controller | 51197 (47.3) |
| Inhaled corticosteroid (ICS) only | 8192 (7.6) |
| ICS with another controller1 | 42541 (39.3) |
| No ICS but another controller | 6289 (5.8) |
|
| |
| Prior-year asthma exacerbation | 9777 (9) |
|
| |
| Type 2 inflammation and atopy | |
| Eosinophil count (cells/uL) | 200 (100, 300) |
| Eosinophil count >150 cells/uL | 74462 (68.8) |
| Immunoglobulin E (kU/L, n=2105) | 118 (36, 356) |
|
| |
| Metabolic characteristics | |
| Diabetes medication use2 | 22,489 (20.8) |
| Statin use | 45,644 (42.2) |
| Hemoglobin A1c (%, n=65604) | 5.8 (5.4, 6.5) |
|
| |
| Elixhauser comorbidities | |
| Median number | 3 (1, 4) |
| Congestive heart failure | 5694 (5.3) |
| Cardiac arrythmia | 10931 (10.1) |
| Valvular heart disease | 2578 (2.4) |
Long-acting beta agonists, long-acting muscarinic antagonists, leukotriene modifiers, theophylline
Metformin, sulfonylureas, thiazolidinediones, glucagon-like peptide-1a agonists, sodium-glucose cotransporter-2 inhibitors, dipeptidyl peptidase 4 inhibitors, meglitinides, amylin mimetics, a-glucosidase inhibitors, insulin
With respect to clinical metabolic disease, 22,489 (21%) filled an anti-diabetes medication and 45,644 (42%) filled a statin anti-cholesterol medication in the year preceding the index TyG. Among those who had a hemoglobin A1c measured (n=65,604 (61%)), its median value was 5.8% (5.4%, 6.5%), which was in the pre-diabetic range.
TyG was approximately normally distributed with a mean ± standard deviation of 8.8 ± 0.7 (Figure E1). Those on diabetes medications or statins had generally higher TyG values (mean 8.98 vs. 8.63, t-test p-value <0.001).
Elevated TyG was associated with a higher hazard of severe asthma exacerbation
Over 286,343 person-years of follow-up, 21,467 exacerbations were identified, corresponding to a crude rate of 7.5 exacerbations/100 person-years. In initial exploratory analysis, we fit a minimally adjusted model for age, sex, and race and ethnicity to define the relationship between quartiles of TyG to the hazard of asthma exacerbation. We found that the difference in hazard between the first and other quartiles of TyG to be qualitatively similar. The hazard of asthma exacerbation, compared to the first quartile, was 9% (95% confidence interval, 5%, 13%) higher in the second, 9% (4%, 13%) higher in the third, and 8% (4%, 12%) higher in the fourth quartiles (Figure E2). Consequently, we defined elevated TyG approximately at the cut-point between the first and other quartiles at 8.3 and utilized this threshold to define elevated TyG. In the minimally adjusted model, elevated TyG defined as >8.3 compared to a non-elevated TyG had an 8% (95% CI: 5%, 12%) higher hazard for asthma exacerbation.
Next, we fit iterative models with more robust adjustment for factors that may confound the relationship of TyG and asthma exacerbation and found minimal attenuation of the risk estimate (Table 2). The successive models included other classic factors that predict risk of asthma exacerbation: having had a prior asthma exacerbation, elevated eosinophil count, smoking, obesity, and intensity of asthma treatment. With mutual adjustment for these other factors, elevated TyG continued to maintain an independent association with risk of asthma exacerbation (adjusted hazard ratio 1.06; 95% CI 3%, 10%).
TABLE 2.
Association of elevated triglyçeride-glucose index (TyG) with hazard of severe asthma exacerbation
| Hazard Ratio (95% CI) for Asthma Exacerbation | |||
|---|---|---|---|
|
| |||
| Predictor | Model 1 | Model 2 | Model 3 |
|
| |||
| Elevated TyG1 | 1.08 (1.05, 1.12) | 1.05 (1.01, 1.08) | 1.06 (1.03, 1.10) |
|
| |||
| Age (per decade) | 1.00 (0.99, 1.01) | 0.98 (0.97, 0.99) | 0.97 (0.96, 0.98) |
|
| |||
| Male sex | 0.78 (0.75, 0.81) | 0.79 (0.76, 0.82) | 0.78 (0.76, 0.81) |
|
| |||
| Race and ethnicity | |||
| American Indian or Alaskan Native | 1.03 (0.90, 1.19) | 1.03 (0.89, 1.19) | 1.10 (0.96, 1.27) |
| Asian/Asian Pacific Islander | 1.01 (0.91, 1.12) | 1.02 (0.92, 1.13) | 1.00 (0.90, 1.12) |
| Hispanic | 1.36 (1.31, 1.42) | 1.35 (1.29, 1.41) | 1.34 (1.28, 1.39) |
| Non-Hispanic Black | 1.30 (1.26, 1.35) | 1.25 (1.21, 1.29) | 1.25 (1.20, 1.29) |
| Non-Hispanic White | Reference | Reference | Reference |
|
| |||
| Body mass index (per 10 increase) | 1.04 (1.01, 1.06) | 1.02 (0.99, 1.04) | |
|
| |||
| Metabolic disease medications | |||
| Diabetes medication use2 | 0.85 (0.82, 0.88) | 0.90 (0.87, 0.94) | |
| Statin use | 1.04 (1.01, 1.07) | 1.00 (0.97, 1.04) | |
|
| |||
| Smoking status | |||
| Current smoker | Reference | Reference | |
| Former smoker | 1.09 (1.05, 1.13) | 1.06 (1.01, 1.10) | |
| Never smoker | 1.10 (1.06, 1.14) | 1.09 (1.05, 1.13) | |
|
| |||
| Comorbidities | |||
| Number of Elixhauser comorbidities | 1.09 (1.08, 1.10) | 1.03 (1.02, 1.04) | |
| Congestive heart failure | 0.92 (0.87, 0.99) | 0.94 (0.88, 1.00) | |
| Cardiac arrhythmias | 1.00 (0.96, 1.05) | 1.03 (0.99, 1.08) | |
| Valvular heart disease | 0.93 (0.86, 1.02) | 1.01 (0.92, 1.10) | |
|
| |||
| Asthma treatment intensity | |||
| No controller | Reference | ||
| Inhaled corticosteroid (ICS) only | 1.24 (1.18, 1.31) | ||
| ICS with another controller3 | 1.72 (1.66, 1.77) | ||
| No ICS but another controller | 1.21 (1.13, 1.29) | ||
|
| |||
| Prior-year asthma exacerbation | 3.65 (3.53, 3.77) | ||
|
| |||
| Elevated eosinophil count4 | 1.17 (1.14, 1.21) | ||
Triglyceride-glucose index >8.3
Metformin, sulfonylureas, TZDs, GLP-1a, SGLT2i, DPP-4i, meglitinides, amylin mimetics, a-glucosidase inhibitors, insulin
Long-acting beta agonists, long-acting muscarinic antagonists, leukotriene modifiers, theophylline
Blood eosinophil count >150 cells/uL
Sensitivity analyses
Our results were not changed in sensitivity analyses (1) excluding all individuals who had an asthma exacerbation within two weeks prior to their TyG measurement, to investigate for possible reverse causation of a nascent exacerbation causing an elevated TyG due to inflammation, (2) excluding all individuals who were not clearly on an asthma controller, to investigate for possible misclassification by inclusion of patients who may not have had asthma, (3) excluding all individuals age 65 years or older, to investigate for possible misclassification of outcomes due to Medicare dual enrollment, (4) excluding all individuals who did not have an asthma flare in the preceding year, to investigate for possible misclassification by patients who do not seek VHA care for asthma exacerbation due to personal or logistical factors, (5) excluding all individuals who were taking diabetes medications or statins, and (6) excluding all individuals who were current or former smokers. Of note, the lower confidence interval in sensitivity analyses 4 and 6 was 0.99, crossing null, but the point estimates were similar (Table E1). We found no evidence of effect measure modification by sex, elevated eosinophil count, use of an asthma controller, or having a previous exacerbation (Figure 1).
Figure 1.
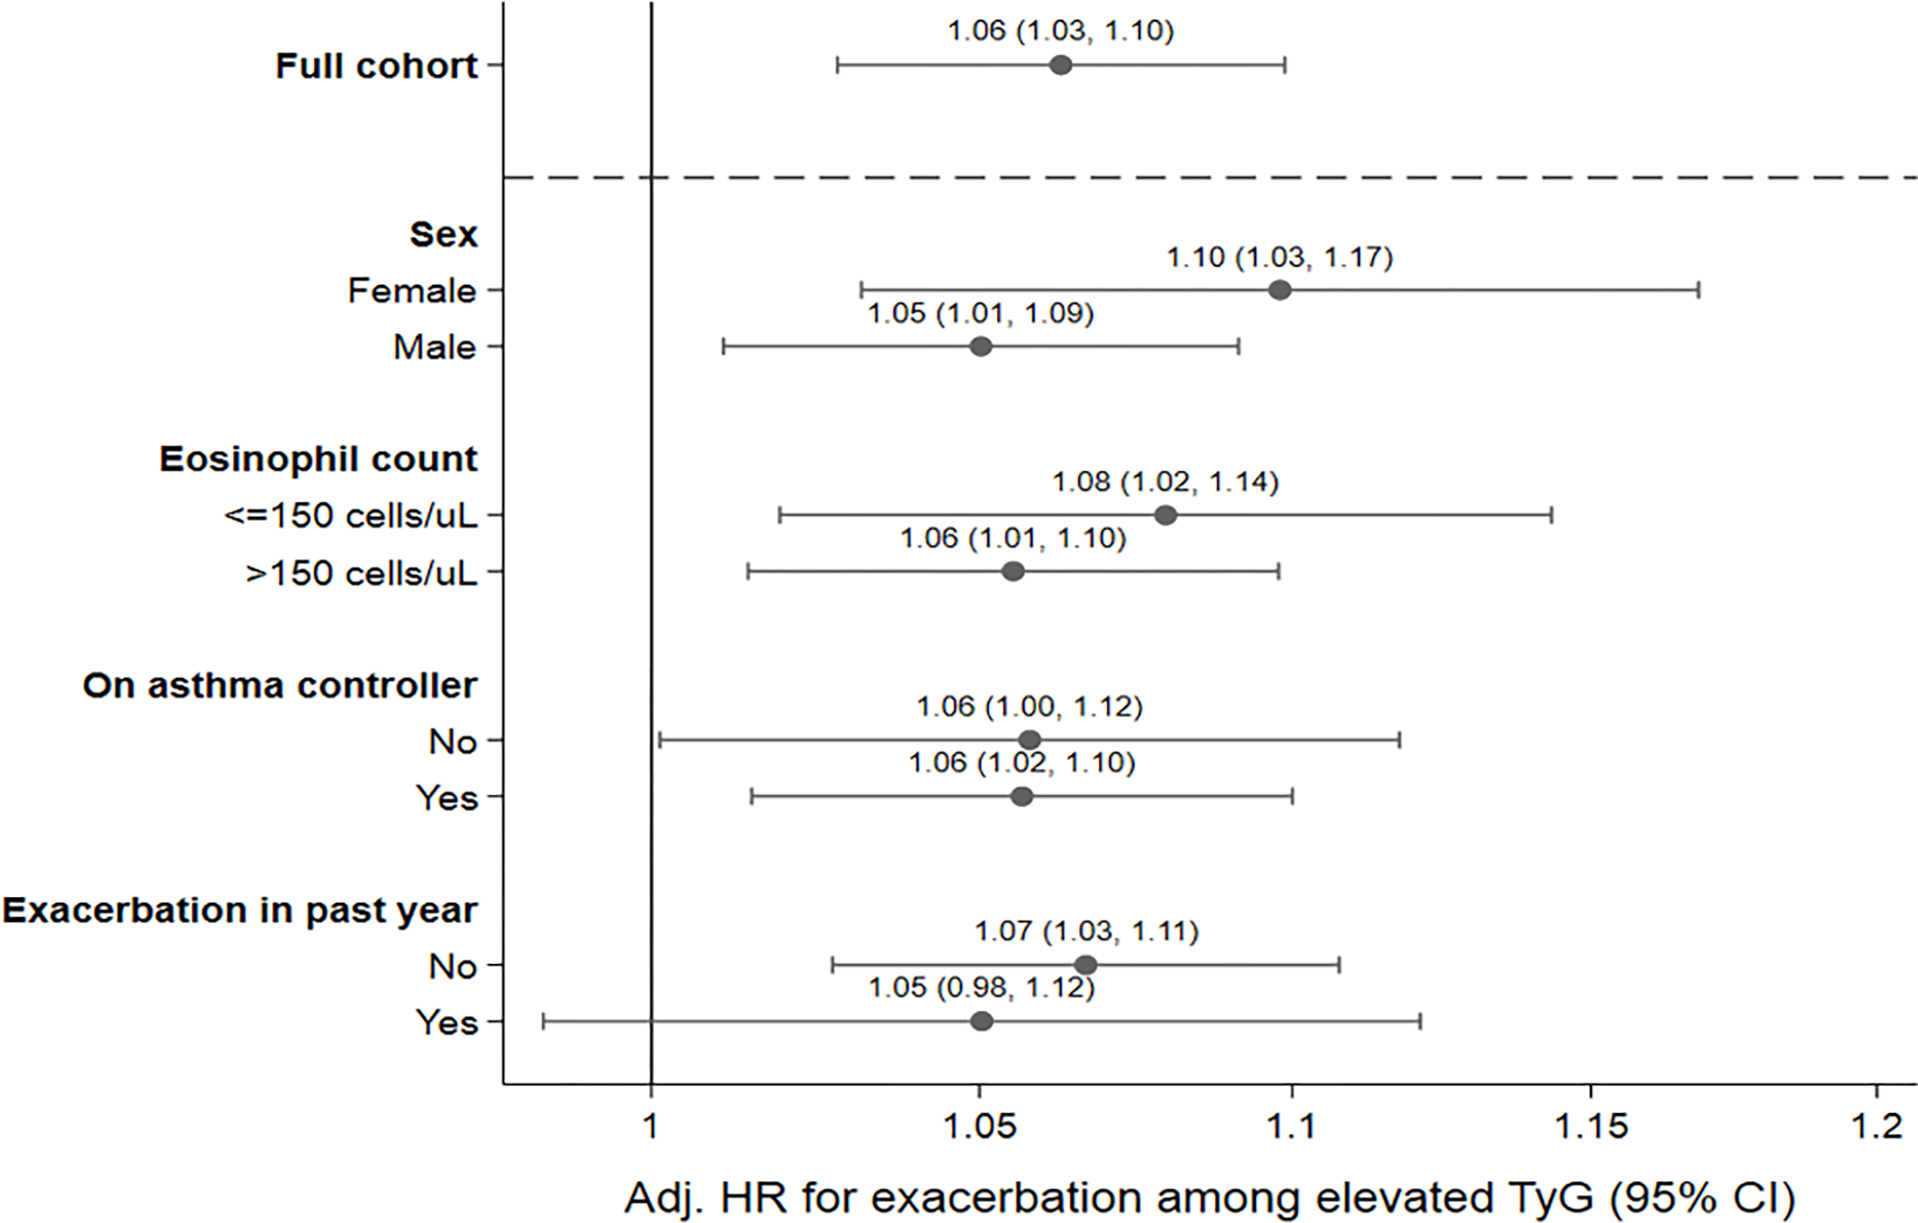
Association of elevated triglyceride-glucose index with hazard of severe asthma exacerbation by subgroups of interest
Analysis of non-fasting TyG and severe asthma exacerbation
On the rationale that individuals with metabolic dysfunction would plausibly have elevated triglycerides or glucose irrespective of fasting status, we performed an additional analysis exploring the utility of not imposing a time-of-day requirement to calculate TyG. Allowing pairs of triglyceride and glucose within four hours apart at any time of day created an analytic cohort of 120,619 patients, 12% larger than the primary cohort (Table E2). In this larger cohort, elevated TyG was associated with an 8% (95% CI: 5%, 12%) higher hazard of asthma exacerbation in a fully adjusted model.
DISCUSSION
In a large, retrospective cohort of patients with asthma receiving services from a nation-wide US integrated healthcare system, we found that patients with an elevated baseline triglyceride-glucose index were at higher risk for severe asthma exacerbation. This relationship was not explained by body mass index, cardiovascular disease, or metabolic medications, and it was independent of asthma treatment intensity, eosinophil count, obesity, smoking, and history of prior asthma exacerbation, conventional predictors of asthma exacerbation. These results imply that patients with elevated TyG may benefit from more intensive asthma preventative care. Should a causal relationship between metabolic diseases and worse asthma exist, TyG may also represent a biomarker for patients who are candidates for metabolic intervention with an objective of improving asthma morbidity.
TyG has some advantages over alternative methods of parameterizing metabolic health. A dichotomous presence or absence of a metabolic comorbidity does not ascertain pre-clinical disease. Alternatively, the presence of metabolic syndrome, which implies a certain extent of metabolic derangement, requires integration of multiple inputs—including physical exam and waist circumference measurement.3 Direct measurement of metabolic inflammation or insulin resistance is similarly difficult in clinical settings, with proxies such as high-sensitivity C-reactive peptide having modest only correlation. In contrast, TyG is a composite measure that can be calculated through routine labs which have nationally standardized reference methods.
It is notable that the increase in hazard of asthma exacerbation with elevated TyG was not substantially attenuated when mutually adjusted for markers of eosinophilic or exacerbation-prone asthma, suggesting that the mechanisms by which metabolic dysfunction can worsen asthma may be independent of these other pathways. Conversely, the increase in hazard associated with an elevated TyG (6%) was also approximately one-third of that of an elevated eosinophil count (17%), suggesting that a metabolic pathway of airway dysfunction may be relatively less influential. Research is necessary to determine the additive value of TyG for predicting asthma exacerbations in a risk model incorporating known predictors for disease exacerbation, and in the optimal timing and pattern of TyG testing. While subgroup analyses suggest that the index performs similarly irrespective of existing metabolic dysfunction or asthma phenotype, prospective work is also needed to define appropriate patient populations for implementation; does an elevated index have the same practical implications to a patient with known metabolic disease versus a patient without?
We found that prevalent treatment with diabetes medications was associated with a lower hazard of asthma exacerbation—replicating work done by our and other groups—but not with statins.13,17–19 The noticeably larger estimated benefit of statins for asthma in observational compared to randomized trials may reflect the tendency of the former to not consider other comorbid metabolic diseases.20 Because this study was not designed to assess effects of metabolic drugs on asthma, this statement should be considered speculative only.
Additionally, we identified a non-linear relationship between TyG and the hazard of asthma exacerbation. This finding may suggest the presence of a biological threshold effect, or it may indicate that the index is indirectly connected with the putative causal pathway between metabolic disease and asthma morbidity. Clarification of these possibilities will require external validation of the dose-response relationship among other asthma cohorts as well as mechanistic research on the role of metabolic disease in asthma.
This study was performed in a large, integrated healthcare system. By requiring patients to be regular users of VHA, we have greater confidence that asthma and other events are more completely captured. Because eligibility for VHA care is more equitable compared to private healthcare systems, the influence of structural issues related to access to care which may confound chronic illness investigations, especially socioeconomic and employment status, are lessened.21 However, we do acknowledge some limitations. VHA users—US veterans—represent a distinct group whose health outcomes and related findings may not be generalizable to the US population, especially women and those who are younger. Data in the electronic health record is clinically obtained and are subject to misclassification and incomplete capture. Importantly, use of a time-of-day caliper to determine fasting status is anticipated to be imprecise, although we found similar results in the analysis of a non-time restricted cohort, and such imprecision would be expected to bias results toward the null.
In conclusion, the triglyceride-glucose index, a composite biomarker of metabolic health which correlates with insulin resistance and metabolic syndrome, was associated with risk of asthma exacerbation independent of typical risk factors. Patients with elevated TyG may benefit from increased asthma surveillance and may represent a group of interest for future studies of metabolic intervention for asthma.
Supplementary Material
HIGHLIGHTS.
What is already known about this topic?
Metabolic dysfunction is associated with worse asthma outcomes and is a proposed treatable trait in asthma. How best to ascertain and classify metabolic dysfunction is unclear.
What does this article add to our knowledge?
The triglyceride-glucose index, a composite measure of metabolic health, predicts the occurrence of severe asthma exacerbations independent of conventional risk factors.
How does this study impact current management guidelines?
Patients with elevated triglyceride-glucose indices may warrant intensification of asthma treatment and may represent a target population for clinical trials of metabolic intervention for purposes of improving asthma outcomes.
Support
Department of Veterans Affairs, Veterans Health Administration, Office of Research and Development, Center for Innovations in Quality, Effectiveness, and Safety (CIN 13–413 to KS, CM, DH, and TDW); and the National Heart, Lung, and Blood Institute (K23HL151669 to TDW). The content is solely the responsibility of the authors and does not necessarily represent the official views of the Department of Veterans Affairs, National Institutes of Health, or the United States government.
ABBREVIATIONS
- BMI
Body mass index
- ICD
International Classification of Diseases
- TyG
Triglyceride-glucose index
- VHA
Veterans Health Administration
Footnotes
Conflicts of Interest
The authors declare no relevant conflicts of interest.
Publisher's Disclaimer: This is a PDF file of an unedited manuscript that has been accepted for publication. As a service to our customers we are providing this early version of the manuscript. The manuscript will undergo copyediting, typesetting, and review of the resulting proof before it is published in its final form. Please note that during the production process errors may be discovered which could affect the content, and all legal disclaimers that apply to the journal pertain.
REFERENCES
- 1.Wu TD, Brigham EP, Keet CA, Brown TT, Hansel NN, McCormack MC. Association Between Prediabetes/Diabetes and Asthma Exacerbations in a Claims-Based Obese Asthma Cohort. J Allergy Clin Immunol Pract. 2019. Aug;7(6):1868–1873.e5. [DOI] [PMC free article] [PubMed] [Google Scholar]
- 2.Baffi CW, Wood L, Winnica D, Strollo PJ, Gladwin MT, Que LG, et al. Metabolic Syndrome and the Lung. Chest. 2016. Jun;149(6):1525–34. [DOI] [PMC free article] [PubMed] [Google Scholar]
- 3.Alberti K, Eckel RH, Grundy SM, Zimmet PZ, Cleeman JI, Donato KA, et al. Harmonizing the metabolic syndrome: a joint interim statement of the international diabetes federation task force on epidemiology and prevention; national heart, lung, and blood institute; American heart association; world heart federation; international atherosclerosis society; and international association for the study of obesity. Circulation. 2009;120(16):1640–5. [DOI] [PubMed] [Google Scholar]
- 4.McDonald VM, Clark VL, Cordova-Rivera L, Wark PAB, Baines KJ, Gibson PG. Targeting treatable traits in severe asthma: a randomised controlled trial. Eur Respir J. 2020. Mar;55(3):1901509. [DOI] [PubMed] [Google Scholar]
- 5.Guerrero-Romero F, Simental-Mendía LE, González-Ortiz M, Martínez-Abundis E, Ramos-Zavala MG, Hernandez-Gonzalez SO, et al. The product of triglycerides and glucose, a simple measure of insulin sensitivity. Comparison with the euglycemic-hyperinsulinemic clamp. The Journal of Clinical Endocrinology & Metabolism. 2010;95(7):3347–51. [DOI] [PubMed] [Google Scholar]
- 6.Son DH, Lee HS, Lee YJ, Lee JH, Han JH. Comparison of triglyceride-glucose index and HOMA-IR for predicting prevalence and incidence of metabolic syndrome. Nutr Metab Cardiovasc Dis. 2022. Mar;32(3):596–604. [DOI] [PubMed] [Google Scholar]
- 7.Zhao Q, Zhang TY, Cheng YJ, Ma Y, Xu YK, Yang JQ, et al. Impacts of triglyceride-glucose index on prognosis of patients with type 2 diabetes mellitus and non-ST-segment elevation acute coronary syndrome: results from an observational cohort study in China. Cardiovasc Diabetol. 2020. Jul 8;19(1):108. [DOI] [PMC free article] [PubMed] [Google Scholar]
- 8.Liu D, Yang K, Gu H, Li Z, Wang Y, Wang Y. Predictive effect of triglyceride-glucose index on clinical events in patients with acute ischemic stroke and type 2 diabetes mellitus. Cardiovasc Diabetol. 2022. Dec 12;21(1):280. [DOI] [PMC free article] [PubMed] [Google Scholar]
- 9.Alizargar J, Bai CH, Hsieh NC, Wu SFV. Use of the triglyceride-glucose index (TyG) in cardiovascular disease patients. Cardiovasc Diabetol. 2020. Jan 15;19(1):8. [DOI] [PMC free article] [PubMed] [Google Scholar]
- 10.Wu TD, Fawzy A, Brigham E, McCormack MC, Rosas I, Villareal DT, et al. Association of Triglyceride-Glucose Index and Lung Health: A Population-Based Study. Chest. 2021. Sep;160(3):1026–34. [DOI] [PMC free article] [PubMed] [Google Scholar]
- 11.Al Sallakh MA, Vasileiou E, Rodgers SE, Lyons RA, Sheikh A, Davies GA. Defining asthma and assessing asthma outcomes using electronic health record data: a systematic scoping review. Eur Respir J. 2017. Jun;49(6):1700204. [DOI] [PubMed] [Google Scholar]
- 12.Tseng E, Segal JB, Maruthur NM. Fasting Status of Patients Undergoing Ambulatory Laboratory Testing. Diabetes Care. 2019. Aug 1;42(8):e133–4. [DOI] [PMC free article] [PubMed] [Google Scholar]
- 13.Wu TD, Fawzy A, Akenroye A, Keet C, Hansel NN, McCormack MC. Metformin Use and Risk of Asthma Exacerbation Among Asthma Patients with Glycemic Dysfunction. J Allergy Clin Immunol Pract. 2021. Nov;9(11):4014–4020.e4. [DOI] [PMC free article] [PubMed] [Google Scholar]
- 14.Lederer DJ, Bell SC, Branson RD, Chalmers JD, Marshall R, Maslove DM, et al. Control of Confounding and Reporting of Results in Causal Inference Studies. Guidance for Authors from Editors of Respiratory, Sleep, and Critical Care Journals. Annals ATS. 2018. Sep 19;16(1):22–8. [DOI] [PubMed] [Google Scholar]
- 15.Quan H, Sundararajan V, Halfon P, Fong A, Burnand B, Luthi JC, et al. Coding algorithms for defining comorbidities in ICD-9-CM and ICD-10 administrative data. Med Care. 2005. Nov;43(11). [DOI] [PubMed] [Google Scholar]
- 16.McGinnis KA, Brandt CA, Skanderson M, Justice AC, Shahrir S, Butt AA, et al. Validating smoking data from the Veteran’s Affairs Health Factors dataset, an electronic data source. Nicotine Tob Res. 2011. Dec;13(12):1233–9. [DOI] [PMC free article] [PubMed] [Google Scholar]
- 17.Wu TD, Keet CA, Fawzy A, Segal JB, Brigham EP, McCormack MC. Association of Metformin Initiation and Risk of Asthma Exacerbation: A Claims-Based Cohort Study. Ann Am Thorac Soc. 2019. Aug 15; [DOI] [PMC free article] [PubMed] [Google Scholar]
- 18.Li CY, Erickson SR, Wu CH. Metformin use and asthma outcomes among patients with concurrent asthma and diabetes. Respirology. 2016;21(7):1210–8. [DOI] [PubMed] [Google Scholar]
- 19.Foer D, Beeler PE, Cui J, Karlson EW, Bates DW, Cahill KN. Asthma Exacerbations in Patients with Type 2 Diabetes and Asthma on Glucagon-like Peptide-1 Receptor Agonists. Am J Respir Crit Care Med. 2021. Apr 1;203(7):831–40. [DOI] [PMC free article] [PubMed] [Google Scholar]
- 20.So JY, Dhungana S, Beros JJ, Criner GJ. Statins in the treatment of COPD and asthma-where do we stand? Curr Opin Pharmacol. 2018. Jun;40:26–33. [DOI] [PubMed] [Google Scholar]
- 21.O’Hanlon C, Huang C, Sloss E, Anhang Price R, Hussey P, Farmer C, et al. Comparing VA and Non-VA Quality of Care: A Systematic Review. J Gen Intern Med. 2017. Jan;32(1):105–21. [DOI] [PMC free article] [PubMed] [Google Scholar]
Associated Data
This section collects any data citations, data availability statements, or supplementary materials included in this article.