Abstract
Optical coherence tomography (OCT) is a valuable imaging technique in ophthalmology, providing high-resolution, cross-sectional images of the retina for early detection and monitoring of various retinal and neurological diseases. However, discrepancies in retinal layer thickness measurements among different OCT devices pose challenges for data comparison and interpretation, particularly in longitudinal analyses. This work introduces the idea of a recurrent self fusion (RSF) algorithm to address this issue. Our RSF algorithm, built upon the self fusion methodology, iteratively denoises retinal OCT images. A deep learning-based retinal OCT segmentation algorithm is employed for downstream analyses. A large dataset of paired OCT scans acquired on both a Spectralis and Cirrus OCT device are used for validation. The results demonstrate that the RSF algorithm effectively reduces speckle contrast and enhances the consistency of retinal OCT segmentation.
Keywords: Optical coherence tomography, Denoise, Segmentation
1. Introduction
Optical coherence tomography (OCT) is a non-invasive imaging technique that utilizes low-coherence interferometry to generate high-resolution, cross-sectional images [7]. In the field of ophthalmology, OCT provides detailed visualization of the retina, facilitating the early detection and continuous monitoring of various retinal diseases, including age-related macular degeneration (AMD) [18] and diabetic macular edema (DME) [1,4]. In neurological diseases like multiple sclerosis (MS) [14,15], OCT has provided additional insights and potential biomarkers of disease, specifically the thinning of key retinal layers, such as the retinal nerve fiber layer (RNFL) and the ganglion cell and inner plexiform layer (GCIPL) [16,17]. Retinal OCT images offer precise thickness measurements of each retinal layer, enabling the identification of subtle changes over time and providing valuable guidance for treatment decisions [19].
However, discrepancies in retinal layer thickness measurements arise due to variations in image quality such as noise levels and speckle patterns produced by different OCT devices, posing challenges in the consistent comparison and interpretation of data across studies or clinical settings. Studies have demonstrated that RNFL thickness measured using Spectralis OCT (Heidelberg Engineering, Heidelberg, Germany) tends to be thicker than measurements obtained from Cirrus OCT (Carl Zeiss Meditec, Dublin, CA, USA) [3,9,12]. Similar discrepancies have been observed for other retinal layers [3] and across different pairs of OCT devices [9]. Consequently, standardization efforts are crucial in establishing harmonized measurements and minimizing disparities among OCT devices. These ensure a more reliable and consistent assessment of retinal layer thicknesses in both clinical practice and research endeavors.
In this paper, we propose the recurrent self fusion (RSF) algorithm aimed at reducing speckle contrast and improving the consistency of retinal OCT segmentation. The RSF algorithm builds upon the self fusion approach of Oguz et al. [11] and iteratively denoises retinal OCT images. In the downstream segmentation task, we use a deep learning-based retinal OCT layer segmentation algorithm [5,6]. To validate our approach, we utilize a substantial dataset comprising paired Spectralis and Cirrus OCT scans. Our findings reveal that the RSF algorithm effectively reduces speckle contrast in retinal OCT images and enhances the consistency of the resulting segmentation.
2. Method
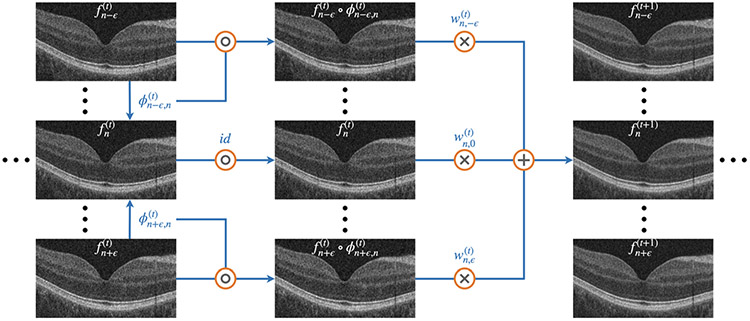
The RSF algorithm is based on the self fusion method [11], which incorporates the concept of joint label fusion (JLF) [20], as shown in Fig. 1. The retinal OCT volume contains a set of B-scans , where the superscript 0 refers to the original B-scans and is an index over the B-scans. In the iteration, we register the neighboring B-scans to the B-scan , by seeking the deformation field given by:
| (1) |
where is the normalized cross correlation (NCC) loss that penalizes low NCC values, is a regularization term on that penalizes discontinuities in , and is the identity if . To solve Eq. 1, we use the greedy reg package1 [21]. An affine transformation is performed first, followed by a deformable registration. A window size of 5 × 5 is chosen for the NCC calculation, and the default regularization parameters are used.
Fig. 1.
Diagram of the RSF algorithm for iterative denoising. The operations , ×, and + represent composition, pixel-wise multiplication and pixel-wise summation, respectively.
After registration, we perform a weighted summation to obtain updated denoised images. For the weights, we utilize the concept of JLF, to compute:
| (2) |
where is a matrix with entries , at the iteration, () is a pixel location, defines a local patch size, when or otherwise , is a regularization term which controls the weight similarity, and is an intensity distance measure expressed as:
| (3) |
where is a parameter that controls the measure, and if . The weight parameter is then calculated as:
| (4) |
where is the weight for the warped B-scan . The updated B-scan is obtained through the weighted summation:
| (5) |
where is the number of wrapped B-scans used in weighted summation. In this paper, we set , , , , and we explore up to a total of iterations.
3. Results
Dataset.
Our dataset consists of 59 MS participants that were scanned contemporaneously on both a Spectralis and Cirrus OCT device with institutional review board (IRB) approval. For all 59 participants and the two OCT devices, both the left and right eye were imaged. Thus our evaluations will be on the 118 eyes, comparing Spectralis to Cirrus. Spectralis scans comprise 49 B-scans with dimensions of 496×1024 and Cirrus scans consist of 128 B-scans with dimensions of 1024 × 512. Both sets of scans cover an approximate field of view of 6 mm × 6 mm around the central fovea. The Spectralis and Cirrus scans have axial resolutions of 3.87 and 1.96 , respectively.
Speckle Contrast.
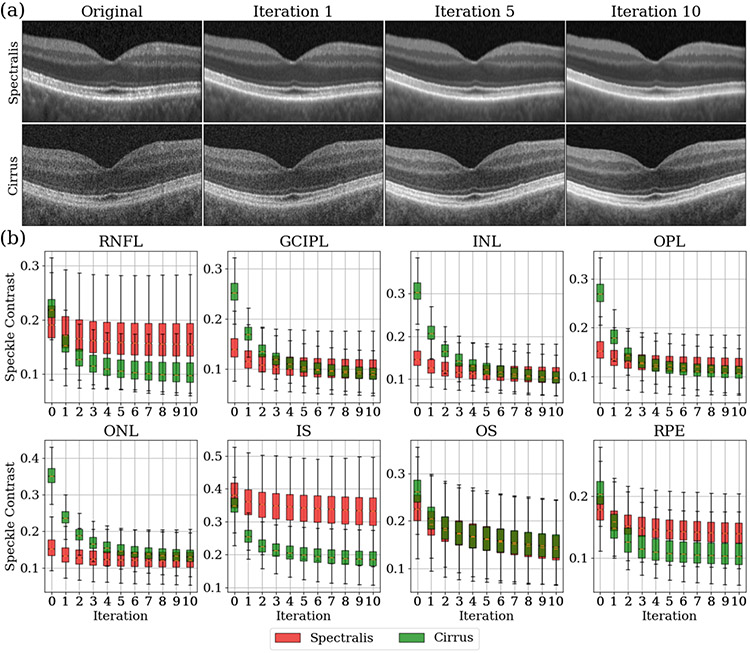
By applying the RSF algorithm, we observe a continuous reduction in speckle patterns of both OCT devices as iterations progress as shown in Fig. 2(a). To assess the quantitative reduction in speckle patterns at each iteration, we evaluate the speckle contrast, , in each retinal layer and across the entire retina in each B-scan:
| (6) |
where and are the mean and standard deviation of intensities in the layer, respectively, and the segmentation of each retinal layer is explained in the next paragraph. The speckle contrast for both OCT devices over 10 iterations is shown in Fig. 2(b). We observe that the speckle contrast for all layers decreases initially, before stabilizing for both devices. From Eq. 6, there is an inverse relationship between speckle contrast and the signal to noise ratio (SNR). Therefore, as the iterations progress, the SNR in each retinal layer increases. Furthermore, we notice that the decreasing rate of the speckle contrast is much higher for Cirrus scans than Spectralis scans. This is expected since Spectralis scans possess better initial image quality. It is interesting to note that while the original Spectralis and Cirrus scans exhibit different speckle contrast, their speckle contrast converges to similar values for the GCIPL, INL, OPL, ONL and OS after denoising; see Fig. 2 for the layer names.
Fig. 2.
(a) Original and denoised retinal OCT images after one, five and ten iterations on paired Spectralis and Cirrus scans for a similar cross section. (b) Speckle contrast across the 118 Spectralis scans (red) and the 118 Cirrus scans (green) over ten iterations. The value at iteration ‘0’ is the speckle contrast of the original images. Key: RNFL: retinal nerve fiber layer; GCIPL: ganglion cell layer and inner plexiform layer; INL: inner nuclear layer; OPL: outer plexiform layer; ONL: outer nuclear layer; IS: inner segment; OS: outer segment; RPE: retinal pigment epithelium complex.
Segmentation Convergence.
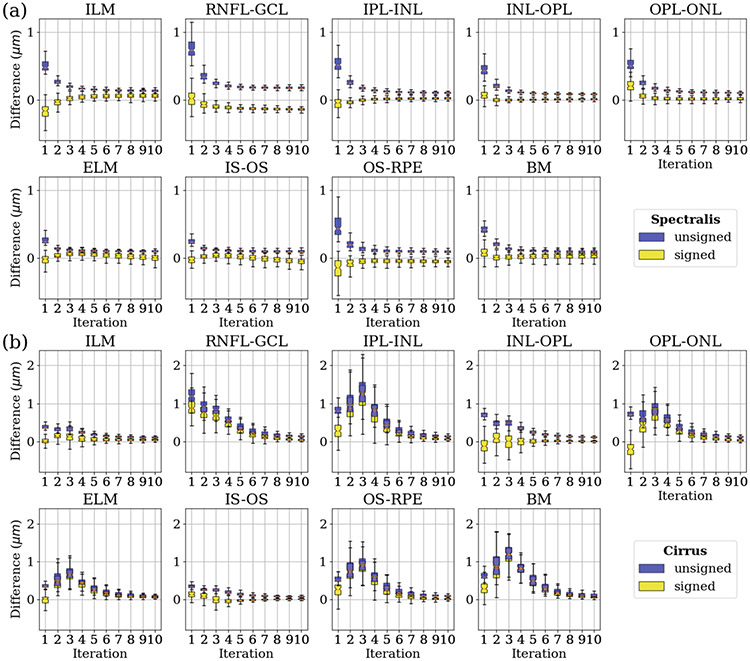
To investigate the impact of the RSF algorithm on downstream segmentation, we use a deep learning-based retinal OCT segmentation algorithm, to generate smooth and continuous surfaces that accurately represent the retinal layers with the correct topology [5,6]. This network was trained with 394 Spectralis and 321 Cirrus retinal OCT volumes. The ground truth for layer segmentation in these OCT volumes was obtained using AURA, a well-established retinal OCT segmentation software [8]. Manual corrections were made to the initial segmentation results obtained from AURA to ensure precise and accurate delineation of the retinal layers. It is important to note that none of the training data for the deep learning-based OCT segmentation algorithm were included in the paired scans used in the validation of the RSF method. We apply the deep learning-based retinal OCT segmentation algorithm to the paired Spectralis and Cirrus scans. We calculate both the unsigned (blue) and signed (yellow) differences between the segmentation results of consecutive iterations, as shown in Fig. 3, for both Spectralis and Cirrus scans. This allows us to evaluate the magnitude and direction of changes in the segmentation outcomes throughout the RSF iterations. These plots demonstrate a convergence in the segmentation results for the majority of retinal layers.
Fig. 3.
(a) Boxplots of the unsigned (blue) and signed (yellow) differences between the segmentation results of consecutive iterations across the 118 Spectralis scans. (b) Boxplots of the unsigned (blue) and signed (yellow) differences between the segmentation results of consecutive iterations across the 118 Cirrus scans. Key: ILM: internal limiting membrane; ELM: external limiting membrane; BM: Bruch’s membrane; see Fig. 2 for the other layer names.
Average Thickness Comparison.
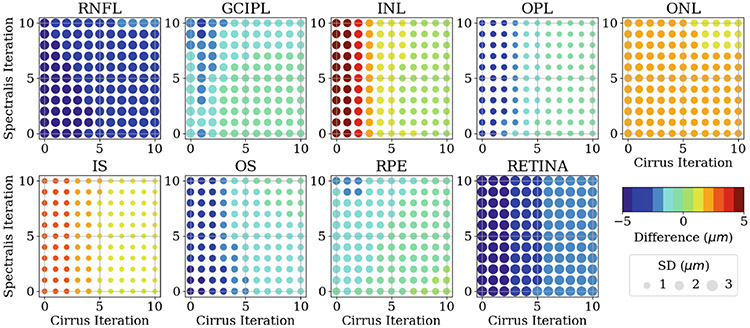
After analysing the convergence of the independent segmentation results, we proceed to analyse the paired segmentation results between Spectralis and Cirrus scans. However, directly comparing their segmentation results requires OCT image registration [13] between the two scan types as the images are not aligned, see Fig. 2(a) for example. OCT image registration can be challenging due to the interpolation issues arising from the sparseness of OCT B-scans. To circumvent the registration problem, we calculate the average thickness within a circular area centered at the fovea, with a diameter of 5 mm, for both Spectralis and Cirrus scans. Then, we compare the difference in the averaged thickness for each retinal layer by subtracting the Spectralis thickness from the Cirrus thickness. The overall results for the average thickness difference between the paired scans at different iteration steps are shown in Fig. 4. We observe that in comparison to Spectralis thickness measurements, the initial thickness measurements obtained from Cirrus scans tend to be smaller in RNFL, GCIPL, OPL, OS, RPE and the overall retina, but tend to be larger in INL, ONL and IS. After applying the RSF algorithm, the thickness measurements for all retinal layers from the paired scans converge to a smaller value. Moreover, it is noteworthy that the RSF algorithm applied to Spectralis scans does not noticeably reduce the thickness difference, as opposed to its impact on Cirrus scans. This outcome is expected due to the inferior initial image quality of Cirrus scans, thus benefit more from the RSF algorithm.
Fig. 4.
Difference of the averaged thickness for each retinal layer by subtracting the Spectralis thickness from the Cirrus thickness at different denosing iteration steps for each device. The color and the size of each circle represent the mean and the standard deviation, respectively, of the thickness difference between the paired OCT scans across 118 paired scans. The value of the mean is shown in the color bar. The value of the standard deviation is proportional to the circle size, with the unit circle representing a standard deviation of 3 .
Thickness Distribution Comparison.
To gain a more comprehensive understanding, it is valuable to analyse the differences in thickness distributions, as they capture the overall statistics of retinal layer thickness. To quantify the dissimilarity between the Spectralis and Cirrus thickness distributions, we employ the Jensen-Shannon Distance (JSD):
| (7) |
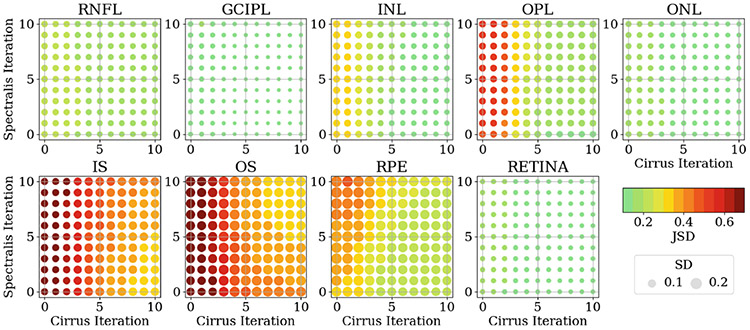
where and are two probability density functions, is the Kullback-Leibler divergence, and . The JSD between the paired thickness distributions at different iteration steps are shown in Fig. 5. These results align with the findings from Fig. 4. Specifically, we observe a reduction in the JSD between the thickness distributions of each retinal layer as the denoising iterations progress. Furthermore, it is evident that the RSF algorithm has a more pronounced impact on the Cirrus scans than the Spectralis scans.
Fig. 5.
JSD of the thickness distributions for each retinal layer between the Spectralis and the Cirrus OCT scans at different denosing iteration steps for each device. The color and the size of each circle represent the mean and the standard deviation, respectively, of the JSD between the paired OCT scans across the 118 paired scans. The value of the mean is shown in the color bar. The value of the standard deviation is proportional to the circle size, with the unit circle representing a standard deviation of 0.2.
4. Discussion and Conclusions
Spectralis and Cirrus OCT devices are widely used in ophthalmology, but they differ in terms of their hardware and imaging algorithms, which impact their image quality. Spectralis scans tend to exhibit smoother images with reduced noise and fewer speckle patterns. These disparities in image quality can contribute to domain discrepancies between the two OCT scans and potentially lead to variations in retinal layer thickness measurements following segmentation. Our hypothesis is that by applying the RSF algorithm, the two distinct OCT scans gradually become more similar, resulting in improved consistency in retinal layer thickness measurements. This hypothesis is supported by the results obtained in this study.
However, the proposed method has certain limitations. First, the processing speed of the current RSF is relatively slow due to its reliance on a classical registration method, which requires a longer processing time. Second, the validation of the proposed method is limited to a single deep learning-based retinal OCT segmentation algorithm and lacks comparison with other denoising algorithms. Third, the proposed method is evaluated on a cross-sectional study and its impact on longitudinal OCT data remains unexplored. To address these limitations, future work involves exploring the implementation of deep learning-based registration methods such as Voxelmorph [2] or Coordinate Translator [10] to improve processing speed, validating the consistency of thickness measurements after denoising using a broader range of OCT segmentation and denoising algorithms, and investigating the RSF algorithm in longitudinal OCT data for identifying subtle retinal layer thickness changes over time.
In this paper, we propose the RSF algorithm for iteratively denoising retinal OCT images. Each RSF iteration effectively reduces speckle contrast and improves SNR across various retinal OCT layers and on both investigated devices. Moreover, by applying a deep learning-based retinal OCT segmentation algorithm to the paired OCT volumes from different OCT devices, we observe a significant improvement in the consistency of the segmentation results. These findings underscore the potential of the proposed RSF algorithm as a valuable pre-processing step for retinal OCT images, facilitating more consistent and reliable retinal OCT segmentation.
Acknowledgements.
This work was supported by the NIH under NEI grant R01-EY024655 (PI: J.L. Prince), NEI grant R01-EY032284 (PI: J.L. Prince) and in part by the Intramural Research Program of the NIH, National Institute on Aging.
Footnotes
References
- 1.Alsaih K, Lemaitre G, Rastgoo M, Massich J, Sidibé D, Meriaudeau F: Machine learning techniques for diabetic macular edema (DME) classification on SD-OCT images. Biomed. Eng. Online 16, 1–12 (2017) [DOI] [PMC free article] [PubMed] [Google Scholar]
- 2.Balakrishnan G, Zhao A, Sabuncu MR, Guttag J, Dalca AV: Voxelmorph: a learning framework for deformable medical image registration. IEEE Trans. Med. Imag 38(8), 1788–1800 (2019) [DOI] [PubMed] [Google Scholar]
- 3.Bhargava P., et al. : Applying an open-source segmentation algorithm to different OCT devices in multiple sclerosis patients and healthy controls: implications for clinical trials. Multiple Sclerosis Int. 2015 (2015) [DOI] [PMC free article] [PubMed] [Google Scholar]
- 4.Chiu SJ, Allingham MJ, Mettu PS, Cousins SW, Izatt JA, Farsiu S: Kernel regression based segmentation of optical coherence tomography images with diabetic macular edema. Biomed. Opt. Express 6(4), 1172–1194 (2015) [DOI] [PMC free article] [PubMed] [Google Scholar]
- 5.He Y., et al. : Structured layer surface segmentation for retina OCT using fully convolutional regression networks. Med. Image Anal 68, 101856 (2021) [DOI] [PMC free article] [PubMed] [Google Scholar]
- 6.He Y., et al. : Fully convolutional boundary regression for retina OCT segmentation. In: Shen D, et al. (eds.) MICCAI 2019. LNCS, vol. 11764, pp. 120–128. Springer, Cham: (2019). 10.1007/978-3-030-32239-7_14 [DOI] [PMC free article] [PubMed] [Google Scholar]
- 7.Huang D., et al. : Optical coherence tomography. Science 254(5035), 1178–1181 (1991) [DOI] [PMC free article] [PubMed] [Google Scholar]
- 8.Lang A., et al. : Retinal layer segmentation of macular oct images using boundary classification. Biomed. Opt. Express 4(7), 1133–1152 (2013) [DOI] [PMC free article] [PubMed] [Google Scholar]
- 9.Leite MT, et al. : Agreement among spectral-domain optical coherence tomography instruments for assessing retinal nerve fiber layer thickness. Am. J. of Ophthalmol 151(1), 85–92 (2011) [DOI] [PubMed] [Google Scholar]
- 10.Liu Y, Zuo L, Han S, Xue Y, Prince JL, Carass A: Coordinate translator for learning deformable medical image registration. In: Multiscale Multimodal Medical Imaging: Third International Workshop, MMMI 2022, Held in Conjunction with MICCAI 2022, Singapore, 22 September 2022, Proceedings, MICCAI 2022. LNCS, vol. 13594, pp. 98–109. Springer, Cham: (2022). 10.1007/978-3-031-18814-5_10 [DOI] [PMC free article] [PubMed] [Google Scholar]
- 11.Oguz I, Malone JD, Atay Y, Tao YK: Self-fusion for OCT noise reduction. In: Medical Imaging 2020: Image Processing, vol. 11313, pp. 45–50. SPIE; (2020) [DOI] [PMC free article] [PubMed] [Google Scholar]
- 12.Patel NB, Wheat JL, Rodriguez A, Tran V, Harwerth RS: Agreement between retinal nerve fiber layer measures from Spectralis and Cirrus spectral domain OCT. Optomet. Vis. Sci 89(5), E652 (2012) [DOI] [PMC free article] [PubMed] [Google Scholar]
- 13.Reaungamornrat S, Carass A, He Y, Saidha S, Calabresi PA, Prince JL: Inter-scanner variation independent descriptors for constrained diffeomorphic Demons registration of retinal OCT. In: Proceedings of SPIE Medical Imaging (SPIE-MI 2018), Houston, 10-15 Feb. 2018, vol. 10574, p. 105741B (2018) [DOI] [PMC free article] [PubMed] [Google Scholar]
- 14.Rothman A., et al. : Retinal measurements predict 10-year disability in multiple sclerosis. Annal. Clin. Transl. Neurol 6(2), 222–232 (2019) [DOI] [PMC free article] [PubMed] [Google Scholar]
- 15.Saidha S., et al. : Primary retinal pathology in multiple sclerosis as detected by optical coherence tomography. Brain 134(2), 518–533 (2011) [DOI] [PubMed] [Google Scholar]
- 16.Saidha S., et al. : Visual dysfunction in multiple sclerosis correlates better with optical coherence tomography derived estimates of macular ganglion cell layer thickness than peripapillary retinal nerve fiber layer thickness. Multip. Scleros. J 17(12), 1449–1463 (2011) [DOI] [PubMed] [Google Scholar]
- 17.Saidha S., et al. : Microcystic macular oedema, thickness of the inner nuclear layer of the retina, and disease characteristics in multiple sclerosis: a retrospective study. Lancet Neurol. 11(11), 963–972 (2012) [DOI] [PMC free article] [PubMed] [Google Scholar]
- 18.Sotoudeh-Paima S, Jodeiri A, Hajizadeh F, Soltanian-Zadeh H: Multi-scale convolutional neural network for automated AMD classification using retinal OCT images. Comput. Biol. Med 144, 105368 (2022) [DOI] [PubMed] [Google Scholar]
- 19.Talman LS, et al. : Longitudinal study of vision and retinal nerve fiber layer thickness in multiple sclerosis. Annal. Neurol 67(6), 749–760 (2010) [DOI] [PMC free article] [PubMed] [Google Scholar]
- 20.Wang H, Suh JW, Das SR, Pluta JB, Craige C, Yushkevich PA: Multiatlas segmentation with joint label fusion. IEEE Trans. Patt. Anal. Mach. Intell 35(3), 611–623 (2012) [DOI] [PMC free article] [PubMed] [Google Scholar]
- 21.Yushkevich PA, Pluta J, Wang H, Wisse LE, Das S, Wolk D: IC-P-174: fast automatic segmentation of hippocampal subfields and medial temporal lobe subregions in 3 Tesla and 7 Tesla T2-weighted MRI. Alzheimer’s Dementia 12, P126–P127 (2016) [Google Scholar]


