

Abstract
Objective:
To define and characterize extreme phenotypes based on pain interference for persons with chronic pain following Traumatic Brain Injury (TBI).
Setting:
18 TBIMS centers.
Participants:
1762 TBIMS participants 1-30 years post-injury (mean age 46.4 years) reporting chronic pain at their most recent follow-up interview.
Primary Measures:
Brief Pain Inventory (BPI) interference scale, sociodemographic, injury, functional outcome, pain, and treatment characteristics.
Results:
Participants were predominantly male (73%), White (75%), middle-aged (mean 46 years), who were injured in motor vehicle accidents (53%) or falls (20%). Extreme phenotypes were identified based on upper and lower 25th percentiles to create low interference (N=441) and high interference (N=431) extreme phenotypes. Bivariate comparisons found several sociodemographic, injury, function, pain, and treatment differences between extreme phenotypes group, including significant differences (p<.001) on all measures of concurrent function with those in the low interference extreme phenotype experiencing better function than those in the high interference extreme phenotype. Lasso regression combined with logistic regression identified multivariable predictors of low vs. high interference extreme phenotypes. Reductions in the odds of low vs. high interference phenotype were significantly associated with higher pain intensity (OR = 0.33), having neuropathic pain (OR = 0.40), migraine headache (OR = 0.41), leg/feet pain (OR = 0.34), or hip pain (OR = 0.46), and more pain catastrophizing (OR = 0.81).
Conclusion:
Results suggest that for those who experience current chronic pain, there is high variability in the experience and impact of pain. Future research is needed to better understand how pain experience impacts individuals with chronic pain and TBI given that pain characteristics were the primary distinguishing factors between phenotypes. The use of extreme phenotypes for pain interference may be useful to better stratify samples to determine efficacy of pain treatment for individuals with TBI.
Keywords: Chronic Pain, Traumatic Brain Injury, Pain Interference, Phenotype, Patient Reported Outcome
Introduction
Chronic pain is a frequent problem following traumatic brain injury (TBI), with research reporting up to 71% endorsing chronic pain after moderate to severe TBI.1–3 However, the impact of chronic pain, including functional interference attributed to chronic pain is not well understood among those with TBI. Chronic pain has the capacity to disrupt and interfere with multiple domains of functioning, including cognition, activities of daily living, sleep, mood, and social interactions.4–10 While pain intensity is often associated with pain interference, there is not a direct correspondence; individuals with similar levels of pain intensity often experience varying levels of interference,11 with some experiencing high impact chronic pain, while others adjust or adapt more readily such that pain’s impact on functioning is quite low.
Given the complexity of chronic pain in individuals with TBI, one novel and efficient methodology that may better identify those at risk for poor outcomes and facilitate precision medicine is extreme phenotyping.12–14 Phenotypes allow for the classification of an observed patient, with a specific disease, and comparison of characteristics of the patient with regard to outcomes such as disease progression (natural history) and treatment responsiveness in the context of a treatment trial. Phenotyping has been used some in prior research among patients with TBI,15 including those with pain and post-traumatic headache,16 examining impact of pain treatment,17 and how pain may be related to other outcomes.18,19 However, no studies on TBI and pain have utilized the extreme phenotype approach. Extreme phenotypes represent those at the extreme ends of select characteristics (e.g., best and worst outcome) and may help with identifying those at risk for the worst outcomes, and therefore be able to target specific treatments for those in the at-risk group. This approach has been used in studying basic biology,20 as well as diseases such as cancer21 and Human Immunodeficiency Virus (HIV) and has expedited discoveries to determine those at risk for disease progression (and protection), identify pharmaceutical targets, and match treatments with the phenotypes with the best response likelihood.12 Among those with pain, prior work has demonstrated physiologic linkage to extreme phenotypes.22 In addition, research on traumatic amputees found clinical characteristics of a maladaptive pain phenotype.23
The common factor underlying these discoveries is the identification of characteristic extreme phenotypes that consider personal, environmental, and disease characteristics that may influence an outcome. To date, no study has identified chronic pain characteristics and outcomes to inform extreme phenotypes for individuals with TBI. In the current study we examine extreme phenotypes for pain interference, or the extent to which chronic pain interferes with specific activities and functioning, in persons living with chronic pain following TBI given that pain interference is an outcome known to guide the clinical assessment and treatment of chronic pain,24 and has been found to be more related to psychosocial outcomes than pain intensity.25 The aim of the study was to identify extreme phenotypes and then characterize those in the low interference and high interference extremes on sociodemographic, injury, concurrent functional outcome, pain, and treatment characteristics which could inform future research, including examining progression of pain over time as well as potential stratification in treatment studies.
METHODS
Participants
Data were collected as part of the National Institute on Disability, Independent Living, and Rehabilitation Research Traumatic Brain Injury Model System (TBIMS) Collaborative study “The Characterization and Treatment of Chronic Pain after TBI”1 (aka Chronic Pain study). The TBIMS research network has enrolled the largest number of persons with moderate to severe TBI enrolled and followed in a well-characterized, longitudinal database focused on TBI outcomes.26,27 Participants in the Chronic Pain study were recruited from those already enrolled in the TBIMS National Database (NDB) 26,27 at participating centers (17 civilian and 1 VA TBIMS) during one of their regularly scheduled follow-up interviews (years 1, 2, 5, 10, 15, 20, 25, 30) occurring between May 1, 2019 and Aug 31, 2022.
TBIMS participants were eligible for participation in the Chronic Pain study if they completed their TBIMS follow-up interview in English and without a proxy. Participants in the current study were 1762 participants who endorsed “persistent or recurring pain that lasts longer than three months” (including headaches or pain anywhere in the body more than half of the days over a three-month period) and completed a one-time survey within 8 weeks of their TBIMS follow-up interview that included assessment of their experience of pain and pain treatment since their TBI. All centers received approval from their institutional review board.
Measures
Pain Interference Outcome for Extreme Phenotyping
Pain interference was measured using the seven Brief Pain Inventory (BPI)28 items that query the extent to which pain interferes with general activity, mood, walking ability, normal work, relations with other people, sleep, and enjoyment of life. Participants were asked to rank how much pain has interfered with each daily activity over the past two weeks on a 10-point scale from 0 (did not interfere) to 10 (completely interfered). A total pain interference score was computed for each individual as the average of these seven items.
Participant Characteristics for Characterizing Extreme Pain Interference Phenotypes
Sociodemographic characteristics included sex, race, ethnicity, military history, as well as information from time of TBIMS follow-up including year post-injury of follow-up (1, 2, 5 and every 5 years through 30 years), age, marital status, level of education, employment status, primary person living with, and substance use (alcohol and illicit drugs).
Injury-related variables included cause of injury, associated spinal cord injury (SCI), and days of post-traumatic amnesia (PTA). Function (at the time of TBIMS follow-up) was measured by FIM™ Motor and Cognitive29 scores (range 18-91 and 5-35, respectively; higher scores indicate more independence), Disability Rating Scale (DRS)30 scores (range 0-29; higher scores indicate more disability), and Glasgow Outcome Scale – Extended (GOS-E; 8-point ordinal scale; higher scores indicate better global functioning).31
Pain characteristics collected included intensity, location (yes/no for 13 body areas), frequency for the most bothersome location (several times a week, daily, constant), type (neuropathic and headache), and pain catastrophizing. Pain intensity was measured using the BPI28 and rated as 0 (no pain) to 10 (pain as bad as you can imagine) on four items: when pain is at its “worst”, “least”, “average”, and “right now”. The composite intensity score was calculated as the average of these four items. Neuropathic pain type was measured using the PainDETECT Questionnaire32 and classified as clinically significant positive, clinically significant negative, or unclear. Headache type was classified based on survey items previously described33 resulting in three categories: migraine/probable migraine, tension/cervicogenic/unclassifiable or none.34 Pain catastrophizing was measured using the subscale from the Coping Strategies Questionnaire (CSQ)35 as the sum of six items (“It’s terrible and I feel like it’s never going to get any better”, “It’s awful and I feel that it overwhelms me”, “I feel my life isn’t worth living”, “I worry all the time about whether it will end”, “I feel I can’t stand it anymore”, “I feel I can’t go on”) rated as 0 (never do that) to 6 (always do that) with higher scores representing greater pain catastrophizing.
Pain treatment history was assessed by asking if participant had received any treatment for their chronic pain including medical services (medication, injection, surgery, implanted device, non-electrical stimulator, or other), exercise therapies (physical therapy, pool/aquatic therapy, occupational therapy, yoga, tai chi, home exercise program, or other), psychological services (psychotherapy, biofeedback, guided imagery, mindfulness therapy, hypnotherapy, or other), complementary and alternative therapies (chiropractic, acupuncture, massage, or other), and comprehensive pain rehabilitation programs.
Power and Sample Size
Based on prior research,2 we estimated that of the 3800 individuals enrolled into the larger study, 30% (or 1140) would report current chronic pain and be available for characterizing extreme phenotypes. We planned to define extreme groups based on upper and lower percentiles, therefore we expected approximately 285 individuals each in the extreme low interference and high interference phenotypes (25% each) and the remaining 570 (50%) classified as “neutral” (or non-extreme). When comparing characteristics between extreme low interference and high interference phenotypes, a minimum sample size of 285 per group has at least 80% power (α = 0.05) to detect Cohen’s d effect sizes as small as 0.235 when comparing means and odds ratios of 1.60-2.14 when comparing proportions.36
Statistical Analysis
Defining Extreme Pain Interference Phenotypes
Extreme phenotypes for pain interference were initially data driven and identified using the 25th and 75th percentiles of the data. Cut-points for percentiles were selected to capture as close to 25% of the sample as possible. Total pain interference scores ≤25th percentile defined the extreme low interference phenotype and total scores ≥75th percentile defined the extreme high interference phenotype; the remaining 50% of the sample was defined as having neutral outcome. The data-driven extreme phenotypes were then brought to our study advisory board, made up of clinicians with expertise in pain and TBI, patients, and family members, to validate whether the cut-points held up as extremes based on their experiences. The group discussed and reported that our findings were consistent with clinical interpretations as well as prior research efforts24,37 to characterize extreme low and extreme high pain interference for those reporting chronic pain.
Characterization and Comparisons of Extreme Phenotypes
Participant characteristics (sociodemographic, injury, functional, pain, and pain treatment) were summarized separately for our two groups of interest; the extreme low and high interference phenotypes. Means, standard deviations (SDs), and percentiles were used for continuous variables and frequency counts and percentages were used for categorical variables. These characteristics were each compared bivariately between extreme low and high interference phenotypes using two-sample t-tests or Wilcoxon rank-sum tests for continuous variables and chi-square tests for categorical variables. For categorical characteristics with more than two levels, cell-chi square values >2 were used to identify specific levels contributing to large global differences.
Multivariable Predictive Model for Discriminating Extreme Pain Interference Phenotypes
Multinomial logistic regression modeling was used to assess the multivariable relationships between the participant characteristics (sociodemographic, injury, functional outcome, pain, treatment) and extreme pain interference phenotype (extreme low, non-extreme neutral, and extreme high interference). We performed variable selection to derive a multivariable predictive model for discriminating extreme low versus high interference phenotypes using Least Absolute Shrinkage and Selection Operator (LASSO) regression38 with 100-fold cross-validation using the glmnet package in R.39 The optimal lambda was selected to be the value that gives the most regularized model such that the misclassification error was within one standard error of the minimum mean cross-validated error for lambda. All variables listed in Table 2 were considered for the model selection process with the exception of PTA, DRS, GOS-E, and head pain. Concurrent functioning measures for FIM Motor and Cognitive were selected over PTA, an early measure of injury severity and other related measures of global functioning (DRS and GOS-E). Headache type was selected instead of head pain as these variables are dependent and headache type contains more information regarding head pain. As such, a total of 72 (dummy coded) predictor variables measuring sociodemographic, injury, functional outcome, pain, and pain treatment characteristics were assessed for the multivariable predictive model. Post-processing was performed by fitting a multinomial logistic regression model with the set of predictors identified by LASSO and estimating odds ratios to quantify the multivariable relationship among the predictors and pain interference outcome. While the LASSO regression and multinomial models include all three phenotype outcome categories (extreme low, non-extreme neutral, and extreme high interference) to correctly parametrize the model, inference focused on the comparison between extreme low and high interference phenotypes only. Bonferroni adjustments were used to control for multiple comparisons within factors with more than two levels. Area under the Receiver Operator Curve (AUC) was used to quantify the accuracy of the model at predicting pain interference outcome.40
RESULTS
Summary of the Sample
A total of 1762 participants endorsed current chronic pain and were included in analyses. Participant characteristics (see Table, Supplemental Digital Content 1, for summary) and comparison to all other participants of Chronic Pain study can be found in Harrison-Felix, PhD et al..1 The sample was predominately male (73%), White race (75%), middle-aged (mean age 46 years) participants who were injured primarily in motor vehicle accidents (53%) or falls (20%). Missing data rates were the highest for variables characterizing neuropathic pain type (7.7%), DRS (5.2%), pain catastrophizing (3.6%), and PTA (3.3%), and otherwise less than 2.1%.
Defining Extreme Pain Interference Phenotypes
Distribution of Pain Interference scores is shown in Figure 1 and classification of these scores into extreme pain interference phenotypes is summarized in Table 1. On average, pain interference scores were 4.3 (SD = 2.5) representing a moderate level of pain interference; however, scores across the entire range from 0 to 10 were reported. Participants with pain interference score ≤ 2.3 were classified into the extreme low interference phenotype (n = 441, 25.5%) and those with pain interference score ≥ 6.2 into the extreme high interference phenotype (n = 431, 25.0%).
Figure 1:
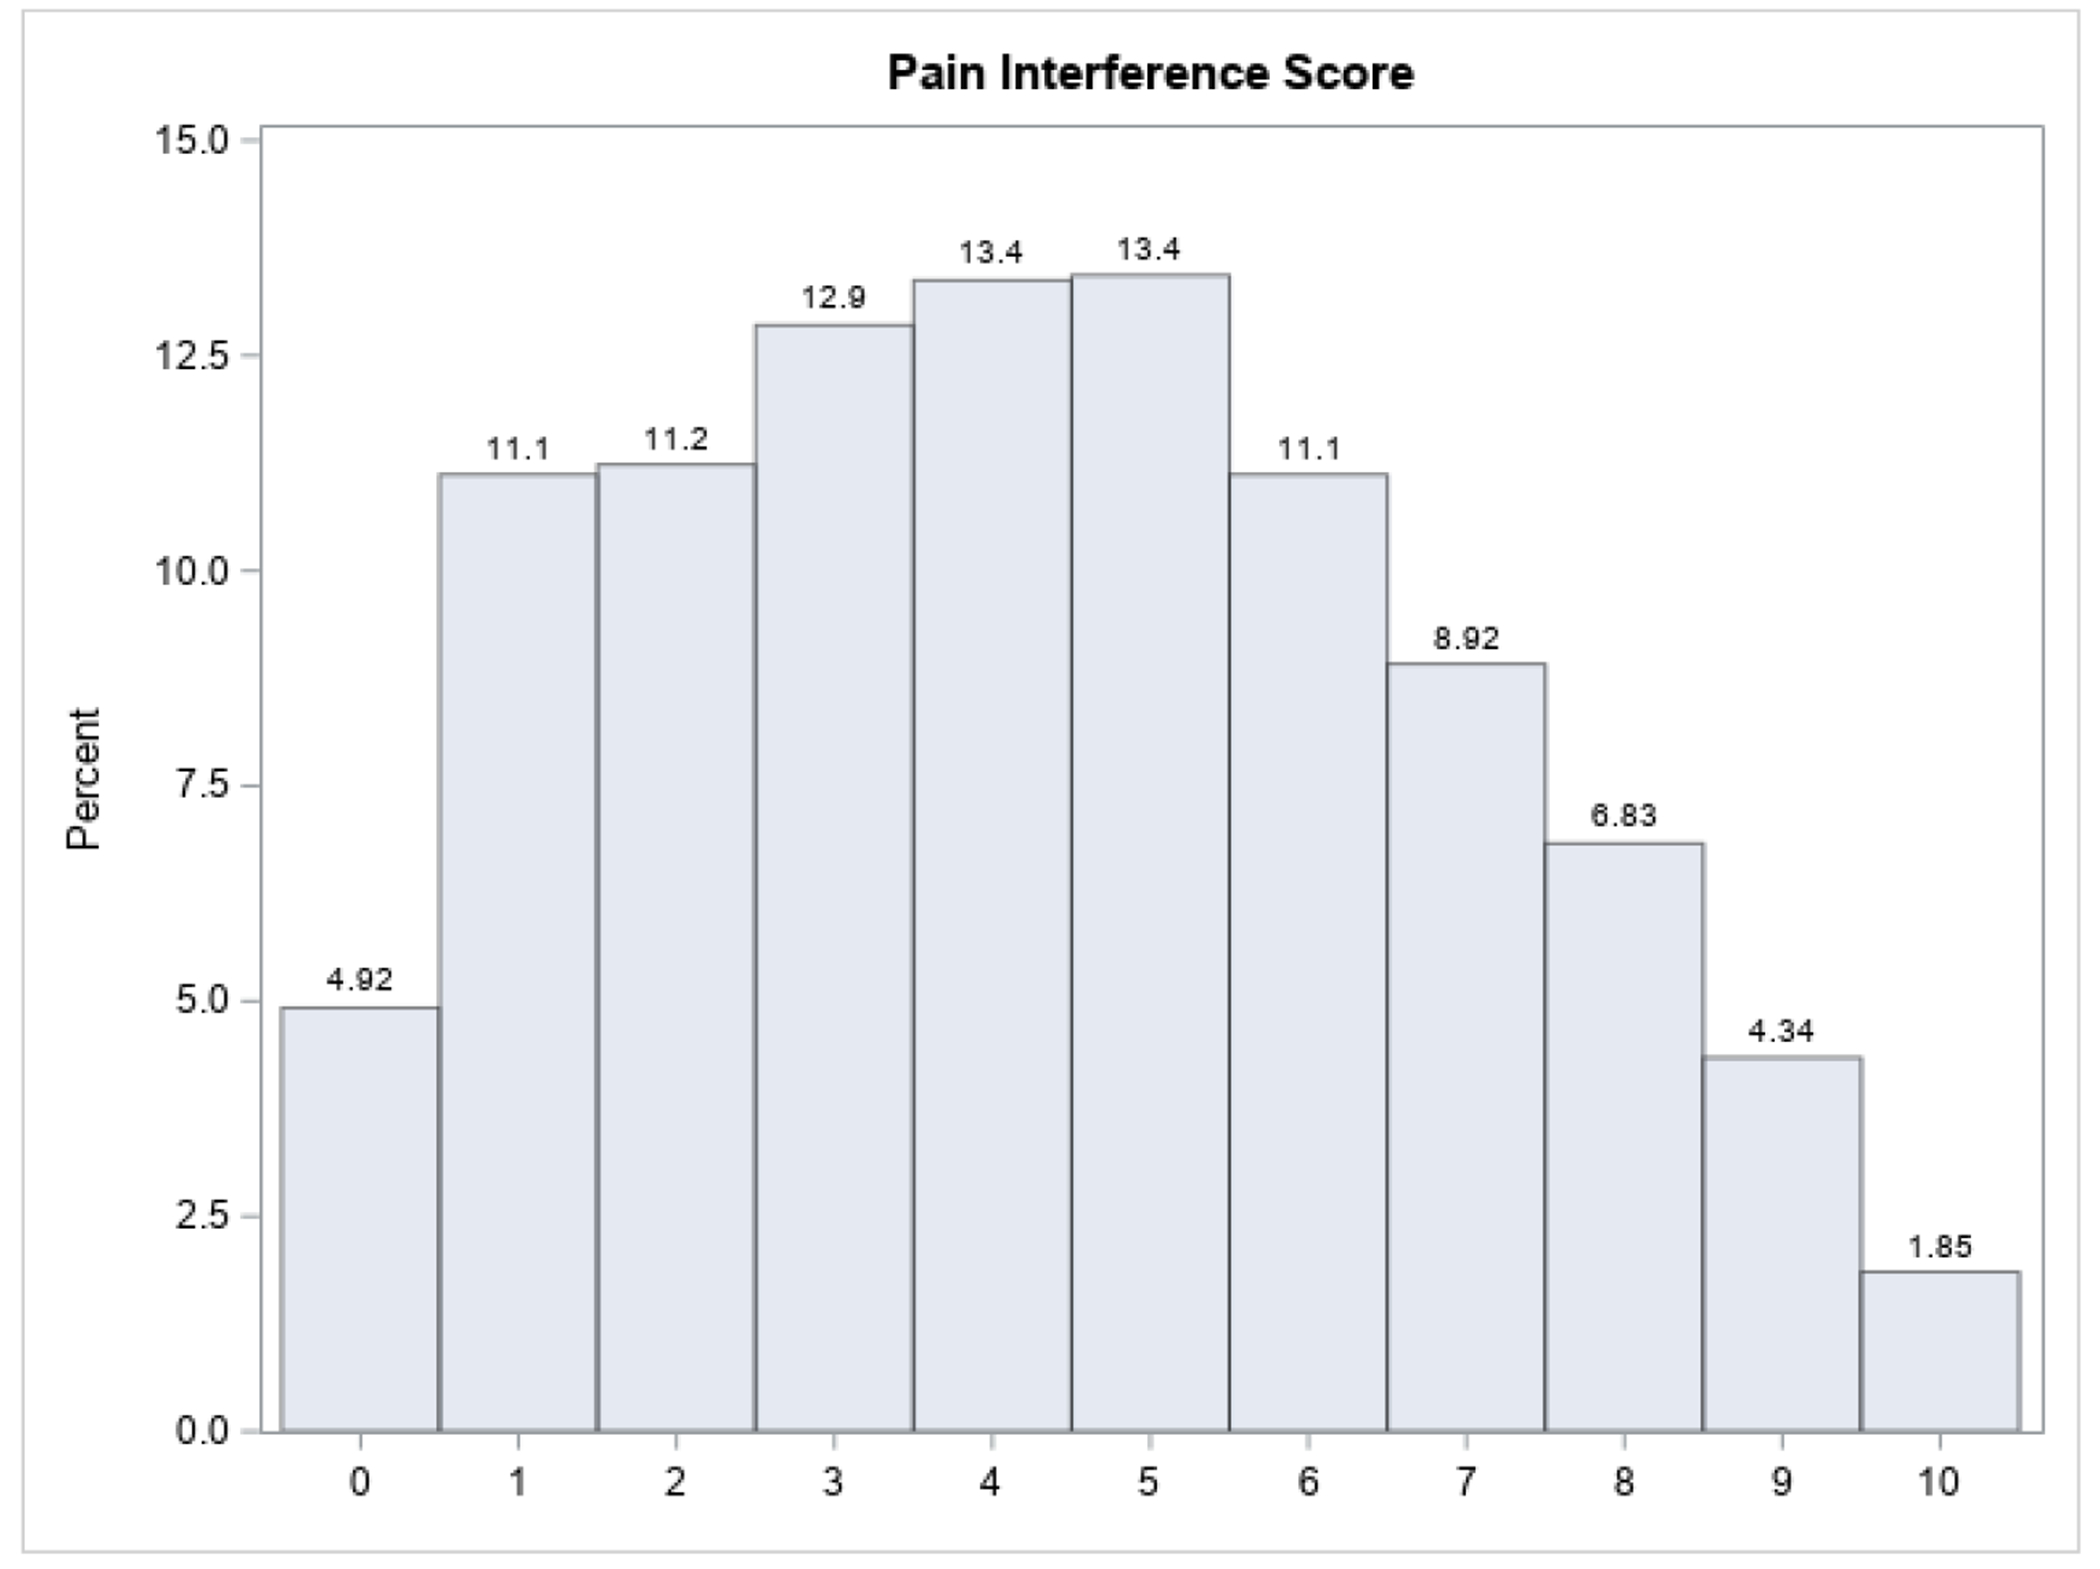
Distribution of Pain Interference Scores
Table 1:
Distribution of Pain Interference Scores and Classification into Extreme Phenotypes
| Pain Interference Response (BPI) | |
| N [Missing] | 1727 [35] |
| Mean (SD) | 4.3 (2.5) |
| [Minimum, 25th percentile, median, 75th percentile, maximum] | [0, 2.3, 4.3, 6.1, 10] |
|
| |
| Pain Interference Phenotypes | |
| Extreme High Interference Phenotype [BPI ≥ 6.2], N (%) | 431 (25.0%) |
| Non-Extreme Neutral Phenotype [2.3 < BPI < 6.2], N (%) | 855 (49.5%) |
| Extreme Low Interference Phenotype [BPI ≤ 2.3], N (%) | 441 (25.5%) |
BPI = Brief Pain Inventory; SD = standard deviation
Characteristics of Extreme Pain Interference Phenotypes
Distribution of the sociodemographic, injury, concurrent functional, pain, and pain treatment characteristics are summarized separately for extreme low and high interference phenotypes in Table 2, along with statistical comparison of these characteristics between groups. Note, these bivariate comparisons do not adjust for any other participant characteristics (e.g., marital comparison does not control for age).
Table 2:
Characteristics of Extreme Pain Interference Phenotypes
| Low Interference Phenotype (N = 441) | High Interference Phenotype (N = 431) | p-value | |
|---|---|---|---|
| Sociodemographic and Participant Characteristics | |||
|
| |||
| Years Post-Injury, Median (IQR) | 5.4 (2.1, 14.5) | 5.4 (2.0, 14.6) | 0.9322 b |
|
| |||
| Age at Follow-Up, Mean (SD) | 46.1 (16.4) | 47.5 (13.9) | 0.1768 a |
|
| |||
| Sex, N Male (%) | 330 (74.8%) | 308 (71.5%) | 0.2617 c |
|
| |||
| Race† | |||
| White, N (%) | 355 (80.5%) | 293 (68.3.%) | < 0.0001 c |
| Black / African American, N (%) | 60 (13.6%) | 117 (27.2%) | < 0.0001 c |
| Asian, N (%) | 15 (3.4%) | 10 (2.3%) | 0.3448 c |
| American Indian / Alaskan Native, N (%) | 13 (2.9%) | 22 (5.1%) | 0.1018 c |
| Native Hawaiian / Pacific Islander, N (%) | 3 (0.7%) | 8 (1.9%) | 0.1180 c |
|
| |||
| Hispanic, Latino, or Spanish Ethnicity, N (%) | 40 (9.1%) | 54 (12.5%) | 0.0996 c |
|
| |||
| Marital Status at Follow-Up | 0.0009 c | ||
| Single/Other, N (%) | 150 (34.2%) | 155 (36.0%) | - |
| Married, N (%) | 191 (43.5%) | 140 (32.5%) | * |
| Separated/Divorced/Widowed, N (%) | 98 (22.3%) | 136 (31.6%) | * |
|
| |||
| Education Level at Follow-Up | < 0.0001 c | ||
| Less than High School, N (%) | 38 (8.7%) | 110 (25.5%) | * |
| High School, N (%) | 95 (21.7%) | 117 (27.1%) | - |
| Some College / Associate’s, N (%) | 169 (38.6%) | 142 (32.9%) | - |
| Bachelor’s or Higher, N (%) | 136 (31.1%) | 62 (14.4%) | * |
|
| |||
| Employment Status at Follow-Up | < 0.0001 c | ||
| Employed/Student, N (%) | 231 (52.6%) | 99 (23.1%) | * |
| Retired, N (%) | 139 (31.7%) | 235 (54.9%) | * |
| Unemployed, N (%) | 47 (10.7%) | 74 (17.3%) | * |
| Other, N (%) | 22 (5.0%) | 20 (4.7%) | - |
|
| |||
| Military History, N Yes (%) | 84 (19.0%) | 107 (24.8%) | 0.0391 c |
|
| |||
| Living Situation at Follow-Up | 0.0010 c | ||
| Alone, N (%) | 65 (14.8%) | 82 (19.0%) | - |
| Spouse / Significant Other, N (%) | 230 (52.5%) | 168 (39.0%) | * |
| Other Family, N (%) | 112 (25.6%) | 138 (32.0%) | - |
| Someone Else, N (%) | 31 (7.1%) | 43 (10.0%) | - |
|
| |||
| Illicit Drug Use at Follow-Up, N Yes (%) | 76 (17.4%) | 67 (15.6%) | 0.4822 c |
|
| |||
| Drinking Category at Follow-Up | < 0.0001 c | ||
| Abstaining, N (%) | 183 (42.0%) | 249 (58.6%) | * |
| Light, N (%) | 101 (23.2%) | 80 (18.8%) | - |
| Moderate, N (%) | 114 (26.1%) | 67 (15.8%) | * |
| Heavy, N (%) | 38 (8.7%) | 29 (6.8%) | - |
|
| |||
| Injury Severity Characteristics | |||
|
| |||
| Cause of Injury | 0.0010 c | ||
| Vehicular, N (%) | 234 (53.3%) | 206 (47.8%) | - |
| Falls, N (%) | 103 (23.5%) | 88 (20.4%) | - |
| Violence, N (%) | 44 (10.0%) | 85 (19.7%) | * |
| Sports / Other, N (%) | 58 (13.2%) | 52 (12.1%) | - |
|
| |||
| Associated SCI, N Yes (%) | 28 (6.4%) | 25 (5.8%) | 0.7217 c |
|
| |||
| PTA (days), Median (IQR) | 16 (5, 31) | 16 (2, 32.5) | 0.5017 b |
|
| |||
| Concurrent Functional Outcomes | |||
|
| |||
| FIM Motor at Follow-Up, Median (IQR) | 90 (88, 91) | 84 (78, 88) | < 0.0001 b |
|
| |||
| FIM Cognitive at Follow-Up, Median (IQR) | 33 (32, 34) | 30 (27, 32) | < 0.0001 b |
|
| |||
| DRS at Follow-Up, Median (IQR) | 1 (0, 2) | 4 (2, 5) | < 0.0001 b |
|
| |||
| GOSE at Follow-Up | < 0.0001 c | ||
| Severe Disability, N (%) | 45 (10.3%) | 160 (37.4%) | * |
| Moderate Disability, N (%) | 154 (35.4%) | 219 (51.2%) | * |
| Good Recovery, N (%) | 236 (54.3%) | 49 (11.4%) | * |
|
| |||
| Chronic Pain Characteristics | p-value | ||
|
| |||
| Pain Intensity, Mean (SD) | 3.2 (1.5) | 6.4 (1.6) | < 0.0001 a |
|
| |||
| Pain Location‡ | |||
| Back, N Yes (%) | 221 (50.2%) | 330 (76.6%) | < 0.0001 c |
| Legs or Feet, N Yes (%) | 192 (43.6%) | 319 (74.2%) | < 0.0001 c |
| Shoulder, N Yes (%) | 156 (35.5%) | 251 (58.2%) | < 0.0001 c |
| Head, N Yes (%) | 126 (28.6%) | 266 (61.7%) | < 0.0001 c |
| Neck, N Yes (%) | 134 (30.4%) | 232 (53.8%) | < 0.0001 c |
| Arms or Hands, N Yes (%) | 119 (27.0%) | 207 (48.0%) | < 0.0001 c |
| Hips, N Yes (%) | 89 (20.2%) | 205 (47.6%) | < 0.0001 c |
| Face or Jaw, N Yes (%) | 40 (9.1%) | 107 (24.9%) | < 0.0001 c |
| Pelvic Area or Groin, N Yes (%) | 34 (7.7%) | 111 (25.8%) | < 0.0001 c |
| Buttocks, N Yes (%) | 22 (5.0%) | 82 (19.0%) | < 0.0001 c |
| Widespread Pain or Fibromyalgia, N Yes (%) | 19 (4.3%) | 77 (17.9%) | < 0.0001 c |
| Chest, N Yes (%) | 22 (5.0%) | 80 (18.6%) | < 0.0001 c |
| Abdomen, N Yes (%) | 20 (4.5%) | 86 (20.0%) | < 0.0001 c |
|
| |||
| Frequency of Pain (Most Bothersome Location) | < 0.0001 c | ||
| Several Times a Week, N (%) | 161 (37.4%) | 64 (15.0%) | * |
| Daily, N (%) | 195 (45.2%) | 154 (36.2%) | * |
| Constant, N (%) | 75 (17.4%) | 208 (48.8%) | * |
|
| |||
| Neuropathic Pain Type | < 0.0001 c | ||
| Clinically Significant Positive, N (%) | 23 (5.6%) | 141 (34.7%) | * |
| Clinically Significant Negative, N (%) | 348 (85.3%) | 171 (42.1%) | * |
| Unclear, N (%) | 37 (9.1%) | 94 (23.2%) | * |
|
| |||
| Headache Type§ | < 0.0001 c | ||
| Migraine/Probable Migraine, N (%) | 83 (18.9%) | 235 (55.0%) | * |
| Other Headache, N (%) | 41 (9.4%) | 27 (6.3%) | - |
| No Head Pain, N (%) | 314 (71.7%) | 165 (38.6%) | * |
|
| |||
| Pain catastrophizing, Median (IQR) | 1 (0, 5) | 15 (9, 24) | < 0.0001 b |
|
| |||
| Treatment History Characteristics | |||
|
| |||
| Total Medical Services or Treatments, N (%) | 388 (88.4%) | 416 (97.4%) | < 0.0001 c |
| Medication, N (%) | 371 (84.7%) | 407 (95.5%) | < 0.0001 c |
| Injection, N (%) | 93 (21.2%) | 174 (40.7%) | < 0.0001 c |
| Surgery, N (%) | 62 (14.1%) | 90 (21.1%) | 0.0072 c |
| Implanted Device, N (%) | 5 (1.1%) | 21 (4.9%) | 0.0011 c |
| Non-Implanted Electrical Stimulator, N (%) | 92 (21.0%) | 120 (28.1%) | 0.0145 c |
|
| |||
| Total Exercise Therapies, N (%) | 336 (76.5%) | 360 (84.3%) | 0.0040 c |
| Physical Therapy, N (%) | 254 (58.0%) | 319 (74.7%) | < 0.0001 c |
| Pool or Aquatic Therapy, N (%) | 83 (18.9%) | 128 (30.0%) | 0.0002 c |
| Occupational Therapy, N (%) | 115 (26.3%) | 195 (45.8%) | < 0.0001 c |
| Yoga, N (%) | 93 (21.2%) | 88 (20.6%) | 0.8215 c |
| Tai Chi, N (%) | 18 (4.1%) | 25 (5.9%) | 0.2377 c |
| Home Exercise Program, N (%) | 264 (60.1%) | 263 (61.6%) | 0.6608 c |
|
| |||
| Total Psychological Services, N (%) | 133 (30.4%) | 218 (51.1%) | < 0.0001 c |
| Psychotherapy (e.g., CBT, ACT), N (%) | 38 (8.7%) | 107 (25.1%) | < 0.0001 c |
| Biofeedback, N (%) | 18 (4.1%) | 35 (8.2%) | 0.0122 c |
| Deep Breathing, N (%) | 107 (24.4%) | 171 (40.0%) | < 0.0001 c |
| Guided Imagery, N (%) | 29 (6.6%) | 66 (15.5%) | < 0.0001 c |
| Mindfulness Therapy, N (%) | 57 (13.0%) | 104 (24.4%) | < 0.0001 c |
| Hypnotherapy, N (%) | 12 (2.7%) | 16 (3.7%) | 0.4026 c |
|
| |||
| Total Complementary/Alternative Medicine, N (%) | 246 (56.3%) | 254 (59.5%) | 0.3421 c |
| Chiropractic, N (%) | 127 (29.1%) | 133 (31.1%) | 0.5039 c |
| Acupuncture, N (%) | 72 (16.5%) | 96 (22.5%) | 0.0257 c |
| Massage, N (%) | 202 (46.2%) | 199 (46.6%) | 0.9109 c |
|
| |||
| Comprehensive Pain Rehabilitation Program, N (%) | 41 (9.4%) | 74 (17.3%) | 0.0006 c |
SD = standard deviation; IQR = interquartile range;
Participants may self-report more than one race;
Participants may self-report more than one pain location;
Headache Type was classified for those who reported head pain;
SCI = spinal cord injury; PTA = post-traumatic amnesia; FIM = Functional Independence Measure; DRS = Disability Rating Scale; GOS-E = Glasgow outcome scale – extended; BPI = Brief Pain Inventory; a: two-sample test; b: Wilcoxon rank-sum test; c: chi-square test; bold indicates statistically significant differences at α = 0.05;
indicates categorical levels with large (>2) cell chi-squares contributing to global differences
Among the sociodemographic characteristics, the low interference phenotype (as compared to those in high interference phenotype) had significantly higher rates of White race and lower rates of Black race, higher rates of married and lower rates previously married, higher rates with at least a Bachelor’s degree of education and lower rates with less than a high school level of education, higher rates employed/student and lower rates retired or unemployed, lower rates of military history, higher rates living with a spouse/significant other, and higher rates of moderate alcohol use and lower rates of abstaining.
The low interference phenotype had significantly lower rates of violent etiologies than the high interference phenotype. There were no significant differences between groups for associated SCI or days of PTA. In addition, significant differences were found across all functional outcome measures such that the low interference phenotype had better functional outcomes compared to those in the high interference phenotype.
Differences were found in all pain characteristics examined: individuals in the low interference phenotype had significantly lower pain intensity scores, less endorsement of pain in all locations assessed, less frequent pain, lower rates of migraine or probable migraine and higher rates of no headache, lower rates of neuropathic pain, and less pain catastrophizing as compared to individuals in the high pain interference phenotype.
Finally, significant differences in pain treatment utilization rates were seen in many treatments. Individuals in the low pain interference phenotype reported lower utilization rates than those in the high interference phenotype. Among the medical services/treatments the low interference phenotype utilized significantly fewer treatments for all types of treatment. The low interference phenotype utilized significantly less physical and occupational therapy and pool/aquatic therapy, but had similar rates of yoga, tai chi, and home exercise programs compared to the high interference phenotype. Among the psychological services, the low interference phenotype utilized significantly less treatments, other than hypnotherapy which had similarly low rates among both groups. The low interference phenotype utilized significantly less acupuncture, but had similar rates of chiropractic and massage services as the high interference phenotype in the complementary and alternative medicine treatments. Lastly, the low interference phenotype utilized significantly less comprehensive pain rehabilitation programs than the high interference phenotype, but rates of utilization were low in both groups.
Multivariable Predictive Model for Discriminating Extreme Pain Interference Phenotypes
The LASSO regression process identified the following set of variables as important unique predictors of extreme phenotypes for pain interference (in order of relative importance): pain intensity, pain catastrophizing, leg/feet pain, neuropathic pain type, headache type, and hip pain. The estimated odds ratios and 95% confidence intervals discriminating extreme low interference and high interference phenotypes based on the multinomial logistic regression model with this set of predictors are summarized in Table 3. Significantly reduced odds of being in the extreme low interference versus extreme high interference phenotype were associated with higher BPI pain intensity scores (OR = 0.33 for a 1 unit increase), clinically significant positive (OR = 0.40) or unclear (OR = 0.49) neuropathic pain vs clinically significant negative neuropathic pain, migraine headache vs no head pain (OR = 0.41), higher pain catastrophizing (OR = 0.81 for a 1 unit increase), leg/feet pain (OR = 0.34), and hip pain (OR = 0.46). The pairwise AUC for discriminating extreme low interference and high interference phenotypes was 0.972 (outstanding).
Table 3:
Multivariable Logistic Model for Discriminating Extreme Low versus Extreme High Pain Interference Phenotypes (N = 1579 of 1762)
| Extreme Low vs Extreme High Pain Interference Phenotype | ||||
|---|---|---|---|---|
| Odds Ratio | 95% CI | p-value | ||
|
| ||||
| Pain Intensity† | 0.326 | (0.282, 0.378) | < 0.0001 | * |
|
| ||||
| Neuropathic Pain Type | ||||
| CS Positive vs CS Negative | 0.396 | (0.208, 0.754) | 0.0048 | * |
| CS Positive vs Unclear | 0.806 | (0.380, 1.709) | 0.5729 | - |
| Unclear vs CS Negative | 0.492 | (0.288, 0.840) | 0.0093 | * |
|
| ||||
| Headache Type | ||||
| Migraine vs No Headache | 0.413 | (0.264, 0.644) | 0.0001 | * |
| Migraine vs Other Headache | 0.685 | (0.305, 1.537) | 0.3585 | - |
| Other Headache vs No Headache | 0.602 | (0.279, 1.300) | 0.1964 | - |
|
| ||||
| Pain Catastrophizing† | 0.806 | (0.777, 0.835) | < 0.0001 | * |
|
| ||||
| Leg Pain (Yes vs No) | 0.337 | (0.219, 0.519) | < 0.0001 | * |
| Hip Pain (Yes vs No) | 0.462 | (0.301, 0.710) | 0.0004 | * |
CI = confidence interval; CS = clinically significant;
odds ratio shown for a 1 unit increase in predictor variable;
statistically significant at α = 0.05 or after Bonferroni correction of α = 0.0167 (Neuropathic Pain Type, Headache Type)
DISCUSSION
To our knowledge, this multicenter TBIMS study is the first to define and explore the concept of extreme phenotypes in chronic pain among individuals with TBI. We found that pain interference (the extent to which pain interfered with specific activities and functioning) varied widely such that extreme groups could be identified among those who endorsed experiencing current chronic pain. This suggests opportunities for future research utilizing extreme high and low pain interference, including how these extreme groups change over time, that may provide important insights on who benefits or not from certain interventions.
In our large sample of TBI survivors living with chronic pain, we identified several factors that significantly differed between the high and low extreme phenotype pain interference groups. Consistent with the broader literature on disparities in the experience of pain interference among US adults,41 our low pain interference phenotype was more commonly White and not Black/African American. Those in the low pain interference extreme phenotype were less likely to abstain from alcohol use and more likely to use moderately compared to the high pain interference group, perhaps suggesting lower consumption may reflect concern for the pain-precipitating effects of alcohol among those already experiencing higher pain interference42
While not statistically evaluated, the low pain interference extreme phenotype more closely resembled the no pain group described by Harrison-Felix, PhD et al.1 who were more likely to be married and less likely to be separated/divorced/widowed, be more likely to be employed and less likely to be retired or unemployed, and have more education compared to those with current chronic or past post-TBI chronic pain. Functional outcomes for those in the low pain interference extreme group were also similar to those in the no pain or past pain groups, suggesting that despite experiencing chronic pain, those who have low interference may be very similar to those without chronic pain.1 These results highlight the importance of considering the experience of pain (not just the presence of pain) in individuals with TBI.
As might be expected, we found that those in the low pain interference extreme group reported lower pain intensity, less frequent pain in any location, including headache pain, lower frequency of pain, and less likely to endorse neuropathic pain. They also reported significantly less pain catastrophizing which can be both consistent with less pain issues as above, but also may be related to better coping with pain which could then influence reports of pain issues.43,44
There were significant differences in pain treatment utilization rates with those in the low pain interference extreme phenotype utilizing less treatments generally. The majority of those who engaged in treatment utilized medical and exercise therapies and few participants engaged in psychological services or comprehensive pain programs despite these being endorsed in clinical practice guidelines.45,46 Despite many pain treatments being utilized, there were none that suggested higher utilization for those in the low interference extreme group and it may be likely that those with high interference continued to seek multiple treatments in order to address their ongoing pain difficulties.
The LASSO regression process identified potential multivariable factors that might help proactively identify participants who are more likely to be in the extreme low vs. high pain interference phenotypes. None of the sociodemographic, injury, or functional outcome variables were identified in the multivariable model; only pain characteristics were retained. This suggests that the experience of pain should be considered as potential factors for stratification in treatment studies of pain after TBI. In addition, while pain intensity is often queried during routine clinical visits, current findings suggest that identification of neuropathic sources for pain, classification of headache when applicable, consideration of pain location, and assessing pain catastrophizing are essential to address pain interference among those reporting chronic pain. These factors appear to distinguish those at greatest risk for chronic pain to cause severe limitation to their daily life. Additionally, pain catastrophizing is associated with increased pain intensity and known to have a deleterious impact on pain-related outcomes through person factors (including genetic and other central nervous system processes), pain duration, and psychosocial comorbidities (including depression and anxiety)43,44 and has been found to be modifiable so may be an important target for treatment. The potential utility of using the extreme phenotype approach in examining the relationship between pain interference and other comorbidities will be important to examine in future studies. These relationships may inform our understanding of the natural history of co-occurring conditions as well as whether subgroups are identified as better targets for newly developed/adapted treatment approaches.
Additional future research questions may be answered with the current data, although even with a large sample size, may be limited by examining subgroups by time post-injury, comparing civilians to Veterans, and examining comorbidities. Beyond the current database, additional data collection over time is needed to investigate factors that may initiate or perpetuate pain and pain interference over time, as well as whether individuals move in and out of the extreme phenotypes or across phenotypes. More detailed assessment connecting the experience of pain (e.g., timing, type) with treatment received is needed to understand what treatments may be beneficial to which individuals at what time point-injury. Finally, future research may consider other approaches to defining extreme phenotypes in those with chronic pain after TBI if the current approach does not lead to replication in future research or uptake into clinical practice.
This study has several limitations, including its cross-sectional design which precludes causal inference – which in the context of current findings could be particularly informative. For example, it is possible that high treatment-seeking in the high pain interference phenotype reflects the continued pursuit of relief from intractable/refractory pain such that care-seeking itself poses interference to daily life. It is also possible that those whose pain is most interfering are most compelled to seek remedy. The wide range of time since injury (1-30 years) in the current sample allows us to examine pain across time post-injury, but the lack of repeated individual pain measures limits our ability to identify when pain started or when treatments were received or make causal inferences. Extreme groups were defined in this study using the quartiles, similar to other phenotype approaches, and supported by our study advisory board; however, phenotype groups could also be defined and compared using more extreme definitions (e.g., 10th percentiles) or using other types of statistical classification (e.g., ±1.96 SD). The use of ordinal measures in the TBIMS and the Pain Survey (e.g., BPI, FIM, DRS, CSQ) is a limitation, and future research should consider using measures scaled to perform with interval level properties. Analyses conducted herein are constrained by data available, and unmeasured confounders may bias results. As with all studies relying on self-report, findings may be subject to recall bias.
While the TBIMS sample has been established to be largely representative of the population of adults admitted for acute, inpatient rehabilitation in the US with a primary diagnosis of TBI, the TBIMS tends to include participants with overall younger age at time of injury, higher employment rates at injury (and lower retirement rates), and longer rehabilitation length of stays.47,48 In addition, participants who completed the Pain Survey tended to be younger at follow-up, and had higher levels of education, were less likely to abstain from alcohol and more likely to be light drinkers, and tended to have better functional outcomes as measured by the DRS and GOS-E as compared to TBIMS participants who were eligible but did not complete the pain survey, although associated effect sizes were small.1 These differences may affect the generalizability of our results to the larger TBI population.
CONCLUSION
We used an extreme phenotyping approach to study pain interference in a community-based sample of individuals enrolled in the TBIMS who are 1-30 years post-TBI and living with current chronic pain. We found that pain characteristics, but not sociodemographic, injury, or functional outcome characteristics, were key determinants of pain interference extreme phenotypes. Results suggest that extreme phenotypes based on pain interference may be useful for future research examining the impact of newly developed or adapted interventions for pain after TBI. This work can also lead to better characterization of the lived experience of pain among TBI survivors with chronic pain which is necessary to identify those at risk for life-limiting pain. TBI survivors with chronic pain and high pain interference may require novel approaches to pain management, as current findings indicate this group sought a particularly broad range and quantity of pain management interventions which did not (as of the time of this study) achieve their intended outcomes.
Supplementary Material
Acknowledgements
James A. Haley Veteran’s Administration: The views expressed in this manuscript are those of the authors and do not necessarily represent the official policy or position of the Defense Health Agency, Department of Defense, or any other U.S. government agency. This work was prepared under Contract HT0014-22-C-0016 with DHA Contracting Office (CO-NCR) HT0014 and, therefore, is defined as U.S. Government work under Title 17 U.S.C.§101. Per Title 17 U.S.C.§105, copyright protection is not available for any work of the U.S. Government. For more information, please contact dha.TBICOEinfo@health.mil. UNCLASSIFIED
Other Contributions: The study authors would like to acknowledge staff at the following study sites for their efforts in recruitment, data collection, project management, and study design: James A. Haley Veteran’s Administration: Amanda Tweed, B.A., Bridget A. Cotner, Ph.D., George Rocek, M.S., Jennifer L. Murphy, Ph.D., Erin Brennan, M.S., Deveney Ching, M.A., Jordan Moberg, M.P.H., Danielle R. O’Connor, M.A., Curtis Takagishi, Ph.D., Georgia Kane, M.D.
Craig Hospital: Clare Morey, M.A., CCC-SLP, Dave Mellick Ph.D., William Williams, M.S., Wendy Beukelman, B.S., Marissa Lundstern, M.P.H., Selena Cruz, M.S., Allan L. Service, Ph.D.
University of Washington: Silas James, M.P.A.
Indiana University School of Medicine: Amanda Melton, Christina Miller, Darby Dyar, Victoria Hammond, Grace Brackemyre
Wayne State University School of Medicine: Carole Koviak, Renee Sun, and Robert Kotasek.
Mayo Clinic College of Medicine and Science: Dmitry Esterov, D.O.
Rusk Rehabilitation: Tamara Bushnik, Ph.D., Michelle Smith, M.P.H., C.H.E.S., Alejandro Zarate, B.S.
Baylor Scott and White Institute for Rehabilitation: Simon Driver, Ph.D., Librada Callender, M.P.H., Cynthia Dunklin, B.S., Aimee Muir, M.B.A., Stephanie Calhoun, B.S.
Virginia Commonwealth University: Katherine Abbasi, M.A., Karen Brooke, M.T., Laura Boylan, B.S., Laura Albert Suarez, B.A.
Moss Rehabilitation Research Institute: Amanda Rabinowitz, Ph.D., Kelly McLaughlin, B.A.
University of Alabama at Birmingham: Mitchell Drew Mauldin, B.S., Kay Canupp, M.S.N., C.R.N.P.
TIRR Memorial Herman: Jay Bogaards, M.A.
The Ohio State University: John D. Corrigan, Ph.D., Jennifer Bogner, Ph.D., Michael MaHaffey, B.S., Shivangi Bhardwaj, B.S., Ally Guiher, B.S., Nathaniel Dusseau II, B.S.
Kessler Foundation: Nancy Chiaravalloti, Ph.D., Jean Lengenfelder, Ph.D.
Carolinas Rehabilitation: Shanti Pinto, M.D., Tami Pringnitz Guerrier, C.B.I.S.T., C.R.A., Kimberly S. Welsh, B.S., C.B.I.S., Kelly Crawford, M.D.
JFK Johnson Rehabilitation Institute: Yelena Goldin, Ph.D., ABPP-CN, Monique Tremaine, Ph.D.
Conflicts of Interest and Source of Funding
The authors have no conflicts of interest. Research reported in this article was funded through the National Institute on Disability, Independent Living, and Rehabilitation (NIDILRR), a Center within the Administration for Community Living (ACL), Department of Health and Human Services (HHS) Collaborative Grant Award (90DPTB0017) which leveraged the infrastructure of the NIDILRR and the Department of Veterans Affairs (VA) TBI Model Systems programs of research (James A. Haley Veterans Hospital TBI Model Systems, IRB PR00000094; see additional acknowledgement, Characterization and Treatment of Chronic Pain after TBI, 90DPTB0017, IRB PR00039496; Craig Hospital, Rocky Mountain Regional TBI Model System, 90DPTB007 (2017-2022) and 90DPTB0020 (2022-2027), IRB 231579, Characterization and Treatment of Chronic Pain after TBI, 90DPTB0017, IRB 1335849; Craig Hospital TBI Model Systems National Data and Statistical Center, 90DP0084 (2016-2021) and 90DPTB0018 (2021-2026), IRB 231626; University of Washington School of Medicine, University of Washington TBI Model System, 90DPTB0008 (2017-2022) and 90DPTB0024 (2022-2027), IRB STUDY00001788; Indiana University School of Medicine, Indiana TBI Model System, 90DPTB0002 (2017-2022) and 90DPTB0022 (2022-2027), IRB 1211010085R006; Spaulding Rehabilitation Hospital, Harvard Medical School, Spaulding-Harvard TBI Model System, 90DPTB0011 (2017-2022) and 90DPTB0027 (2022-2027), IRB 2012P002476; Wayne State University School of Medicine, Southeastern Michigan TBI System, 90DPTB006 (2017-2022) and 90DPTB0030 (2022-2027), IRB 102908B3E; Mayo Clinic College of Medicine and Science, Mayo Clinic TBI Model System, 90DPTB0012 (2017-2022) and 90DPTB0031 (2022-2027), IRB 69-03; NYU Langone Health, Rusk Rehabilitation TBI Model System at NYU and Bellevue, 90DPTB0010 (2017-2022) and 90DPTB0034 (2022-2027), IRB 13-00056; Baylor Scott and White Institute for Rehabilitation, North Texas TBI Model System, 90DPTB0013 (2017-2022) and 90DPTB0023 (2022-2027), IRB 002-212; Virginia Commonwealth University, The Virginia TBI Model System (VTBIMS), 90DP0033 (2017-2022) and 90DBTB0021 (2022-2027), IRB PR00039496; Thomas Jefferson University, Moss Rehabilitation Research Institute, Moss TBI Model Systems 90DPTB0004 (2017-2022) and 90DPTB001 (2022-2027), IRB; University of Alabama at Birmingham, UAB TBI Model System, 90DPTB0015 (2017-2022) and 90DPTB0029 (2022-2027), IRB 980904002; TIRR Memorial Hermann, Texas TBI Model System at TIRR, 90DPTB0016 (2017-2022) and 90DPTB0025 (2022-2027), IRB H-21935; The Ohio State University College of Medicine, Ohio Regional TBI Model System, 90DPTB0001 (2017-2022) and 90DPTB0026 (2022-2027), IRB 1993H0142; Kessler Foundation, Northern New Jersey TBI System, 90DPTB0003 (2017-2022) and 90DPTB0032 (2022-2027), IRB R-597-07; Carolinas Rehabilitation, TBI Model System Follow-Up Center, TBI Model Systems National Data and Statistical Center, 90DP0084 (2017-2022) and 90DPTB0018 (2021-2026), IRB PR00022242; Icahn School of Medicine at Mount Sinai, The New York TBI Model System at Mount Sinai, 90DPTB0009 (2017-2022) and 90DPTB0028 (2022-2027), IRB 11-01799, IRB 22-0700; Hackensack Meridian JFK Johnson Rehabilitation, TBI Model System Projects at JFK Johnson Rehabilitation 90DPTB0014 (2017-2022), IRB CR00005522.) The views expressed in this manuscript are those of the authors and do not necessarily represent the official policy or position of NIDILRR, ACL, HHS; Defense Health Agency, Department of Army/Navy/Air Force, Department of Defense (DOD); Veterans Health Administration (VHA), or any other U.S. government agency. No official endorsement should be inferred.
Contributor Information
Jeanne M. Hoffman, Department of Rehabilitation Medicine, University of Washington School of Medicine, Seattle, WA
Jessica M. Ketchum, Craig Hospital Research Department, Englewood, CO
Stephanie Agtarap, Craig Hospital Research Department, Englewood, CO
Kristen Dams-O’Connor, Icahn School of Medicine at Mount Sinai, New York, NY
Flora M. Hammond, Department of Physical Medicine and Rehabilitation, Indiana University School of Medicine & Rehabilitation Hospital of Indiana, Indianapolis, IN
Aaron M. Martin, Mental Health and Behavioral Science Service, James A. Haley Veterans Hospital; Department of Psychiatry and Behavioral Neurosciences, University of South Florida, Tampa, FL
Mitch Sevigny, Craig Hospital Research Department, Englewood, CO
William C. Walker, Department of Physical Medicine and Rehabilitation, School of Medicine, Virginia Commonwealth University, Richmond, VA
Cynthia Harrison-Felix, Craig Hospital Research Department, Englewood, CO
Ross Zafonte, Department of Physical Medicine and Rehabilitation, Spaulding Rehabilitation Hospital, and Harvard Medical School, Boston, MA
Risa Nakase-Richardson, James A. Haley Veterans Hospital, Tampa, FL; Sleep and Pulmonary Division, Department of Internal Medicine, University of South Florida, Tampa, FL; Defense Health Agency Traumatic Brain Injury Center of Excellence, Tampa, FL
REFERENCES
- 1.Harrison-Felix C, Sevigny M, Beaulieu C, et al. Characterization and Treatment of Chronic Pain after Traumatic Brain Injury -- Comparison of Characteristics between Individuals with Current Pain, Past Pain and No Pain: A NIDILRR and VA TBI Model Systems Collaborative Project. J Head Trauma Rehabil. under review. [DOI] [PubMed] [Google Scholar]
- 2.Hoffman JM, Lucas S, Dikmen S, et al. Natural history of headache following traumatic brain injury. J Neurotraum. 2011;28(9):1719–1725. [DOI] [PMC free article] [PubMed] [Google Scholar]
- 3.Nampiaparampil DE. Prevalence of chronic pain after traumatic brain injury: a systematic review. Jama. 2008;300(6):711–719. [DOI] [PubMed] [Google Scholar]
- 4.Grace GM, Nielson WR, Hopkins M, Berg MA. Concentration and memory deficits in patients with fibromyalgia syndrome. J Clin Exp Neuropsyc. 1999;21(4):477–487. [DOI] [PubMed] [Google Scholar]
- 5.Park DC, Glass JM, Minear M, Crofford LJ. Cognitive function in fibromyalgia patients. Arthritis Rheum. 2001;44(9):2125–2133. [DOI] [PubMed] [Google Scholar]
- 6.Taylor BC, Hagel EM, Carlson KF, et al. Prevalence and costs of co-occurring traumatic brain injury with and without psychiatric disturbance and pain among Afghanistan and Iraq War Veteran V.A. users. Med Care. Apr 2012;50(4):342–6. doi: 10.1097/MLR.0b013e318245a558 [DOI] [PubMed] [Google Scholar]
- 7.Weiner DK, Rudy TE, Morrow L, Slaboda J, Lieber S. The Relationship Between Pain, Neuropsychological Performance, and Physical Function in Community‐Dwelling Older Adults with Chronic Low Back Pain. Pain Med. 2006;7(1):60–70. [DOI] [PubMed] [Google Scholar]
- 8.Bair MJ, Robinson RL, Katon W, Kroenke K. Depression and pain comorbidity: a literature review. Arch Intern Med. 2003;163(20):2433–2445. [DOI] [PubMed] [Google Scholar]
- 9.McCracken LM, Iverson GL. Predicting complaints of impaired cognitive functioning in patients with chronic pain. J Pain Symptom Manage. May 2001;21(5):392–6. [DOI] [PubMed] [Google Scholar]
- 10.Beetar JT, Guilmette TJ, Sparadeo FR. Sleep and pain complaints in symptomatic traumatic brain injury and neurologic populations. Arch Phys Med Rehabil. Dec 1996;77(12):1298–302. doi:S0003-9993(96)90196-3 [pii] [DOI] [PubMed] [Google Scholar]
- 11.Dworkin RH, Turk DC, Wyrwich KW, et al. Interpreting the clinical importance of treatment outcomes in chronic pain clinical trials: IMMPACT recommendations. Consensus Development Conference Research Support, Non-U.S. Gov’t. J Pain. Feb 2008;9(2):105–21. doi: 10.1016/j.jpain.2007.09.005 [DOI] [PubMed] [Google Scholar]
- 12.Pérez-Gracia JL, Gúrpide A, Ruiz-Ilundain MG, et al. Selection of extreme phenotypes: the role of clinical observation in translational research. Clinical and Translational Oncology. 2010;12(3):174–180. [DOI] [PMC free article] [PubMed] [Google Scholar]
- 13.Singer E ‘Phenome’project set to pin down subgroups of autism. Nature Publishing Group; 2005. [DOI] [PubMed] [Google Scholar]
- 14.Nebert DW. Extreme discordant phenotype methodology: an intuitive approach to clinical pharmacogenetics. Eur J Pharmacol. 2000;410(2–3):107–120. [DOI] [PubMed] [Google Scholar]
- 15.Pugh MJ, Kennedy E, Prager EM, et al. Phenotyping the Spectrum of Traumatic Brain Injury: A Review and Pathway to Standardization. Journal of Neurotrauma. 2021/12/01 2021;38(23):3222–3234. doi: 10.1089/neu.2021.0059 [DOI] [PMC free article] [PubMed] [Google Scholar]
- 16.Kamins J, Richards R, Barney BJ, et al. Evaluation of posttraumatic headache phenotype and recovery time after youth concussion. JAMA network open. 2021;4(3):e211312–e211312. [DOI] [PMC free article] [PubMed] [Google Scholar]
- 17.Song K, Wang C-P, McGeary DD, et al. Five-year Pain Intensity and Treatment Trajectories of Post-9/11 Veterans With Mild Traumatic Brain Injury. The Journal of Pain. 2020/09/01/ 2020;21(9):1005–1017. doi: 10.1016/j.jpain.2019.12.009 [DOI] [PMC free article] [PubMed] [Google Scholar]
- 18.Robayo LE, Govind V, Vastano R, et al. Multidimensional pain phenotypes after traumatic brain injury. Frontiers in Pain Research. 2022;3:947562. [DOI] [PMC free article] [PubMed] [Google Scholar]
- 19.Song K, Brintz BJ, Wang C-P, et al. Complex pain phenotypes: Suicidal ideation and attempt through latent multimorbidity. PLOS ONE. 2022;17(4):e0267844. doi: 10.1371/journal.pone.0267844 [DOI] [PMC free article] [PubMed] [Google Scholar]
- 20.Zhang Q, Balourdas D-I, Baron B, et al. Evolutionary history of the p53 family DNA-binding domain: insights from an Alvinella pompejana homolog. Cell Death & Disease. 2022;13(3):214. [DOI] [PMC free article] [PubMed] [Google Scholar]
- 21.Oh SY, Edwards A, Mandelson MT, et al. Rare long-term survivors of pancreatic adenocarcinoma without curative resection. World Journal of Gastroenterology. 2015;21(48):13574. [DOI] [PMC free article] [PubMed] [Google Scholar]
- 22.Emery EC, Habib AM, Cox JJ, et al. Novel SCN9A mutations underlying extreme pain phenotypes: unexpected electrophysiological and clinical phenotype correlations. Journal of Neuroscience. 2015;35(20):7674–7681. [DOI] [PMC free article] [PubMed] [Google Scholar]
- 23.Buchheit T, Van de Ven T, Hsia H-LJ, et al. Pain phenotypes and associated clinical risk factors following traumatic amputation: results from Veterans Integrated Pain Evaluation Research (VIPER). Pain Medicine. 2016;17(1):149–161. [DOI] [PMC free article] [PubMed] [Google Scholar]
- 24.Miettinen T, Kautiainen H, Mäntyselkä P, Linton SJ, Kalso E. Pain interference type and level guide the assessment process in chronic pain: Categorizing pain patients entering tertiary pain treatment with the Brief Pain Inventory. PLoS One. 2019;14(8):e0221437. [DOI] [PMC free article] [PubMed] [Google Scholar]
- 25.Blakey SM, Wagner HR, Naylor J, et al. Chronic Pain, TBI, and PTSD in Military Veterans: A Link to Suicidal Ideation and Violent Impulses? The Journal of Pain. 2018/07/01/ 2018;19(7):797–806. doi: 10.1016/j.jpain.2018.02.012 [DOI] [PMC free article] [PubMed] [Google Scholar]
- 26.Dijkers MP, Harrison-Felix C, Marwitz JH. The traumatic brain injury model systems: history and contributions to clinical service and research. The Journal of head trauma rehabilitation. 2010;25(2):81–91. [DOI] [PubMed] [Google Scholar]
- 27.Dijkers MP, Marwitz JH, Harrison-Felix C. Thirty years of national institute on disability, independent living and rehabilitation research traumatic brain injury model system centers research–an update. The Journal of head trauma rehabilitation. 2018;33(6):363. [DOI] [PMC free article] [PubMed] [Google Scholar]
- 28.Cleeland CS, Ryan K. The brief pain inventory. Pain Research Group. 1991;20:143–147. [Google Scholar]
- 29.Keith RA. The functional independence measure: a new tool for rehabilitation. Adv Clin Rehabil. 1987;1:6–18. [PubMed] [Google Scholar]
- 30.Rappaport M, Hall KM, Hopkins K, Belleza T, Cope DN. Disability rating scale for severe head trauma: Coma to community. Arch Phys Med Rehabil. 1982;63:118–123. [PubMed] [Google Scholar]
- 31.Wilson J, Pettigrew L, Teasdale G. Emotional and cognitive consequences of head injury in relation to the Glasgow Outcome Scale. Journal of Neurology, Neurosurgery & Psychiatry. 2000;69(2):204–209. [DOI] [PMC free article] [PubMed] [Google Scholar]
- 32.Freynhagen R, Baron R, Gockel U, Tolle TR. painDETECT: a new screening questionnaire to identify neuropathic components in patients with back pain. Multicenter Study Research Support, Non-U.S. Gov’t Validation Studies. Curr Med Res Opin. Oct 2006;22(10):1911–20. doi: 10.1185/030079906X132488 [DOI] [PubMed] [Google Scholar]
- 33.Lucas S, Hoffman JM, Bell KR, Walker W, Dikmen S. Characterization of headache after traumatic brain injury. Cephalalgia. Jun 2012;32(8):600–6. doi:0333102412445224 [pii] 10.1177/0333102412445224 [DOI] [PubMed] [Google Scholar]
- 34.Yang M, Rendas-Baum R, Varon SF, Kosinski M. Validation of the Headache Impact Test (HIT-6™) across episodic and chronic migraine. Cephalalgia. 2011;31(3):357–367. [DOI] [PMC free article] [PubMed] [Google Scholar]
- 35.Jensen MP, Keefe FJ, Lefebvre JC, Romano JM, Turner JA. One-and two-item measures of pain beliefs and coping strategies. Pain. 2003;104(3):453–469. [DOI] [PubMed] [Google Scholar]
- 36.Chow S-C, Shao J, Wang H, Lokhnygina Y. Sample size calculations in clinical research. CRC press; 2017. [Google Scholar]
- 37.Adams MH, Dobscha SK, Smith NX, Yarborough BJ, Deyo RA, Morasco BJ. Prevalence and correlates of low pain interference among patients with high pain intensity who are prescribed long-term opioid therapy. The Journal of Pain. 2018;19(9):1074–1081. [DOI] [PMC free article] [PubMed] [Google Scholar]
- 38.Tibshirani R Regression shrinkage and selection via the lasso. Journal of the Royal Statistical Society: Series B (Methodological). 1996;58(1):267–288. [Google Scholar]
- 39.Hastie T, Qian J, Tay K. An Introduction to glmnet. Accessed March 17, 2023. https://glmnet.stanford.edu/articles/glmnet.html
- 40.Hosmer DW Jr, Lemeshow S, Sturdivant RX. Applied logistic regression. vol 398. John Wiley & Sons; 2013. [Google Scholar]
- 41.Yang Y, Reid MC, Grol-Prokopczyk H, Pillemer K. Racial-ethnic disparities in pain intensity and interference among middle-aged and older US adults. The Journals of Gerontology: Series A. 2022;77(2):e74–e81. [DOI] [PMC free article] [PubMed] [Google Scholar]
- 42.Davis-Martin RE, Polk AN, Smitherman TA. Alcohol use as a comorbidity and precipitant of primary headache: review and meta-analysis. Current pain and headache reports. 2017;21:1–12. [DOI] [PubMed] [Google Scholar]
- 43.McGeary C, Nabity P, Reed D, et al. A test of the fear avoidance model to predict chronic pain outcomes in a polytrauma sample. NeuroRehabilitation. 2020;47(1):35–43. [DOI] [PubMed] [Google Scholar]
- 44.Quartana PJ, Campbell CM, Edwards RR. Pain catastrophizing: a critical review. Expert review of neurotherapeutics. 2009;9(5):745–758. [DOI] [PMC free article] [PubMed] [Google Scholar]
- 45.Pangarkar SS, Kang DG, Sandbrink F, et al. VA/DoD clinical practice guideline: diagnosis and treatment of low back pain. Journal of general internal medicine. 2019;34:2620–2629. [DOI] [PMC free article] [PubMed] [Google Scholar]
- 46.Kligler B, Bair MJ, Banerjea R, et al. Clinical policy recommendations from the VHA state-of-the-art conference on non-pharmacological approaches to chronic musculoskeletal pain. Journal of general internal medicine. 2018;33:16–23. [DOI] [PMC free article] [PubMed] [Google Scholar]
- 47.Corrigan JD, Cuthbert JP, Whiteneck GG, et al. Representativeness of the Traumatic Brain Injury Model Systems National Database. Research Support, N.I.H., Extramural Research Support, Non-U.S. Gov’t Research Support, U.S. Gov’t, Non-P.H.S. J Head Trauma Rehabil. Nov-Dec 2012;27(6):391–403. doi: 10.1097/HTR.0b013e3182238cdd [DOI] [PMC free article] [PubMed] [Google Scholar]
- 48.Cuthbert JP, Corrigan JD, Whiteneck GG, et al. Extension of the representativeness of the Traumatic Brain Injury Model Systems National Database: 2001 to 2010. Research Support, N.I.H., Extramural Research Support, U.S. Gov’t, Non-P.H.S. Research Support, U.S. Gov’t, P.H.S. J Head Trauma Rehabil. Nov-Dec 2012;27(6):E15–27. doi: 10.1097/HTR.0b013e31826da983 [DOI] [PMC free article] [PubMed] [Google Scholar]
Associated Data
This section collects any data citations, data availability statements, or supplementary materials included in this article.