

Abstract
Objective:
To develop the International Cardiac Arrest Research (I-CARE), a harmonized multicenter clinical and electroencephalography (EEG) database for acute hypoxic-ischemic brain injury research involving patients with cardiac arrest.
Design:
Multicenter cohort, partly prospective and partly retrospective.
Setting:
Seven academic or teaching hospitals from the U.S. and Europe.
Patients:
Individuals aged 16 or older who were comatose after return of spontaneous circulation following a cardiac arrest who had continuous EEG monitoring were included.
Interventions:
Not applicable.
Measurements and Main Results:
Clinical and EEG data were harmonized and stored in a common Waveform Database (WFDB)-compatible format. Automated spike frequency, background continuity, and artifact detection on EEG were calculated with 10 second resolution and summarized hourly. Neurological outcome was determined at 3–6 months using the best Cerebral Performance Category (CPC) scale. This database includes clinical data and 56,676 hours (3.9 TB) of continuous EEG data for 1,020 patients. Most patients died (N=603, 59%), 48 (5%) had severe neurological disability (CPC 3 or 4), and 369 (36%) had good functional recovery (CPC 1–2). There is significant variability in mean EEG recording duration depending on the neurological outcome (range 53–102h for CPC 1 and CPC 4, respectively). Epileptiform activity averaging 1Hz or more in frequency for at least one hour was seen in 258 (25%) patients (19% for CPC 1–2 and 29% for CPC 3–5). Burst suppression was observed for at least one hour in 207 (56%) and 635 (97%) patients with CPC 1–2 and CPC 3–5, respectively.
Conclusions:
The I-CARE consortium EEG database provides a comprehensive real-world clinical and EEG dataset for neurophysiology research of comatose patients after cardiac arrest. This dataset covers the spectrum of abnormal EEG patterns after cardiac arrest, including epileptiform patterns and those in the ictal-interictal continuum.
Keywords: EEG, hypoxic-ischemic encephalopathy, heart arrest, machine learning, database
Introduction
More than 6 million cardiac arrests happen every year worldwide, with survival rates ranging from 1% to 10% depending on geographic location(1, 2). Severe brain injury is the most common cause of death for patients surviving initial resuscitation, with most survivors admitted to an intensive care unit (ICU) being comatose (3). During the first few days following cardiac arrest, clinicians routinely monitor patients for seizures and start to gather data to inform prognostication, i.e., determine the probability that the patient will have a poor outcome or eventually recover neurological function. Many abnormal EEG patterns seen in these patients do not meet criteria for electrographic seizures, but they may lay in the ictal-interictal continuum and may require specific management guided by the EEG data (4). A poor prognosis prediction typically leads to the withdrawal of life sustaining therapies and death (5). However, reports of neurological recovery despite an initial poor prognosis exist in literature, underscoring the need of multimodal and thoughtful evaluation of these patients (6–9).
Clinical dilemmas about seizure management and prognostication emphasize the role of brain monitoring with electroencephalography (EEG) to provide direct assessment of brain function post-cardiac arrest (7, 10). Specific EEG signatures reflect brain injury or potential for neurological recovery. Clinical neurophysiologists have come to recognize numerous patterns of brain activity that help predict outcomes following cardiac arrest, including the presences of burst suppression (alternating periods of high and low voltage), seizures, or status epilepticus. Several studies have shown that the longitudinal evolution of these EEG patterns and transition between them may provide additional prognostic information (11–15). However, qualitative interpretation of continuous EEG is laborious, expensive, and requires review from neurologists with advanced training in neurophysiology who are not available in most medical centers.
Automated analysis of continuous EEG data has the potential to improve prognostic accuracy and to increase access to brain monitoring where experts are not readily available (13, 14, 16–19). However, the datasets used in most studies typically involve small numbers of patients (<100) from single medical centers, which are unsuitable for high-quality machine learning analyses (7). To overcome this limitation the International Cardiac Arrest REsearch consortium (I-CARE) assembled a large representative set of clinical and EEG data from comatose patients with cardiac arrest who underwent continuous EEG monitoring following cardiac arrest and had neurologic outcomes assessed.
Methods
This database consists of retrospectively obtained clinical and EEG data from four academic hospitals in the United States (Beth Israel Deaconess Medical Center, Brigham and Women’s Hospital, Massachusetts General Hospital, and Yale New Haven Medical Center), and prospectively collected data from two hospitals in the Netherlands (Medisch Spectrum Twente and Rinjstate Hospital) and one from Belgium (Erasme Hospital). Data from the two hospitals from the Netherlands was analyzed as a single institution as both hospitals and investigators are affiliated with the same University. Independent Institutional Review Board approvals at participating hospitals were pursued - Beth Israel Deaconess Medical Center Committee on Clinical Investigations (2015P000004): Brain Data Science Contributing Collaborators Consortium (July 1st, 2015); Massachusetts General Brigham Human Research Protection Program (2013P001024): A Database to Support Large-Scale Acute Care Research (October 24th, 2013); Yale Human Investigation Committee (111009342): Urgent Inpatient EEG and Multimodality Monitoring Databank; The Medical Research Ethics Committee Twente (K12–01): EEG measurements in the ICU (January 2nd, 2012); Erasme Hospital Ethics Committee (P2014/119): Critical Care EEG Monitoring Research Database (May 30, 2014). Need for informed consent was waived by the institutional review board at all participating centers for analysis of data obtained as part of routine medical care. Informed consent was obtained on clinical follow up from surviving patients in the University of Twente cohort.
Local Data Deidentification
Each individual hospital pursued deidentification of the clinical and EEG data locally (Figure 1). All US hospitals had EEGs recorded using Natus Neuroworks software and apmplifiers (Natus Medical Incorporated, Middleton, WI). Hospitals in the Netherlands used the Neurocenter EEG software with a TMSi amplifier (Oldenzaal, Netherlands). The hospital in Belgium used OSG BrainRT software and a Schwarzer Ahns amplifiers (Kontich, Belgium). To protect patient privacy, all ages above 89 were aggregated into a single category and encoded as “90”. Each institution contributed their data to a central repository (bdsp.io).
Figure 1: Clinical and EEG data processing and data sharing.
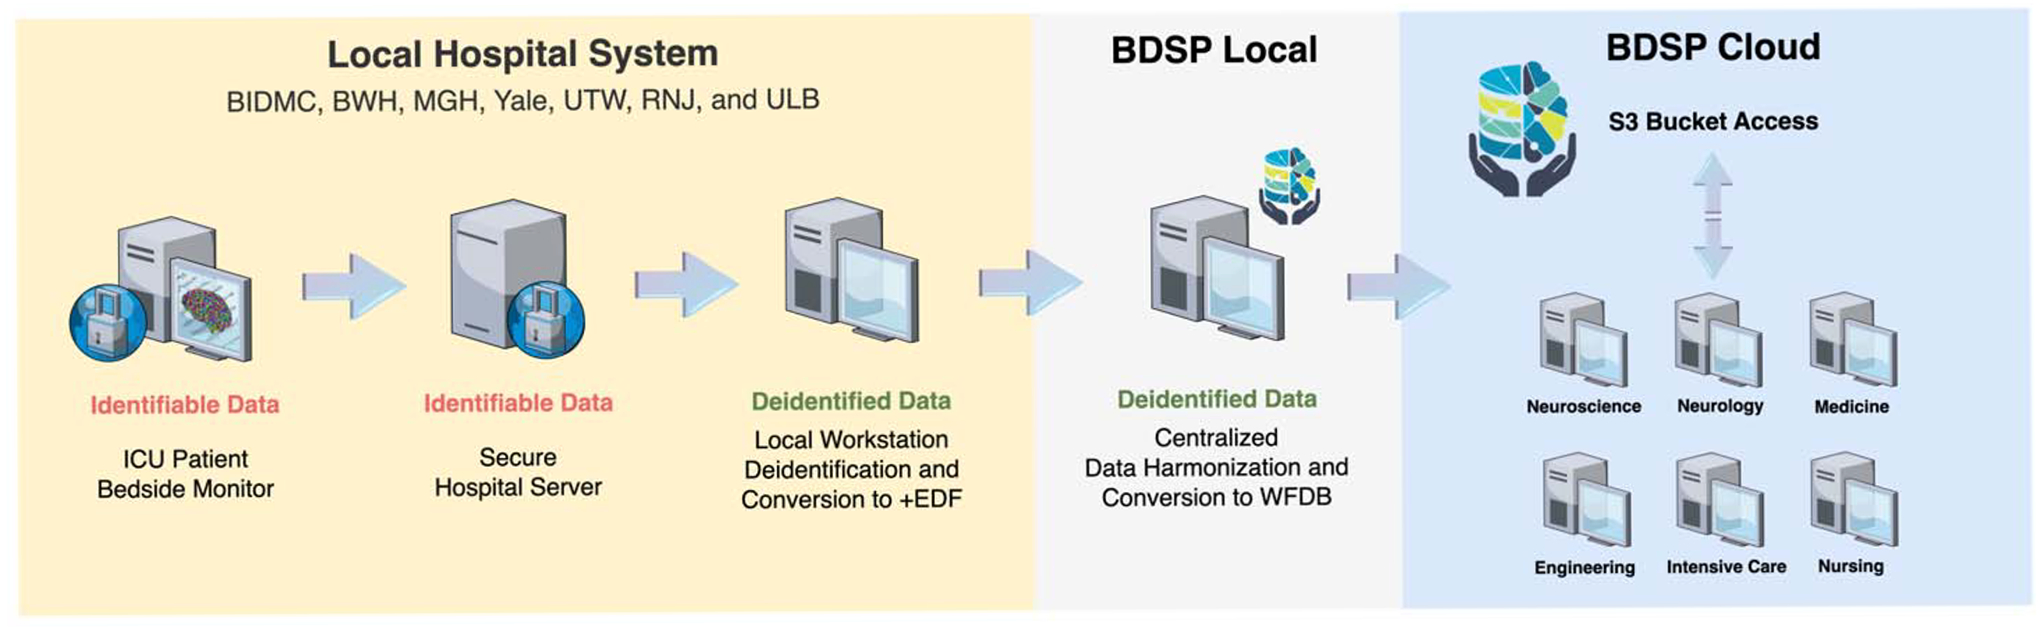
Each institution recorded EEG from patients in the ICU and have files stored in a local served (identifiable data). Custom software in a local workstation was used to convert the original EEG data from the server into a deidentified EDF+ file. The deidentified files were transferred to a centralized server at the BDSP where data was first converted to .mat format using EEGLAB and then harmonized into WFDB format. The final files were upload to a S3 bucket in the BDSP cloud, which is accessible for direct analysis in the cloud or user workstations.
BIDMC: Beth Israel Deaconess Medical Center; BWH: Brigham and Women’s Hospital; MGH: Massachusetts General Hospital; Yale: Yale New Haven Medical Center, UTW: University of Twente (Medisch Spectrum Twente); RJN: Rinjstate Hospital; ULB: Université Libre de Bruxelles (Erasme Hospital); ICU: Intensive care unit; EDF+: European Data Format; WFDB: Waveform Database; BDSP: Brain Data Science Platform; S3: Simple Storage Service.
Central Data Processing and Cloud Sharing
Data from individual hospitals were centrally harmonized. First, the .edf files from each center were harmonized using MATLAB software R2022a and EEGLAB Toolbox (v.2022.1) to .mat files. Then, the .mat EEG files and clinical data were converted into the Waveform Database (WFDB)-compatible format with 16-bit representation for the signal data. Sampling rate ranged from 200 Hz to 2,040 Hz. There is also ECG data recorded simultaneously with the EEG data for most patients. No filtering was performed in files included in the database. The EEG data were timed based on the time of ROSC. The final files were uploaded to a central cloud repository using an Amazon S3 object storage. This system allows for open data access and analysis using a secure and auditable cloud environment.
Clinical Data
Patients 16 years or older with out-of-hospital or in-hospital cardiac arrest who had return of spontaneous circulation (ROSC) were included. All comatose patients included were admitted to an ICU and underwent EEG monitoring (coma is defined as Glasgow Coma Scale <9 or inability to follow commands). The EEG monitoring is typically started within hours of cardiac arrest and continues for several hours to days depending on the patients’ condition, therefore recording start time and duration vary from patient to patient. Patient information includes information recorded at the time of admission (age, sex), location of arrest (out-of-hospital or in-hospital), and type of cardiac rhythm recorded at the time of resuscitation (shockable rhythms include ventricular fibrillation or ventricular tachycardia and non-shockable rhythms include asystole and pulseless electrical activity, or unknown). The time between cardiac arrest and ROSC is provided for patients who had that information recorded by the emergency medical services team. In most patients, temperature after cardiac arrest was controlled using closed-loop feedback targeted temperature management (TTM) device, with the temperature level set at 33 degrees Celsius, 36 degrees Celsius, or no set temperature. Sedation and analgesia were used as needed by treating clinicians. Sedatives used and typical dose ranges were: propofol (25–80 mcg/kg/min), midazolam (0.1–0.7 mg/kg/h), or fentanyl (25–200 mcg/h). Propofol was the initial sedative of choice for six hospitals, and one institution used midazolam instead. Neuromuscular blockade during TTM initiation was only systematically used in one institution, with the remaining hospitals using neuromuscular blockade on an as-needed basis.
Patient Outcomes
Neurological outcome was determined prospectively in two hospitals from the Netherlands by phone interview (at 6 months from ROSC). For the remaining five hospitals, neurological outcome was retrospectively determined through chart review only (at 3–6 months from ROSC). Neurological function was determined using the best Cerebral Performance Category (CPC) scale (20). In the five hospitals without prospective follow up, patients who achieved good neurological function (CPC score of 1 or 2) by the time of hospital discharge were considered to have achieved their best CPC score and no additional chart review was performed. The CPC is an ordinal scale ranging from 1 to 5:
CPC = 1: good neurological function and independent for activities of daily living.
CPC = 2: moderate neurological disability but independent for activities of daily living.
CPC = 3: severe neurological disability.
CPC = 4: unresponsive wakefulness syndrome (previously known as vegetative state).
CPC = 5: dead.
EEG data
Each EEG file contains an array with EEG signals from 19 channels recorded using the 10–20 international system that has been harmonized. Additional channels included in the recordings (e.g., additional reference or ECG channels) may be present for some patients and they have been included as well. Patients may need to have brain monitoring interrupted transiently while in the ICU, so gaps in the data can be present. The EEG recordings can continue for hours to days, so the EEG signals are prone to quality deterioration from non-physiological artifacts. It is routine practice to continue EEG for 24–72h, but recordings may be abbreviated or prolonged if patients regain consciousness, have withdrawal of life-sustaining therapies, die, or develop seizures.
Quantitative EEG analysis
To illustrate EEG data trends across outcomes for participating hospitals included in this database, we acquired two quantitative EEG (QEEG) features representing epileptiform activity frequency (spike frequency) and background continuity (background continuity index [BCI]) (21). Prior to QEEG feature analysis, the EEG signals were resampled to 100 Hz and underwent frequency filtering (0.5–50 Hz). Independent component analysis was applied to attenuate artifacts prior to averaging features for consecutive 10-second epochs (EEGLAB Toolbox, v.2022.1). Artifact was detected for individual channels for every consecutive five seconds of EEG data. There were two types of EEG artifacts acquired: 1) overly high signal amplitude (average five-second amplitude above 500 μV or any signal with amplitude above 900 μV for more than 0.1 second) and 2) presence of a flat an invariant background (signal value with standard deviation < 0.2 μV for more than two seconds). Five-second epochs without any type of artifact detected were considered artifact-clean. For each hour, patients with less than 50% of the EEG data considered artifact-clean had the non-artifactual data averaged and used for analyses. Segments with 50% or more of artifactual data were excluded from the QEEG analysis.
The BCI reflects the fraction of EEG not spent in suppression and ranges between 0 and 1. Suppressions were defined as segments with amplitudes of <10 μV for at least 0.5 seconds. Spike frequency was determined based on the number of epileptiform discharges detected in consecutive five-minute epochs using a modified version of the automated spike detection algorithm (SpikeNet) (16). The SpikeNet algorithm has a 0.5 Hz resolution, therefore discrete wavelet transform followed by peak detection was pursued to identify additional spikes within a half-second window (findpeaks) using the MATLAB signal processing toolbox. A dynamic amplitude threshold based on the signal distribution at each 500 ms window that had a spike detected using SpikeNet was applied to determine the spike frequency. We used the one-hour average QEEG value for artifact-clean data to classify the QEEG data in one of five categories based on: 1) the presence of spikes with 1 Hz or more frequency (category: epileptiform activity present) or 2) across four levels of background continuity (continuous [BCI >90%], discontinuous [BCI 50–90%], burst suppression [BCI 10–50%], and suppressed [BCI <10%]). Patients classified under the epileptiform activity category were not included in the four continuity categories, therefore each individual patient could only be included in a single category at each hour. Code for feature acquisition is available in an online repository (https://github.com/bdsp-core).
Algorithms
The I-CARE dataset was used as part of the George B. Moody PhysioNet Challenge 2023 (22, 23). The PhysioNet Challenges are annual data science competitions that invite international teams from academia and industry to develop algorithmic, open-source approaches for addressing unsolved problems. The PhysioNet Challenge 2023 asked teams to use the I-CARE dataset to predict the neurological recovery of patients at 72 hours after ROSC.
Results
One thousand and twenty patients were included with a total of 56,676 hours of EEG data (Figure 2 and Figure S1). Six hundred and three patients died (59%), 48 (5%) survived with severe neurological disability (CPC 3 or 4), and 369 (36%) had good functional recovery (CPC 1–2). Chart review for best CPC determination at 3–6 months was pursued for less than 2% of patients as the majority of patients died or had a CPC of 1–2 at the time of discharge. The median time to EEG initiation from the time of ROSC was 14 (IQR: 15) hours. Mean duration of EEG recording was longer for patients with CPC 3 or CPC 4 (71 and 102 hours, respectively) compared to patients with CPC 1, CPC 2, or CPC 5 (53–61 hours). Most patients (77%) underwent TTM with a goal of 33 degrees Celsius. Patient characteristics and EEG recording information are summarized in Table 1 and Table S1.
Figure 2: EEG data availability per hour from the time of ROSC stratified by neurologic outcome (CPC).
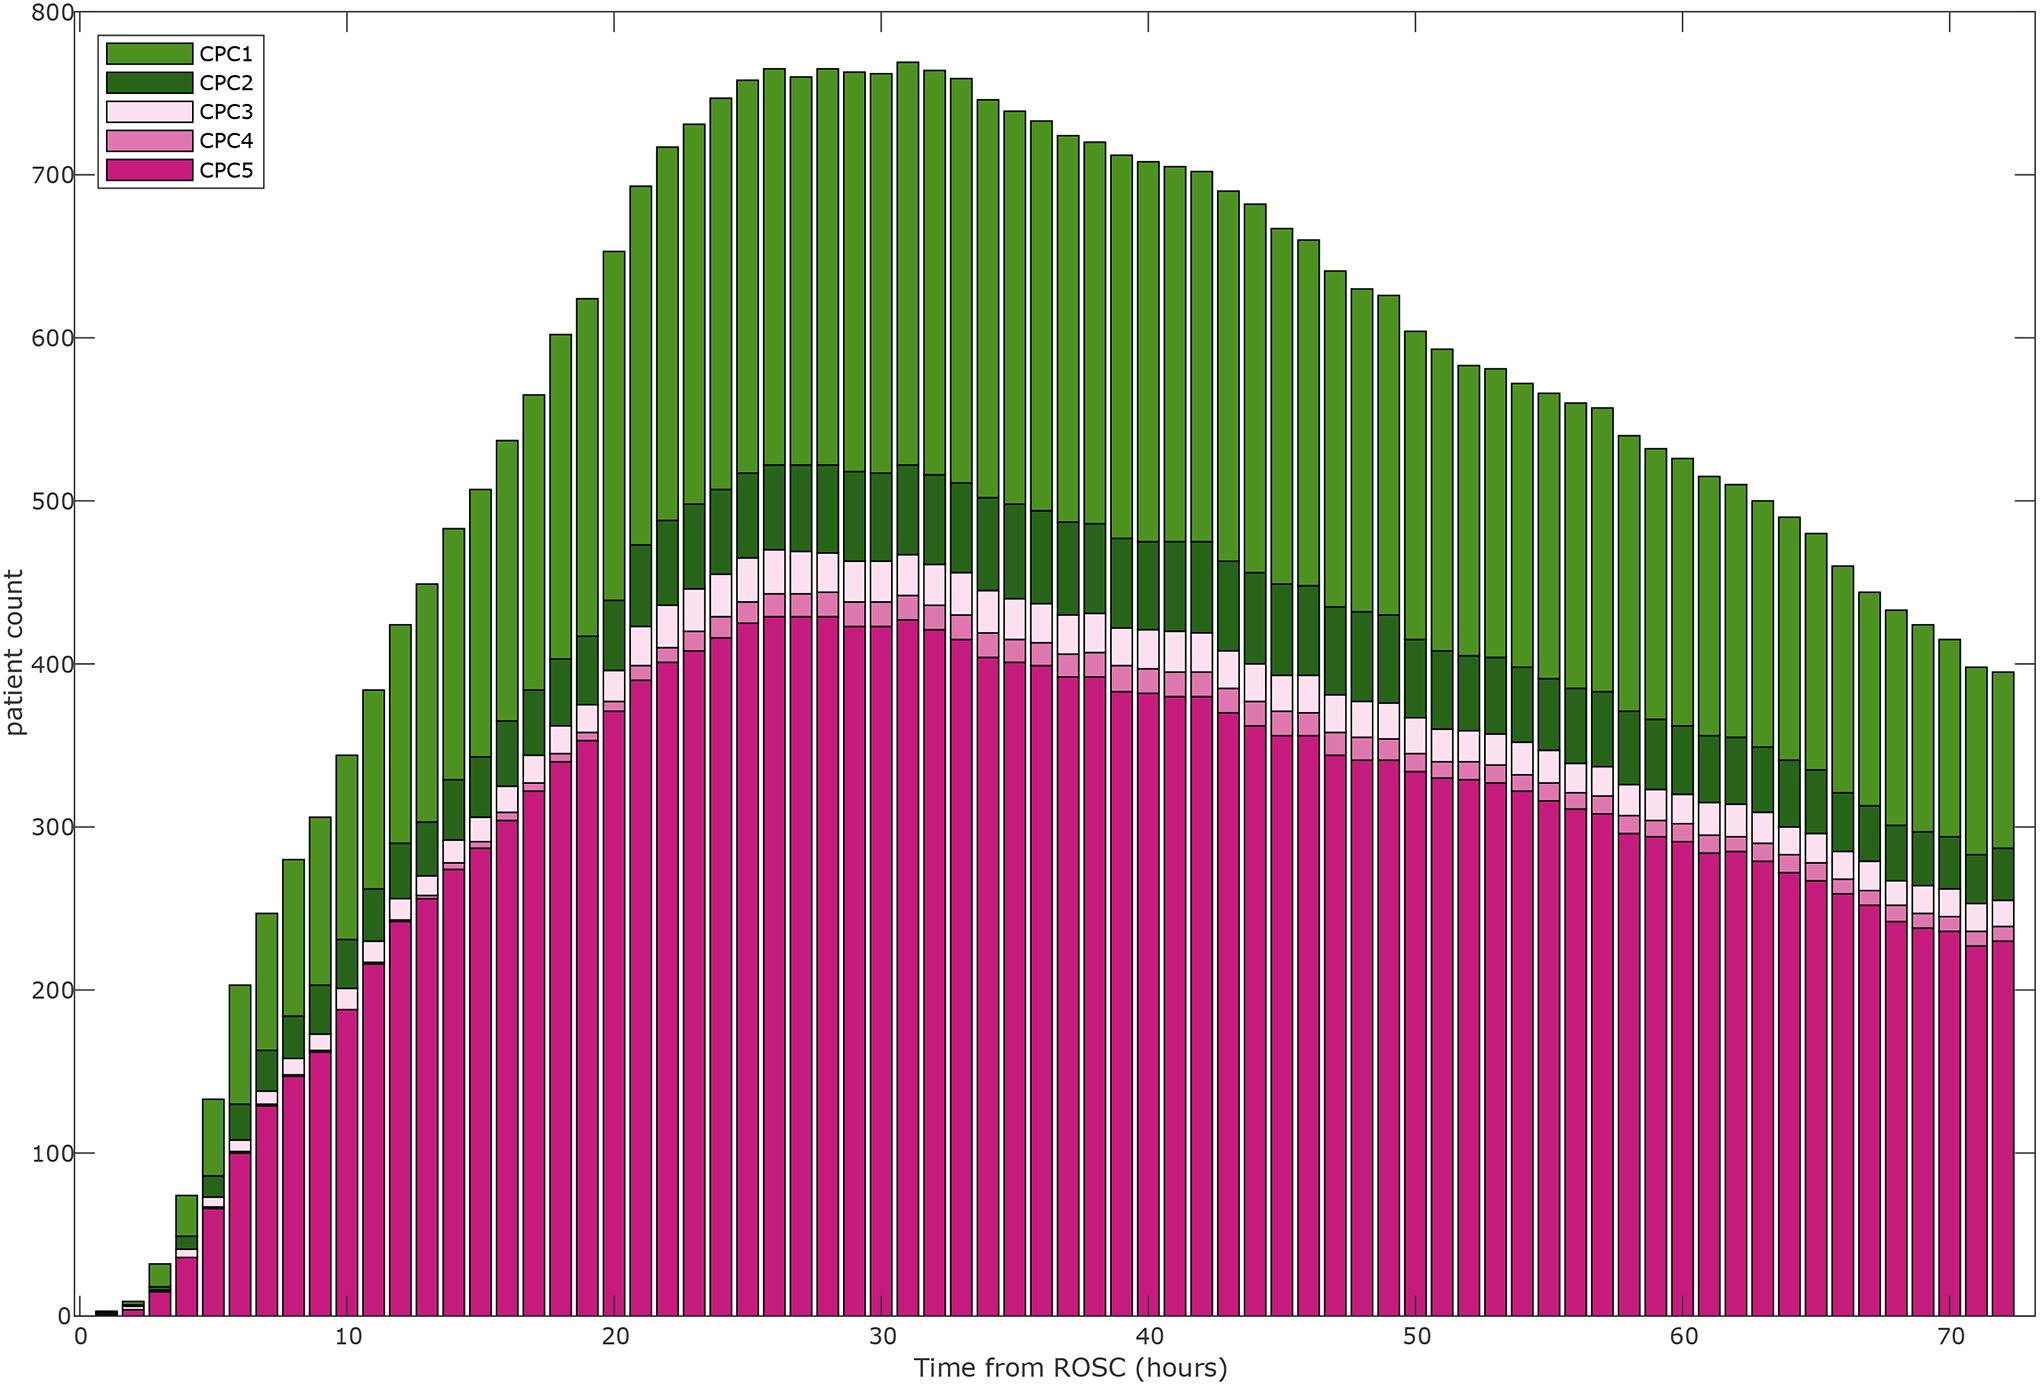
CPC: Cerebral Performance Category; ROSC: return of spontaneous circulation.
Table 1.
Patient Demographics Stratified by Neurological Outcome
| CPC 1 | CPC 2 | CPC 3 | CPC 4 | CPC5 | |
|---|---|---|---|---|---|
| Number of subjects | 300 | 69 | 31 | 17 | 603 |
| Age (years, mean, median, STD, IQR) | 57,58,15,20 | 56,57,14,17 | 66,69,11,16 | 53,53,20,37 | 62,65,16,21 |
| Female (%) | 88 (29) | 17 (25) | 11 (35) | 8 (47) | 198 (32) |
| Shockable Rhythm (%) | 214 (71) | 47 (68) | 13 (41) | 7 (41) | 188 (31) |
| TTM 33 (%) | 232 (77) | 55(79) | 21 (67) | 11 (64) | 468 (78) |
| TTM 36 | 28 (0.1) | 6 (0.09) | 5 (16) | 0 (0) | 41 (0.07) |
| No TTM | 40 (0.13) | 8 (0.12) | 5 (16) | 6 (35) | 94 (16) |
| EEG start time from ROSC (hours, mean, median, STD, IQR) | 15,13,12,14 | 13,12,10,15 | 15,14,13,14 | 19,20,6,8 | 17,14,13,14 |
| EEG duration (hours, mean, median, STD, IQR) | 53,47,35,35 | 61,48,41,27 | 71,65,51,39 | 102,110,60,98 | 54,46,40,45 |
CPC: Cerebral Performance Category
ROSC: return of spontaneous circulation
STD: standard deviation
IQR: interquantile range
Epileptiform activity was present for at least one hour in 258 (25%) patients (Figure 3). Time to start of epileptiform activity ranged from 4 to 72 hours from time of cardiac arrest. Most patients with epileptiform activity had a poor neurological outcome, but 69 (19%) of patients with CPC of 1–2 had epileptiform activity. In contrast, 177 (64%) patients with a continuous background within 24h had good neurological recovery. Burst suppression was observed for at least one hour in 150 (41%) and 378 (58%) of patients with CPC 1–2 and CPC 3–5 and a suppressed background in 57 (16%) and 257 (40%), respectively. One in four patients (N=96) with burst suppression beyond 24h from the time of ROSC had a good outcome. Prevalence of epileptiform activity and burst suppression or suppression varied among centers (Figure S1). The burden of artifactual data varied across time, going from 9.4% within 24h to 6.3% at 24–48h, and 4.7% after 48h. A summary of the incidence of EEG epileptiform activity and the BCI is shown in Table 2.
Figure 3: Longitudinal evolution of quantitative EEG categories for individual patients.
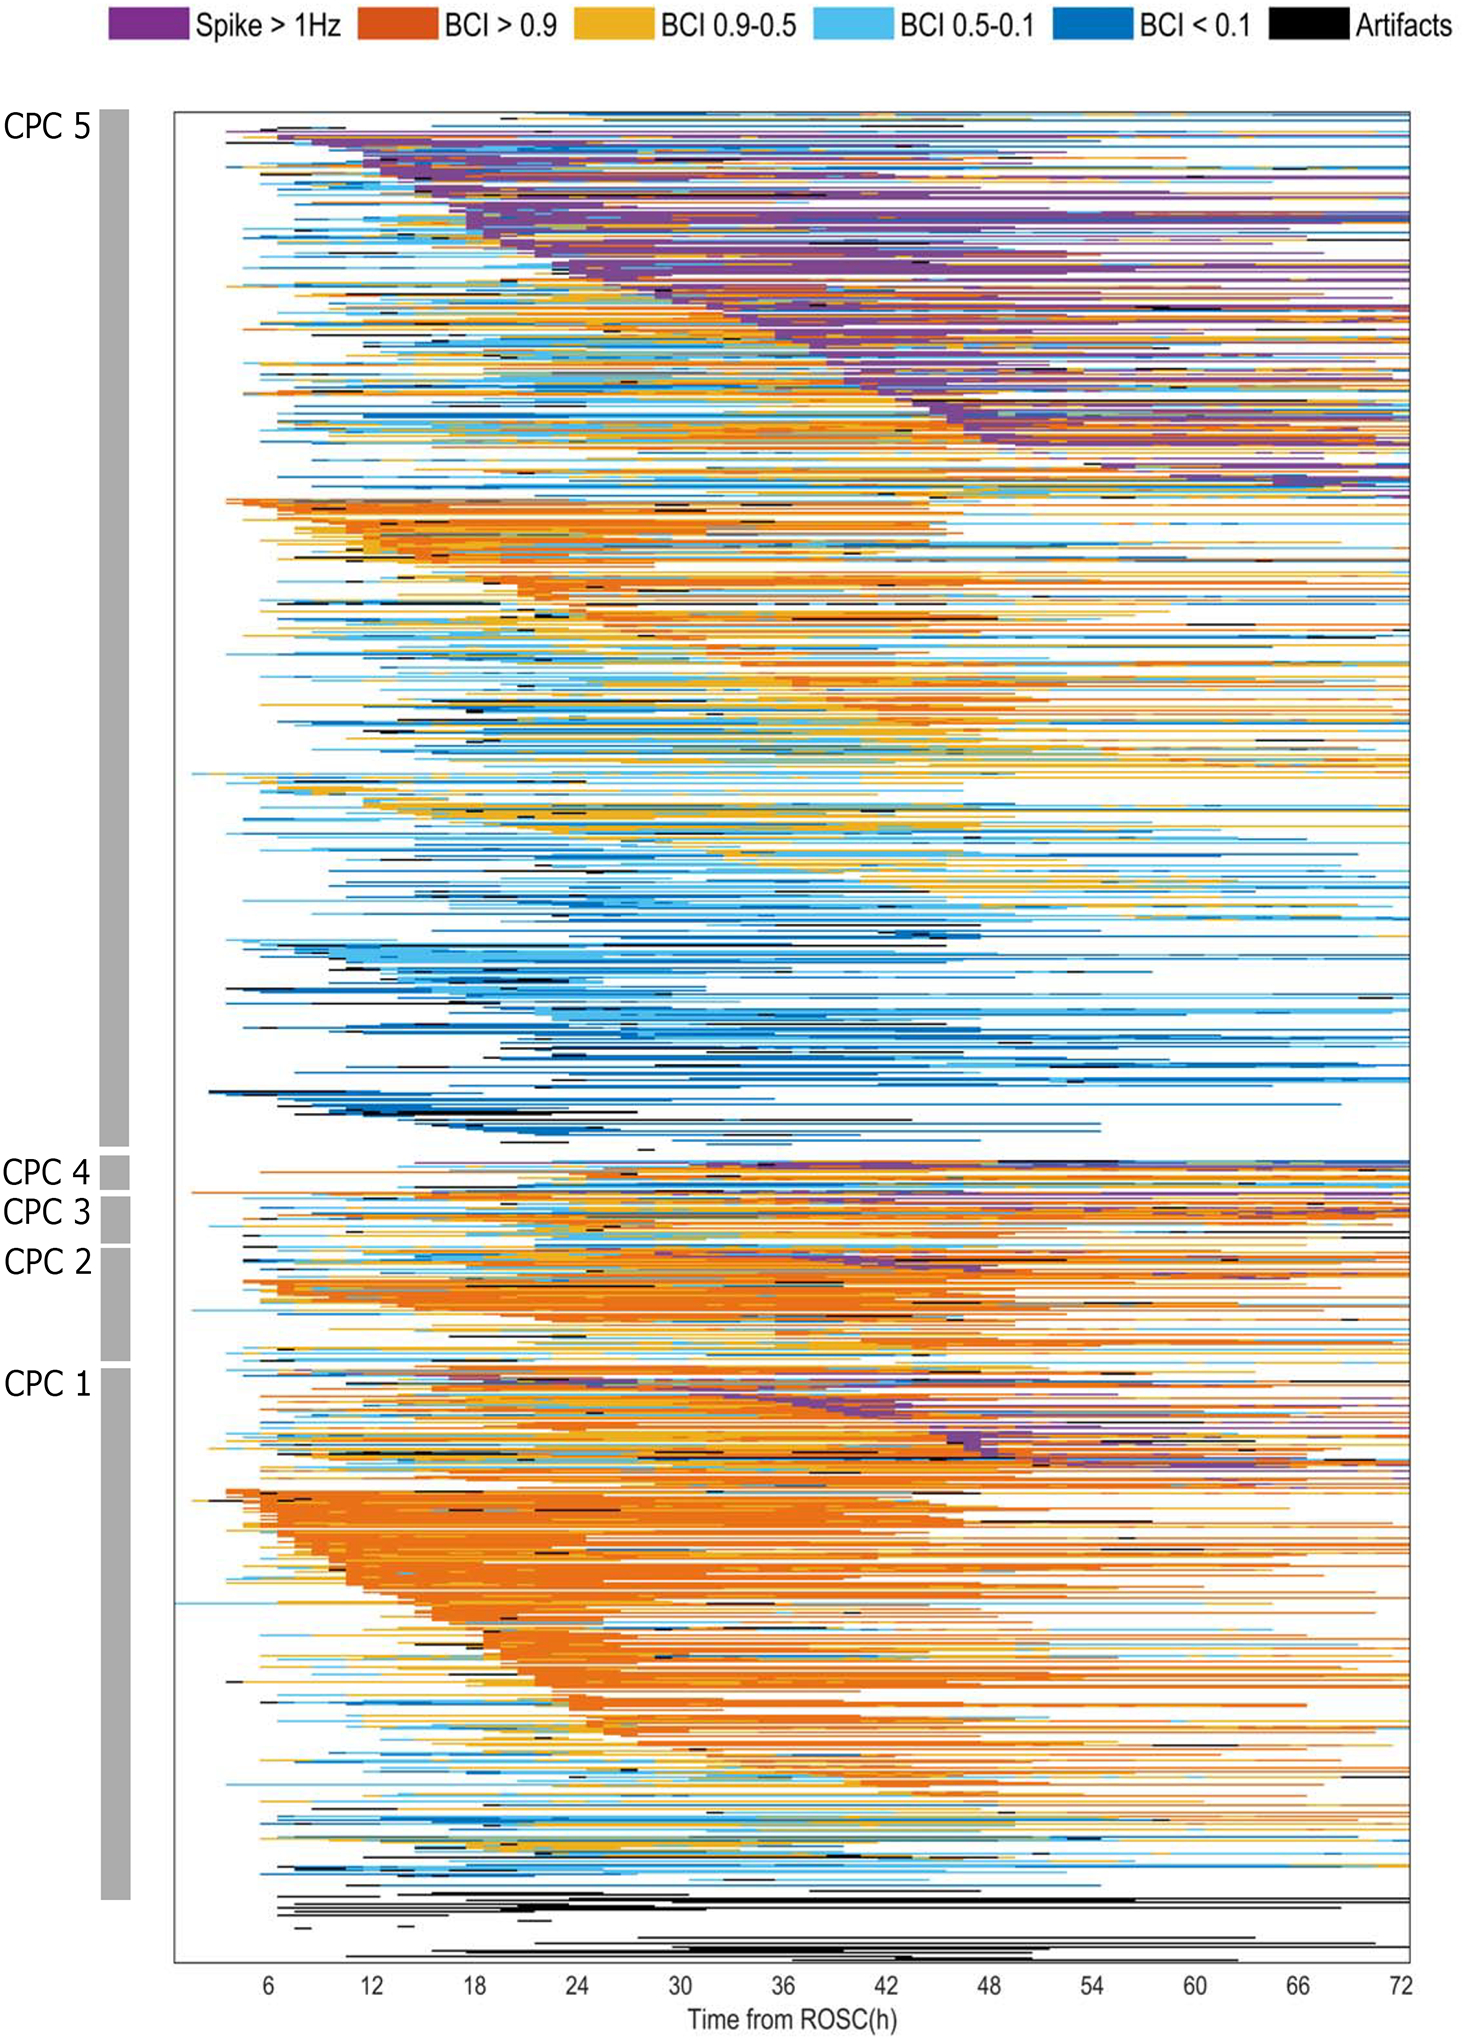
Each individual row represents a single patient and their EEG evolution based on presence of epileptiform activity >1 Hz and the brain continuity index (BCI). First, patients are ranked based on CPC scores (highest to lowest). For each CPC score, patients are then ranked based on EEG categories. Patients who had epileptiform activity are ranked first (“spikes”; purple) and patients without epileptiform activity are ranked next. Within each EEG group category, patients are ranked based on the time of start of the EEG category from the time of ROSC. Patients without epileptiform activity are ranked based on the BCI category. Patients with continuous backgrounds (90% BCI or more; orange) are ranked first, followed by patients with discontinuous (50–90%), burst suppression (10–50%), or suppressed background (<10%). Patients who predominantly had artifactual EEG data are listed last.
CPC: Cerebral Performance Category. BCI: brain continuity index
Table 2.
Number of Patients Per Category Stratified by Neurological Outcome
| CPC 1 | CPC 2 | CPC 3 | CPC 4 | CPC5 | |
|---|---|---|---|---|---|
| Epileptiform activity >1 Hz | 52 | 17 | 13 | 5 | 171 |
| BCI > 90 % | 212 | 51 | 23 | 9 | 205 |
| BCI 90–50 % | 179 | 47 | 25 | 12 | 307 |
| BCI 50–10 % | 111 | 39 | 21 | 9 | 348 |
| BCI < 10 % | 44 | 13 | 8 | 8 | 241 |
CPC: Cerebral Performance Category
BCI: Background continuity index
Discussion
The I-CARE consortium database is a large collection of real-world clinical and continuous EEG data from critically ill patients with coma after cardiac arrest, from seven institutions in the U.S. and Europe. This database provides a rich ground for advancing critical care neurophysiology research in several ways. First, this disease-specific dataset has a wide range of abnormal EEG patterns in the ictal-interictal continuum and seizures, as well as background changes ranging from suppressed, to burst suppression, and continuous activity. These are of great interest for decision-making about seizure and sedation treatment as well as prognostication based on international specialty guidelines. The size of this dataset allows for more precise estimation of the incidence of epileptiform activity as well as uncertainty in prognostic performance of specific patterns. The EEG patterns post-cardiac arrest are dynamic, evolving in different trajectories based on the time of ROSC (13–15, 19). This database enables testing of models evaluating emergence of seizures and other epileptiform and non-epileptiform patterns or neurological function recovery that leverage these complex time-series dynamics. Finally, the diversity of hospital settings in which these data were generated provides an opportunity to test algorithm performance across institutions and geographical regions. Advances in algorithm development using traditional signal processing as well as artificial intelligence methods rely on the availability of large and diverse datasets that have been harmonized and organized for research (24). The I-CARE consortium’s effort to support open data may accelerate research in cardiac arrest and clinical neurophysiology as well as other types of acute brain injury.
The illustrative results of epileptiform activity and continuity evolution described here reinforce the temporal dynamics and diversity in EEG patterns seen post-cardiac arrest (15). It also emphasizes the high incidence of epileptiform activity as well as the time-dependence of burst suppression and discontinuity across outcomes (25). These data emphasize previous literature showing that early EEG changes are associated with neurological recovery potential and that improvement in EEG background can be seen in patients with good and poor outcomes, but that the timing of this EEG recovery is prognostic (8, 21). Importantly, caution on interpretation of automated analysis of EEG and use of machine learning and deep learning approaches on continuous EEG data generated in the intensive care units is needed given the high burden of artifactual data seen in these recordings (26). Continuous multi-channel EEG monitoring is prone to artifact and signal quality deterioration given the prolonged duration of recording and context of care in an intensive care unit, therefore this database provides a wealth of different artifact types, which can be used for pursuits focused on artifact detection and rejection as well as development of techniques to enable analyses that are robust to artifact.
This database has limitations. Patient care of comatose cardiac arrest patients is complex, and several types of information regarding the clinical context of EEG recording are not available. Temperature modulation and sedative and vasopressor use may influence EEG signals (27, 28). Indication, duration, and depth of temperature control in the participating institutions at the time these data were generated may not translate to current practice (29). Coexisting comorbidities may contribute to encephalopathy and fluctuating changes on EEG data (30). Variability in clinical practice is common in the care of patients with cardiac arrest, which can be present at the provider and institution level (31). Timing of initiation and termination of EEG are highly variable and data availability may be confounded by clinical practice and patient-specific factors that are unmeasured. Specifically, bias related to premature predictions of likelihood of neurological recovery and withdrawal of life-sustaining therapies may lead to shortening of EEG recordings as well as affect treatment intensity, which may affect EEG signals (e.g., seizure treatment or presence of burst suppression) (10, 31). Individual level assignment of neurological prognosis and results of other multimodal prognostic testing is not available, therefore determination of the likelihood of bias related to self-fulfilling prophecies from withdrawal of life-sustaining therapies is not possible, particularly because clinicians caring for these patients were not blinded to EEG test results. The EEG recordings included in this study were obtained during routine clinical care and converted using standard clinical software at individual sites without a centralized method, therefore gaps in data due to patient disconnection for transport for procedures and testing, as well as data quality issues related to data conversion, may be present. While this large dataset has a diverse collection of EEG patterns that has supported previous studies demonstrating that outcome prediction with high specificity can be achieved for a large proportion of patients, there remains opportunity for model performance improvement for a significant fraction of patients. This is particularly relevant for less prevalent subtypes of EEG patterns in patients who recover from coma. The variability in EEG duration and potential bias associated with file duration and withdrawal of life-sustaining therapies may limit deployment of prediction models for time-series using this database. Prospective determination of neurological outcome and use of other patient-centered outcome metrics such as quality of life and cognitive measures was not possible for all participating centers, limiting its application for more nuanced assessment of neurological recovery in this patient population. Less than 2% of patients required chart review for long-term outcome determination as most patients had recovered or died by the time of discharge. Informed consent for data sharing was waived, but risk for patient reidentification is low based on the standardized deidentification procedures pursued that included date shifting, grouping of ages above 89, and removal of additional patient identifiers from file headers.
Conclusion
The I-CARE database provides a large and diverse collection of clinical data and continuous EEG recordings that may enable advancements in cardiac arrest clinical research and algorithm development using EEG more broadly. The scale of this dataset allows for corroboration and reevaluation of current guideline recommendations using EEG information, highlighting uncommon clinical scenarios that have less typical trajectories (e.g., burst suppression and epileptiform activity in patients who have good neurological recovery). This database curation effort may support the development of new standards and best practices to enable multimodal signals data sharing and open access for EEG data that is geared for deployment of traditional signal processing and artificial intelligence methods in the intensive care unit environment.
Supplementary Material
Key Points.
Question:
I-CARE is a real-world database including more than 50,000 hours of multi-channel EEG and ECG data for 1,020 patients with coma after cardiac arrest, covering a wide range of neurophysiology states that include seizures, ictal-interictal continuum, and other background abnormalities. This database will facilitate clinical neurophysiology research broadly, including analyses focused on seizures and interictal continuum detection or neurologic prognosis prediction post-cardiac arrest.
Study Funding:
This study was supported by the Weil-Society of Critical Care Medicine Research Grant, American Heart Association (20CDA35310297), CURE Epilepsy Foundation (Taking Flight Award), Neurocritical Care Society (NCS research training fellowship), MIT-Philips Alliance Clinician Award, the Andrew David Heitman Neuroendovascular Research Fund, the Rappaport Foundation, the NIH (1K23NS090900, 1R01NS102190, 1R01NS102574, 1R01NS107291, R01EB030362, 1K23NS119794, T32HL007901, T90DA22759, T32EB001680), Epilepsiefonds (NEF 14-18), and Dutch Heart Foundation (2018T070).
Potential Conflicts of Interest
E.A., W.L.Z., M.M.G., M.A., P.K., V.K., J.W.L., L.J.H., S.T.H., A.S., N.G., R.S., M.A.R., G.D.C., and J.H. report no disclosures.
M.V.P is the founder of Clinical Science Systems. Clinical Science Systems did not contribute funding nor played any role in the study. M.B.W. is a co-founder of Beacon Biosignals. Beacon Biosignals did not contribute funding nor played any role in the study.
REFERENCES
- 1.Medicine I of: Strategies to Improve Cardiac Arrest Survival: A Time to Act [Internet]. Washington, DC: The National Academies Press; 2015. [cited 2021 Dec 5] Available from: https://www.nap.edu/catalog/21723/strategies-to-improve-cardiac-arrest-survival-a-time-to-act [PubMed] [Google Scholar]
- 2.Mehra R: Global public health problem of sudden cardiac death. J Electrocardiol 2007; 40:S118–122 [DOI] [PubMed] [Google Scholar]
- 3.Rundgren M, Westhall E, Cronberg T, et al. : Continuous amplitude-integrated electroencephalogram predicts outcome in hypothermia-treated cardiac arrest patients. Crit Care Med 2010; 38:1838–1844 [DOI] [PubMed] [Google Scholar]
- 4.Khazanova D, Douglas VC, Amorim E: A matter of timing: EEG monitoring for neurological prognostication after cardiac arrest in the era of targeted temperature management. Minerva Anestesiol 2021; 87:704–713 [DOI] [PubMed] [Google Scholar]
- 5.Elmer J, Torres C, Aufderheide TP, et al. : Association of early withdrawal of life-sustaining therapy for perceived neurological prognosis with mortality after cardiac arrest. Resuscitation 2016; 102:127–135 [DOI] [PMC free article] [PubMed] [Google Scholar]
- 6.Amorim E, Ghassemi MM, Lee JW, et al. : Estimating the false positive rate of absent somatosensory evoked potentials in cardiac arrest prognostication. Crit Care Med 2018; 46:e1213–e1221 [DOI] [PMC free article] [PubMed] [Google Scholar]
- 7.Sandroni C, Cariou A, Cavallaro F, et al. : Prognostication in comatose survivors of cardiac arrest: An advisory statement from the European Resuscitation Council and the European Society of Intensive Care Medicine. Intensive Care Med 2014; 40:1816–1831 [DOI] [PMC free article] [PubMed] [Google Scholar]
- 8.Ruijter BJ, van Putten MJAM, Hofmeijer J: Generalized epileptiform discharges in postanoxic encephalopathy: Quantitative characterization in relation to outcome. Epilepsia 2015; 56:1845–1854 [DOI] [PubMed] [Google Scholar]
- 9.Nakstad ER, Stær-Jensen H, Wimmer H, et al. : Late awakening, prognostic factors and long-term outcome in out-of-hospital cardiac arrest - results of the prospective Norwegian Cardio-Respiratory Arrest Study (NORCAST). Resuscitation 2020; 149:170–179 [DOI] [PubMed] [Google Scholar]
- 10.Ruijter BJ, Keijzer HM, Tjepkema-Cloostermans MC, et al. : Treating Rhythmic and Periodic EEG Patterns in Comatose Survivors of Cardiac Arrest. New England Journal of Medicine 2022; 386:724–734 [DOI] [PubMed] [Google Scholar]
- 11.Amorim E, Rittenberger JC, Zheng JJ, et al. : Continuous EEG monitoring enhances multimodal outcome prediction in hypoxic-ischemic brain injury. Resuscitation 2016; 109:121–126 [DOI] [PMC free article] [PubMed] [Google Scholar]
- 12.Hofmeijer J, Beernink TMJ, Bosch FH, et al. : Early EEG contributes to multimodal outcome prediction of postanoxic coma. Neurology 2015; 85:137–143 [DOI] [PMC free article] [PubMed] [Google Scholar]
- 13.Zheng W-L, Amorim E, Jing J, et al. : Predicting neurological outcome in comatose patients after cardiac arrest with multiscale deep neural networks. Resuscitation 2021; 169:86–94 [DOI] [PMC free article] [PubMed] [Google Scholar]
- 14.Zheng W-L, Amorim E, Jing J, et al. : Predicting Neurological Outcome from Electroencephalogram Dynamics in Comatose Patients after Cardiac Arrest with Deep Learning. IEEE Transactions on Biomedical Engineering 2021; 1–1 [DOI] [PMC free article] [PubMed] [Google Scholar]
- 15.Ruijter BJ, Tjepkema‐Cloostermans MC, Tromp SC, et al. : Early electroencephalography for outcome prediction of postanoxic coma: A prospective cohort study. Ann Neurol 2019; 86:203–214 [DOI] [PMC free article] [PubMed] [Google Scholar]
- 16.Jing J, Sun H, Kim JA, et al. : Development of Expert-Level Automated Detection of Epileptiform Discharges During Electroencephalogram Interpretation. JAMA Neurol 2020; 77:103–108 [DOI] [PMC free article] [PubMed] [Google Scholar]
- 17.Amorim E, van der Stoel M, Nagaraj SB, et al. : Quantitative EEG reactivity and machine learning for prognostication in hypoxic-ischemic brain injury. Clin Neurophysiol 2019; 130:1908–1916 [DOI] [PMC free article] [PubMed] [Google Scholar]
- 18.Tjepkema-Cloostermans MC, da Silva Lourenço C, Ruijter BJ, et al. : Outcome Prediction in Postanoxic Coma With Deep Learning. Crit Care Med 2019; 47:1424–1432 [DOI] [PubMed] [Google Scholar]
- 19.Ghassemi MM, Amorim E, Alhanai T, et al. : Quantitative Electroencephalogram Trends Predict Recovery in Hypoxic-Ischemic Encephalopathy. Crit Care Med 2019; 47:1416–1423 [DOI] [PMC free article] [PubMed] [Google Scholar]
- 20.Taccone FS, Horn J, Storm C, et al. : Death after awakening from post-anoxic coma: the “Best CPC” project. Crit Care 2019; 23:107. [DOI] [PMC free article] [PubMed] [Google Scholar]
- 21.Ruijter BJ, Hofmeijer J, Tjepkema-Cloostermans MC, et al. : The prognostic value of discontinuous EEG patterns in postanoxic coma. Clinical Neurophysiology 2018; 129:1534–1543 [DOI] [PubMed] [Google Scholar]
- 22.Goldberger AL, Amaral LA, Glass L, et al. : PhysioBank, PhysioToolkit, and PhysioNet: components of a new research resource for complex physiologic signals. Circulation 2000; 101:E215–220 [DOI] [PubMed] [Google Scholar]
- 23.Reyna MA, Amorim E, Sameni S, Weigle J, Elola A, Bahrami Rad A, Seyedi S, Kwon H, Zheng WL and Ghassemi M, van Putten MJAM, Hofmeijer J, Gaspard N, Sivaraju A, Herman S, Lee JW, Westover MB, Clifford GD.: Predicting Neurological Recovery from Coma After Cardiac Arrest: The George B. Moody PhysioNet Challenge 2023. Atlanta, USA: 2023. p. 1:4. [Google Scholar]
- 24.Pastorino R, De Vito C, Migliara G, et al. : Benefits and challenges of Big Data in healthcare: an overview of the European initiatives. Eur J Public Health 2019; 29:23–27 [DOI] [PMC free article] [PubMed] [Google Scholar]
- 25.Elmer J, Coppler PJ, Solanki P, et al. : Sensitivity of Continuous Electroencephalography to Detect Ictal Activity After Cardiac Arrest. JAMA Netw Open 2020; 3:e203751. [DOI] [PMC free article] [PubMed] [Google Scholar]
- 26.Jiang X, Bian G-B, Tian Z: Removal of Artifacts from EEG Signals: A Review. Sensors (Basel) 2019; 19:987. [DOI] [PMC free article] [PubMed] [Google Scholar]
- 27.Nolan JP, Sandroni C, Böttiger BW, et al. : European Resuscitation Council and European Society of Intensive Care Medicine guidelines 2021: post-resuscitation care. Intensive Care Med 2021; 47:369–421 [DOI] [PMC free article] [PubMed] [Google Scholar]
- 28.Panchal AR, Bartos JA, Cabañas JG, et al. : Part 3: Adult Basic and Advanced Life Support: 2020 American Heart Association Guidelines for Cardiopulmonary Resuscitation and Emergency Cardiovascular Care. Circulation 2020; 142:S366–S468 [DOI] [PubMed] [Google Scholar]
- 29.Dankiewicz J, Cronberg T, Lilja G, et al. : Hypothermia versus Normothermia after Out-of-Hospital Cardiac Arrest. N Engl J Med 2021; 384:2283–2294 [DOI] [PubMed] [Google Scholar]
- 30.Faigle R, Sutter R, Kaplan PW: The electroencephalography of encephalopathy in patients with endocrine and metabolic disorders. J Clin Neurophysiol 2013; 30: 10.1097/WNP.0b013e3182a73db9 [DOI] [PMC free article] [PubMed] [Google Scholar]
- 31.May TL, Lary CW, Riker RR, et al. : Variability in functional outcome and treatment practices by treatment center after out-of-hospital cardiac arrest: analysis of International Cardiac Arrest Registry. Intensive Care Med 2019; 45:637–646 [DOI] [PMC free article] [PubMed] [Google Scholar]
Associated Data
This section collects any data citations, data availability statements, or supplementary materials included in this article.