

Abstract
Recent publications report that although the mitochondria population in an axon can be quickly replaced by a combination of retrograde and anterograde axonal transport (often within less than 24 hours), the axon contains much older mitochondria. This suggests that not all mitochondria that reach the soma are degraded and that some are recirculating back into the axon. To explain this, we developed a model that simulates mitochondria distribution when a portion of mitochondria that return to the soma are redirected back to the axon rather than being destroyed in somatic lysosomes. Utilizing the developed model, we studied how the percentage of returning mitochondria affects the mean age and age density distributions of mitochondria at different distances from the soma. We also investigated whether turning off the mitochondrial anchoring switch can reduce the mean age of mitochondria. For this purpose, we studied the effect of reducing the value of a parameter that characterizes the probability of mitochondria transition to the stationary (anchored) state. The reduction in mitochondria mean age observed when the anchoring probability is reduced suggests that some injured neurons may be saved if the percentage of stationary mitochondria is decreased. The replacement of possibly damaged stationary mitochondria with newly synthesized ones may restore the energy supply in an injured axon. We also performed a sensitivity study of the mean age of stationary mitochondria to the parameter that determines what portion of mitochondria re-enter the axon and the parameter that determines the probability of mitochondria transition to the stationary state.
Keywords: neurons, axonal transport, mean age, age density distribution, mathematical modeling
Graphical Abstract
Recent research suggests that not all mitochondria that reach the soma are degraded and some recirculate back into the axon. This study investigates how the recirculation of mitochondria affects their age and density distribution in axons. The authors developed a model to simulate the distribution of mitochondria and found that reducing the probability of mitochondria transitioning to the stationary state could decrease the mean age of stationary mitochondria. This could potentially restore energy supply in injured axons. The study offers insights into how mitochondrial dynamics impact neuronal health and could lead to future therapeutic interventions.
1. Introduction
The primary purpose of mitochondria in the cells is to generate easily accessible chemical energy in the form of ATP. In addition, mitochondria serve various other functions, such as calcium buffering. They are also known for their involvement in apoptosis [1–3], particularly in the context of stroke-induced injury [4].
Since mitochondrial proteins have a limited half-life, these proteins (or the entire mitochondrion) need to be periodically replaced [5]. Old and damaged mitochondria are usually degraded in somatic lysosomes [6,7]. Mitochondria are continuously transported in axons [8]. The representative length of mitochondria is between 0.5 and 10 μm [9]. Hence, mitochondria are too large to exhibit any significant diffusivity. Mitochondria transport is accomplished by molecular motors, kinesin-1 (and possibly kinesin-3) in the anterograde direction and by cytoplasmic dynein in the retrograde direction [10,11]. Mitochondria move with an average velocity of 0.4–0.8 μm/s [12]. To supply energy to energy demand sites in the axon, mitochondria can dock near these demand sites [13–15].
In neurons, most of the degradation of old and damaged mitochondria occurs in the soma. It was previously hypothesized that mitochondria are transported to the soma for final degradation [16–18]. However, ref. [19] reported that after retrogradely transported mitochondria depart from the axon terminal, a portion of them remain in the axon for days. The persistence of mitochondria after leaving the terminal for a prolonged duration may indicate that they will never reach the soma, as they spend much time in the stationary state. Alternatively, this may suggest that retrogradely transported mitochondria undergo recycling in the soma. Based on this evidence, we hypothesize that not all mitochondria that enter the soma from the axon undergoing retrograde movement are degraded in the soma; a portion return to the axon. This hypothesis is supported by unpublished observations reported in ref. [3]. These observations suggest that retrogradely moving mitochondria, which are traditionally expected to be segregated for degradation through mitophagy upon entering the soma, instead merge with the existing mitochondria in the soma. This fusion leads to the exchanging of components between the returning mitochondria and the newly synthesized mitochondria in the soma, producing repaired mitochondria that are ready to return to the axon.
A high level of energy is required for neurons to survive an injury. Since the distance to which ATP can be transported by diffusion is limited, replacing damaged mitochondria with new ones is critical for neuron survival [20]. Axonal regeneration after injury or ischemic stress [21] can be promoted by turning off mitochondria anchoring. This leads to faster replacement of damaged mitochondria with healthy mitochondria [22]. Our model simulates the reduction of mitochondrial anchoring by decreasing a value of the parameter that characterizes the probability of mitochondrial anchoring, .
The return of mitochondria to the axon must be associated with changing the type of molecular motors that move the mitochondria. Since mitochondria are driven toward the soma by dynein motors, to turn around and re-enter the axon they must switch from dynein motors to kinesin motors.
Ref. [23] used mean-field equations to study the delivery of motor-cargo complexes to branched axons. A quantity called mitochondrial health was introduced in ref. [24] and treated as a proxy for mitochondrial membrane potential. Models that treat mitochondrial health as a decaying component were developed in ref. [25].
This paper adopts a different approach by using a compartment-based model. Compartments do not necessarily need to be physical volumes with actual bottlenecks between them. A compartmental model, for example, could be used to simulate a tracer in tissue, which binds to various specific target receptor sites [26,27]. In this paper we need to simulate mitochondria transport between various mitochondrial demand sites. Each demand site is represented by three compartments containing populations of anterograde, stationary, and retrograde mitochondria. We developed this model in our previous publications and utilized it for determining the mean age of mitochondria along the axon length [28] and for computing the mean age and age density distributions of mitochondria in a branching axon [29].
The main question that we ask in this paper is how the mean age and age density distributions of mitochondria in the compartments located at different distances from the soma are affected by some of the mitochondria that exit the axon changing the motors that propel them to kinesin and returning to the circulation. This would explain the presence of older mitochondria in the axon, reported, for example, in ref. [19]. Intuitively, this should increase the mean age of mitochondria in the axon as a result of the described process in which older mitochondria re-enter the axon. Another question we attempt to answer in this paper is whether making mitochondria less likely to stop would contribute to a faster renewal of mitochondria (which in our model will appear as a reduction of the mean age of mitochondria). This would improve chances for neuronal recovery after ischemic stress or injury [22].
2. Materials and models
2.1. Problem setup
Mitochondria usually dock near energy demand sites in the axon [30]. We simulated the axon as consisting of N demand sites (Fig. 1). Mitochondria in the axon can be divided into stationary, anterograde, and retrograde, with transitions possible between these three pools [13]. We therefore represented each demand site as that consisting of three compartments which contain stationary, anterograde, and retrograde mitochondria. The total number of compartments in our multi-compartment model [31–33] is thus 3N, see Fig. 2 (we used N=10). Following ref. [25], we define the demand sites as narrow sections of the axon where stationary mitochondria are localized. The selection of the number of the demand sites should be interpreted as a means of simulating axonal morphology rather than discretization. It is important to acknowledge that in a real axon, the number of the demand sites will be substantially larger than 10. A narrow demand site is assumed to be located at the center of each compartment, and the compartment is assumed to surround it.
Fig. 1.
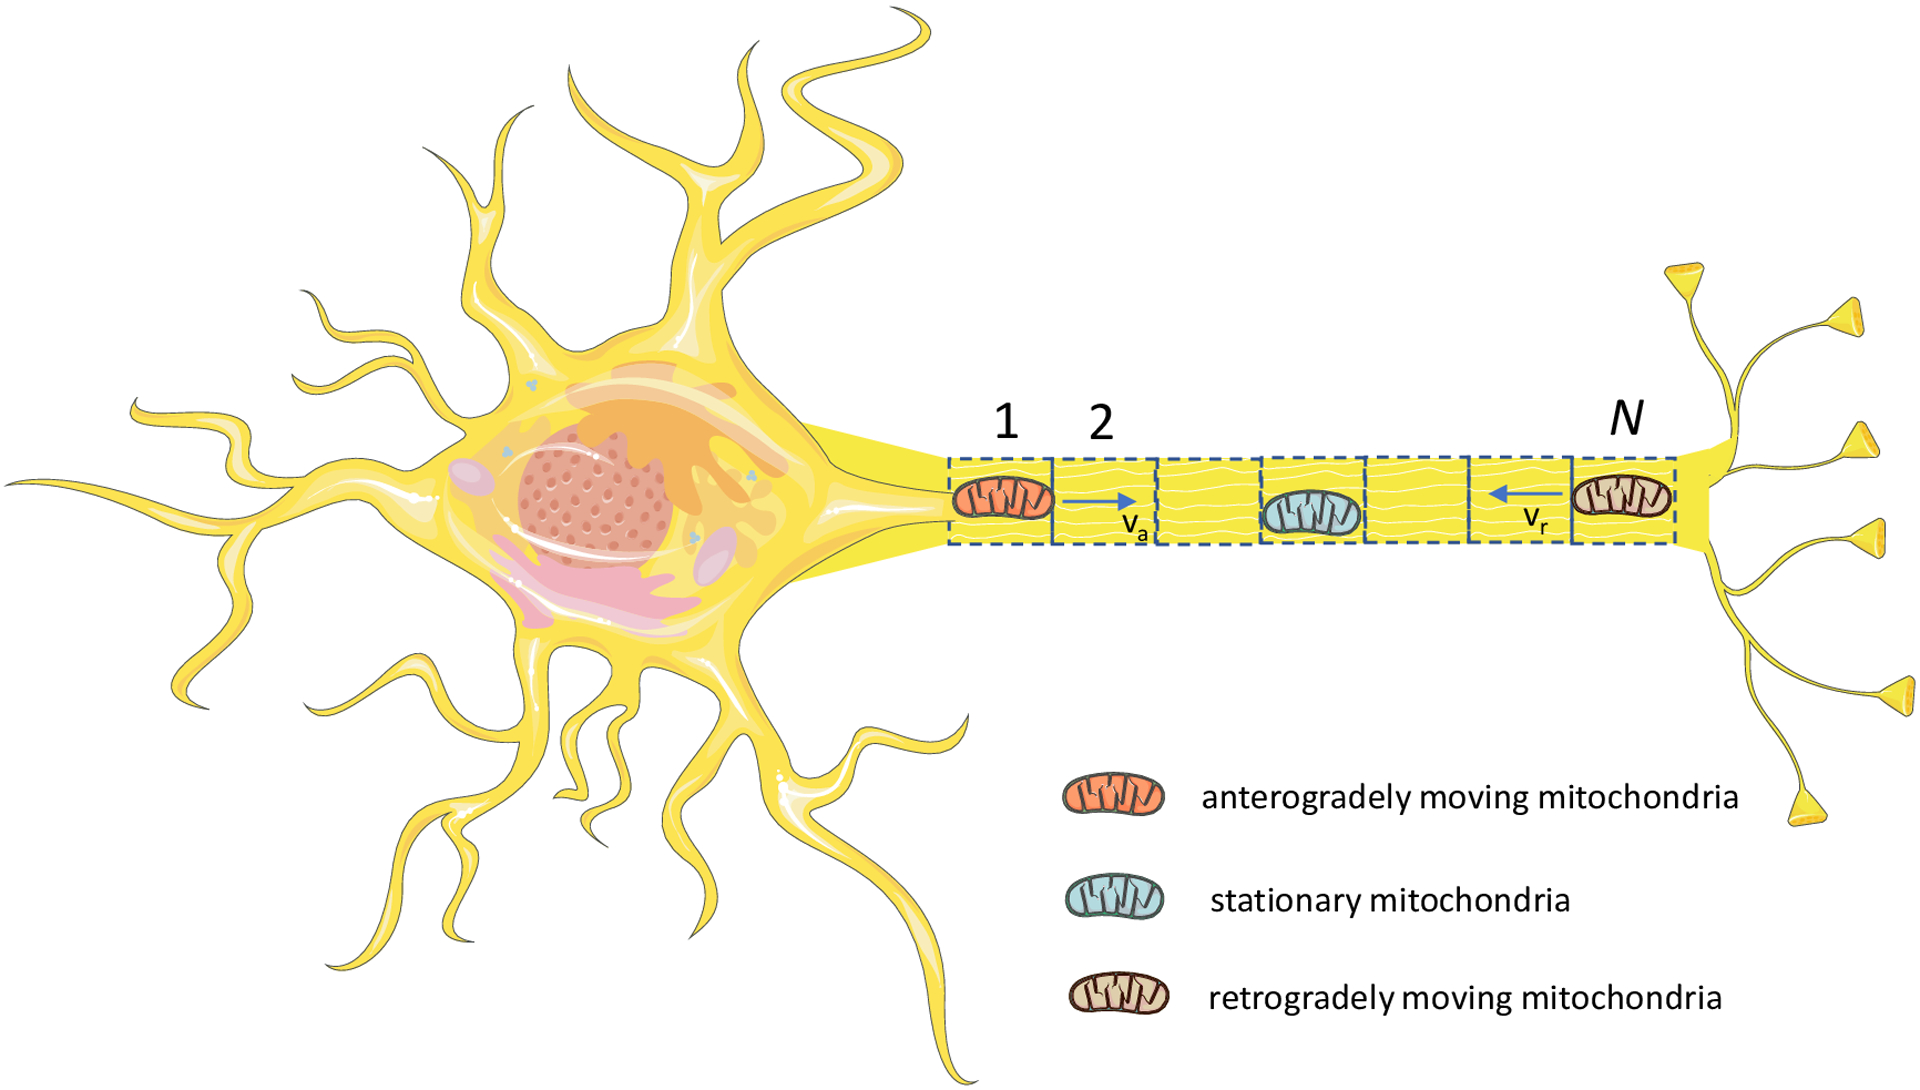
(a) Schematic diagram of a neuron with an axon that is assumed to contain N energy demand sites. Demand sites are numbered starting with the most proximal (site 1) to the most distal (site N). Figure is generated with the aid of Servier Medical Art, licensed under a creative commons attribution 3.0 generic license, http://Smart.servier.com.
Fig. 2.
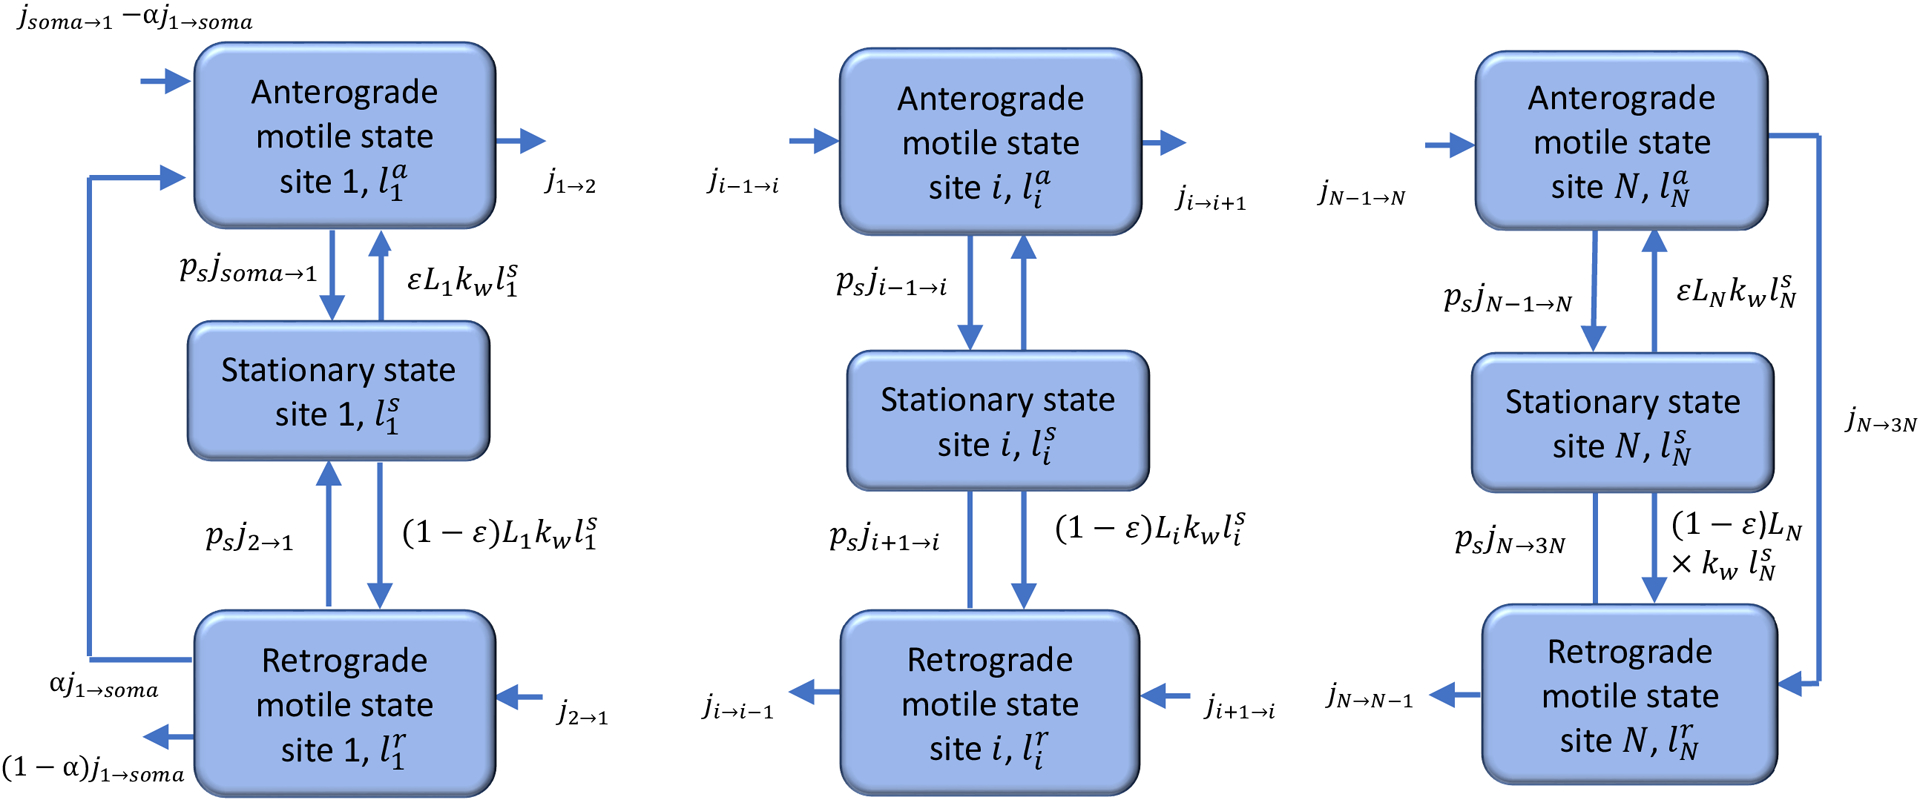
A diagram of a compartmental model showing transport in the compartments surrounding the demand sites in the axon. Arrows show mitochondria exchange between the transiting (anterograde and retrograde) states in adjacent demand sites, mitochondria capture into the stationary state and re-release from the stationary state. A portion of mitochondria re-enter the axon, and the rest return to the soma for degradation. Newly synthesized mitochondria entering the axon from the soma are assumed to have zero age.
The primary motivation for employing a multi-compartment model is our desire to use the methodology for computing the particle age density distribution in the compartments developed in refs. [34,35]. We used a similar approach to simulate transport of dense core vesicles in Drosophila motoneurons [36,37]. The demand sites in the axon terminal were numbered from the most proximal (site 1) to the most distal (site N) (Fig. 1).
To characterize mitochondria concentration in the axon, we used the total length of mitochondria in a particular kinetic state (Fig. 2) per unit axon length, measured in (μm of mitochondria)/μm. The dependent variables utilized in the model are given in Table S1.
2.2. Governing equations and the model for the mean age and age density distributions of mitochondria in the demand sites
The total length of mitochondria is a conserved quantity. The equations stating the conservation of the total length of mitochondria in 3N compartments (Fig. 2) are stated using the methodology developed in ref. [31]. In a vector form, these equations are
| (1) |
where t is the time and is the state vector, following the terminology used in ref. [34]. is a column vector; its components are defined as follows:
| (2) |
In Eq. (2)
| (3) |
where li is the total length of mitochondria per unit length of the axon in stationary, anterograde, or retrograde states in the compartment by the ith demand site (Table S1).
Model parameters are summarized in Table S2. In Eq. (2) (i=1,…,N) is the length of an axonal compartment around the ith demand site. Since the axonal length was split into N compartments of equal length, .
The first N components of the state vector represent the total length of mitochondria in stationary states, the next N components (N+1,…,2N) represent the total length of mitochondria in anterograde states, and the last N components (2N+1,…,3N) represent the total length of mitochondria in retrograde states. The definition of vector is given below in Eqs. (45) and (46).
Matrix B(3N,3N) is composed following ref. [31]. It accounts for the internal mitochondria fluxes between the compartments, the external mitochondria flux entering the axon from the soma, and the mitochondria flux leaving the axon, part of which returns to the soma for degradation and part re-enters the axon (Fig. 2). The analysis of mitochondria fluxes to and from the stationary, anterograde, and retrograde compartments surrounding the most proximal demand site gives equations for the following elements of matrix B:
| (4) |
where is the kinetic constant characterizing the rate of mitochondria re-release from the stationary state into the mobile states.
| (5) |
where j denotes the flux of mitochondria length between the compartments and is the probability of mitochondria transitioning from a moving to the stationary state.
| (6) |
where is the total flux of anterograde mitochondria entering the most proximal demand site, which consists of mitochondria newly synthesized in the soma and mitochondria returning from their journey in the axon. Our model assumes that a portion of mitochondrial flux exiting the axon, , returns to the axon while the other portion of the flux, , is degraded in somatic lysosomes.
| (7) |
| (8) |
where is the portion of mitochondria that re-enter the anterograde component and is the portion of mitochondria that re-enter the retrograde component (Fig. 2, Table S2).
| (9) |
| (10) |
| (11) |
| (12) |
| (13) |
By analyzing mitochondria fluxes to and from the compartments surrounding demand site i (i=2,…,N-1), equations for the following elements of matrix B are obtained:
| (14) |
| (15) |
| (16) |
| (17) |
| (18) |
| (19) |
| (20) |
| (21) |
| (22) |
| (23) |
| (24) |
The analysis of mitochondria fluxes to and from the compartments surrounding the most distal demand site gives equations for the following elements of matrix B:
| (25) |
| (26) |
| (27) |
| (28) |
| (29) |
| (30) |
| (31) |
| (32) |
| (33) |
| (34) |
Other elements of matrix B, except for those given by Eqs. (4)–(34), are equal to zero.
Eqs. (4)–(34) were supplemented by the following equations that simulate fluxes of mobile mitochondria between the demand sites. Equations for anterograde fluxes (Fig. 2) are given by the following equations:
| (35) |
| (36) |
| (37) |
| (38) |
| (39) |
Equations for retrograde fluxes (Fig. 2) are given by the following equations:
| (40) |
| (41) |
| (42) |
| (43) |
| (44) |
The N+1th element of column vector u is given by the following equation:
| (45) |
In Eq. (45) is the total flux of anterograde mitochondria entering the most proximal demand site. It consists of mitochondria newly synthesized in the soma and mitochondria that just left the axon and re-enter the axon anterogradely. Eq. (45) means that the flux of newly synthesized mitochondria entering the axon from the soma, , is adjusted in our model depending on the flux of mitochondria that re-entered the axon after leaving it retrogradely, . This is done to keep the total flux of mitochondria entering the axon (newly synthesized plus returning) constant and independent of .
The only flux entering the compartmental system displayed in Fig. 2 is the flux of newly synthesized mitochondria entering the N+1th compartment. Therefore, all other elements of vector u are equal to zero:
| (46) |
The aim of using Eqs. (1)–(46) was to utilize advanced methods developed for compartmental systems [34,35,38,39] to analyze the average age and distribution of age density of mitochondria in demand sites at varying distances from the soma. A different approach to expressing the conservation equations for the overall length of mitochondria in the axon, as presented in ref. [28], is described in section S1 of Supplemental Materials. Equations in section S1 directly state mitochondria conservation in the demand site, rather than combining stationary, anterograde, and retrograde states into a single vector. Consequently, they are easier to interpret physically. However, they are not suitable for calculating the mean age and age density distributions of mitochondria, as those require stating the conservation equations in the vector form given by Eq. (1).
We used the formulas reported in ref. [35] to obtain results for the steady-state situation (when the left-hand side of Eq. (1) is equal to zero). The solution of Eq. (1) for a steady-state situation is given by the following equation:
| (47) |
In Eq. (47), the superscript –1 on a matrix denotes the inverse of the matrix and the subscript ss denotes steady-state.
The mean ages and age density distributions of mitochondria in various demand sites were computed using the method described in refs. [34,35]. The mean ages of mitochondria in various compartments displayed in Fig. 2 at steady-state are found from the following equation:
| (48) |
In Eq. (48),
| (49) |
is the diagonal matrix with the components of the state vector, defined in Eq. (2), on the main diagonal. These components (, , etc.) are calculated at steady-state. The left-hand side of Eq. (48) is a column vector composed of the mean ages of mitochondria in various compartments:
| (50) |
where superscript T denotes the transposed matrix.
The age densities of mitochondria in various compartments are given by the elements of the following vector:
| (51) |
where e is the matrix exponential.
Eqs. (47)–(51) allow finding steady-state solutions directly. We implemented these equations using standard MATLAB operators, such as matrix inverse and matrix exponential.
We defined the following vectors, each of size N, which represent the mean ages of mitochondria in the stationary, anterograde, and retrograde states in the demand sites, respectively:
| (52) |
3. Results
3.1. Total length of mitochondria per unit axon length in the demand sites and mitochondria fluxes between the demand sites
Model parameters were chosen using the computational study of ref. [25], which found parameter values that optimized mitochondrial health. The parameter values used in our research are summarized in Table S2.
For , , the distribution of the total length of mitochondria per unit length of the axon is uniform along the length of the axon (Fig. S1a). The uniform distribution is expected for all parameters, regardless of . This is because the model assumes that no mitochondria are destroyed while in the axon, although portion of all mitochondria are assumed to be destroyed in the soma when they re-enter the soma from the axon. The uniform distribution displayed in Fig. S1a is consistent with ref. [40] which noted that in axons the mitochondrial density is independent of the distance from the soma (Fig. 1C in ref. [40]). A constant mitochondrial density of 5 mitochondria/100 μm was also reported for growing neuronal processes in C. elegans [41].
The return of 30% (, ) of exiting mitochondria back to the axon results in the same uniform distribution of mitochondria along the axon length (Fig. S1a). This is because we assumed that the total flux of mitochondria entering the first demand site is the same for all cases computed in this paper. The flux is independent of what portion of returning mitochondria re-enter the axon (Eq. (45)). If more mitochondria re-enter the axon (which corresponds to a greater value of ), the flux of newly synthesized mitochondria entering the first demand site in our model is reduced to keep the total flux of mitochondria entering the first demand site (newly synthesized plus returning, Fig. 2) the same.
The reduction of parameter , which characterizes the rate of mitochondria transition to the stationary state (Fig. 2), to 0.1, resulted in a reduction of the total length of mitochondria per unit length in the stationary state by approximately a factor of 4, which is due to fewer mitochondria transitioning to the stationary state (Fig. S1b). The increase of the value of to 0.3 did not change the distributions of the total length of mitochondria per unit axonal length (Fig. S1b). This is because, according to our assumptions, the change of does not affect the flux of mitochondria entering the most proximal demand site.
Anterograde and retrograde fluxes between the compartments are also independent of the values of and , and are uniform along the axon length (Fig. S2a,b).
3.2. Mean age and age density distributions of mitochondria
In Fig. 3, we use line graphs to depict the mean age of mitochondria versus the demand site number, which characterizes the distance from the soma (Fig. 1). It should be noted, however, that per ref. [25], we simulate the demand sites as highly confined segments within the axon where stationary mitochondria are present. For and the mean age of mitochondria increases gradually from the most proximal to the most distal demand site. The mean age of anterograde mitochondria is the smallest, the mean age of stationary mitochondria is in the middle, and the mean age of retrograde mitochondria is the greatest. The mean age of stationary mitochondria in the most distal demand site is approximately 21 hours (Fig. 3a).
Fig. 3.
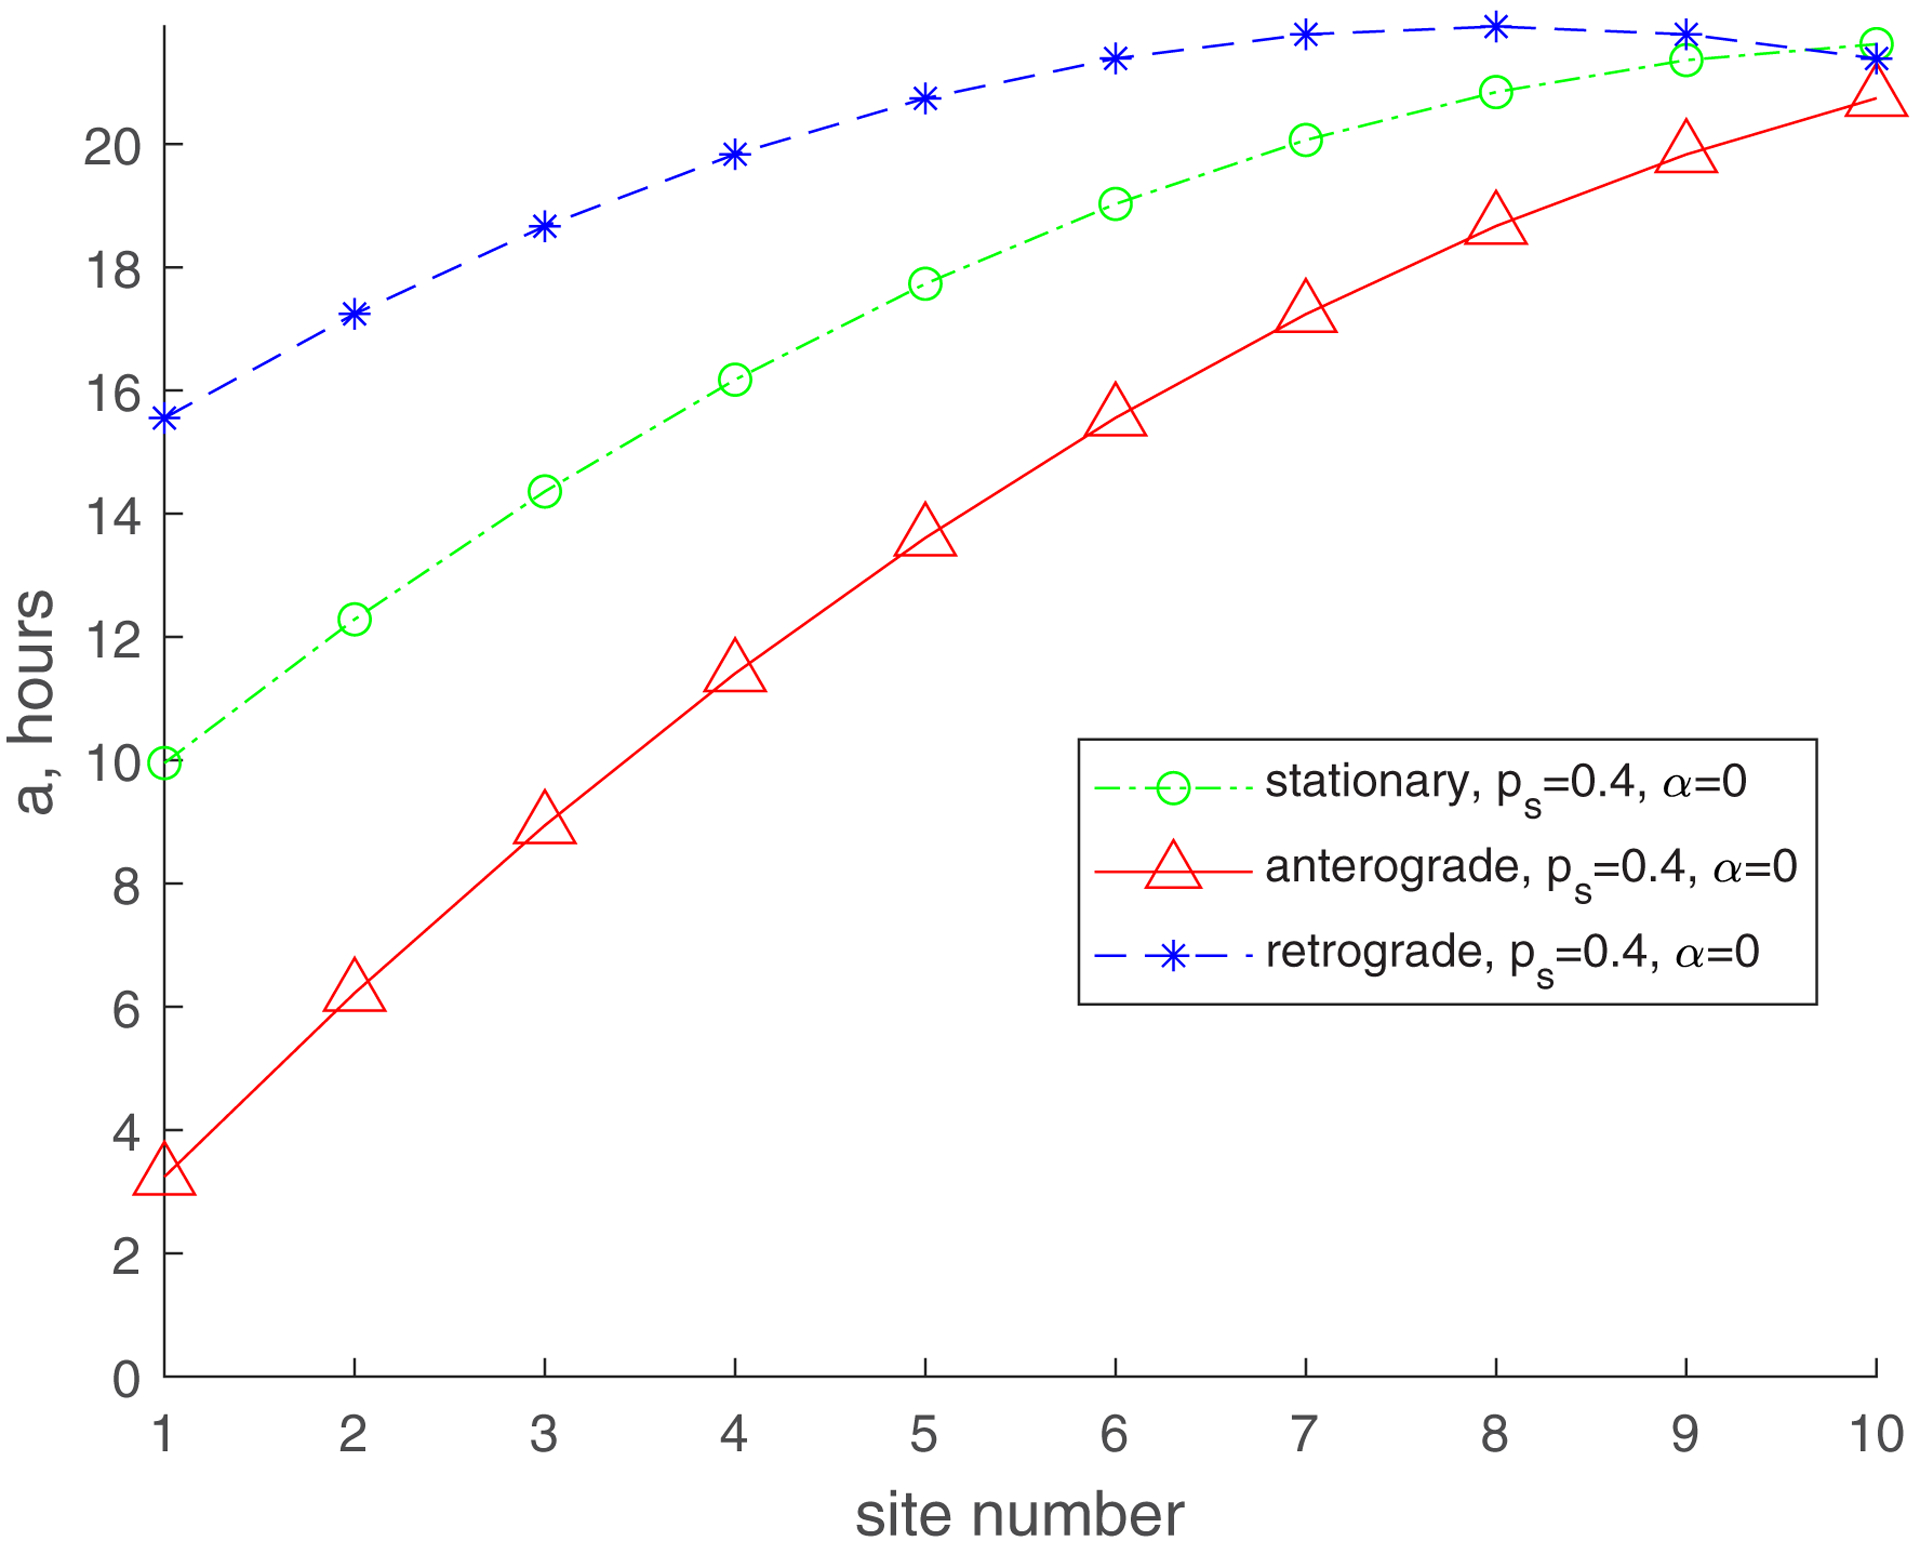
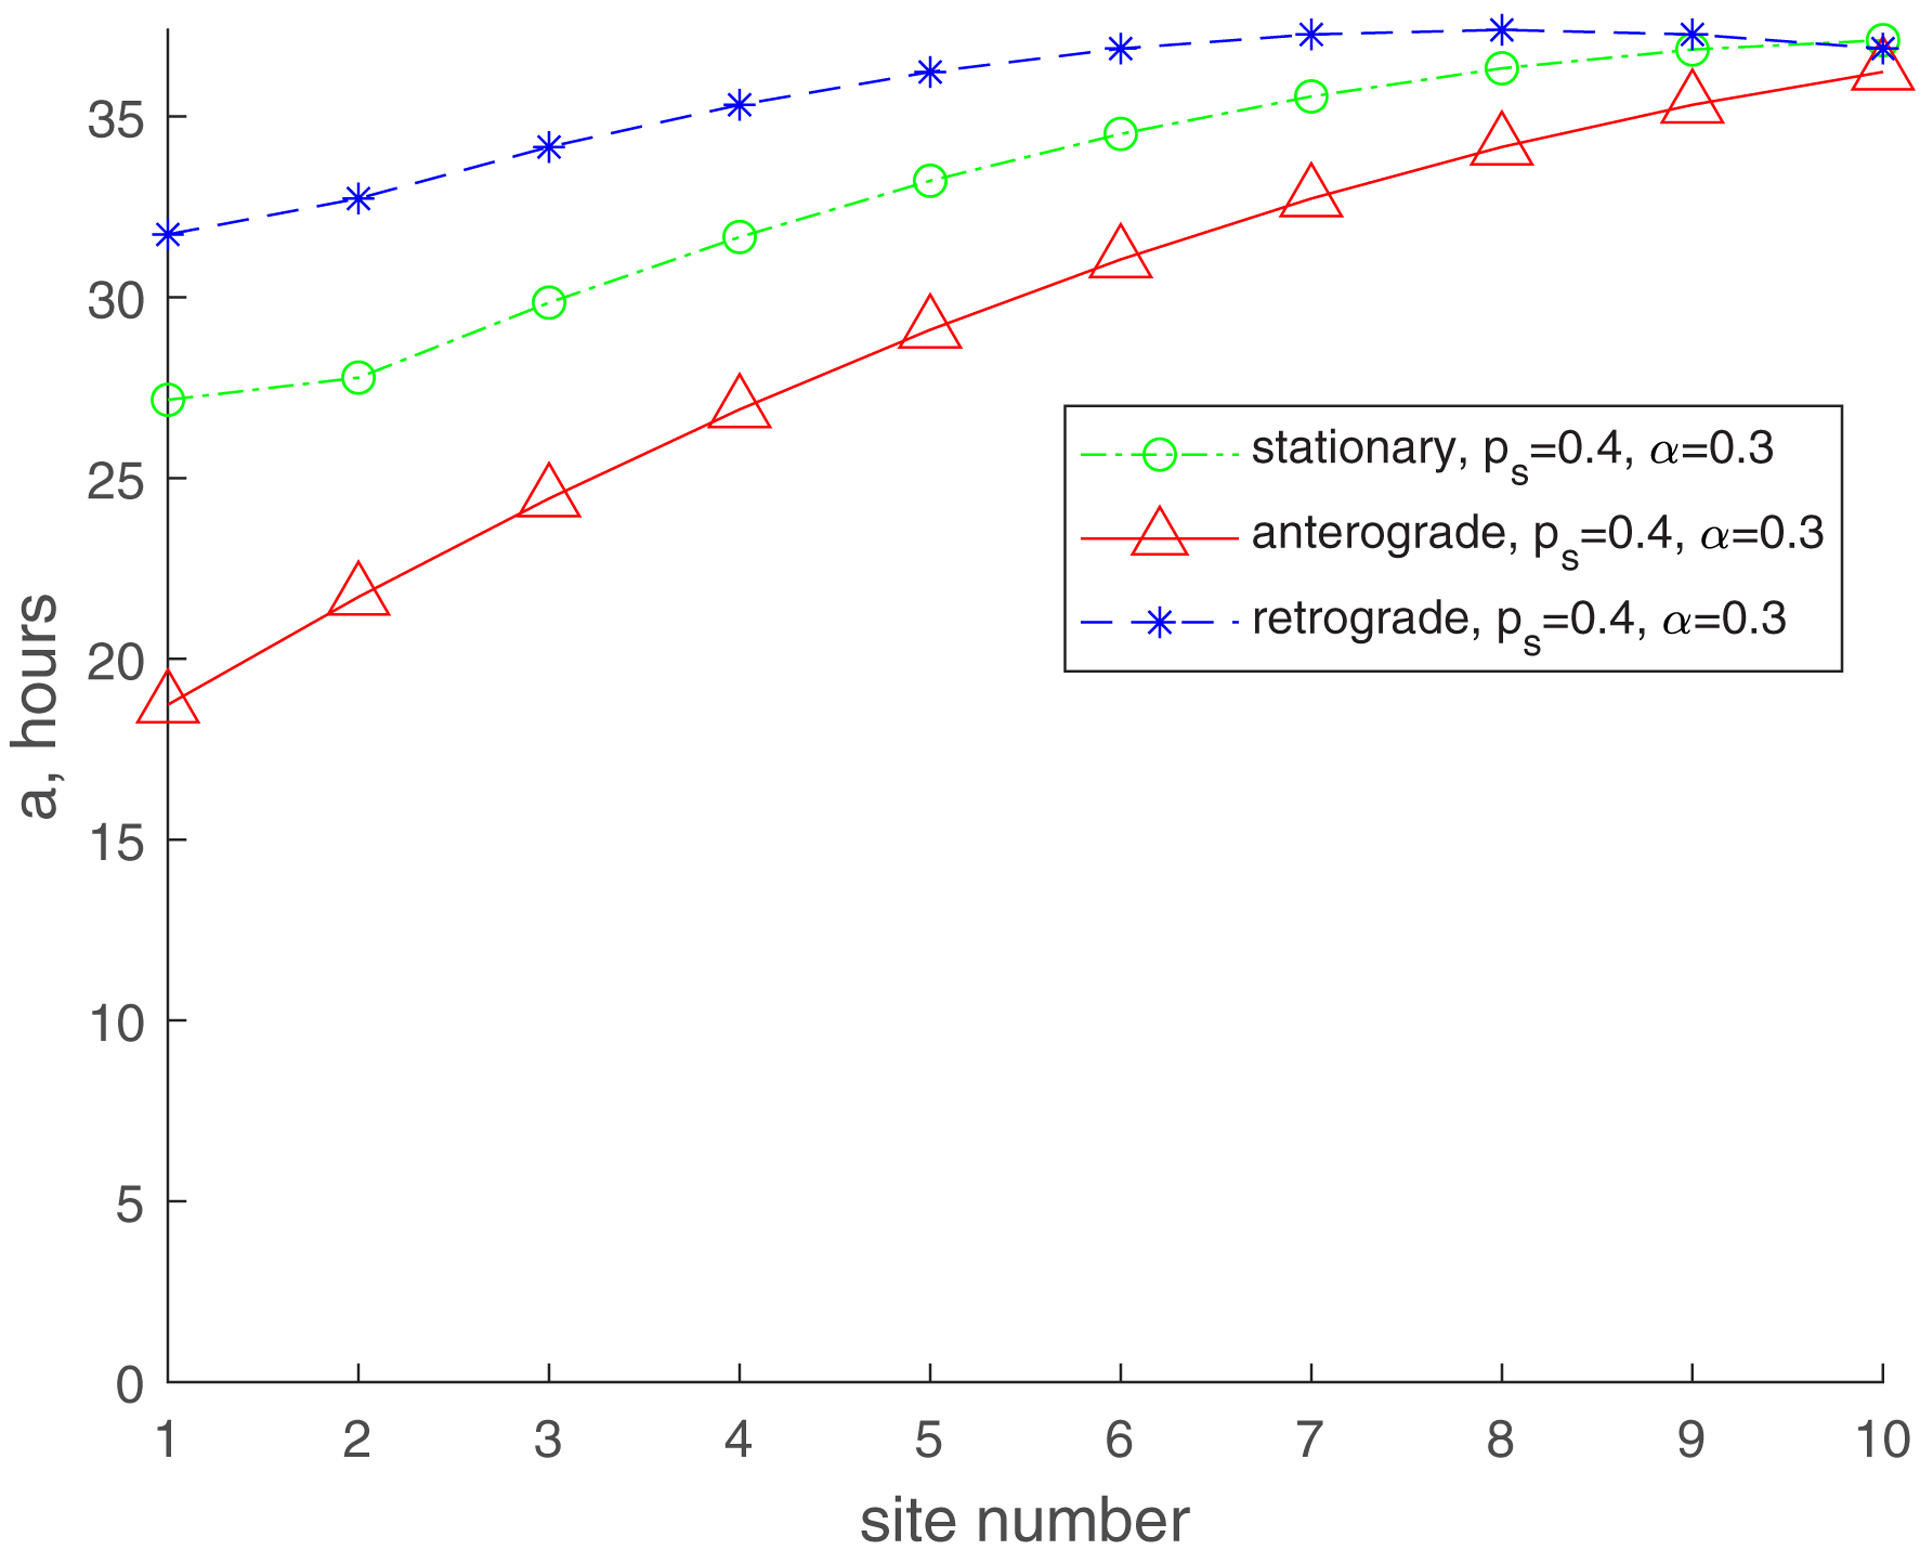
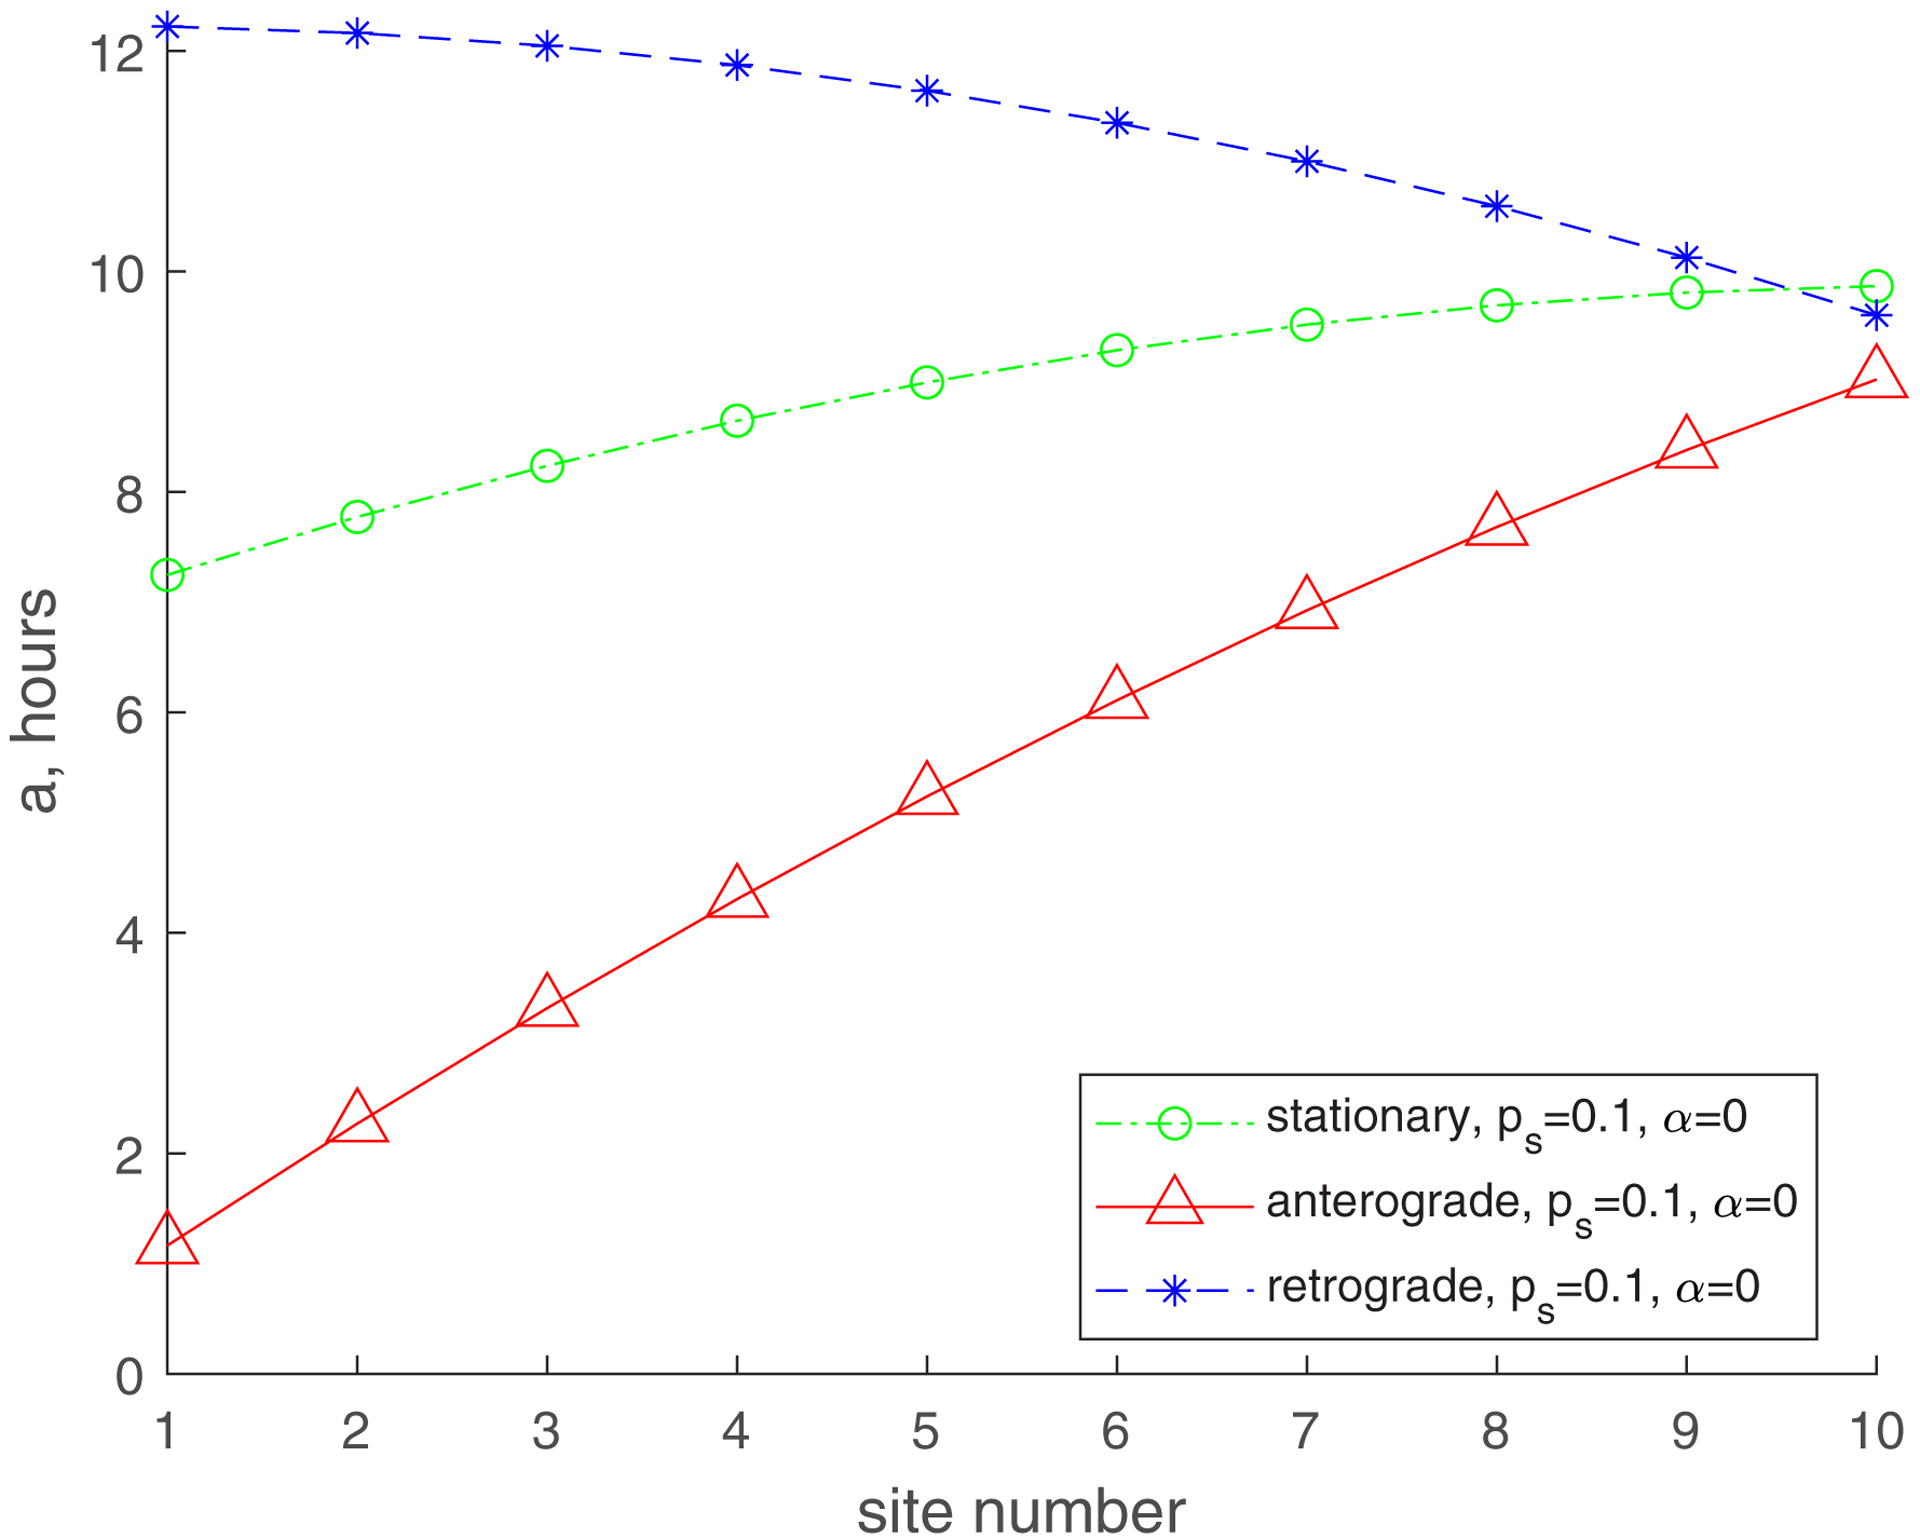
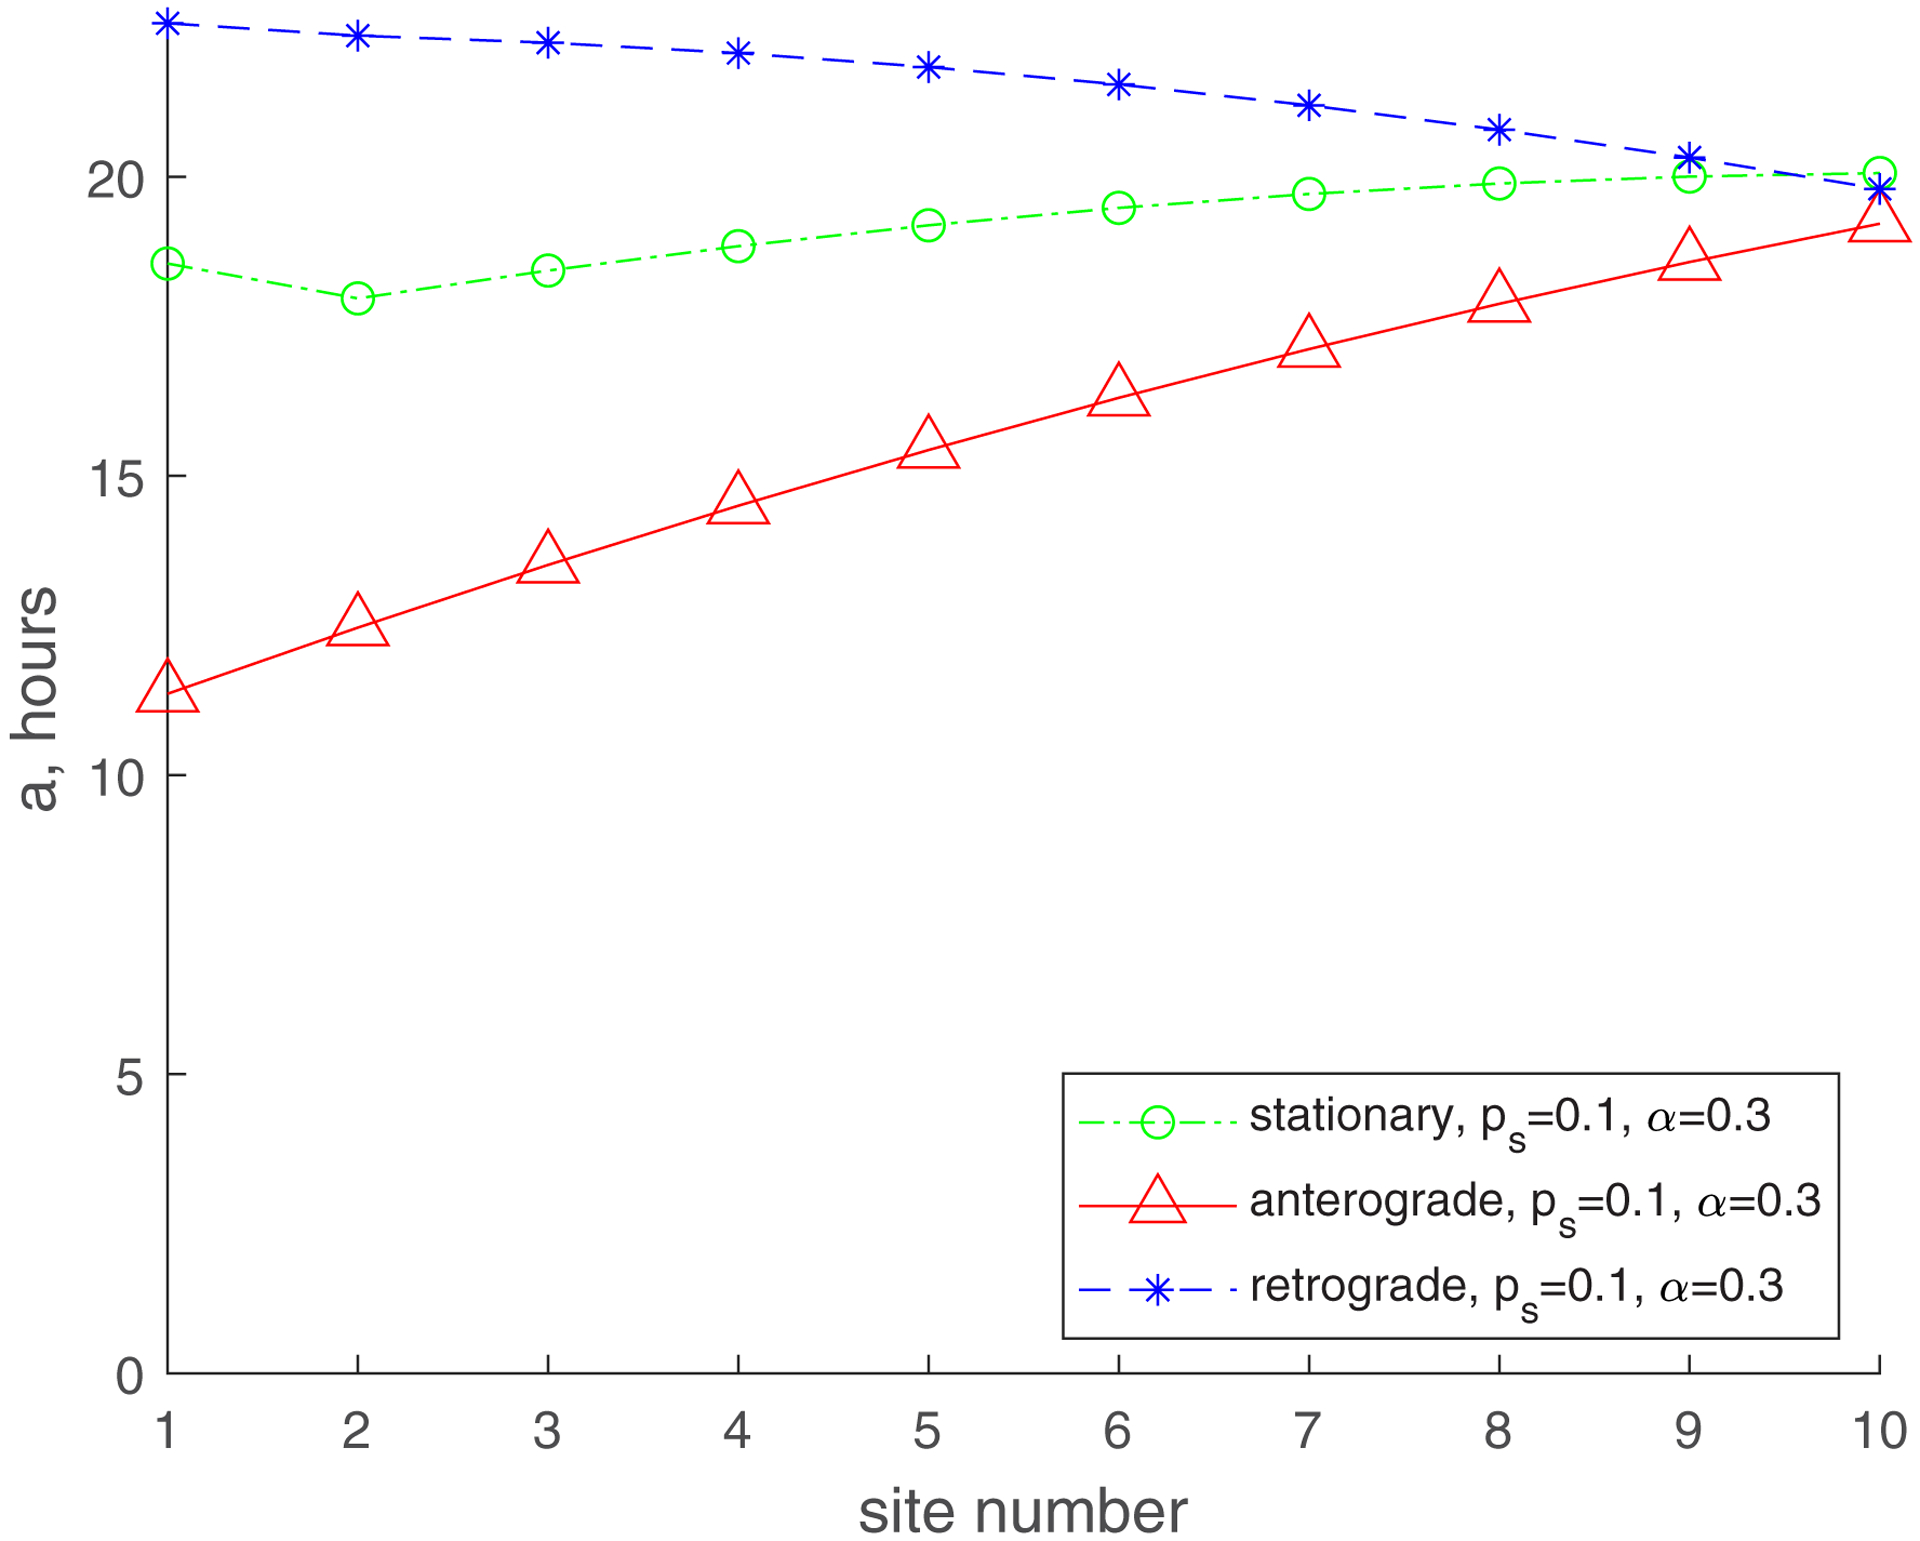
Mean age of stationary, anterogradely moving, and retrogradely moving mitochondria. (a) , ; (b) , ; (c) , ; (d) , . Number of demand sites N=10.
Since the compartmental model does not consider the time it takes for mitochondria to transition between the compartments [42], it is necessary to prove that the age of mitochondria predicted by the model is less than the time it takes for mitochondria to travel from the soma to the axon tip without stops, :
| (53) |
This means that a compartmental model can be used to simulate the transport of mitochondria in relatively short axons, as one simulated in this paper, of the length of 104 μm.
The mean age for mitochondria for and roughly follows the same trend (an increase from the most proximal to the most distal demand site), but it is now much greater. The mean age of stationary mitochondria in the most distal demand site is now approximately 36 hours (Fig. 3b). This is because for the flux of mitochondria entering the axon includes mitochondria that leave the axon moving retrogradely (Fig. 2). We thus successfully simulated the situation described in ref. [19] that suggests that older mitochondria appear in the axon due to return of mitochondria leaving the axon, which turn around and return to the axon in the anterograde component. It should be noted that the real situation is even more complicated, since mitochondria returning to the axon are most likely repaired in the soma by fusion with newly synthesized mitochondria. Furthermore, moving mitochondria can fuse with stationary mitochondria residing in the axon and exchange mitochondrial proteins [5,25,43]. This process will need to be simulated in future versions of the model.
For a smaller value of (, , Fig. 3c), the mean age of mitochondria is significantly reduced. The mean age of stationary mitochondria in the most distal demand site is now approximately 10 h. This is because the probability of transitioning between moving states (anterograde or retrograde) and the stationary state (Fig. 2) is now much smaller. It is interesting that although the mean age of anterograde and stationary mitochondria increases from the most proximal to the most distal demand site, the age of retrograde mitochondria now decreases from the most proximal to the most distal demand site (Fig. 3c). This is because the exchange between moving and stationary mitochondria is now much less frequent (due to a smaller value of ), and mitochondria mostly remain in the same kinetic state (anterograde, stationary, or retrograde). Retrograde mitochondria age as they return from the most distal demand site (site 10) to the most proximal demand site (site 1), which explains why the age of retrograde mitochondria is the largest in the most proximal demand site.
The increase of (, , Fig. 3d) results in the increase of the mean age of mitochondria in all demand sites, but the trends stay the same. The mean age of the stationary mitochondria in the most distal demand site is now approximately 20 h. The increase in the mean age is due to the return of 30% of mitochondria exiting the most proximal demand site, which turn around and come back to the axon (Fig. 2).
The age density of mitochondria is important to characterize the ranges of mitochondria ages in different kinetic states (anterograde, stationary, and retrograde) in different demand sites. Fig. 4a compares the age densities of mitochondria computed for the base case (, , red lines) with age densities of mitochondria computed for the case of , , blue lines. The age densities of anterograde mitochondria are more narrow (Fig. 4a, see also Fig. 4b that shows a magnified view of Fig. 4a). Notably, the distribution of age densities widens for stationary mitochondria (Fig. 4c) and even wider for retrograde mitochondria (Fig. 4d). The shift of the age density curves towards older mitochondria, observed when is increased from 0 to 0.3 (Fig. 4d), can be attributed to the reentry of previously aged retrograde mitochondria back into the axon. The presence of older mitochondria is consistent with the results reported in ref. [19]. The peaks on the curves displaying the age density distributions are shifted toward older mitochondria for more distal demand sites (Fig. 4).
Fig. 4.
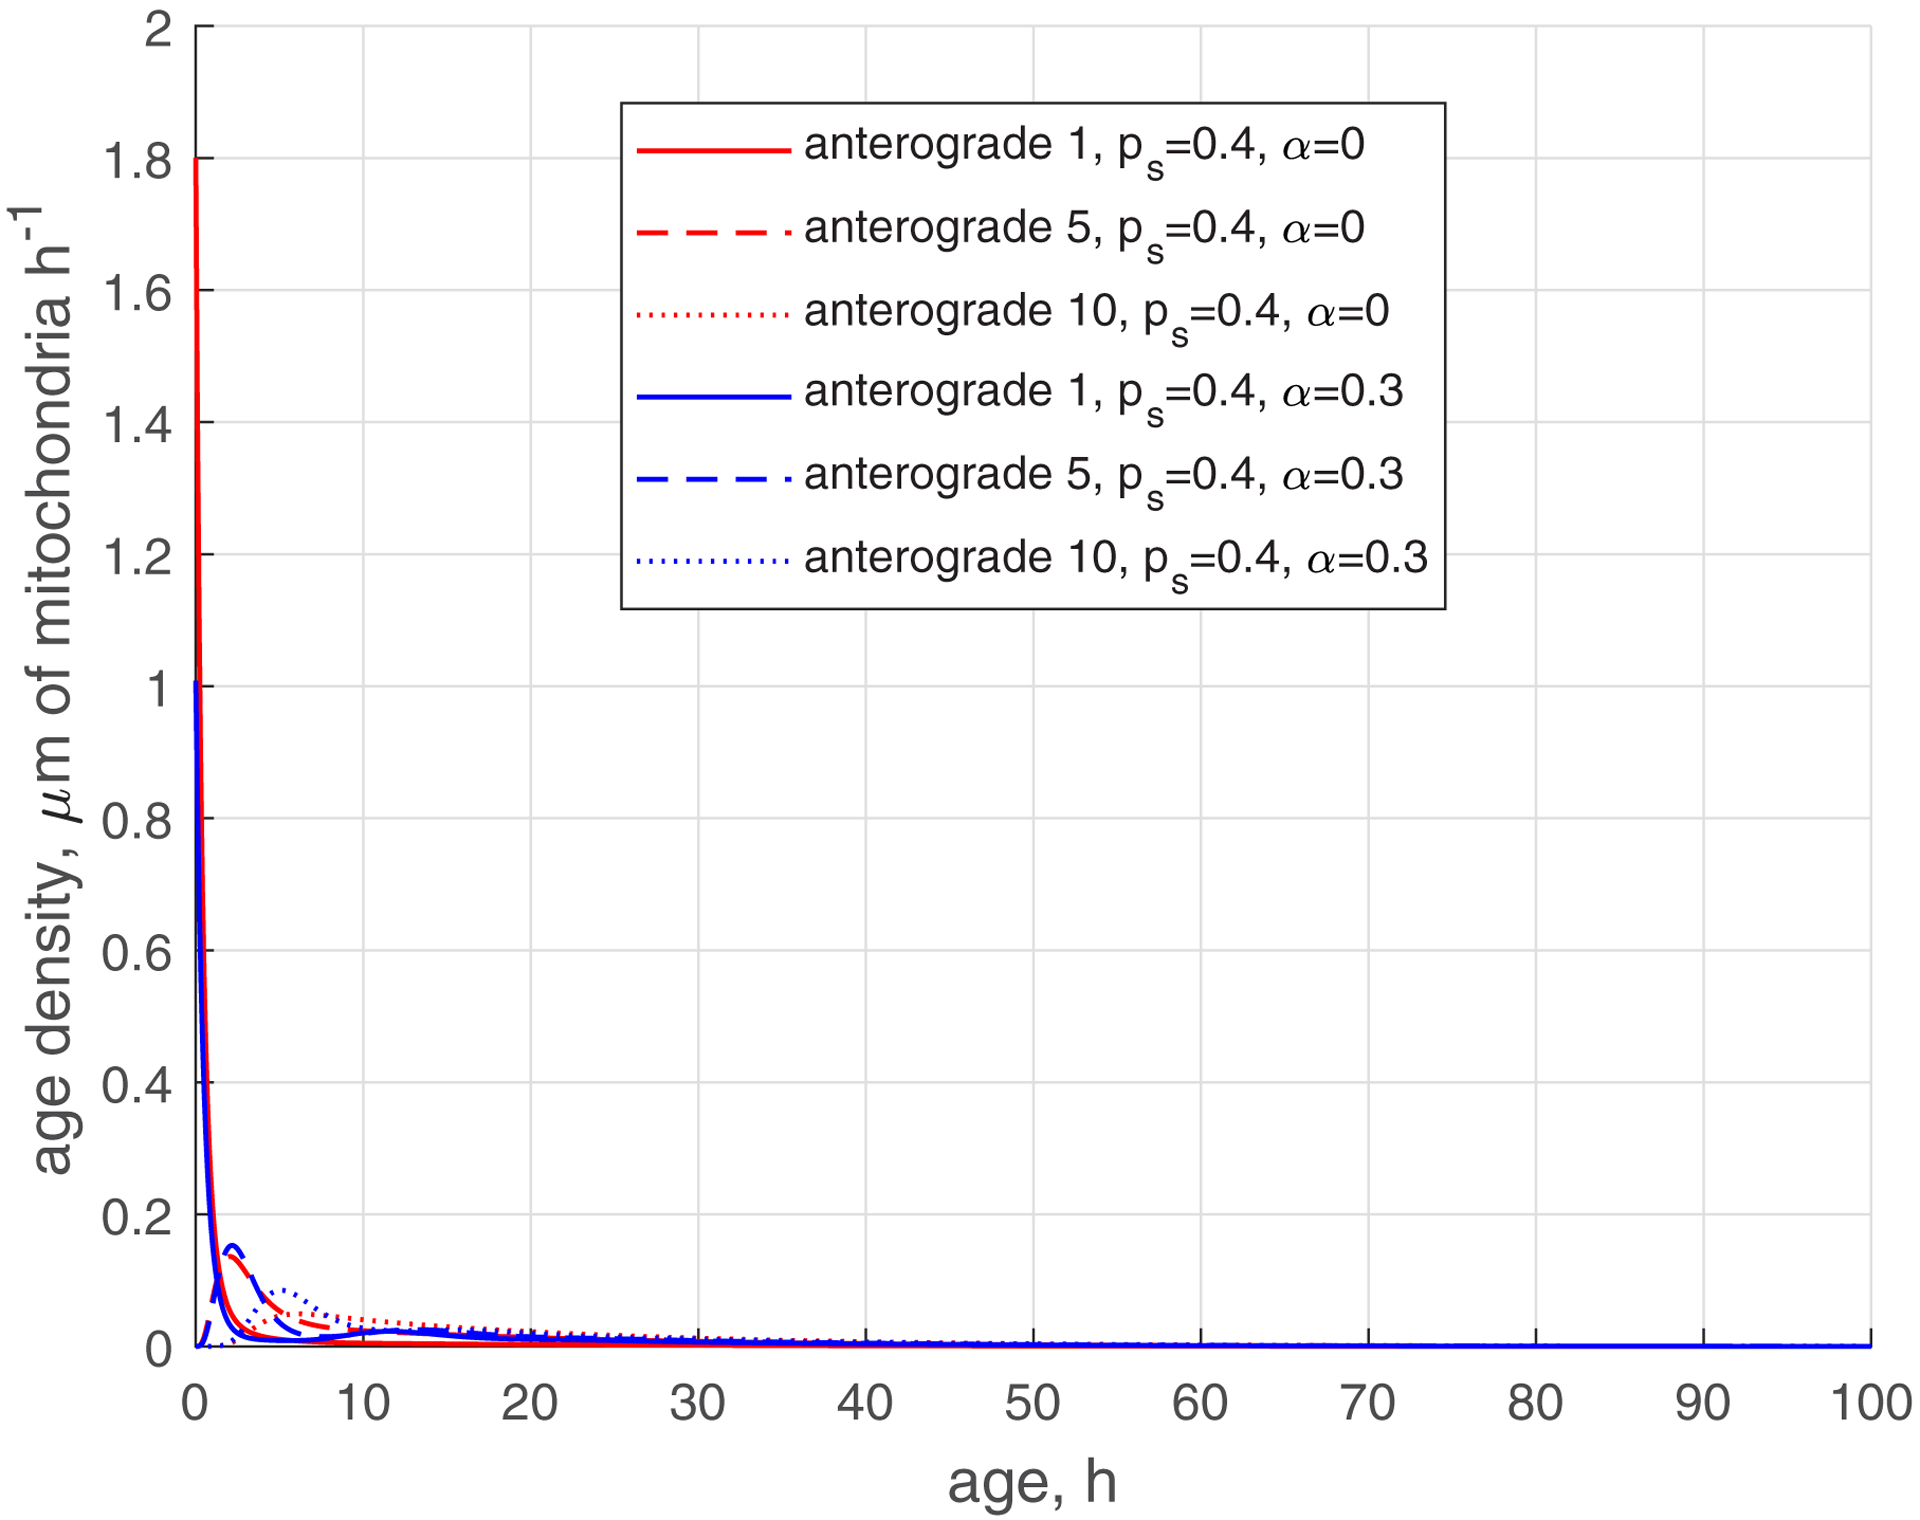

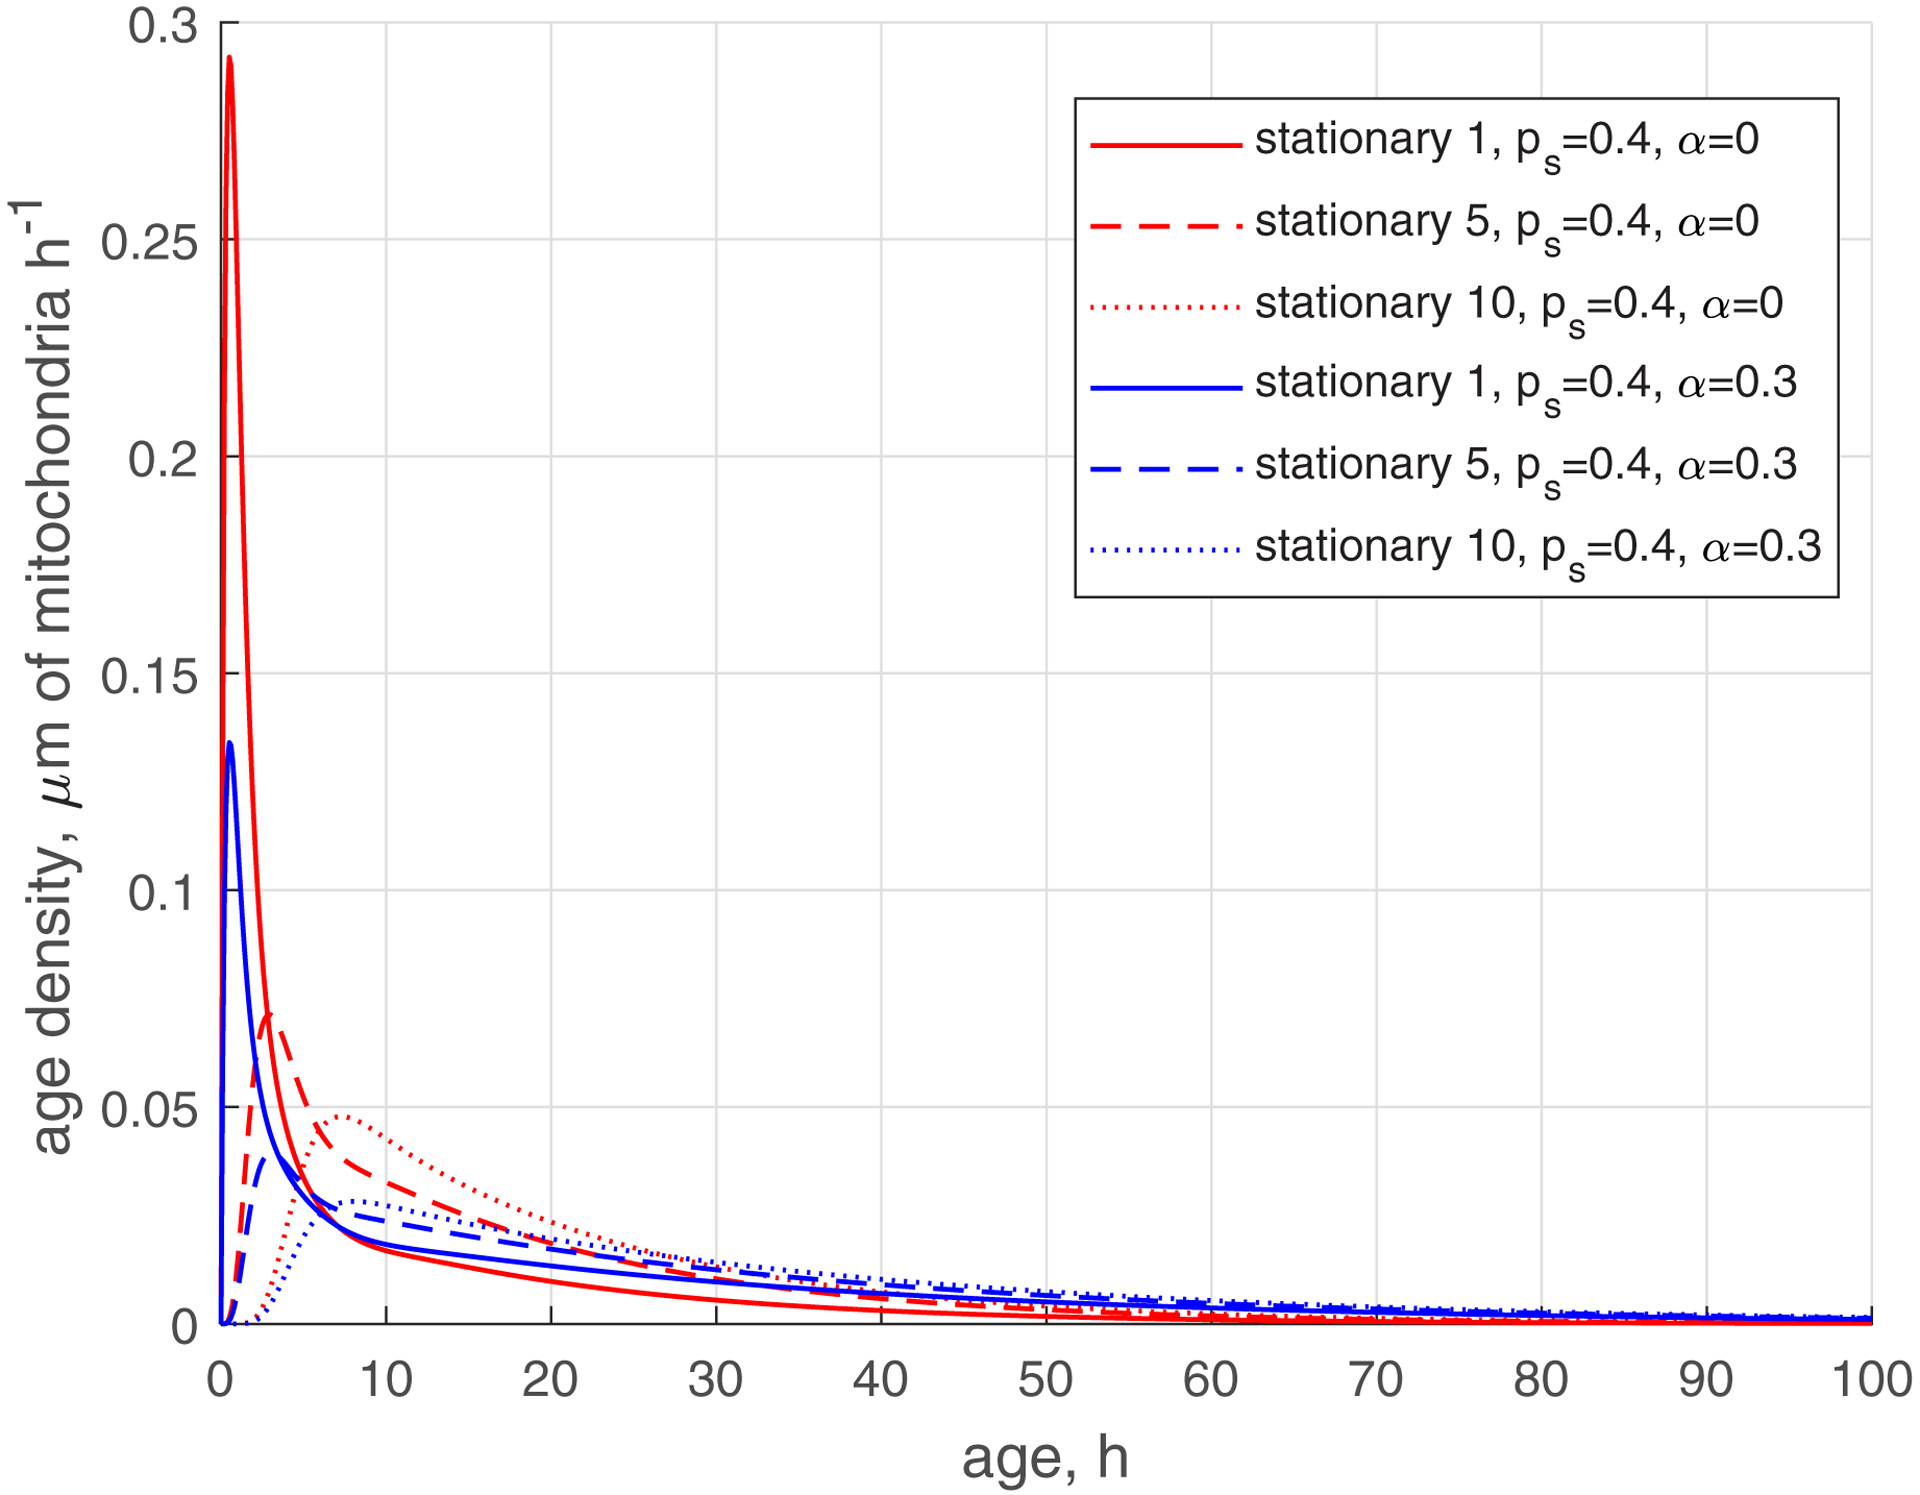
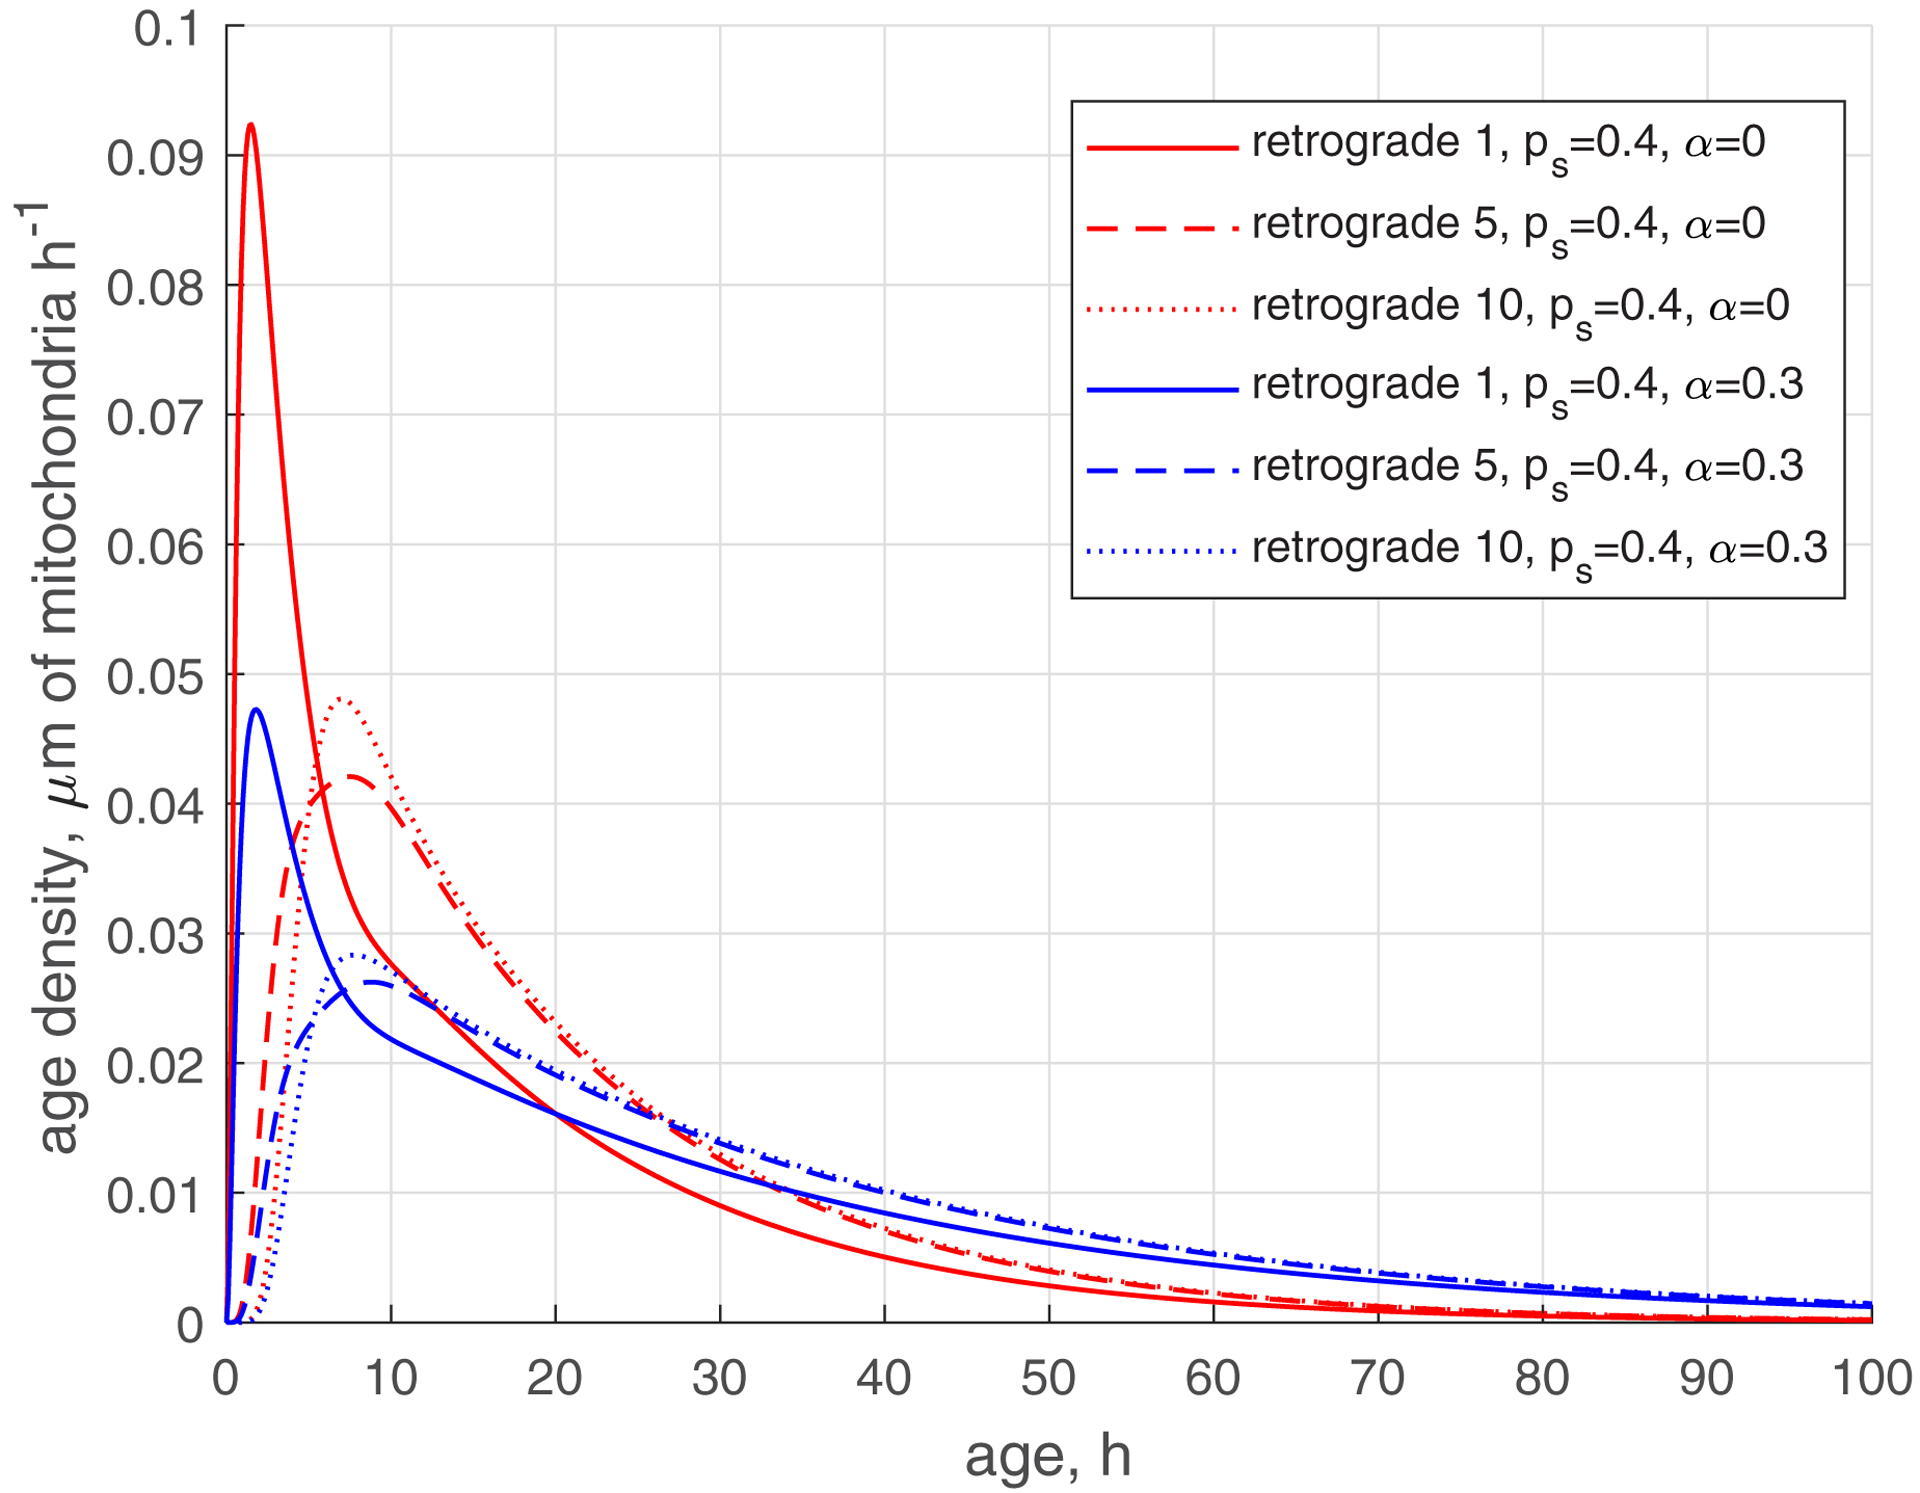
(a) Age density of anterogradely moving mitochondria in various demand sites. (b) Similar to Fig. 4a, this graph magnifies a specific age range of [0 10 hours] of the x-axis. (c) Age density of mitochondria in the stationary state in various demand sites. (d) Age density of retrogradely moving mitochondria in various demand sites. Two sets of parameter values: , (base case) and , . Number of demand sites N=10.
The reduction of the rate of mitochondria transition to the stationary state (characterized by ) makes the age density distribution of mitochondria (, , blue curves, Fig. 5) quite complex. The most noticeable change is the bimodal distribution that is visible in Fig. 5d in the solid blue curve displaying the age density of retrograde mitochondria in the most proximal demand site (site 1). The first peak occurs at approximately 1 h. It is explained by mitochondria that recently entered the axon, but then transitioned to the stationary state, and then to the retrograde state (Fig. 2). The second peak occurs at approximately 11 h. It is explained by older mitochondria that travelled to the axon tip and then returned to the most proximal site.
Fig. 5.
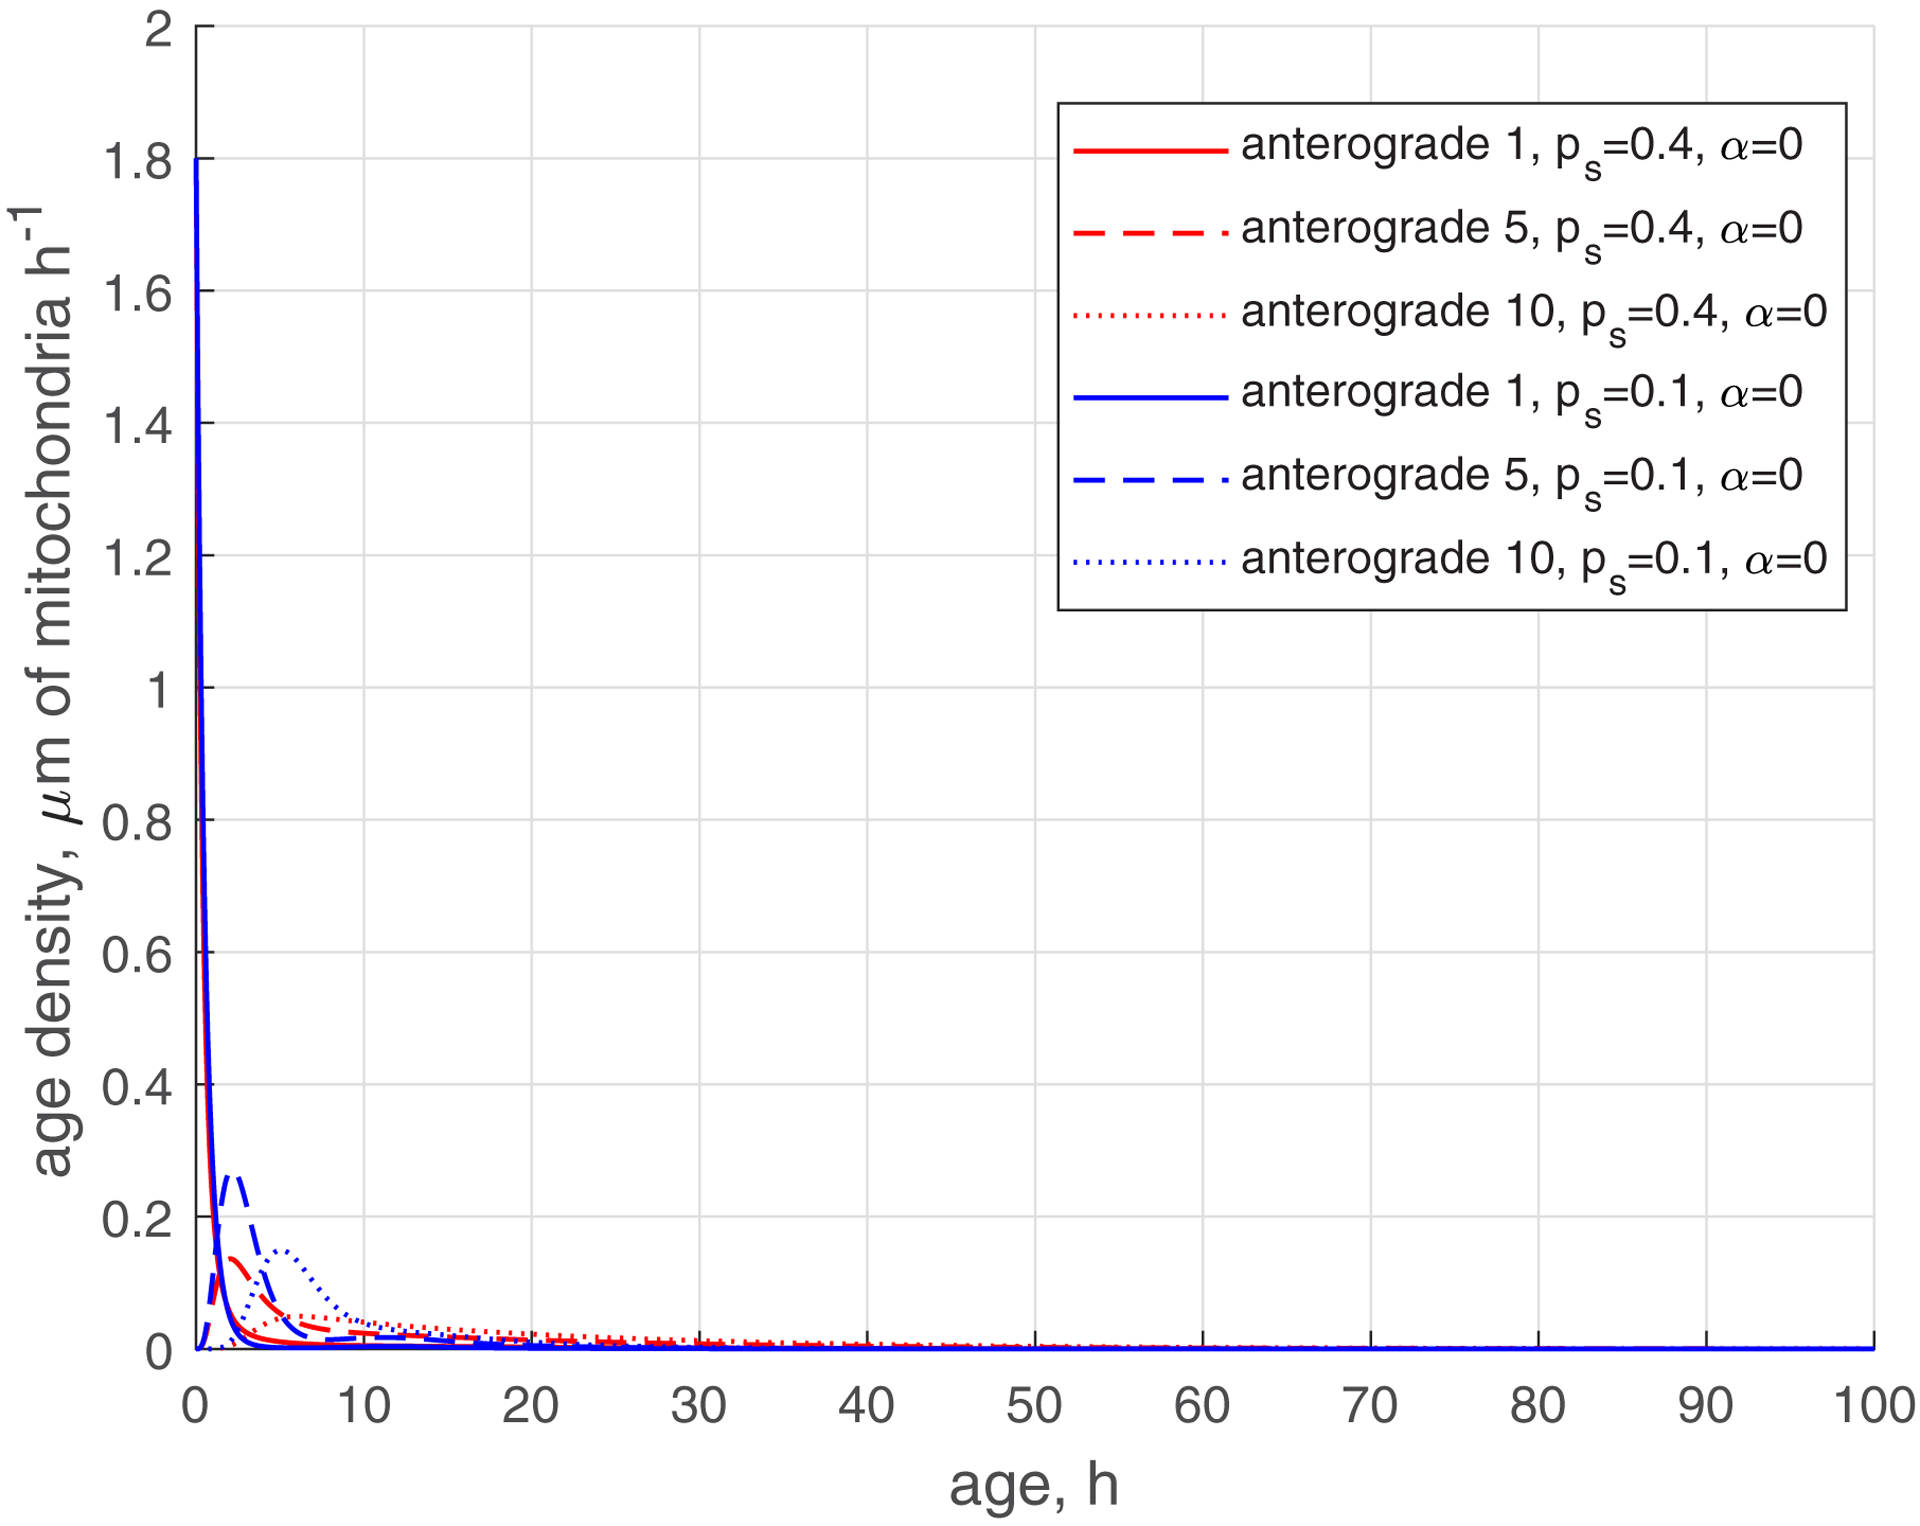
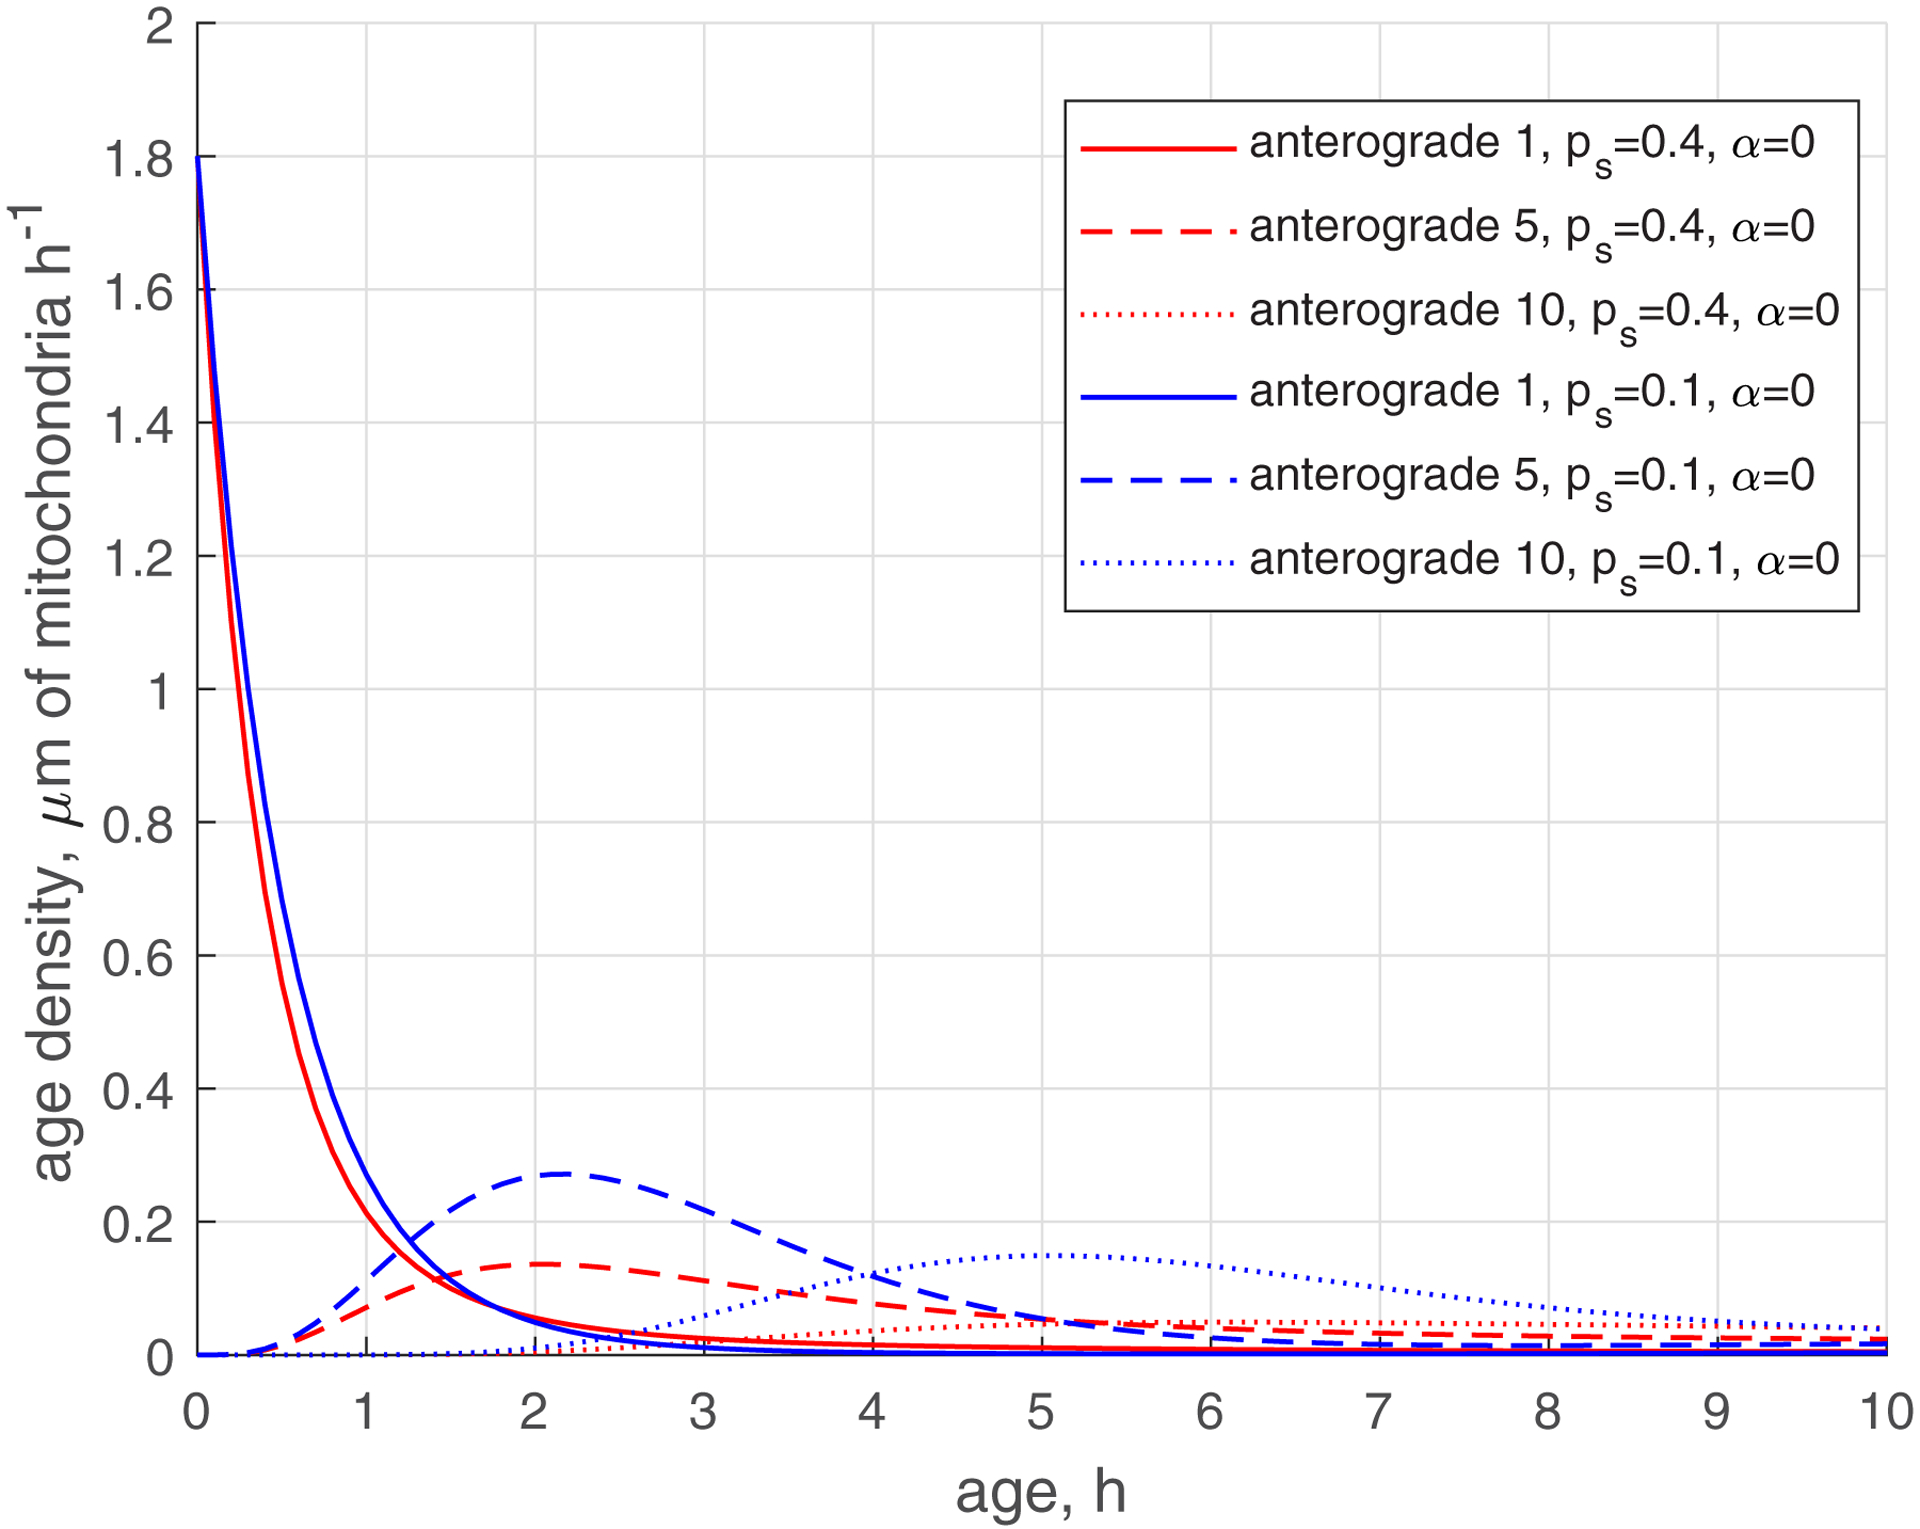
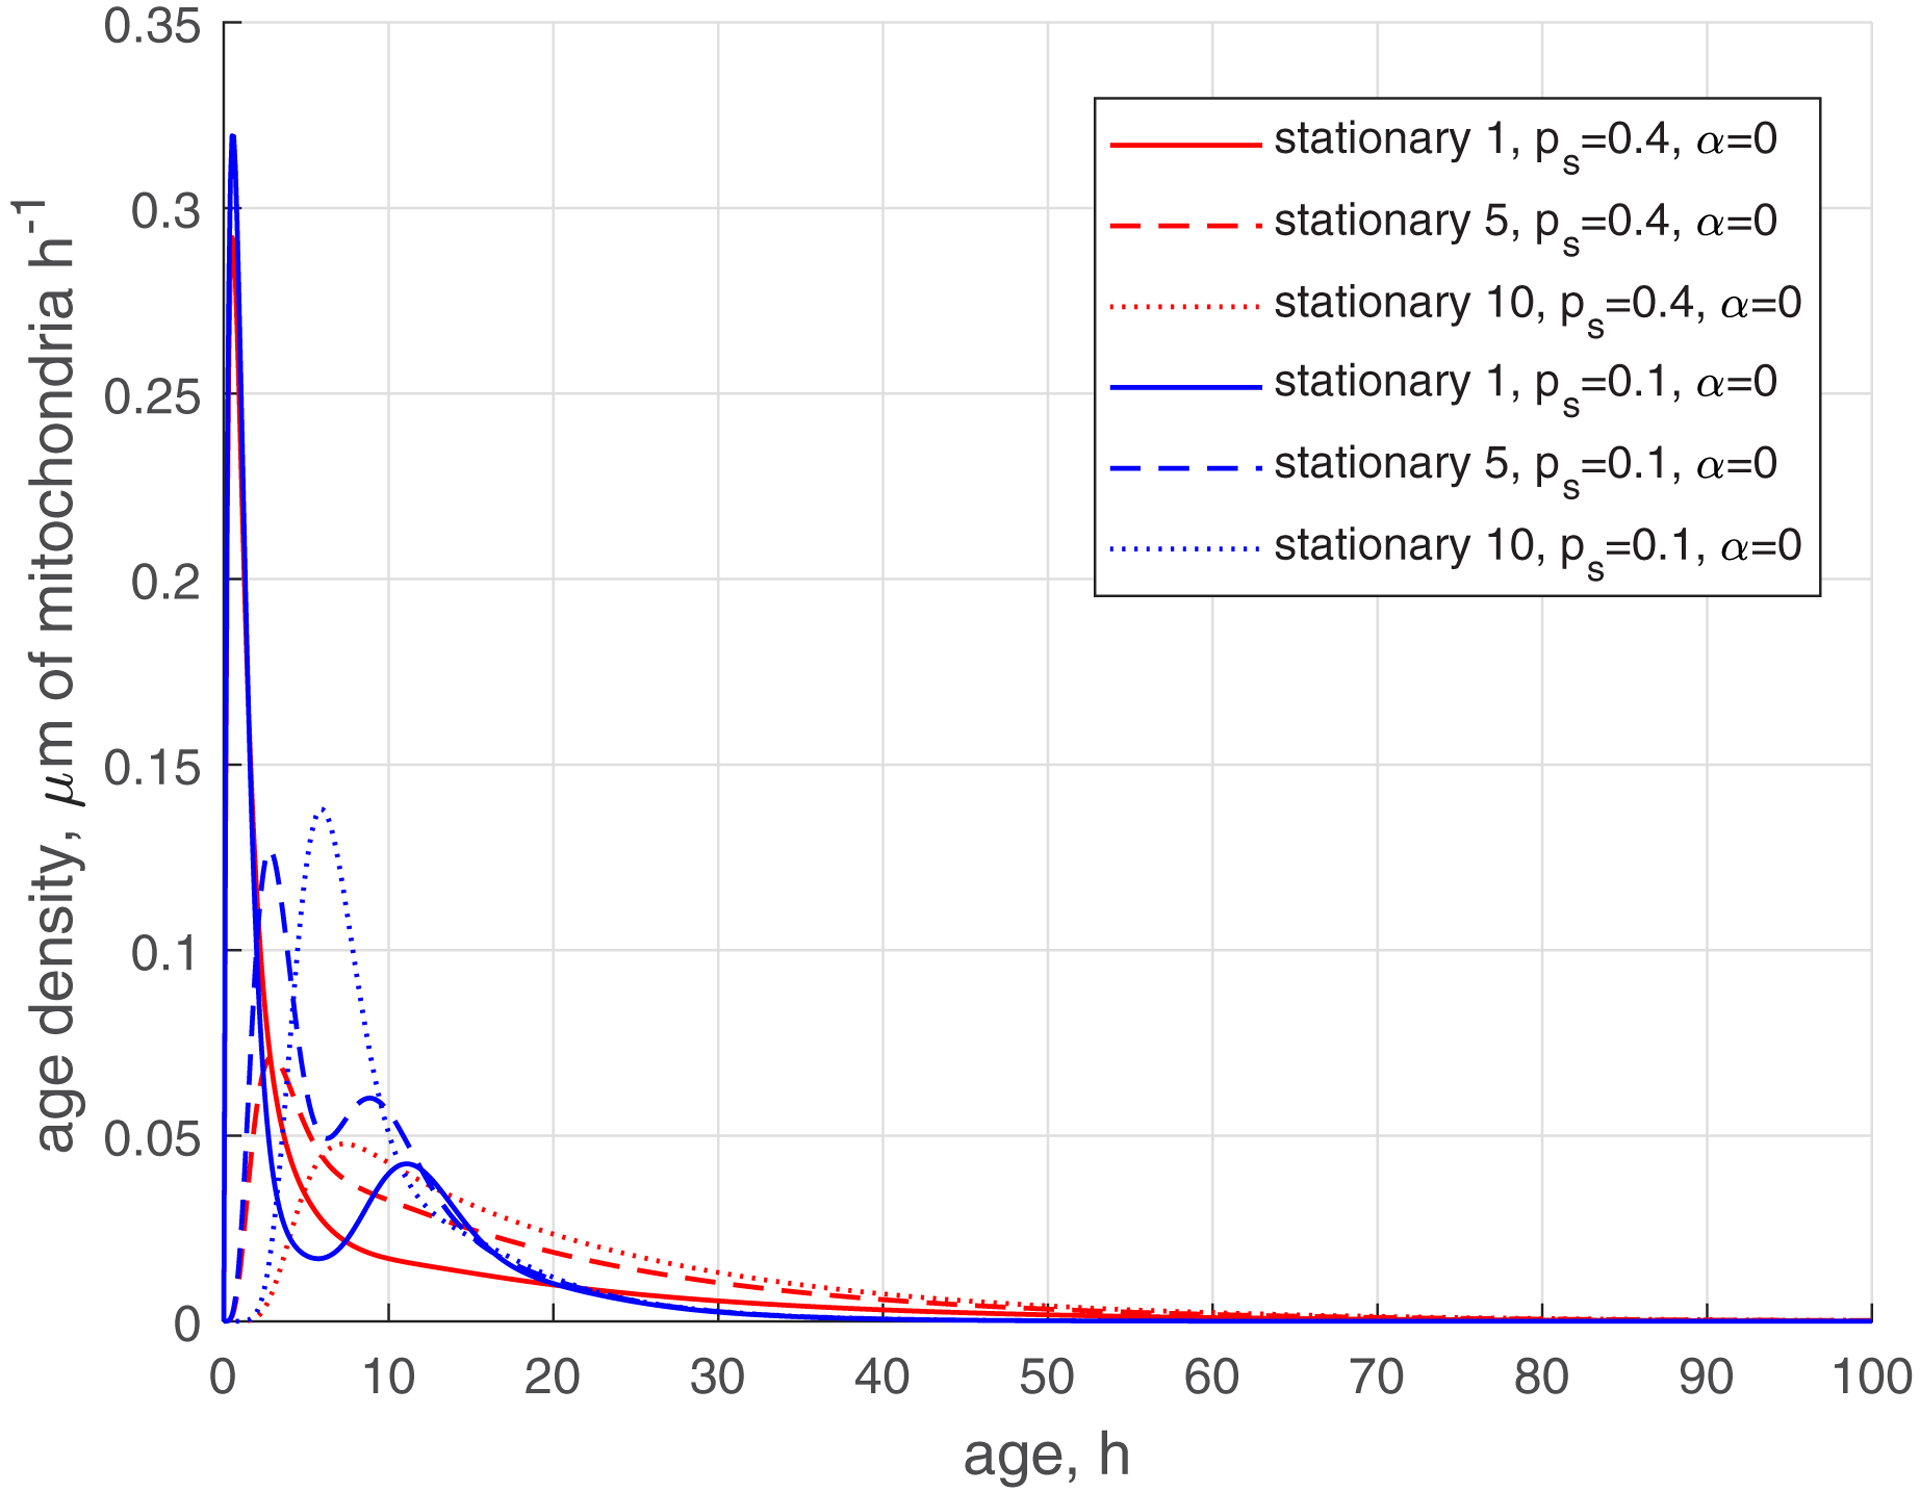
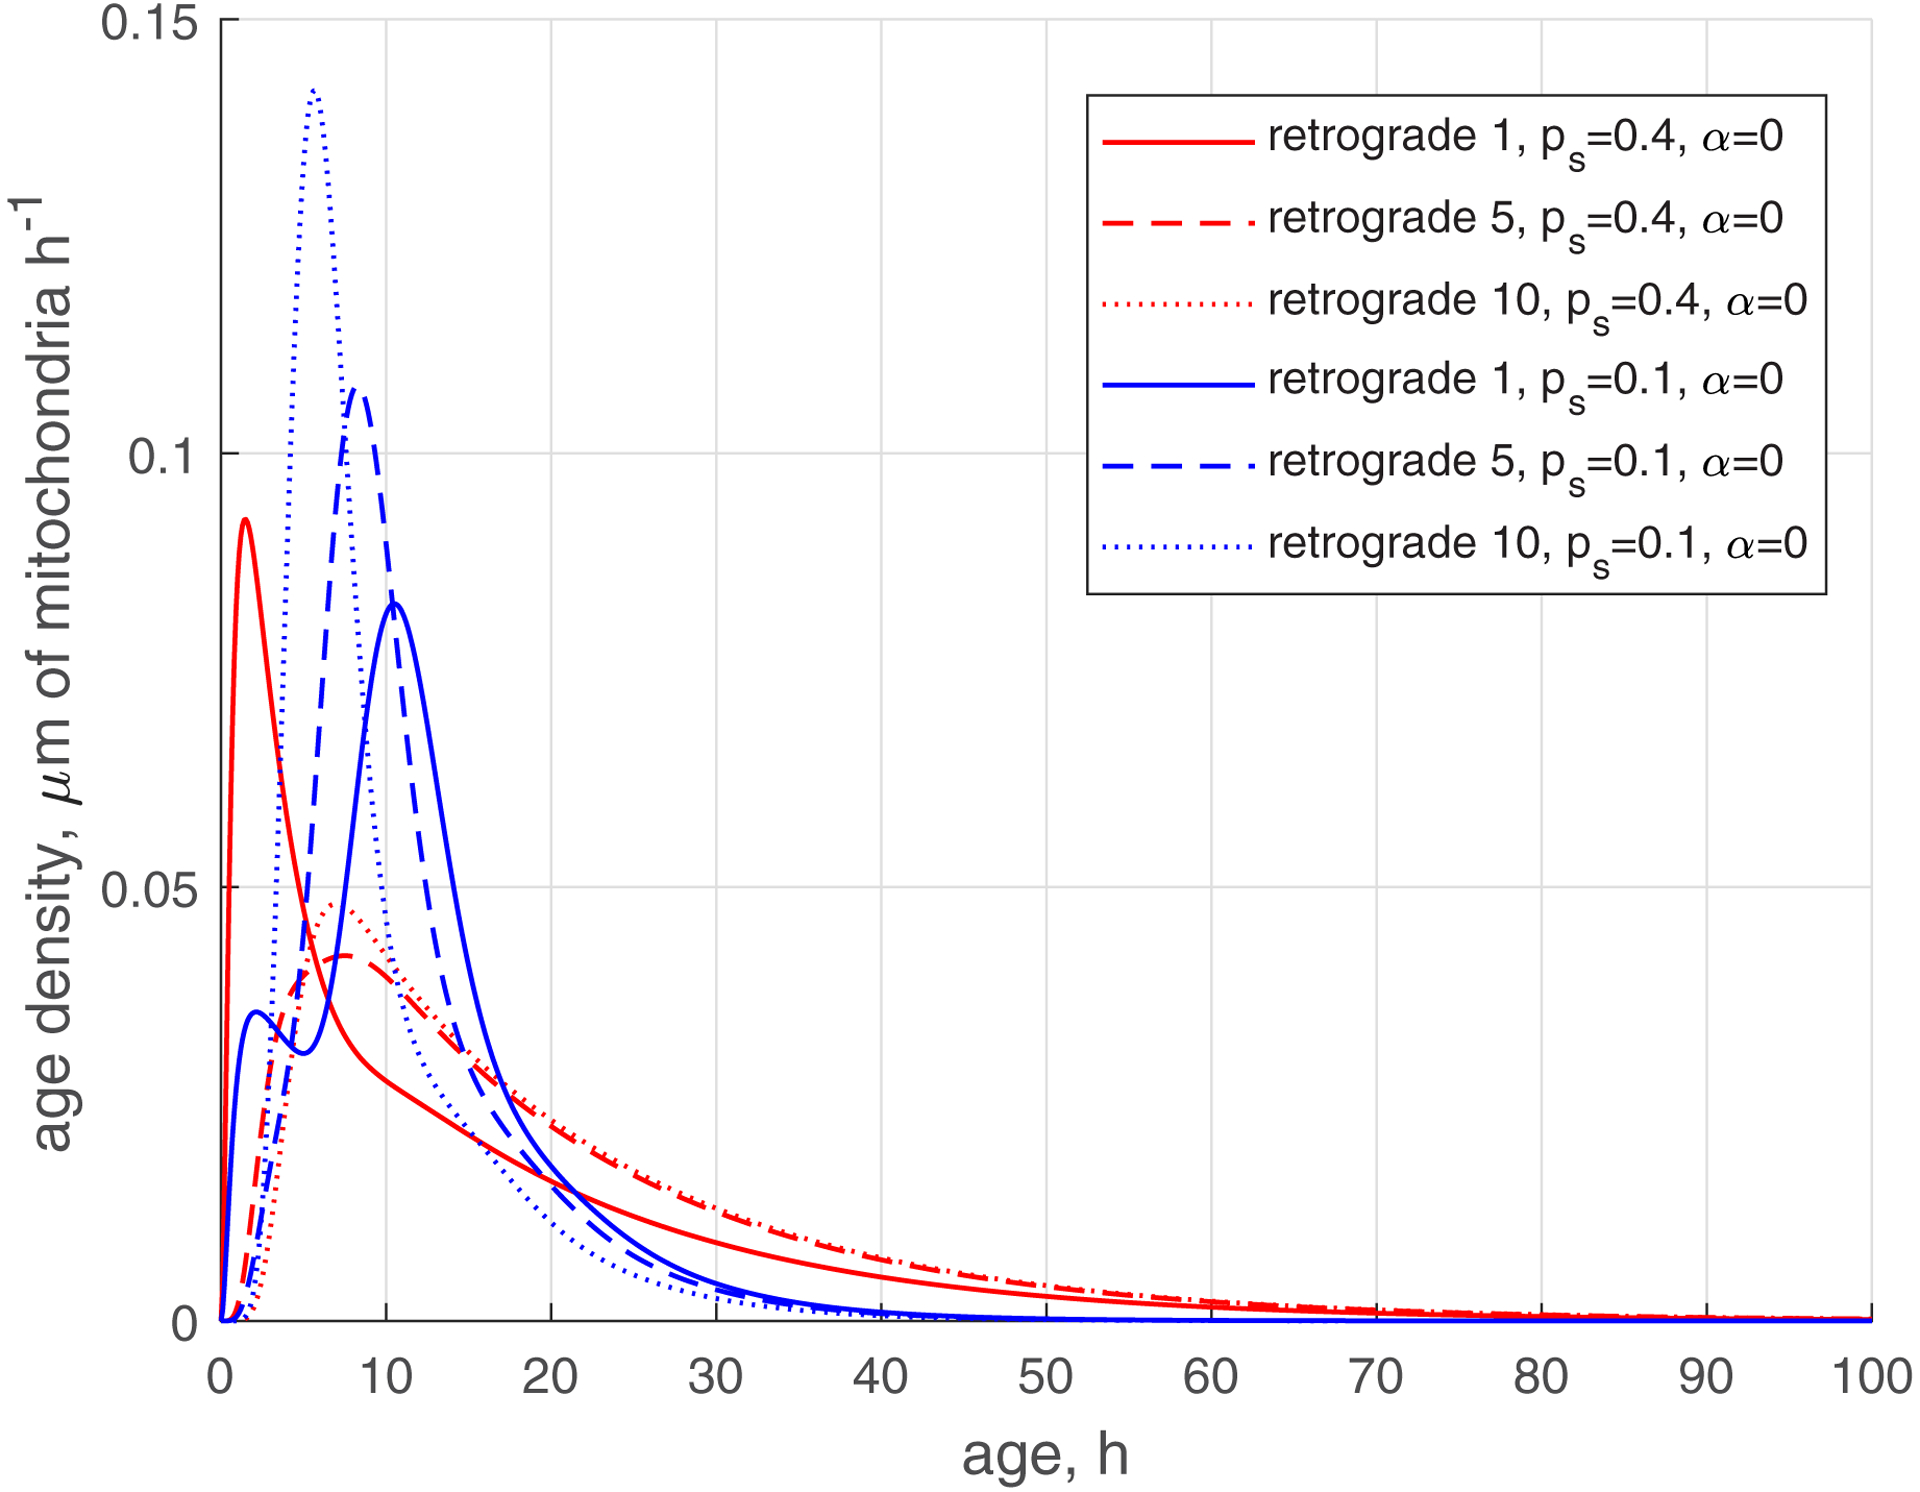
(a) Age density of anterogradely moving mitochondria in various demand sites. (b) Similar to Fig. 5a, this graph magnifies a specific age range of [0 10 hours] of the x-axis. (c) Age density of mitochondria in the stationary state in various demand sites. (d) Age density of retrogradely moving mitochondria in various demand sites. Two sets of parameter values: , (base case) and , . Number of demand sites N=10.
The increase of the value of (more mitochondria return to recirculation in the axon) while keeping low (small transition rate to the stationary state) makes the tails in age density distributions longer, which means the presence of older mitochondria in the axon, see ref. [35] (, , blue curves in Fig. S3d). Interestingly, the first peak on the solid blue curve in Fig. S3d, displaying the age density of retrograde mitochondria in site 1 (at approximately 1 h), has almost disappeared; it degraded nearly to the horizontal slope of the curve (compare Fig. S3d with Fig. 5d). All age density distributions in Figs. 4, 5, S3, and in particular in Fig. S3d, are skewed right. This indicates that although the mean ages of mitochondria are of the order of 20 hours (see Fig. 3d, which shows mean ages of mitochondria that correspond to the age density distributions depicted by blue lines in Fig. S3d), there are also much older mitochondria present in the axon, which stay in the axon several times longer than 20 h, probably completing several circulations or staying a long time in the stationary state before returning to the mobile pool.
We have confirmed that the bimodal age density distribution of retrograde mitochondria is not exclusive to 10 demand sites. In Figs. S4 and S5 in Supplemental Materials, we analyzed the age density distributions of mitochondria in an axon consisting of five demand sites (N=5). The bimodal distributions observed for retrograde mitochondria in the most proximal demand site are visible in Figs. S4d and S5d. Our hypothesis suggests that the bimodal distribution arises from the presence of retrograde mitochondria with two distinct ages: (i) relatively young mitochondria that stop and become retrograde, and (ii) relatively old mitochondria that travel to the end of the axon, reverse their direction, and return. The difference in ages between these two types of mitochondria is most prominent in the most proximal demand site, resulting in the occurrence of a bimodal distribution. In more distant demand sites, the bimodal pattern may become less pronounced.
3.3. Sensitivity of the mean age of mitochondria in demand sites to and
This investigation was performed by computing local sensitivity coefficients, which are first-order partial derivatives of the observables with respect to model parameters [44–47]. For example, the sensitivity coefficient of the mean age of resident mitochondria in demand sites to parameter at steady-state (ss) was calculated as follows:
| (54) |
where (we tested the accuracy by using various step sizes).
To make sensitivity coefficients independent of the magnitude of the parameter whose sensitivity was tested, we calculated non-dimensional relative sensitivity coefficients [45,48], which were defined as (for example):
| (55) |
The dimensionless sensitivity of the mean age of mitochondria to the probability that mobile mitochondria would transition to a stationary state at a demand site, , is positive in all demand sites (Fig. 6a). This is because mitochondria spend more time in the stationary state when the stopping probability is larger.
Fig. 6.
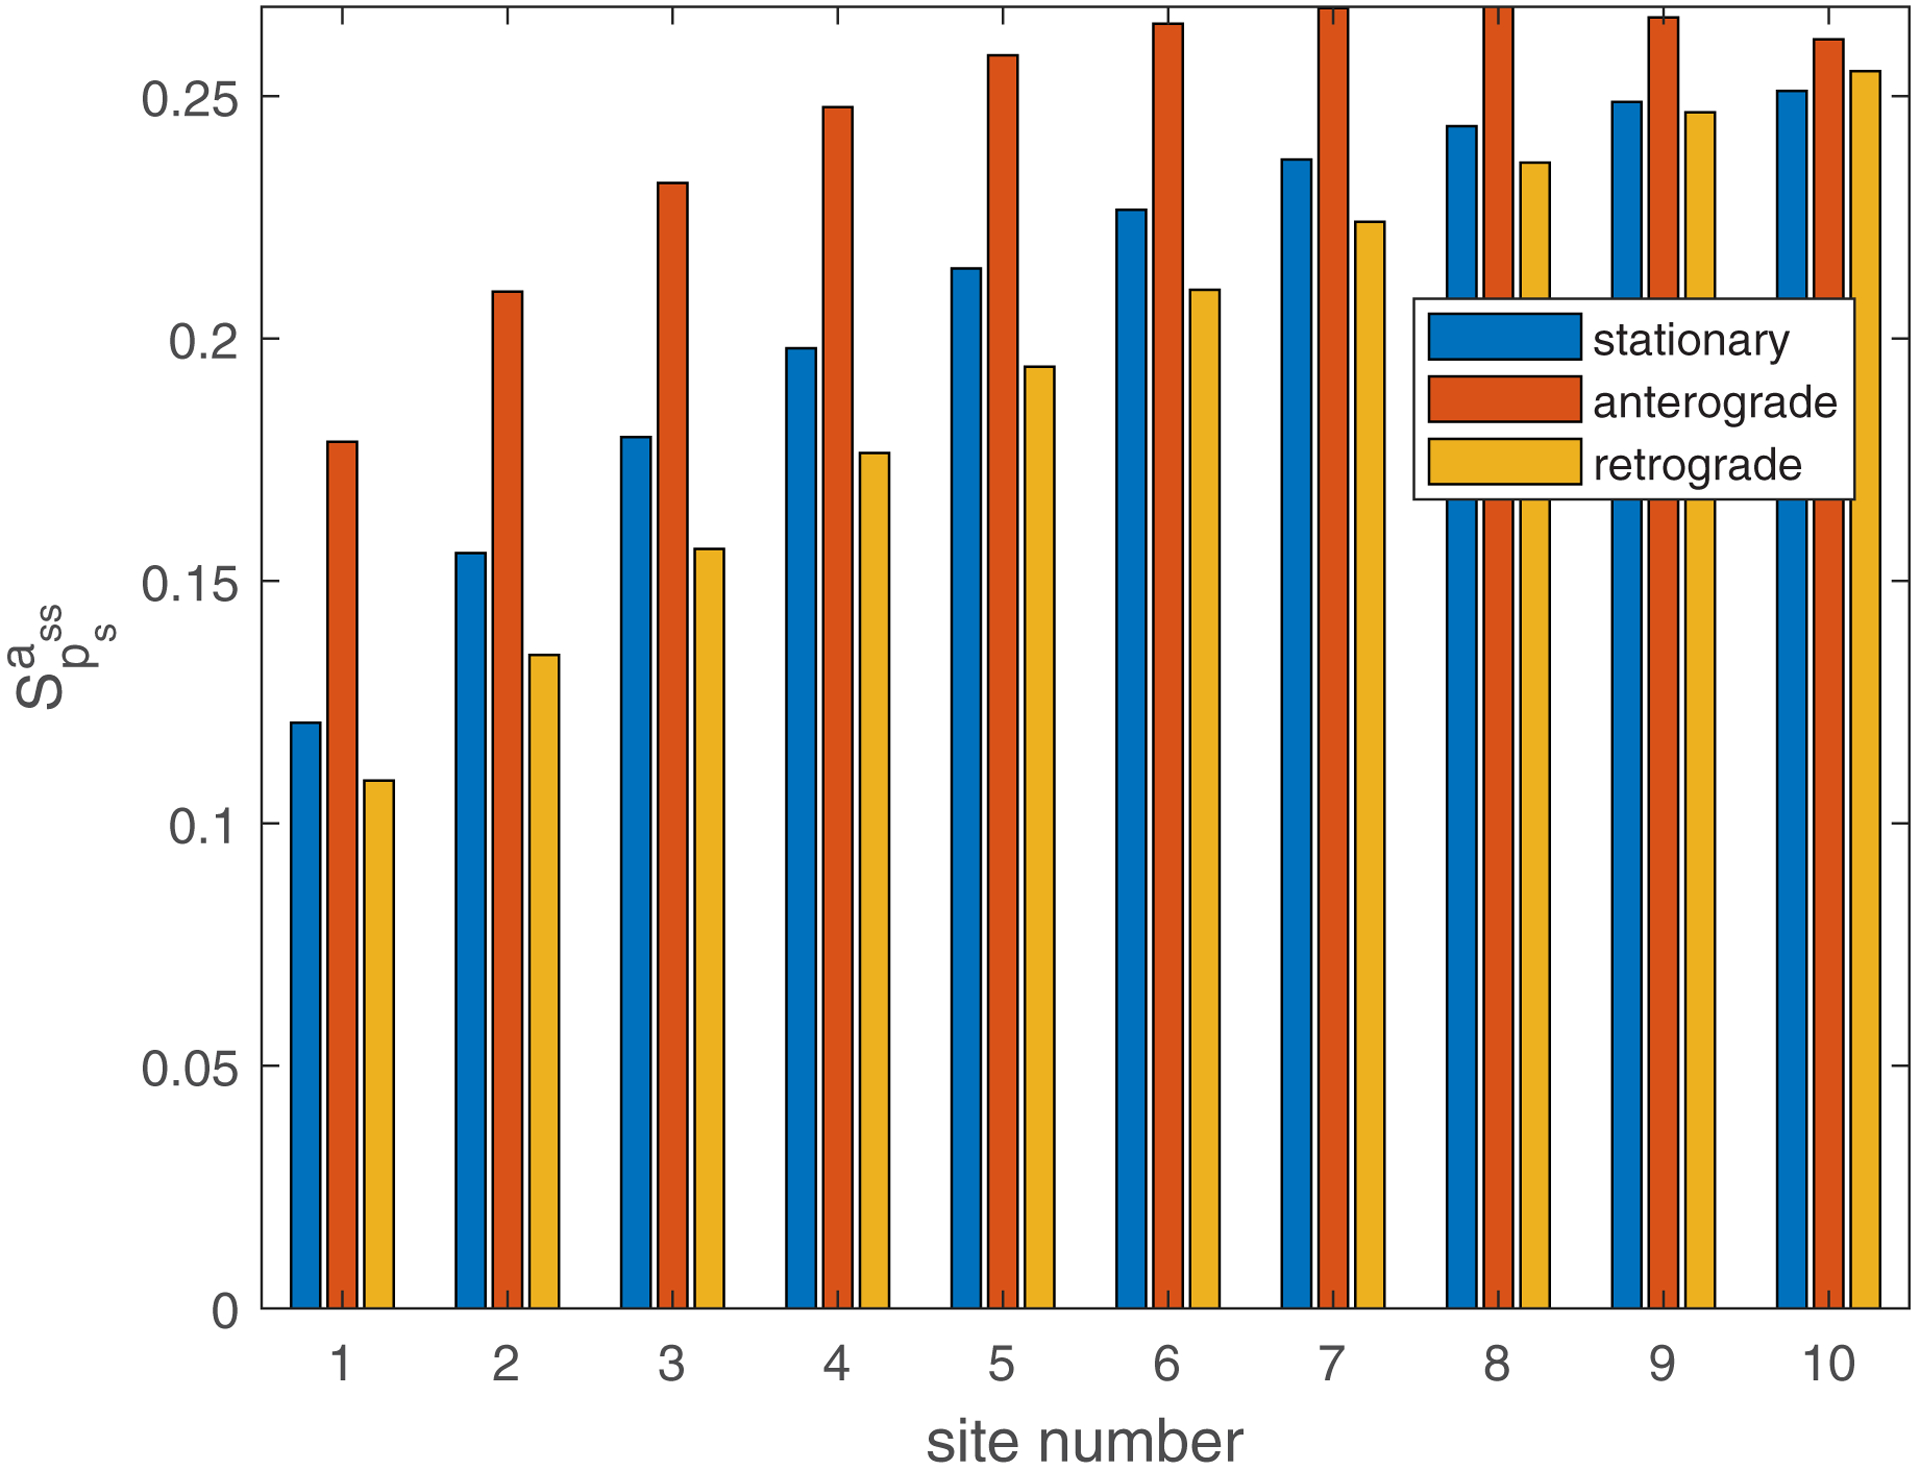
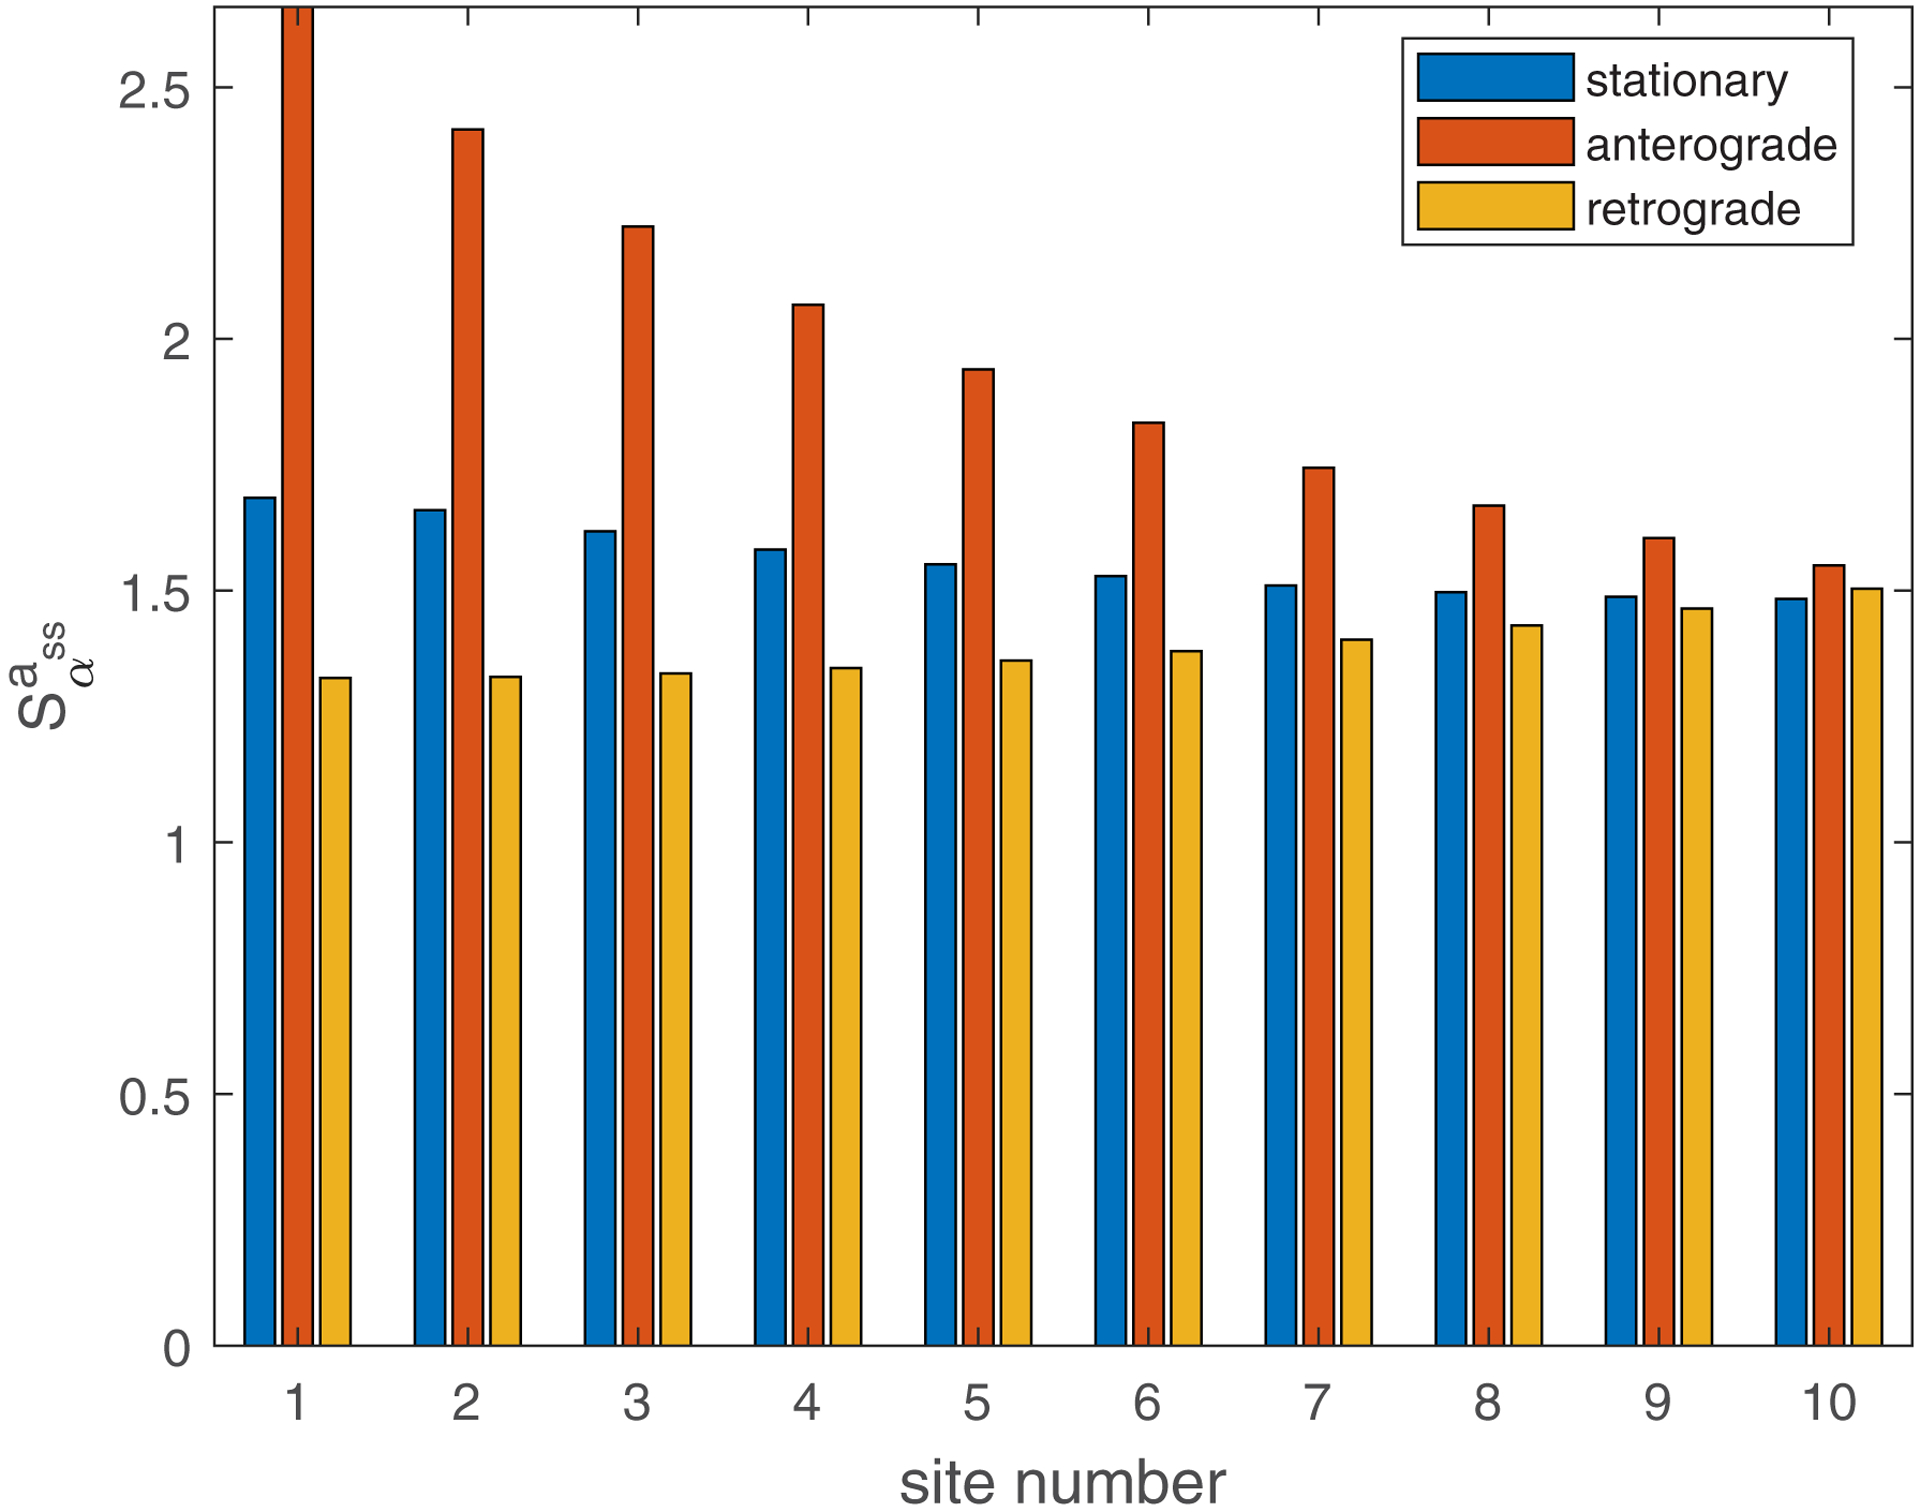
(a) Dimensionless sensitivity of the mean age of mitochondria to the probability that mobile mitochondria would transition to a stationary state at a demand site, , versus the site number. Computations were performed with . A close result was obtained for . (b) Dimensionless sensitivity of the mean age of mitochondria to the portion of mitochondria that return to the axon after exiting the axon, , versus the site number. Computations were performed with . A close result was obtained for . Sensitivities are analyzed around s−1, . Number of demand sites N=10.
The dimensionless sensitivity of the mean age of mitochondria to the portion of mitochondria that return to the axon after exiting the axon, , is also positive in all demand sites (Fig. 6b). This is because older mitochondria, which already circulated in the axon, re-enter the axon when the value of is larger than zero. The number of older mitochondria in the axon thus increases. This is consistent with the results depicted in Fig. 3 (compare the results in Fig. 3a and Fig. 3b, and also the results in Fig. 3c and Fig. 3d). It is interesting to note that the mean age of stationary mitochondria is approximately 10 times more sensitive to than to (compare Fig. 6b with Fig. 6a). We examined whether this conclusion remains consistent regardless of the number of demand sites. The findings depicted in Fig. S6, computed for five demand sites (N=5), reveal that the sensitivity to is independent of the number of compartments, while the sensitivity to scales linearly with the number of compartments in the axon. This outcome arises from the fact that represents the stopping probability in each compartment. Notably, this result implies that for a very long axon with many compartments, the age of mitochondria may be highly sensitive to the stopping probability.
4. Discussion, limitations of the model, and future directions
We developed a model that accounts for the return of a portion of mitochondria (characterized by parameter ) back to the axon after mitochondria complete circulation in the axon. We investigated how the mean age and age density distribution of mitochondria depend on . We also investigated the dependence of the same quantities on .
Bimodal age density distributions are found for a smaller value of (. The peak corresponding to older mitochondria on the curve displaying the age density distribution of retrograde mitochondria is explained by mitochondria that traveled to the tip of the axon and then traveled back in the retrograde component. The peak corresponding to younger mitochondria on the curve displaying the age density distribution of retrograde mitochondria is explained by mitochondria that transitioned from the anterograde state to the state occupied by stationary mitochondria and then to the retrograde state.
We found that the mean age of stationary mitochondria is very sensitive to parameter . It is an order of magnitude less sensitive to parameter . We also investigated how the sensitivity of the mean age of stationary mitochondria depends on the number of compartments in the axon. The sensitivity to the stopping probability, , increases proportionally with the number of compartments in the axon. This suggests that in an extremely long axon with a large number of compartments, the age of mitochondria could be highly influenced by the stopping probability.
The prediction of a broader age density distribution for retrograde mitochondria compared to anterograde mitochondria could in principle be accessible with experimental measurements.
Future research should aim to explore the feasibility of analytically solving equations of our model to obtain explicit expressions for the age densities of mitochondria in anterograde, stationary, and retrograde kinetic states. Future modeling work should prove that the time-scale for transitioning between compartments in our model is comparable to the time-scale for mixing within an individual compartment. To investigate the time-scale for mixing within an individual compartment, it may be necessary to develop a model that would treat mitochondria as individual particles [25,49]. The utilization of a discrete model would provide much more detailed information on mitochondria trajectories and age. A promising extension of the current approach would also involve incorporating the stochastic nature of mitochondrial transport. Furthermore, in future research, a model of fusion/fission of mitochondria should be developed. This is especially important because fusion with newly synthesized mitochondria contributes to the replenishment of older mitochondria with new mitochondrial proteins [19]. Mitochondria removal via mitophagy [50,51] also needs to be incorporated in future models. Some mitochondria degradation may occur in axons locally [52,53]. The effect of this possibility should be incorporated into future models. Future research should also investigate the effect of domain discretization (using a different number of compartments) on the predictions of the developed model.
Supplementary Material
Acknowledgment
IAK acknowledges the fellowship support of the Paul and Daisy Soros Fellowship for New Americans and the NIH/National Institute of Mental Health (NIMH) Ruth L. Kirchstein NRSA (F30 MH122076-01). AVK acknowledges the support of the National Science Foundation (award CBET-2042834) and the Alexander von Humboldt Foundation through the Humboldt Research Award.
References
- 1.Fan TJ, Xia L, Han YR. Mitochondrion and apoptosis. Acta Biochimica Et Biophysica Sinica 2001; 33(1): 7–12. [PubMed] [Google Scholar]
- 2.Picard M, McEwen BS. Psychological stress and mitochondria: A systematic review. Psychosomatic Medicine 2018; 80(2): 141–153. [DOI] [PMC free article] [PubMed] [Google Scholar]
- 3.Snyder CM, Chandel NS. Mitochondrial regulation of cell survival and death during low-oxygen conditions. Antioxidants & Redox Signaling 2009; 11(11): 2673–2683. [DOI] [PMC free article] [PubMed] [Google Scholar]
- 4.Tian HY, Chen XY, Liao J, Yang T, Cheng SW, Mei ZG, Ge JW. Mitochondrial quality control in stroke: From the mechanisms to therapeutic potentials. Journal of Cellular and Molecular Medicine 2022; 26(4): 1000–1012. [DOI] [PMC free article] [PubMed] [Google Scholar]
- 5.Misgeld T, Schwarz TL. Mitostasis in neurons: Maintaining mitochondria in an extended cellular architecture. Neuron 2017; 96(3): 651–666. [DOI] [PMC free article] [PubMed] [Google Scholar]
- 6.Kim I, Rodriguez-Enriquez S, Lemasters JJ. Selective degradation of mitochondria by mitophagy. Archives of Biochemistry and Biophysics 2007; 462(2): 245–253. [DOI] [PMC free article] [PubMed] [Google Scholar]
- 7.Bartel K, Pein H, Popper B, Schmitt S, Janaki-Raman S, Schulze A, Lengauer F, Koeberle A, Werz O, Zischka H, Mueller R, Vollmar AM, von Schwarzenberg K. Connecting lysosomes and mitochondria - a novel role for lipid metabolism in cancer cell death. Cell Communication and Signaling 2019; 17: 87. [DOI] [PMC free article] [PubMed] [Google Scholar]
- 8.Mogre SS, Brown AI, Koslover EF. Getting around the cell: Physical transport in the intracellular world. Physical Biology 2020; 17(6): 061003. [DOI] [PubMed] [Google Scholar]
- 9.Trushina E A shape shifting organelle: Unusual mitochondrial phenotype determined with three-dimensional electron microscopy reconstruction. Neural Regeneration Research 2016; 11(6): 900–901. [DOI] [PMC free article] [PubMed] [Google Scholar]
- 10.Melkov A, Abdu U. Regulation of long-distance transport of mitochondria along microtubules. Cellular and Molecular Life Sciences 2018; 75(2): 163–176. [DOI] [PMC free article] [PubMed] [Google Scholar]
- 11.Kruppa AJ, Buss F. Motor proteins at the mitochondria cytoskeleton interface. Journal of Cell Science 2021; 134(7): jcs226084. [DOI] [PMC free article] [PubMed] [Google Scholar]
- 12.Narayanareddy BRJ, Vartiainen S, Hariri N, O’Dowd DK, Gross SP. A biophysical analysis of mitochondrial movement: Differences between transport in neuronal cell bodies versus processes. Traffic 2014; 15(7): 762–771. [DOI] [PMC free article] [PubMed] [Google Scholar]
- 13.Hollenbeck PJ, Saxton WM. The axonal transport of mitochondria. Journal of Cell Science 2005; 118(23): 5411–5419. [DOI] [PMC free article] [PubMed] [Google Scholar]
- 14.Lees RM, Johnson JD, Ashby MC. Presynaptic boutons that contain mitochondria are more stable. Frontiers in Synaptic Neuroscience 2020; 11: 37. [DOI] [PMC free article] [PubMed] [Google Scholar]
- 15.Lewis TL Jr., Turi GF, Kwon S, Losonczy A, Polleux F. Progressive decrease of mitochondrial motility during maturation of cortical axons in vitro and in vivo. Current Biology 2016; 26(19): 2602–2608. [DOI] [PMC free article] [PubMed] [Google Scholar]
- 16.McWilliams TG, Ganley IG. Life in lights: Tracking mitochondrial delivery to lysosomes in vivo. Autophagy 2016; 12(12): 2506–2507. [DOI] [PMC free article] [PubMed] [Google Scholar]
- 17.McWilliams TG, Prescott AR, Montava-Garriga L, Ball G, Singh F, Barini E, Muqit MMK, Brooks SP, Ganley IG. Basal mitophagy occurs independently of PINK1 in mouse tissues of high metabolic demand. Cell Metabolism 2018; 27(2): 439–449. [DOI] [PMC free article] [PubMed] [Google Scholar]
- 18.McWilliams TG, Prescott AR, Allen GFG, Tamjar J, Munson MJ, Thomson C, Muqit MMK, Ganley IG. Mito-QC illuminates mitophagy and mitochondrial architecture in vivo. Journal of Cell Biology 2016; 214(3): 333–345. [DOI] [PMC free article] [PubMed] [Google Scholar]
- 19.Mandal A, Wong HC, Pinter K, Mosqueda N, Beirl A, Lomash RM, Won S, Kindt KS, Drerup CM. Retrograde mitochondrial transport is essential for organelle distribution and health in zebrafish neurons. Journal of Neuroscience 2021; 41(7): 1371–1392. [DOI] [PMC free article] [PubMed] [Google Scholar]
- 20.Huang N, Li S, Xie Y, Han Q, Xu X, Sheng Z. Reprogramming an energetic AKT-PAK5 axis boosts axon energy supply and facilitates neuron survival and regeneration after injury and ischemia. Current Biology 2021; 31(14): 3098–3114. [DOI] [PMC free article] [PubMed] [Google Scholar]
- 21.Ten V, Galkin A. Mechanism of mitochondrial complex I damage in brain ischemia/reperfusion injury. A hypothesis. Molecular and Cellular Neuroscience 2019; 100: 103408. [DOI] [PMC free article] [PubMed] [Google Scholar]
- 22.Cheng X, Huang N, Sheng Z. Programming axonal mitochondrial maintenance and bioenergetics in neurodegeneration and regeneration. Neuron 2022; 110(12): 1899–1923. [DOI] [PMC free article] [PubMed] [Google Scholar]
- 23.Karamched BR, Bressloff PC. Effects of cell geometry on reversible vesicular transport. Journal of Physics A-Mathematical and Theoretical 2017; 50(5): 055601. [Google Scholar]
- 24.Patel PK, Shirihai O, Huang KC. Optimal dynamics for quality control in spatially distributed mitochondrial networks. PLOS Computational Biology 2013; 9(7): e1003108. [DOI] [PMC free article] [PubMed] [Google Scholar]
- 25.Agrawal A, Koslover EF. Optimizing mitochondrial maintenance in extended neuronal projections. PLOS Computational Biology 2021; 17(6): e1009073. [DOI] [PMC free article] [PubMed] [Google Scholar]
- 26.Gunn RN, Gunn SR, Cunningham VJ. Positron emission tomography compartmental models. J Cereb Blood Flow Metab 2001; 21(6): 635–652. [DOI] [PubMed] [Google Scholar]
- 27.Rizzo G, Veronese M, Tonietto M, Zanotti-Fregonara P, Turkheimer FE, Bertoldo A. Kinetic modeling without accounting for the vascular component impairs the quantification of [(11)C]PBR28 brain PET data. Journal of Cerebral Blood Flow and Metabolism : Official Journal of the International Society of Cerebral Blood Flow and Metabolism 2014; 34(6): 1060–1069. [DOI] [PMC free article] [PubMed] [Google Scholar]
- 28.Kuznetsov IA, Kuznetsov AV. Computation of the mitochondrial age distribution along the axon length. Computer Methods in Biomechanics and Biomedical Engineering 2022; : 10.1080/10255842.2022.2128784. [DOI] [PubMed]
- 29.Kuznetsov IA, Kuznetsov A, V. Effects of axon branching and asymmetry between the branches on transport, mean age, and age density distributions of mitochondria in neurons: A computational study. International Journal for Numerical Methods in Biomedical Engineering 2022; 38(11): e3648. [DOI] [PMC free article] [PubMed] [Google Scholar]
- 30.Safiulina D, Kaasik A. Energetic and dynamic: How mitochondria meet neuronal energy demands. Plos Biology 2013; 11(12): e1001755. [DOI] [PMC free article] [PubMed] [Google Scholar]
- 31.Anderson DH.Compartmental Modeling and Tracer Kinetics. Springer: Berlin, 1983. [Google Scholar]
- 32.Jacquez JA. Compartmental Analysis in Biology and Medicine. University of Michigan Press, Ann Arbor, MI: 1985. [Google Scholar]
- 33.Jacquez JA, Simon CP. Qualitative theory of compartmental-systems. SIAM Review 1993; 35(1): 43–79. [DOI] [PubMed] [Google Scholar]
- 34.Metzler H, Muller M, Sierra CA. Transit-time and age distributions for nonlinear time-dependent compartmental systems. Proceedings of the National Academy of Sciences of the United States of America 2018; 115(6): 1150–1155. [DOI] [PMC free article] [PubMed] [Google Scholar]
- 35.Metzler H, Sierra CA. Linear autonomous compartmental models as continuous-time markov chains: Transit-time and age distributions. Mathematical Geosciences 2018; 50(1): 1–34. [Google Scholar]
- 36.Kuznetsov IA, Kuznetsov AV. Modelling transport and mean age of dense core vesicles in large axonal arbours. Proceedings of the Royal Society A 2019; 475: 20190284. [DOI] [PMC free article] [PubMed] [Google Scholar]
- 37.Kuznetsov IA, Kuznetsov AV. How old are dense-core vesicles residing in en passant boutons: Simulation of the mean age of dense-core vesicles in axonal arbours accounting for resident and transiting vesicle populations. Proceedings of the Royal Society A-Mathematical Physical and Engineering Sciences 2020; 476(2241): 20200454. [DOI] [PMC free article] [PubMed] [Google Scholar]
- 38.Rasmussen M, Hastings A, Smith MJ, Agusto FB, Chen-Charpentier BM, Hoffman FM, Jiang J, Todd-Brown KEO, Wang Y, Wang Y, Luo Y. Transit times and mean ages for nonautonomous and autonomous compartmental systems. Journal of Mathematical Biology 2016; 73(6–7): 1379–1398. [DOI] [PMC free article] [PubMed] [Google Scholar]
- 39.Chappelle G, Hastings A, Rasmussen M. Pool dynamics of time-dependent compartmental systems with application to the terrestrial carbon cycle. Journal of the Royal Society Interface 2023; 20: 20220843. [DOI] [PMC free article] [PubMed] [Google Scholar]
- 40.Donovan EJ, Agrawal A, Liberman N, Kalai JI, Chua NJ, Koslover EF, Barnhart EL. Dendrite architecture determines mitochondrial distribution patterns in vivo. bioRxiv 2022; : 2022.07.01.497972. [DOI] [PubMed] [Google Scholar]
- 41.Mondal S, Dubey J, Awasthi A, Sure GR, Vasudevan A, Koushika SP. Tracking mitochondrial density and positioning along a growing neuronal process in individual C. elegans neuron using a long-term growth and Imaging Microfluidic device. Eneuro 2021; 8(4): 0360–20.2021. [DOI] [PMC free article] [PubMed] [Google Scholar]
- 42.Kuznetsov IA, Kuznetsov AV. Computation of the mitochondrial age distribution along the axon length. Computer Methods in Biomechanics and Biomedical Engineering 2022; doi: 10.1080/10255842.2022.2128784. [DOI] [PubMed] [Google Scholar]
- 43.Errea O, Moreno B, Gonzalez-Franquesa A, Garcia-Roves PM, Villoslada P. The disruption of mitochondrial axonal transport is an early event in neuroinflammation. Journal of Neuroinflammation 2015; 12: 152. [DOI] [PMC free article] [PubMed] [Google Scholar]
- 44.Beck JV, Arnold KJ. Parameter Estimation in Science and Engineering. Wiley: New York, 1977. [Google Scholar]
- 45.Zadeh KS, Montas HJ. A class of exact solutions for biomacromolecule diffusion-reaction in live cells. Journal of Theoretical Biology 2010; 264(3): 914–933. [DOI] [PubMed] [Google Scholar]
- 46.Zi Z Sensitivity analysis approaches applied to systems biology models. Iet Systems Biology 2011; 5(6): 336–346. [DOI] [PubMed] [Google Scholar]
- 47.Kuznetsov IA, Kuznetsov AV. Investigating sensitivity coefficients characterizing the response of a model of tau protein transport in an axon to model parameters. Computer Methods in Biomechanics and Biomedical Engineering 2019; 22(1): 71–83. [DOI] [PubMed] [Google Scholar]
- 48.Kacser H, Burns JA, Fell DA. The control of flux. Biochemical Society Transactions 1995; 23(2): 341–366. [DOI] [PubMed] [Google Scholar]
- 49.Lai X, Brown A, Xue C. A stochastic model that explains axonal organelle pileups induced by a reduction of molecular motors. Journal of the Royal Society Interface 2018; 15(148): 20180430. [DOI] [PMC free article] [PubMed] [Google Scholar]
- 50.Twig G, Elorza A, Molina AJA, Mohamed H, Wikstrom JD, Walzer G, Stiles L, Haigh SE, Katz S, Las G, Alroy J, Wu M, Py BF, Yuan J, Deeney JT, Corkey BE, Shirihai OS. Fission and selective fusion govern mitochondrial segregation and elimination by autophagy. Embo Journal 2008; 27(2): 433–446. [DOI] [PMC free article] [PubMed] [Google Scholar]
- 51.Wang K, Klionsky DJ. Mitochondria removal by autophagy. Autophagy 2011; 7(3): 297–300. [DOI] [PMC free article] [PubMed] [Google Scholar]
- 52.Cardanho-Ramos C, Morais VA. Mitochondrial biogenesis in neurons: How and where. International Journal of Molecular Sciences 2021; 22(23): 13059. [DOI] [PMC free article] [PubMed] [Google Scholar]
- 53.Ashrafi G, Schlehe JS, LaVoie MJ, Schwarz TL. Mitophagy of damaged mitochondria occurs locally in distal neuronal axons and requires PINK1 and parkin. Journal of Cell Biology 2014; 206(5): 655–670. [DOI] [PMC free article] [PubMed] [Google Scholar]
- 54.Ferree AW, Trudeau K, Zik E, Benador IY, Twig G, Gottlieb RA, Shirihai OS. MitoTimer probe reveals the impact of autophagy, fusion, and motility on subcellular distribution of young and old mitochondrial protein and on relative mitochondrial protein age. Autophagy 2013; 9(11): 1887–1896. [DOI] [PMC free article] [PubMed] [Google Scholar]
Associated Data
This section collects any data citations, data availability statements, or supplementary materials included in this article.