

Abstract
Many college students, especially first-generation and underrepresented racial/ethnic minority students, desire courses and careers that emphasize helping people and society. Can instructors of introductory STEM courses promote motivation, performance, and equity in STEM fields by emphasizing the prosocial relevance of course material? We developed, implemented, and evaluated a prosocial utility-value intervention (UVI): a course assignment in which students were asked to reflect on the prosocial value of biology or chemistry course content; our focus was on reducing performance gaps between first-generation and continuing generation college students. In Studies 1a and 1b, we piloted two versions of a prosocial UVI in introductory biology (N = 282) and chemistry classes (N = 1705) to test whether we could encourage students to write about the prosocial value of course content. In Study 2, we tested a version of the UVI that combines personal and prosocial values, relative to a standard UVI, which emphasizes personal values, using a randomized controlled trial in an introductory chemistry course (N = 2,505), and examined effects on performance and motivation in the course. In Study 3, we tested the prosocial UVI against a standard UVI in an introductory biology course (N = 712). Results suggest that the prosocial UVI may be particularly effective in promoting motivation and performance for first-generation college students, especially those who are more confident that they can perform well in the class, reflecting a classic expectancy-value interaction. Mediation analyses suggest that this intervention worked by promoting interest in chemistry.
Keywords: intervention science, STEM pipeline, STEM diversity, expectancy-value theory, prosocial goals
Despite years of research and policy action to broaden participation in science fields, there remains a substantial gap between the needs of the scientific workforce and the number of qualified applicants (National Academies of Sciences, Engineering, and Medicine, 2018; National Science Board, 2019). Even when college students show initial interest in STEM fields (i.e., science, technology, engineering, and math), they drop out or change majors at high rates, especially after gateway or introductory science courses (Koch, 2017; Seymour & Hunter, 2019). Furthermore, the risk of attrition is not equally distributed. For example, first-generation college students (FG; those for whom no parent/guardian has a college degree) are particularly likely to leave science and engineering majors during college, as are students from racial/ethnic groups that are considered to be underrepresented minorities (URM) in STEM by the National Institutes of Health (e.g., Black, Latinx or Hispanic, and Native American individuals; Chang, et al., 2014; National Institutes of Health, 2019; Rosenzweig et al., 2020; Shaw & Barbuti, 2010). Because experiences in gateway courses are especially strong predictors of persistence in STEM (Flanders, 2017; Harris et al., 2020), there is an urgent need to reimagine the introductory science classroom experience in ways that appeal to a larger number of students (Asai et al., 2022; Thorp, 2022). In the studies reported here, we test new curricular interventions designed to make gateway courses more engaging for all students, with the potential to promote more equitable outcomes.
Our approach to intervention is based in expectancy-value theory, advanced by Eccles and Wigfield (2002), who theorized that students’ academic choices are a function of their subjective perceptions of task value and their expectations for success on a task. They emphasized the importance of specific task values – how an individual thinks about and perceives the value of a particular academic task or domain, e.g., a topic covered in class, a lecture, or a field of study. When a student expects to do well and values a task, they should exert more effort, perform better and persist. Expectancies and task values are theorized to positively interact such that students should be most motivated if they both value a task and believe that they can succeed.
Researchers have tested many hypotheses generated from this broad theory, providing a strong base of support for many aspects of the model (Wigfield & Eccles, 2020). Intervention scientists have focused on task values that might be amenable to intervention, with an emphasis on perceptions of utility value or relevance. A large body of research on personal relevance suggests that motivation and performance will be maximized when individuals see course material as useful or personally relevant (e.g., “understanding long and short muscles will help me exercise more efficiently;” Harackiewicz, Tibbetts et al, 2014; Wigfield & Eccles, 2020). Personal relevance is not limited to the self; tasks can be relevant or personally valued for their usefulness for other people (‘understanding photosynthesis is important for helping my mother in her garden”); the critical point is that the individual perceives this relevance connection as personally valuable. In addition, multiple theoretical frameworks, including expectancy-value theory (Eccles et al., 1983), identity-based motivation theory (Oyserman, 2007), and the relevance continuum framework (Priniski et al., 2018), posit that some types of relevance may be more powerful than others, particularly when relevance connections are associated with an individual’s sense of identity. We now consider the importance of a specific type of task value: prosocial utility value, or the perceived usefulness of course content for helping others.
The Power of Prosocial Utility Value
Many students have a strong desire to help other people. Individuals differ in the ways that they construe such prosocial goals; some students want to make the world a better place, others want to give back to their communities and families, and others may simply want to help people in general. Students are motivated to pursue courses and careers that are consistent with their values and goals (Diekman & Steinberg, 2013; Eccles & Wigfield, 2020), and STEM fields are a promising avenue to fulfilling prosocial motives as they have clear implications for public health, the planet, and the human condition. Yet, the STEM classroom experience can be discouraging, in part because introductory courses often emphasize technical and basic knowledge at the expense of real-world applications and larger “why it matters” explanations (e.g., Cech, 2014; Harper et al., 2019).
Personal relevance can be prosocial for many individuals. Helping students to see how STEM course topics are relevant to their prosocial goals (e.g., a task can be perceived as valuable because it can help a student achieve their goal of helping their parents, or for saving the planet) can make coursework more engaging, and stimulate motivation and performance. Moreover, if students make connections between course material and personal goals that are an important part of their identities, those utility-value connections could help students to see the material not just as personally valuable but as something they identify with, making the connections even more personally meaningful (e.g., “understanding diabetes is important for helping my parents, and important to my identity as a good son”; “understanding climate change is important for saving the planet, and I want to have a career in wildlife conservation”). This is significant because relevance connections that extend from personal usefulness into identification are more powerful, leading to higher levels of motivation, interest, and performance in that domain (Priniski et al., 2018).
Prosocial task value can be broad (e.g., a topic might be useful for helping society or people in general) or specific (e.g., course content might be useful for helping friends, family, or one’s community); the key is that the individual focuses on the value of course topics for helping others. Prosocial task value (a situational variable) is of course related to communal values (properties of the person), which are personally held values that include value for helping others, but also include valuing working with and forming bonds with others at a broader and more general level (Brown et al., 2015; Gray et al., 2022). Prosocial task value may also be related to other personal value systems, such as interdependence, which involves interdependent motives or ways of being (focusing on others and adjusting to the requirements of relationships; Stephens, Markus & Phillips, 2014). For example, individuals who endorse communal values or interdependent motives at a general level may be more likely to perceive some tasks as having prosocial utility value in a particular situation. In short, task values are more specific and situational than personal values and motives that transcend contexts, and prosocial task value is more narrowly defined around the utility of a task for helping others, whereas prosocial personal values may be embedded in systems of communal goals and interdependent motives that involve a wider range of values, navigation of interpersonal relationships, and ways of being.
Although all students, on average, may benefit from seeing the prosocial utility of what they are learning (Brown et al., 2015; Yeager et al., 2014), prosocial utility value may be more personally meaningful and more motivationally powerful for FG students and URM students, whose personal goals may include communal values and interdependent motives. These personal goals are likely to be deeply held, culturally based, and highly identity-relevant, and may lead students to appreciate the prosocial utility value of their science courses (Allen et al, 2015; Canning et al., 2014; Gibbs & Griffin, 2013; Harackiewicz, Smith, et al., 2014; Smith et al., 2014; Thoman et al., 2015). Specifically, FG students are likely to come from working class cultures that are characterized by “hard interdependence,” which includes an emphasis on supporting family and community to overcome shared difficulties (Stephens et al., 2014). For URM students, personal prosocial values may arise in reaction to discrimination and historical marginalization (Gray et al., 2022), which can lead individuals to place a greater value on equity, social justice, and helping others through their work (McGee & Bentley, 2017).1 For these students, prosocial task value might be particularly likely to develop into a deeper identity-based sense of task value, as suggested by the relevance continuum (Priniski et al., 2018).
Given that all students, and especially marginalized and underrepresented students are likely to desire courses and careers that emphasize prosocial values (Belanger et al., 2017; Thoman et al., 2015), it is critical that introductory science courses emphasize prosocial applications and that instructors help students find connections between content and their personally (and culturally) held prosocial goals. By intervening to highlight the prosocial value of topics in STEM courses, instructors could broaden participation in STEM for everyone, and especially appeal to FG and URM students. In the current project, we test interventions to promote perceptions of prosocial utility value in introductory science classes.
Interventions to Promote Perceived Prosocial Value in STEM
If science instructors can help students, and in particular FG and URM students, see course content as connected to their prosocial goals, they may become more motivated and perform better in gateway courses, develop a greater interest in STEM, and be more likely to pursue STEM majors and careers (Harackiewicz, Smith, et al., 2016). Harackiewicz and Priniski (2018) reviewed interventions developed to improve educational outcomes in higher education and identified three types of intervention: (a) task value interventions, which focus on how students think about what they are learning, (b) framing interventions, which target how students think about academic challenges and career choices, and (c) values affirmation interventions, which address how students think about themselves. These interventions are all student-centered and share some core features: all convey some information hypothesized to affect psychological processes and engage students in active reflection that often involves writing. Within each type of intervention, however, there are critical differences in their domain specificity and the academic outcomes they target. Some interventions target course-specific outcomes such as performance or interest in the topic, others target field-specific outcomes such as attitudes about STEM careers or STEM persistence, and others target college-general outcomes such as overall GPA or social belonging.
Although values affirmation and framing interventions have been used to help FG and URM students perform better in their college classes (Aronson et al., 2002; Brady et al., 2016; Covarrubias et al., 2018, Harackiewicz et al., 2014; Stephens et al., 2015), task value interventions may be particularly well suited for changing the way that students think about what they are learning in their courses or how they think about STEM fields and careers. In other words, this approach could be used for promoting perceptions of prosocial task value in STEM. For example, research using a task value approach at the field-specific level suggests that students’ perceptions of the prosocial value of STEM are malleable and linked to motivation and performance (Diekman et al., 2019). In laboratory studies, describing STEM careers as prosocial increased students’ interest and motivation to pursue science (Brown et al., 2015; Diekman et al., 2011). In a series of correlational, experimental, and longitudinal studies, Yeager and colleagues (2014) found that having students write testimonials about their self-transcendent purpose goals for learning (which were often prosocially focused) resulted in more effective self-regulation and higher STEM grades, especially among students with low prior performance.
In contrast, recent research using a task value approach at the course-specific level—the approach taken in the current research—has tested curricular interventions that provide students with opportunities to generate personal and/or prosocial connections between what they are learning and their own lives, using utility-value interventions (UVI). Grounded in expectancy-value theory (Eccles et al., 1983; Eccles & Wigfield, 2020), the UVI involves writing assignments, integrated into the curriculum as homework, designed to help students explore the personal usefulness (i.e., utility value) of course material (e.g., Gaspard et al., 2021; Harackiewicz, Canning, et al. 2016; Hulleman & Harackiewicz, 2009; Hulleman et al., 2010, 2017; Rosenzweig et al., 2020; Wang et al., 2021). Unlike other psychological interventions that target students’ general beliefs about learning or careers in a field, or STEM fields in general, a UVI focuses on a specific topic in a class, and it always emphasizes the usefulness of academic content, and how science topics are perceived. This is particularly relevant for stimulating engagement in course content and for promoting interest in a particular academic field, which is an important predictor of persistence in that field (Harackiewicz et al., 2008; Harackiewicz, Smith, et al., 2016).
In utility-value writing assignments, students summarize course material and discuss how it is personally relevant and useful in their own lives or the lives of close others (UVI condition), and these assignments are typically compared to a control condition in which students simply summarize course material (Hulleman & Harackiewicz, 2020). Although this intervention is not designed to target prosocial value specifically, the open-ended nature of the assignment (to connect the material to students’ own lives and the lives of close others) provides flexibility so that students can write about prosocial value if they so wish. Indeed, the assignments are specifically designed to give students autonomy to make connections to whatever is important to them, and thus students for whom prosocial goals are personally important may be particularly likely to write about the prosocial value of what they are learning.
Harackiewicz, Canning, and colleagues (2016) tested a UVI in an undergraduate introductory biology course and examined intervention effects on course performance as a function of race and generational status. The UVI was effective for all students, on average, and it was particularly effective for first-generation, underrepresented minority (FG-URM) students, increasing their grades in the biology course by about half a grade point (Harackiewicz, Canning et al., 2016). Baseline analyses suggested that FG-URM students were especially motivated by a desire to use their education to help their families and communities (cf., Jackson et al., 2016). Linguistic analyses of students’ essays revealed that all students, on average, and FG-URM students in particular, wrote longer essays in the UVI condition than their counterparts in the control condition (an indicator of increased engagement with the assignments), and their essays were more likely to contain family and social themes. In other words, FG-URM students had the highest levels of prosocial motivation, became more engaged with the writing assignment, and ultimately benefited the most from the intervention.
Here, we test whether we can encourage all students to write about prosocial utility value with a new version of the UVI. Reflecting on ways in which course topics are relevant to prosocial goals might help students develop stronger, more meaningful connections with course topics, and perhaps even perceive STEM fields as having more prosocial potential. Indeed, simply including this type of assignment in the curriculum might convey that an instructor values prosocial applications. Because the UVI is a course assignment, it represents a type of intervention that has the potential to influence students’ perceptions of their instructors, and the field more generally (Benson-Greenwald et al., 2021). But should this new UVI emphasize prosocial value to the exclusion of personal value? It may be that emphasizing prosocial value instead of personal value in the UVI would be a powerful way to convey that STEM fields can be prosocial. On the other hand, this approach might undercut the efficacy of the “standard” UVI, if the power of the standard UVI is due to its focus on personal connections (Hecht, Priniski, et al., 2019; Hidi et al., 2019). For instance, a linguistic measure of personal relevance in the essays students wrote mediated the effects of the intervention tested by Harackiewicz, Canning et al. (2016) on long-term persistence in the biomedical sciences, highlighting the importance of personal connections for motivation and academic choices (Hecht, Harackiewicz, et al., 2019).
Given that our goal in developing a new, more prosocial UVI is to help students find personally meaningful prosocial connections, emphasizing both types of value may be critically important. A focus on both personal and prosocial values might have stronger effects than emphasizing either one alone. However, this may make the essay assignment more complex or more challenging. It is therefore important to explore both ways of promoting prosocial value with a UVI, and to compare them to the standard UVI tested in previous research.
Project Overview
In three studies, we test different versions of a prosocial utility-value intervention and examine students’ writing and experiences in gateway college science classes. We first compare students’ writing in response to two different ways to promote prosocial utility value with a UVI (either an exclusive emphasis on prosocial value or an emphasis on prosocial value in combination with personal value; Studies 1a and 1b). We next present the first randomized test of the prosocial and standard UVI in introductory chemistry (Studies 2a and 2b), examine motivation and course performance outcomes with a diverse group of students, and begin to map the linguistic and psychological mechanisms through which the UVIs work. We then test the impact of the prosocial UVI in an introductory biology course at the same university (Study 3), which allowed for a second test of the prosocial UVI in a different gateway science course. Deidentified data and analysis scripts for Studies 1 and 2 are available at https://osf.io/kmnrw.
Studies 1a and 1b: Designing a Prosocial Utility-Value Intervention
The goal of Studies 1a and 1b was to develop a prosocial version of the standard UVI tested in previous research (Harackiewicz, Canning et al., 2016). Specifically, we aimed to test how different versions of a prosocial UVI affected students’ ability to make high-quality connections about the prosocial usefulness of course material. We designed a Prosocial-Only UVI assignment that focused exclusively on prosocial task value and a Prosocial-Combined UVI assignment that focused on both personal and prosocial task values. In Study 1a, we tested these new assignments alongside the Standard UVI assignment and a Control assignment in which students summarized course material (but did not write about utility value) in an introductory biology course. This design allowed us to examine the essays that students wrote in response to each assignment and explore the quality of the writing content, all relative to a control assignment. In Study 1b, we tested for replication of linguistic results from Study 1a with these same four assignments, adapted for an introductory chemistry class.
These new writing prompts were designed to promote reflection on prosocial value while providing choice with respect to the type of prosocial value to write about. Another key to designing an effective prosocial UVI assignment was to retain as many of the beneficial features of the standard UVI assignment as possible. Previous work suggests that the intervention is more effective if administered three times over the course of the semester (Canning et al., 2018). In addition, the intervention is more effective when students are given a combination of different types of writing tasks (e.g., essays and letters), and provided with a choice regarding the assignment format (Priniski et al., 2019; Rosenzweig et al., 2018). Therefore, we administered the UVIs in three different formats over the course of the semester, with the first being an essay, the second a letter, and the third a choice between an essay and a letter.
Study 1a Method
This study was conducted in an introductory biology course at a large Hispanic-Serving university in southern California in 2018. The course introduces general principles in organismal biology and serves as a key prerequisite to upper division courses in biological science. The study was designed to test the feasibility of incorporating different versions of the UVI writing assignment into the curriculum, and to inform the development of prosocial UVIs, and it was not preregistered. We examined the content of students’ essays to analyze students’ writing in response to the four types of UVI assignment (i.e., the four experimental conditions). We did not, however, test for intervention effects on grades in this study because of concerns about statistical power for tests of interaction terms across four conditions with a small sample, given our predictions that intervention effects should be moderated by student background variables. Tests for effects on grades are tenable with larger samples in Studies 2a, 2b and 3.
Participants
In total, 282 students were enrolled in the course, of whom 231 students consented and completed the course and at least one of the writing assignments (82%). Of the 231 students in our sample, 65 were FG students (28%) and 166 were continuing-generation (CG; at least one parent earned a 4-year-college degree) students (72%). There were 75 URM students (32%; 45 Hispanic or Latinx, 23 Black, 9 American Indian, 1 Pacific Islander), and 156 majority students (105 White and 51 Asian or Asian American). In total, 170 identified as women (74%) and 61 identified as men (26%). The average age was 19.8 years (SD = 1.94).
Procedure
Students were randomly assigned to one of four conditions: a control condition or one of three UVI conditions (“standard,” “prosocial-only,” or “prosocial-combined”). In each condition, students completed three writing assignments (500–600 words) for course credit throughout the semester. Students in the control condition were asked to summarize course material (as in Harackiewicz, Canning et al., 2016), whereas in the three UVI conditions, students were asked to summarize course material and describe its usefulness to themselves and/or to helping others.
For each assignment, students were provided with a condition-specific prompt, delivered via online course software. Students were asked to formulate and answer a question, and examples of scientific questions were provided (e.g., “How do scientists form a hypothesis?”). In the control condition, students were asked to provide references for the scientific content of their essays. In the three UVI conditions, students were asked to explain how the scientific content of their essays could be applied, either to (1) their own life (standard UVI), (2) helping others (prosocial-only UVI), or (3) their own life and to helping others (prosocial-combined UVI).
In each UVI condition, the assignment instructions provided three short examples of potential applications; examples were associated with a common stem (e.g., “Medical researchers use systems biology to study how genes and proteins interact to cause diseases”). In the standard condition, there were three personal examples (e.g., “In your own life, you will have access to more effective treatments for any serious illnesses you develop, thanks to these advances”); in the prosocial-only condition, there were three prosocial connections to society, community and family (e.g., “In our society, these advances help doctors fight public health threats”); in the prosocial-combined condition, there were three pairs of personal and prosocial connections combined (“In your own life, you will have access to more effective treatments for any serious illnesses you develop, thanks to these advances. In our society, these advances help doctors fight public health threats”). Sample questions and examples were developed in conjunction with the course instructor. See Appendix A for instructions and examples; see Supplement for assignment templates.
Measures
Research assistants read and coded each essay (with condition masked), indicating whether it included relevance for: (a) the author or letter recipient (personal relevance), (b) family members, (c) community, or (d) society, and finally, whether each essay included discussion of (e) prosocial value (i.e., the value of material for helping others). Interrater reliability with this coding rubric ranged from 81% (connections to community) to 94% (connections to family) between the five categories. Disagreements were resolved through discussion.
We then used Linguistic Inquiry and Word Count software (LIWC) to explore students’ writing style and the content of their essays (Pennebaker et al., 2015). LIWC calculates the proportion of words in each essay that falls into psychologically meaningful categories (e.g., family-related words), as well as some general writing style measures. We examined three measures of linguistic style: word count (which is indicative of engagement), analytical thinking, and personal focus. For analytic thinking, lower scores indicate informal, narrative writing and higher scores indicate more formal, abstract writing (Pennebaker et al., 2015). The personal focus measure indicates the extent to which students were writing about themselves and others using first-person singular and second-person pronouns (e.g., I, my, your; Hecht, Harackiewicz, et al., 2019). We also examined three measures of writing content: we used the LIWC dictionary, family words, a dictionary developed by Frimer and colleagues (2014) that counts prosocial words (e.g., help, assist, support) and a dictionary developed by Pietraszkiewicz et al. (2018) measuring communion (e.g., care, generous, shared).
Study 1a Results
Table 1 presents descriptive statistics and correlations for all variables for both Study 1a and Study 1b.
Table 1.
Descriptive statistics and correlations of writing variables for Study 1a and Study 1b
| 1 | 2 | 3 | 4 | 5 | 6 | 7 | 8 | 9 | 10 | 11 | |
|---|---|---|---|---|---|---|---|---|---|---|---|
| 1. Word count | |||||||||||
| 2. Analytic scores | 0.03 | ||||||||||
| 0.05 | |||||||||||
| 3. Personal focus | 0.06 | −0.59 | |||||||||
| 0.04 | −0.60 | ||||||||||
| 4. Family words | 0.13 | −0.25 | 0.35 | ||||||||
| 0.00 | −0.24 | 0.40 | |||||||||
| 5. Prosocial words | 0.12 | −0.10 | 0.10 | 0.10 | |||||||
| 0.03 | −0.13 | 0.12 | 0.09 | ||||||||
| 6. Communion words | 0.10 | −0.29 | 0.26 | 0.15 | 0.67 | ||||||
| 0.02 | −0.30 | 0.30 | 0.17 | 0.66 | |||||||
| 7. Personal connections | 0.13 | −0.37 | 0.56 | 0.30 | 0.12 | 0.29 | |||||
| 0.06 | −0.33 | 0.59 | 0.33 | 0.18 | 0.24 | ||||||
| 8. Family connections | 0.16 | −0.40 | 0.49 | 0.49 | 0.03 | 0.12 | 0.45 | ||||
| 0.07 | −0.28 | 0.50 | 0.63 | 0.10 | 0.21 | 0.43 | |||||
| 9. Community connections | 0.00 | −0.15 | 0.10 | 0.16 | 0.29 | 0.31 | 0.17 | 0.17 | |||
| 0.06 | −0.12 | 0.18 | 0.19 | 0.18 | 0.21 | 0.26 | 0.18 | ||||
| 10. Society connections | 0.17 | −0.16 | 0.17 | 0.12 | 0.42 | 0.36 | 0.29 | 0.26 | 0.30 | ||
| 0.06 | −0.14 | 0.16 | 0.13 | 0.45 | 0.28 | 0.26 | 0.18 | 0.21 | |||
| 11. Prosocial connections | 0.13 | −0.33 | 0.38 | 0.16 | 0.35 | 0.36 | 0.38 | 0.27 | 0.28 | 0.79 | |
| 0.05 | −0.18 | 0.25 | 0.19 | 0.42 | 0.31 | 0.36 | 0.25 | 0.27 | 0.70 | ||
| Study 1a Mean | 571.14 | 84.10 | 1.24 | 0.21 | 2.46 | 1.04 | 0.57 | 0.19 | 0.13 | 0.60 | 1.36 |
| Study 1a SD | 51.30 | 8.26 | 1.15 | 0.23 | 0.94 | 0.46 | 0.69 | 0.30 | 0.25 | 0.38 | 0.69 |
| Study 1b Mean | 557.53 | 85.90 | 1.43 | 0.10 | 1.32 | 0.88 | 0.61 | 0.17 | 0.08 | 0.32 | 0.28 |
| Study 1b SD | 45.23 | 8.58 | 1.31 | 0.13 | 0.60 | 0.46 | 0.68 | 0.25 | 0.18 | 0.34 | 0.32 |
Note. For each variable in the correlation matrix, there are two rows. The top row shows the Study 1a correlation, and the bottom row shows the Study 1b correlation. For Study 1a, all correlations |r| > .14 are significant at p < .05. For Study 1b, all correlations |r| > .05 are significant at p < .05.
Qualitative Coding
To analyze the types of connections students made in their essays, we used two-level logistic regressions (with assignments nested within students) to test whether the number of personal, family, community, society, and prosocial connections differed by condition. Specifically, for each type of connection we fit three models regressing whether that connection was present (1) or absent (0) for each essay on dummy-coded contrasts, such that we could test every pairwise comparison of conditions (i.e., first with “control” as the reference group, then with “standard UVI” as the reference group), including a random intercept for students. Because every student in the sample completed at least one essay there was no missing data for this analysis. All results discussed below were statistically significant; see Table 2 for full results.
Table 2.
Qualitative Essay Coding: Proportion of Students Making Each Type of Connection
| Control | Standard | Prosocial-Only | Prosocial-Combined | |
|---|---|---|---|---|
| Personal Connections | ||||
| Study 1a | .02 | .67a | .24 | .75a |
| Study 1b | .02 | .63a | .24 | .67a |
| Study 3 | - | .80a | - | .81a |
| Connections to family | ||||
| Study 1a | .01 | .30a | .14 | .35a |
| Study 1b | .00 | .28a | .18 | .27a |
| Study 3 | - | .43 | - | .51 |
| Connections to Community | ||||
| Study 1a | .03c | .07ac | .15ab | .28b |
| Study 1b | .01 | .06 | .13a | .15a |
| Study 3 | - | .08 | - | .21 |
| Connections to Society | ||||
| Study 1a | .27 | .64a | .75ab | .79b |
| Study 1b | .11 | .19 | .56a | .54a |
| Study 3 | - | .07 | - | .49 |
| Prosocial Connection | ||||
| Study 1a | .40 | .81a | .92ab | .96b |
| Study 1b | .08 | .20 | .42a | .49a |
| Study 3 | - | .11 | - | .45 |
Note. Proportions within studies 1a (biology), 1b (chemistry), or 3 (biology) that share a superscript do not differ significantly from one another; all other differences are significant at the p < .05 level.
Qualitative analyses indicate that the UVIs were successful in promoting different types of relevance in students’ writing. Importantly, prosocial-combined essays were as personal as standard essays and as prosocial as prosocial-only essays, demonstrating that students were able to articulate both types of utility-value connections in a single assignment without a reduction in the number of connections. In fact, there were more of almost every type of relevance connection in the prosocial-combined assignments than in the standard or prosocial-only assignments. Students made personal and family connections most often in the prosocial-combined and standard conditions (relative to the control and prosocial-only conditions), whereas they made more community, society and prosocial connections in the prosocial-combined and prosocial-only conditions (relative to the control and standard conditions).
Linguistic Analysis
We used multiple regression to analyze condition effects on three measures of writing style (word count, analytic writing and personal focus), and three measures of content (family, prosocial, and communion words). Orthogonal contrasts were used for three comparisons: (1) UVI (standard, prosocial-only, and prosocial-combined) compared to the control group, (2) Any Prosocial vs. Standard UVI and (3) Prosocial-Combined vs. Prosocial-Only UVI. We also included FG status, URM status, and gender as covariates. In all analyses for this paper, we handled missing data with FIML using the lavaan package in R (Rosseel, 2012). Table 3 presents an abbreviated summary of condition effects for linguistic analysis; full results are presented in Supplement.
Table 3.
Linguistic Analysis of Essays: Study 1a (N = 231), Study 1b (N = 1715), and Study 3 (N = 712)
| UVI vs. Control | Prosocial-Combined/Prosocial-Only vs. Standard | Prosocial-Combined vs. Prosocial-Only | |||||||
|---|---|---|---|---|---|---|---|---|---|
| β | z | p | β | z | p | β | z | p | |
| Word count | |||||||||
| Study 1a | .13 | 2.01 | .044 | .02 | 0.33 | .740 | −.04 | −0.55 | .583 |
| Study 1b | .07 | 2.83 | .005 | .02 | 0.80 | .426 | .06 | 2.27 | .023 |
| Study 3 | .07 | 1.93 | .054 | ||||||
| Analytic scores | |||||||||
| Study 1a | −.40 | −6.56 | .000 | .01 | 0.21 | .830 | −.06 | −1.06 | .289 |
| Study 1b | −.38 | −16.76 | .000 | .05 | 1.97 | .049 | −.11 | −4.74 | .000 |
| Study 3 | −.10 | −2.63 | .009 | ||||||
| Linguistic Content | |||||||||
| Personal focus | |||||||||
| Study 1a | .57 | 11.79 | .000 | −.28 | −5.91 | .000 | .25 | 5.14 | .000 |
| Study 1b | .59 | 32.67 | .000 | −.19 | −10.06 | .000 | .22 | 11.44 | .000 |
| Study 3 | −.06 | −1.66 | .097 | ||||||
| Family words | |||||||||
| Study 1a | .31 | 4.94 | .000 | .02 | 0.31 | .757 | .08 | 1.28 | .201 |
| Study 1b | .40 | 17.35 | .000 | −.01 | −0.33 | .742 | .00 | 0.17 | .862 |
| Study 3 | −.02 | −0.48 | .634 | ||||||
| Prosocial words | |||||||||
| Study 1a | .29 | 4.65 | .000 | .19 | 3.04 | .002 | .01 | 0.16 | .873 |
| Study 1b | .24 | 10.32 | .000 | .25 | 10.60 | .000 | .04 | 1.47 | .141 |
| Study 3 | .38 | 10.84 | .000 | ||||||
| Communion words | |||||||||
| Study 1a | .35 | 5.79 | .000 | .16 | 2.66 | .008 | .12 | 2.01 | .045 |
| Study 1b | .29 | 12.25 | .000 | .13 | 5.44 | .000 | .08 | 3.33 | .001 |
| Study 3 | .27 | 7.49 | .000 | ||||||
Note. All models control for gender, and the models for Study 1a and Study 3 also control for FG status and URM status. The UVI vs. Control contrast compares the three UVI conditions (each coded + .25) to the control condition (−.75); the Prosocial-Combined/Prosocial-Only vs. Standard contrast compares the Prosocial Combined and Prosocial-Only conditions (each coded +.33) to the Standard UVI condition (−.67); the Prosocial-Combined vs. Prosocial Only contrast compares the prosocial combined UVI (.5) to the prosocial-only UVI (−.5).
With respect to linguistic style, results of the linguistic analysis showed that students in UVI conditions wrote longer essays, β = .13, p = .044, and had lower analytic scores, β = −.38, p < .001, compared to control, suggesting that UVI writing was more narrative and informal. Results with the personal focus measure revealed several significant effects. Students in UVI conditions wrote more personally-focused essays compared to those in the control condition, β = .57, p < .001, and students in the prosocial-combined and prosocial-only conditions wrote less personally-focused essays, compared to those in the standard condition, β = −.28, p < .001. Finally, students in the prosocial-combined condition wrote more personally-focused essays than those in the prosocial-only condition, β = .25, p < .001. In sum, the assignments that required personal connections (standard and prosocial-combined assignments) elicited more personally-focused writing than those that did not (control and prosocial-only assignments).
With respect to linguistic content, students in UVI conditions used significantly more family, prosocial, and communion words compared to the those in the control condition, ps < .001. Students in the prosocial-combined and prosocial-only conditions used more prosocial words than those in the standard condition, β = .19, p = .002, and more communion words, β = .16, p = .008. There was no significant difference in prosocial word usage between the prosocial-combined and prosocial-only conditions, β = .01, p = .873; however, students in the prosocial combined condition used more communion words compared to students in the prosocial-only condition, β = .12, p = .045.
Study 1a Discussion
Results suggest that the prosocial-combined prompt encouraged students to make strong prosocial value connections in their writing without sacrificing personal value connections. The writing produced in response to the prosocial-combined prompt was significantly more personal than that produced in response to the prosocial-only prompt, and just as prosocial. Thus, the prosocial-combined prompt seemed to best balance the two goals of encouraging prosocial value connections, while retaining the personal writing encouraged by the standard prompt.
The linguistic analyses provided insight into how the UVI assignments changed the way students wrote; utility-value essays and letters, whether personal (standard UVI) or prosocial (prosocial-combined and prosocial-only UVIs), were less formal and more personal than in control condition. Standard and both types of prosocial UVI assignments were similar in style, relative to control, but differed in word usage; prosocial assignments contained more words about helping others. Thus, the genre of the assignment—summary of course material (control) vs. summary plus discussion of value (UVI)—can drive changes in writing style, and changes in the UVI writing prompt can lead to differential word usage and themes within that genre.
An important limitation of these findings, however, is that our analysis was conducted in biology classes, where it may be relatively easy to find examples of personal and prosocial utility value. It is important to examine whether UVIs can help students make strong, personally meaningful value connections in other courses.
Study 1b: Testing the Prosocial UVI on Writing in Introductory Chemistry
The topics covered in introductory chemistry are often more abstract than topics in introductory biology, and it may be more challenging for students to make strong personal and prosocial connections with chemistry topics. In addition, because students often take introductory chemistry in their first year of college, writing assignments may be more challenging for students who are not yet comfortable writing college-level essays. Students may need more support or guidance in how to write essays in science courses, especially if those essays differ from more traditional science assignments (Huerta & Garza, 2019). Thus, we tested how the four types of UVI assignments affected writing in Chemistry, to determine whether the results of Study 1a would replicate in this new context—an introductory chemistry course at a large flagship university in the Midwest. These replication analyses were conducted in the context of a large-scale intervention study (described in Studies 2a and 2b).
Study 1b Method and Results
In total, 2,941 students were enrolled in the introductory chemistry course, of whom 2,765 students were over 18 years of age and consented (94%). Of those, 2,679 (2,169 in Fall semester of 2018, 510 in Spring semester of 2019) completed the course and a subset of Fall students comprise the sample for this replication analysis. As will be discussed in greater detail below (Studies 2a and 2b), assignment to condition was constrained by the number of FG and URM students in the class. Of the 2,679 students, only 487 were FG students (18%) and there were only 256 URM students (10%). Thus, there were too few FG and URM students in this course to test three different UVIs against control in a four-cell design with sufficient power. However, there were enough CG-Majority students in the fall semester to test replication of linguistic effects with a four-cell analytic design (N = 1715), including CG-majority students from the intervention study (Study 2a), with the addition of a reserve group of 174 CG-majority students assigned to a Prosocial-Only condition for purposes of these replication analyses. The methods and measures were identical to those in Study 1a, except that the writing assignments were customized for chemistry topics. Research assistants coded each of the approximately 8,000 essays, using the same coding scheme as in Study 1a (interrater agreement ranged from 84–96%). We also analyzed essays using the same six LIWC measures of linguistic style and content.
As in Study 1a, students were randomly assigned to one of four conditions: a control condition or one of three UVI conditions (standard, prosocial-only, or prosocial-combined). We used this four-cell design to test whether differences in the coded and LIWC measures found in Study 1a were replicated in the present study (see Tables 2 and 3). We used the same regression model with orthogonal contrasts for condition as in Study 1a, except that we only covaried gender (because students were all CG-Majority in this study).
The results largely replicated the differences found between conditions in Study 1a. Personal and family connections were significantly higher in the prosocial-combined and standard conditions, relative to the prosocial-only condition, whereas community, society, and prosocial connections were higher in the two prosocial conditions, relative to the standard condition. These findings indicate that, as in Study 1a, the prosocial-combined writing prompt evoked writing that was as personal as the standard prompt and as prosocial as the prosocial-only prompt. As in Study 1a, we found significant effects of the UVI contrast on all six linguistic variables, and all significant condition effects from Study 1a were replicated in Study 1b (see Table 3).2 These results suggest that the prosocial-combined UVI balances the two goals of encouraging prosocial value connections, while retaining the personal writing encouraged by the standard UVI prompt. Although the results of Study 1b replicated Study 1a, it is important to note that they were based on a CG-Majority sample, due to statistical power issues. However, we also examined the effects of different UVIs on writing for FG and URM students to the extent possible in smaller analytic designs in Studies 2a and 2b.2
Study 2: Testing the Effects of Utility-Value Interventions on Performance and Motivation in Introductory Chemistry
At many universities, introductory biology courses are taken in the second year, whereas introductory chemistry courses often serve as the first gateway science course that students take in college. If courses are taken in this sequence, interventions in biology courses, such as that tested by Harackiewicz et al. (2016), may come too late to prevent some attrition from STEM, given that attrition tends to be highest during first-year gateway courses (Gasiewski et al., 2012; Stout et al., 2011). Thus, it may be especially important to help students find value in first-year introductory chemistry, with the goal of promoting motivation and performance for underrepresented students in particular (Morra, 2018; Wang et al., 2021). If UVIs prove to be effective in introductory chemistry, we may be able to help students who might otherwise leave STEM before ever enrolling in introductory biology classes.
In Study 2, we tested the novel prosocial-combined UVI in a large introductory chemistry course, comparing it to the standard UVI and a control group in this new context. Specifically, we sought to answer the following questions: What are the effects of the prosocial-combined and standard UVIs on course performance and motivational outcomes? Are they stronger for FG and URM students? As noted in Study 1b, this course was taken by nearly 3,000 students, and this large sample size allowed us to examine the effects of both UVIs on academic outcomes for FG students in this new context, but the sample size was not large enough to test both versions of the UVI for URM students. We also developed a new measure of prosocial chemistry motivation to test whether the effects of the novel prosocial-combined intervention were stronger for students higher in prosocial motivation.
Prior research with UVIs and purpose interventions has found that such interventions are particularly effective for students who struggle in classes (e.g., Hulleman & Harackiewicz, 2009, Hulleman et al., 2017; Yeager et al 2014). In previous tests of UVIs in college courses, researchers have tested measures such as prior GPA or early exam scores in the course (Hulleman et al., 2010) as moderators of intervention effects, arguing that such measures help identify students most at risk for poor performance in the class (Hulleman et al., 2017), and others have tested moderation by both prior GPA and confidence (or expectations for success in the course; Harackiewicz, Canning, et al., 2016; Canning et al., 2018; Rosenzweig et al., 2020). We initially planned to test both moderators, but because introductory chemistry is typically taken by first-semester college students, over 90% of participants in this study had no record of prior performance in college (and there were no exams or other performance measures in the course prior to the first UVI assignment). Moreover, there were high levels of missing data on other prior performance variables (e.g., ACT scores). Thus, we deviated from our plan to test both confidence and prior performance as moderators, testing only confidence as a moderator in this first-year chemistry class (Eccles & Wigfield, 2020).
Of course, confidence should be related to prior performance (Bandura, 1982), but in recent studies that included measures of both prior GPA and performance expectations in a course, the correlations have been relatively low (e.g., r =.13 in Harackiewicz, Canning, et al., 2016). Indeed, researchers have more recently argued that confidence is a more forward-looking variable that might affect how students reflect on the utility value of course material in the near and distant future, as opposed to measures of prior performance that indicate a risk for poor performance in a course (see Hecht, Harackiewicz, et al., 2019). That is, confidence is more closely aligned with expectancies for success in an expectancy-value formulation (Eccles & Wigfield, 2020), whereas prior performance is aligned with students’ history of achievement and preparation for a course.3
To recap, we tested the following hypotheses in Study 2, all pre-registered:
The standard and prosocial-combined UVI would improve students’ chemistry performance, relative to control.
Both UVIs would be particularly effective for FG and URM students in promoting motivation (i.e., engagement, interest, and future STEM plans) and performance. In addition, the new, prosocial-combined utility value intervention may be particularly powerful for FG and URM students, and for students who are higher in prosocial motives.
The effects of both UVIs may differ as a function of confidence. We predicted that less confident students (i.e., struggling students) would benefit the most, to the extent that confidence is an indicator of prior performance. However, if confidence is primarily forward-looking, we might expect more confident students to benefit most (consistent with expectancy-value theory and previous findings; Hecht, Harackiewicz, et al. 2019).
Study 2 Method
We conducted a large-scale randomized intervention trial across two semesters of an introductory chemistry course at a large, flagship state university (Fall 2018 and Spring 2019), preregistered on AsPredicted (see https://aspredicted.org/N7M_HSH, https://aspredicted.org/5LL_2D3, https://aspredicted.org/HX8_12S).4 This chemistry course is required for students on pre-health tracks (e.g., pre-med, pre-dental, pre-pharmacy), as well as students who are studying engineering, agricultural and life sciences, and environmental sciences. Students typically take this course in the fall of their first year of college as a prerequisite to more advanced science courses, though the course is also offered in the Spring semester (in which enrollment is nearly 75% lower). Students in this study were in one of eight lecture sections of the course (six in the Fall semester, two in Spring); taught by one of five instructors. All students were also enrolled in one of 140 lab sections (109 in Fall, 31 in Spring). Course grades were determined by a combination of exams, lab grade, quizzes, online activities, and the writing assignments (worth 1.5% of the total grade).
Participants
As noted in Study 1b, 2,941 students were enrolled in the course, of whom 2,765 students were over 18 years of age and consented (94%). Of those, 2,679 completed the course and 2,505 were assigned to the control, standard utility value, or prosocial-combined utility value condition and comprise the sample for the current study (1995 in Fall, 510 in Spring).5 Although the Fall and Spring sections of the course differed in terms of students’ characteristics (with proportionally more FG and URM students in Spring), the content and structure of the course was the same, and we combined all sections of the course for analytic purposes. Of the 2,505 students, 487 were FG students (19%) and 2,018 were CG students (81%). There were 256 URM students (10%; 168 Hispanic or Latinx, 80 Black, 15 American Indian or Alaska Native, and 10 Pacific Islander) and 2,249 racial/ethnic majority students (90%; 1,974 White, 343 Asian or Asian American). Regarding gender, 1,402 identified as women (56%), 1,100 as men (44%), and three as non-binary (< 1%).6 The average age was 18.8 years (SD = 0.9).
Procedure
Students completed questionnaires in the first and final weeks of the semester via Qualtrics and three UVI or control writing assignments (500–600 words each) over the course of the semester. All assignments were completed for course credit, but students were only included in the research study if they consented. Grades were obtained from instructors.
Experimental Design and Assignment to Condition
Students were blocked on FG status, URM status, and gender, and then randomly assigned to condition, within lecture sections. Despite a large overall sample size (N = 2,505, CG-majority students made up 75% of the sample (N = 1,867) whereas the numbers of FG-majority (N = 382), CG-URM (N = 151), and FG-URM (N = 105) students were low. We therefore needed to consider the implications for statistical power when deciding how many versions of the UVI to test with each group. There were too few FG students in this course to test three different UVIs against control in a four-cell design with sufficient power, and too few URM students to even test two UVIs against control in a three-cell design with sufficient power. Accordingly, we developed a procedure for assigning participants to condition within two experimental designs, henceforth referred to as Studies 2a and 2b (Table 4) to address different research questions.
Table 4.
Experimental Designs in Study 2
| A. Study 2a Three-Cell Design (FG- and CG-Majority students in the Fall and Spring semesters) (N = 2,249) | |||
|---|---|---|---|
| Control | Standard UVI | Prosocial-Combined UVI | |
| CG-Maj: 725 | CG-Maj: 513 | CG-Maj: 629 | |
| FG-Maj: 129 | FG-Maj: 129 | FG-Maj: 124 | |
| Total: 854 (685 in Fall) | Total: 642 (471 in Fall) | Total: 753 (663 in Fall) | |
| B. Study 2b Two-Cell Design (FG- and CG-URM students in the Fall and Spring semesters) (N = 256) | |||
| Control | Standard or Prosocial-Combined UVI* | ||
| CG-URM: 74 | CG-URM: 77 | ||
| FG-URM: 53 | FG-URM: 52 | ||
| Total: 127 (85 in Fall) | Total: 129 (91 in Fall) | ||
Note. CG = continuing-generation college student, FG = first-generation college student, Maj = racial/ethnic majority, URM = underrepresented racial/ethnic minority.
After the conclusion of the Fall semester, in which URM students had been assigned to the Prosocial-Combined UVI, a check for adverse outcomes revealed a negative effect of the intervention on course grades for this group. Therefore, in the spring semester, we assigned URM students to the Standard UVI.
Study 2a: Testing Prosocial-Combined and Standard UVIs against control with majority students.
We randomly assigned CG-majority and FG-majority students in both Fall and Spring to one of three conditions. This allowed us to compare the effects of two versions of the UVI (standard and prosocial-combined) relative to control in a three-cell design, and test how these effects varied for different subgroups of majority students (e.g., FG-majority students).
Study 2b. Testing a single UVI against control with URM students.
We randomly assigned all CG-URM and FG-URM students to a two-cell design, testing the prosocial-combined UVI vs. control. This allowed us to test a single version of the UVI relative to control for the relatively smaller number of URM students in this course. However, a check for adverse outcomes in the Fall semester revealed a negative effect of the prosocial-combined UVI on course grades for URM students. Therefore, in the Spring semester, we randomly assigned URM students to the standard UVI or control.
The analytic procedures for each design were influenced by power considerations. When examining baseline data for all participants combined (prior to assignment to condition), the large sample size afforded statistical power to examine all higher-order interactions between demographic variables. However, when examining subsets of the sample, statistical power was reduced. Therefore, we adjusted the analyses by trimming higher-order interactions that were underpowered.
Deviations of Study 2 from Preregistered Analysis Plan
Here we discuss key deviations from our preregistered analysis plan (see Supplement for full details). We had initially randomly assigned CG-majority students to each of two different designs to compare how different sets of interventions affected FG-majority and URM students, as compared to CG-majority students. However, we later realized that this would lead to imprecise estimates driven by which CG-majority students were assigned to each design. Therefore, we decided to pool CG-majority students into a single three-cell design and analyze data for URM students in a separate two-cell design. We included all CG-majority students from the Fall semester in a four-cell design used only for testing replication of writing results from Study 1a (reported in Study 1b), to avoid using overlapping samples for course grade analyses (our primary preregistered outcome). In addition, we tested effects for URM students in a single two-cell design to prevent overlap between participants in the two-cell and three-cell designs.
In addition, we initially planned to run a large number of models to test similar hypotheses about intervention effects (15 models total). However, conducting so many statistical tests with multiple models would inflate our Type-I error rate and we therefore decided to consolidate models whenever possible (models are described in the Analysis Plan section). We also focused on only two of three possible preregistered non-demographic moderators (confidence about performance and prosocial chemistry motivation, but not prior GPA), and tested both in the same model, to avoid models that would further inflate the number of tests we ran. We determined that confidence about performance and prosocial chemistry motivation would be the most important moderators to keep for consistency with prior research and for alignment with our focus on prosocial motivation (e.g., Harackiewicz, Canning, et al., 2016; Hecht, Harackiewicz, et al., 2019; Hulleman & Harackiewicz, 2009; Priniski et al., 2019). As discussed below, we were unable to measure prior GPA for many students and encountered high levels of missingness with other background variables. Finally, we included several new variables to explore the mechanisms of treatment effects (essay grades and essay grade component scores) as well as effects on students’ perceptions of the field of chemistry (instructor perceptions and prosocial chemistry affordances).
Writing Assignments
All students were given three writing assignments over the course of the semester as graded homework and the procedures were the same as those in Study 1a. Examples of utility value connections were changed from biology to chemistry and are presented in the Appendix. Essays were graded by a team of advanced undergraduate students who had been successful in this introductory chemistry course, but they were not teaching assistants in the course and had no direct contact with students. These graders were recruited by the chemistry instructors and trained and supervised by the research team. Each grader graded only one type of assignment, using a rubric (see measures below). See Supplement for grading rubrics.
Measures
Demographics and Background Variables
Students reported their gender, parental education, and race/ethnicity. We categorized students as FG or CG and as URM or majority using the same method as in Study 1a. As measures of students’ academic and family background, we obtained students’ ACT scores from institutional records (11.5% missing data), and their high school GPAs (3.6% missing data) and a self-report measure of family income from the baseline questionnaire. We also obtained information about the high schools that students attended from institutional records and used a database from the National Center of Education Statistics (2022) to determine the percentage of students at each school who were eligible for Free and Reduced Lunch (FRL), an index of high school poverty (18.6% missing data).
Baseline Measures (first week of semester)
Items for all measures are shown in Appendix B. The three motivation variables were measured on a 7-point Likert-type scale from Not at all true – Very true. Scales were adapted from those used by Harackiewicz, Canning, et al. (2016).
Confidence about Performance and Concern about Background.
The confidence measure was composed of three items (e.g., “I am confident that I will do well in this course”); α = .84.7 Concern about background was measured using three items (e.g., “I am not sure if I have the right background for this course”); α = .64. Although the reliability for this measure was lower than other measures used in this study, we retained this measure for consistency with previous research and relevance to the experience of FG students (Harackiewicz et al., 2014).
Interest.
Interest in chemistry was measured using ten items (e.g., “I think the field of chemistry is very interesting,” “I think what we’re learning in this course is important,” “The study of chemistry is personally meaningful to me”); α = .92. This measure was expanded beyond the measure used by Harackiewicz et al. (2016), which was primarily affect-based, and instead based on one developed for introductory courses by Harackiewicz, Durik and colleagues (2008), which assessed a deeper level of interest (i.e., personal meaningfulness and importance of the class, in addition to affective measures of enjoyment and interestingness). This new measure reflects maintained situational interest, as defined by the four-phase model of interest development (Renninger & Hidi, 2011).
Prosocial Motives for Attending College.
Students were asked about their motives for attending college by checking each item that was a “very important reason for completing your college degree.” This questionnaire was based on one originally developed by Stephens et al. (2012) to measure interdependent and independent motives for attending college. Harackiewicz, Canning, and colleagues (2016) used three of the six interdependent items as a measure of helping motives8: “Help my family out after I’m done with college,” “Give back to my community,” and “Provide a better life for my own children;” α = .53. Given that this scale focuses specifically on helping family and community, we used these three items to measure Family/Community Helping Motives, and added four new items to assess General Helping Motives: “Gain skills that I can use in a job that helps others,” “Learn things that will help me make a positive impact on the world,” “Make a contribution to society,” and “Help others;” α = .68. We computed scores on the two prosocial motives scales by counting how many relevant items students endorsed.
Prosocial Chemistry Motivation.
We created a new measure of course-specific prosocial motivation, Prosocial Chemistry Motivation, measured on a 7-point Likert scale from Unimportant reason for me – Very important reason for me, in response to the prompt “I want to study chemistry because…”. Prosocial chemistry motivation was measured using three items, “I want to make a contribution to society,” “I want to give back to my community,” and “a background in chemistry will allow me to help other people” (α = .85).
Final Questionnaire Measures (final weeks of semester)
Interest, Deeper Involvement, and Future Plans.
We used the same ten items as at baseline to assess interest in chemistry at the end of the semester (α = .94). In addition, we assessed students’ goals for deeper involvement in the chemical and health fields with a three-item scale (α = .87), “I would like to pursue a summer internship that is related to the chemical and health sciences,” “I intend to learn more about ongoing research opportunities in the chemical and health sciences at [university],” “It is important to me to obtain hands-on research experiences in the chemical and health sciences while I am a student.” We also measured Future Plans with two items (α = .93), “Do you intend to obtain a degree or certificate in the chemical and health sciences,” “Do you intend to pursue a career in the chemical and health sciences?” These scales were included to assess students’ deepening interests in biomedical fields more generally, and their plans for careers in biomedical fields.
Perceptions of Instructors’ Values.
We developed a new measure of students’ perceptions of their instructor’s prosocial values with three items measured on a 7-point Likert scale, using “My instructor” as the stem: “values the application of science to real life problems,” “believes that science can really help people,” “believes that science can help solve some of society’s problems” (α = .90).
Course Grades, Essay Grades, and Grade Components
Instructors provided grades for students in the course (A = 4.0, AB = 3.5, B = 3.0, BC = 2.5, C = 2.0, D = 1.0, F = 0.0). Students’ grades in the course were curved to approximately a B average (M = 2.9, SD = 0.9). Writing assignments were graded on a 20-point scale (essay grade; M = 17.0, SD = 2.8).
Study 2: Student Characteristics
We examined student characteristics across Studies 2a and 2b combined, in two ways. We used the entire sample (N = 2,505) to examine differences in background variables and motivation measures, prior to intervention. This was done to examine differences between different demographic groups on relevant measures such as prosocial motivation (a person variable). In addition, we explored course performance and linguistic variables from the essays, but only in the control group(s) because these variables were measured post-intervention (N = 981). These analyses were conducted to examine demographic differences in writing style and grades when writing assignments involved summaries of course topics but did not involve writing about the personal and/or prosocial utility value of course material. We tested the main effects of FG status, URM status, gender, all two- and three-way interactions between these variables, as well as semester (Spring = high, Fall = low) and all two-way interactions with semester on each variable. Regression results are presented in Table 7.
Table 7.
Effects of FG Status, URM Status, Gender, and Semester on Baseline Measures in Studies 2a and 2b combined (N = 2,505) and Study 3 (N = 712), and on Linguistic Style and Performance Measures in the Control Group of Study 2 (N = 981)
| Study 2 | Study 3 | |||||
|---|---|---|---|---|---|---|
| β | z | p | β | z | p | |
| ACT Score | ||||||
| FG | −0.21 | −10.73 | .000 | −0.24 | −5.98 | .000 |
| URM | −0.12 | −5.62 | .000 | −0.24 | −5.76 | .000 |
| FG × URM | −0.09 | −3.71 | .000 | −0.04 | −0.83 | .406 |
| Gender | −0.10 | −5.10 | .000 | −0.04 | −1.19 | .233 |
| FG × Gender | −0.02 | −0.94 | .345 | 0.02 | 0.63 | .527 |
| URM × Gender | 0.02 | 1.13 | .258 | |||
| Spring | −0.23 | −11.37 | .000 | |||
| FG × Spring | 0.03 | 1.48 | .138 | |||
| URM × Spring | −0.02 | −1.07 | .285 | |||
| Gender × Spring | 0.03 | 1.49 | .136 | |||
| FG × URM × Gender | −0.01 | −0.61 | .543 | |||
| High School GPA | ||||||
| FG | −0.07 | −3.64 | .000 | −0.06 | −1.68 | .093 |
| URM | −0.10 | −4.44 | .000 | −0.10 | −2.41 | .016 |
| FG × URM | 0.04 | 1.76 | .078 | −0.01 | −0.25 | .804 |
| Gender | 0.17 | 8.57 | .000 | 0.20 | 5.43 | .000 |
| FG × Gender | 0.03 | 1.62 | .105 | 0.13 | 3.42 | .001 |
| URM × Gender | −0.05 | −2.31 | .021 | |||
| Spring | −0.19 | −8.94 | .000 | |||
| FG × Spring | 0.00 | −0.11 | .915 | |||
| URM × Spring | 0.02 | 1.07 | .283 | |||
| Gender × Spring | 0.02 | 1.05 | .293 | |||
| FG × URM × Gender | −0.01 | −0.36 | .721 | |||
| Family Income | ||||||
| FG | −0.44 | −23.95 | .000 | −0.42 | −12.14 | .000 |
| URM | −0.07 | −3.78 | .000 | −0.10 | −2.72 | .007 |
| FG × URM | −0.06 | −3.07 | .002 | −0.09 | −2.60 | .009 |
| Gender | −0.01 | −0.65 | .515 | 0.01 | 0.23 | .818 |
| FG × Gender | −0.02 | −1.12 | .262 | −0.04 | −1.22 | .222 |
| URM × Gender | 0.00 | −0.12 | .906 | |||
| Spring | −0.06 | −3.45 | .001 | |||
| FG × Spring | 0.03 | 1.75 | .079 | |||
| URM × Spring | −0.03 | −1.43 | .152 | |||
| Gender × Spring | 0.02 | 0.95 | .344 | |||
| FG × URM × Gender | −0.02 | −1.13 | .258 | |||
| High School Percentage FRL | ||||||
| FG | 0.20 | 9.60 | .000 | 0.29 | 7.28 | .000 |
| URM | 0.19 | 8.48 | .000 | 0.29 | 6.41 | .000 |
| FG × URM | 0.12 | 5.22 | .000 | 0.00 | 0.04 | .970 |
| Gender | −0.03 | −1.44 | .151 | −0.09 | −2.26 | .024 |
| FG × Gender | 0.00 | −0.15 | .883 | −0.05 | −1.29 | .198 |
| URM × Gender | 0.00 | −0.06 | .949 | |||
| Spring | 0.04 | 1.94 | .052 | |||
| FG × Spring | −0.04 | −1.66 | .098 | |||
| URM × Spring | −0.02 | −0.83 | .408 | |||
| Gender × Spring | 0.01 | 0.67 | .505 | |||
| FG × URM × Gender | −0.02 | −0.98 | .328 | |||
| Interest | ||||||
| FG | 0.04 | 1.68 | .094 | 0.04 | 0.88 | .378 |
| URM | 0.03 | 1.43 | .152 | −0.01 | −0.16 | .876 |
| FG × URM | 0.00 | −0.03 | .972 | −0.01 | −0.25 | .804 |
| Gender | 0.01 | 0.31 | .756 | 0.06 | 1.49 | .137 |
| FG × Gender | 0.03 | 1.42 | .154 | −0.07 | −1.87 | .061 |
| URM × Gender | −0.02 | −0.94 | .350 | |||
| Spring | −0.09 | −4.40 | .000 | |||
| FG × Spring | 0.01 | 0.66 | .512 | |||
| URM × Spring | 0.02 | 0.79 | .431 | |||
| Gender × Spring | 0.00 | −0.19 | .846 | |||
| FG × URM × Gender | 0.01 | 0.35 | .729 | |||
| Confidence | ||||||
| FG | −0.01 | −0.31 | .758 | −0.01 | −0.13 | .893 |
| URM | −0.03 | −1.20 | .230 | 0.00 | −0.08 | .938 |
| FG × URM | 0.03 | 1.19 | .234 | 0.04 | 1.00 | .316 |
| Gender | −0.27 | −13.54 | .000 | −0.18 | −4.71 | .000 |
| FG × Gender | −0.03 | −1.31 | .191 | −0.05 | −1.36 | .173 |
| URM × Gender | 0.02 | 0.79 | .432 | |||
| Spring | −0.13 | −6.31 | .000 | |||
| FG × Spring | 0.00 | −0.14 | .887 | |||
| URM × Spring | −0.02 | −1.19 | .235 | |||
| Gender × Spring | 0.04 | 1.77 | .077 | |||
| FG × URM × Gender | 0.02 | 0.77 | .440 | |||
| Concern about Background | ||||||
| FG | 0.05 | 2.27 | .023 | 0.00 | 0.03 | .976 |
| URM | 0.04 | 1.78 | .075 | 0.03 | 0.67 | .501 |
| FG × URM | 0.01 | 0.51 | .611 | 0.02 | 0.39 | .697 |
| Gender | 0.11 | 5.31 | .000 | −0.04 | −1.16 | .248 |
| FG × Gender | 0.01 | 0.58 | .560 | 0.08 | 2.11 | .035 |
| URM × Gender | −0.01 | −0.57 | .572 | |||
| Spring | 0.15 | 6.93 | .000 | |||
| FG × Spring | −0.01 | −0.67 | .503 | |||
| URM × Spring | −0.01 | −0.30 | .764 | |||
| Gender × Spring | −0.04 | −1.76 | .079 | |||
| FG × URM × Gender | 0.02 | 0.91 | .365 | |||
| Family/Community Helping Motives | ||||||
| FG | 0.12 | 5.78 | .000 | 0.18 | 4.61 | .000 |
| URM | 0.05 | 2.06 | .039 | 0.02 | 0.45 | .650 |
| FG × URM | 0.06 | 2.71 | .007 | 0.04 | 1.06 | .289 |
| Gender | −0.01 | −0.33 | .745 | −0.07 | −1.91 | .056 |
| FG × Gender | 0.02 | 1.17 | .242 | 0.03 | 0.81 | .419 |
| URM × Gender | −0.05 | −2.47 | .013 | |||
| Spring | −0.02 | −0.89 | .372 | |||
| FG × Spring | 0.01 | 0.62 | .539 | |||
| URM × Spring | 0.02 | 0.85 | .393 | |||
| Gender × Spring | 0.01 | 0.51 | .613 | |||
| FG × URM × Gender | 0.00 | 0.05 | .963 | |||
| General Helping Motives | ||||||
| FG | −0.02 | −0.94 | .347 | 0.03 | 0.72 | .471 |
| URM | 0.00 | −0.01 | .990 | −0.04 | −1.05 | .296 |
| FG × URM | 0.00 | 0.22 | .829 | 0.02 | 0.40 | .687 |
| Gender | 0.16 | 7.92 | .000 | 0.04 | 1.12 | .262 |
| FG × Gender | −0.02 | −0.74 | .457 | −0.06 | −1.65 | .100 |
| URM × Gender | −0.04 | −1.65 | .099 | |||
| Spring | −0.04 | −1.83 | .067 | |||
| FG × Spring | 0.02 | 0.81 | .420 | |||
| URM × Spring | −0.01 | −0.26 | .795 | |||
| Gender × Spring | 0.03 | 1.44 | .150 | |||
| FG × URM × Gender | −0.03 | −1.42 | .156 | |||
| Prosocial Chemistry/Biology Motivation | ||||||
| FG | 0.02 | 1.15 | .249 | 0.06 | 1.47 | .141 |
| URM | 0.06 | 2.90 | .004 | −0.02 | −0.36 | .719 |
| FG × URM | 0.02 | 0.68 | .497 | 0.06 | 1.41 | .157 |
| Gender | 0.14 | 6.97 | .000 | 0.04 | 1.16 | .246 |
| FG × Gender | 0.03 | 1.26 | .207 | −0.07 | −1.92 | .055 |
| URM × Gender | −0.03 | −1.58 | .114 | |||
| Spring | −0.03 | −1.46 | .143 | |||
| FG × Spring | 0.02 | 1.02 | .308 | |||
| URM × Spring | 0.00 | −0.21 | .836 | |||
| Gender × Spring | 0.01 | 0.52 | .606 | |||
| FG × URM × Gender | 0.00 | 0.06 | .952 | |||
| Course grade | ||||||
| FG | −.18 | −5.41 | .000 | |||
| URM | −.11 | −3.22 | .001 | |||
| FG × URM | −.02 | −0.68 | .495 | |||
| Gender | −.10 | −3.25 | .001 | |||
| FG × Gender | .02 | 0.51 | .607 | |||
| URM × Gender | −.06 | −1.76 | .078 | |||
| Spring | .04 | 1.30 | .195 | |||
| FG × Spring | .00 | −0.07 | .945 | |||
| URM × Spring | .00 | −0.07 | .940 | |||
| Gender × Spring | .01 | 0.39 | .697 | |||
| FG × URM × Gender | .03 | 0.87 | .385 | |||
| Word Count | ||||||
| FG | −.10 | −2.85 | .004 | |||
| URM | −.02 | −0.45 | .655 | |||
| FG × URM | .01 | 0.19 | .847 | |||
| Gender | .06 | 1.82 | .069 | |||
| FG × Gender | .07 | 2.00 | .046 | |||
| URM × Gender | −.07 | −2.08 | .037 | |||
| Spring | −.02 | −0.56 | .579 | |||
| FG × Spring | .06 | 1.76 | .078 | |||
| URM × Spring | −.05 | −1.42 | .154 | |||
| Gender × Spring | −.01 | −0.30 | .763 | |||
| FG × URM × Gender | .01 | 0.39 | .694 | |||
| Analytic words | ||||||
| FG | −.08 | −2.27 | .023 | |||
| URM | −.05 | −1.41 | .158 | |||
| FG × URM | −.02 | −0.56 | .577 | |||
| Gender | .05 | 1.53 | .127 | |||
| FG × Gender | .04 | 1.24 | .216 | |||
| URM × Gender | −.01 | −0.24 | .811 | |||
| Spring | −.13 | −3.97 | .000 | |||
| FG × Spring | .04 | 1.33 | .183 | |||
| URM × Spring | −.04 | −1.17 | .244 | |||
| Gender × Spring | −.03 | −0.98 | .328 | |||
| FG × URM × Gender | .05 | 1.51 | .131 | |||
| Essay grade | ||||||
| FG | −.17 | −5.10 | .000 | |||
| URM | .00 | −0.14 | .889 | |||
| FG × URM | .00 | −0.10 | .921 | |||
| Gender | .14 | 4.43 | .000 | |||
| FG × Gender | .12 | 3.64 | .000 | |||
| URM × Gender | −.09 | −2.57 | .010 | |||
| Spring | −.04 | −1.33 | .183 | |||
| FG × Spring | .00 | −0.03 | .975 | |||
| URM × Spring | .01 | 0.40 | .688 | |||
| Gender × Spring | .02 | 0.48 | .635 | |||
| FG × URM × Gender | −.05 | −1.48 | .138 | |||
Note. All predictors were mean centered. FG = first-generation college students (FG = high, continuing-generation = low); URM = underrepresented minority students (URM = high, majority = low); Gender is coded women = high, men = low. In Study 3, we did not test interactions beyond FG × Gender due to power considerations. Study 3 was conducted in a single Fall semester and thus we did not test effects of semester (i.e., the Spring factor tested in Study 2). We were also unable to test effects on linguistic and performance measures in the control group of Study 3, as Study 3 had no control group.
We first examined differences in background variables (ACT, high school GPA, family income, FRL) and motivation measures (interest, confidence, concern about background, family/community and general helping college motives, and prosocial chemistry motivation) as a function of students’ demographic characteristics. All four background measures showed similar patterns for FG and URM students. Specifically, for ACT composite scores, family income, and high school GPA, there were significant negative effects, and on FRL, significant positive effects, for FG status, all p < .001, and URM status, all p < .001. There were no gender differences for family income or FRL, but women had lower ACT scores and higher high school GPAs, both p <.001, compared to men.
Analyses of motivation measures showed that FG students endorsed more family/community helping motives, p < .001, and reported higher levels of concern about background, p = .023, than CG students. URM students reported higher levels of prosocial chemistry motivation, p = .004, and family/community helping motives, p = .039, than majority students. Women reported higher levels of prosocial chemistry motivation, p < .001, general helping motives, p < .001, and concern about background, p < .001, and lower levels of confidence, p < .001, than men. Figure 1 shows the effect sizes (betas from the regressions) for the three measures of prosociality.
Figure 1.
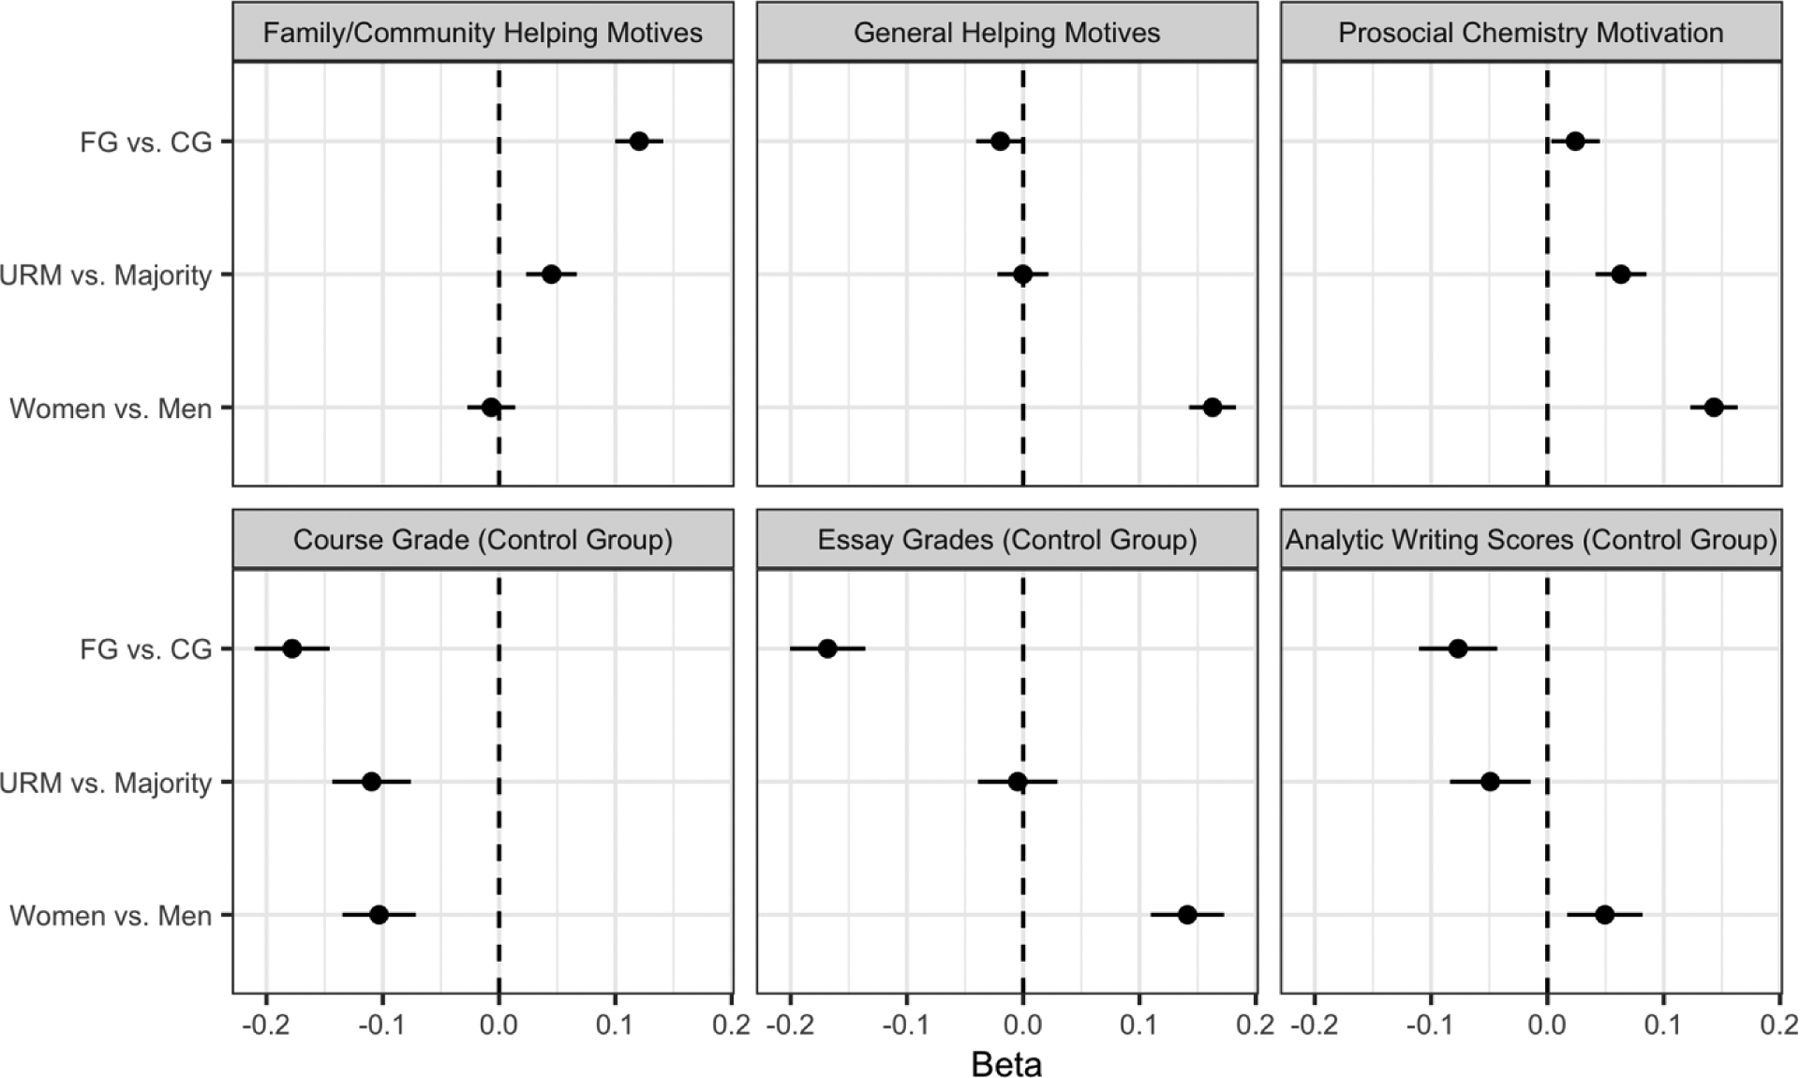
Differences on Prosocial and Performance Measures, Study 2
Note. Standardized regression coefficients (i.e., betas) and standard errors, plotted from six regressions (three with the entire sample, and three with all students in the control group), each examining effects of FG status, URM status, and gender.
We then examined course grades, essay grades, and linguistic variables among students in the control condition. FG students, p < .001, URM students, p = .001, and women, p = .001, earned significantly lower grades in the course than CG students, majority students, and men, respectively. Figure 1 shows the effect sizes (betas) for course grades, essay grades and analytic writing for each group. Notably, the social class achievement difference in course grades was roughly twice as large as the URM and gender differences in course grades (β = −.18, for FG (vs. CG), compare to β= −.11, for URM (vs. majority), and β = −.10 for gender) in this class.
With respect to essay grades in the control group, FG students earned lower essay grades, p < .001, than CG students. FG students also wrote shorter essays, p = .004, and had lower analytic scores, p = .023. URM students did not differ from majority students in terms of essay grades, component scores, or analytic scores. In contrast, women earned higher essay grades, p < .001, than men, consistent with previous research (Petersen, 2018; Reilly et al, 2019).
Summary of differences in student characteristics.
Consistent with previous research, FG students, URM students, and women all endorsed some types of prosocial motives more strongly than their CG, majority, or male counterparts, respectively (Allen et al., 2015; Diekman et al., 2010; Fryberg & Markus, 2007; Ives & Castillo-Montoya, 2020; Martin & Martin, 1985; Stephens et al., 2018). However, our results revealed unique patterns of prosocial motivation for each group. In particular, FG students (as compared to CG students) were distinguished by their stronger endorsement of family/community helping motives for attending college, but they were not higher in general helping motives or prosocial chemistry motivation, which is consistent with the construct of hard interdependence (Stephens et al., 2014). In addition, the analyses on essay content and grades in the control group revealed a unique pattern for how FG students approached and wrote their essays. They earned lower essay grades, compared to CG students. With respect to linguistic style, they wrote with a less analytic style and wrote shorter essays; both of these features have been associated with lower course grades in previous research (Pennebaker et al, 2014). These findings are also consistent with recent research examining social class differences in writing (Alvero et al., 2021). Considered together, our results suggest that FG students in this first-year chemistry class were at a distinct disadvantage with respect to writing assignments. In contrast, URM students and women did not show these disadvantages, relative to majority students and men, respectively.
Study 2 Results: Testing Intervention Effects on Performance and Motivation Outcomes
Next, we tested for intervention effects on (a) our primary performance outcome: course grade, and (b) our primary motivation outcome: interest, as well as goals for deeper involvement in chemistry, and future plans, all measured near the end of semester. In exploratory analyses, we tested intervention effects on students’ perceptions of their instructors and the field of chemistry, more broadly. We first tested intervention effects in Study 2a, which was a three-cell design (prosocial-combined, standard, and control conditions) with majority students, and then in Study 2b, a two-cell design (intervention and control conditions) with URM students.
Analysis Plan
Within each design, our goal was to examine the effects of intervention condition(s) and whether these effects depended upon FG status, confidence about performance, prosocial chemistry motivation, semester, and/or the intersection of these variables (i.e., higher-order interactions with condition). We tested all 2- and 3-way interactions with condition, demographic variables, and confidence whenever possible. Specifically, on the basis of previous literature and power analyses (see Appendix), we tested these interactions when the resultant cell size was at least 30 (e.g., we would not test a 3-way interaction between condition, FG status and gender if there were only 25 FG women in any condition). We also included 2-way interactions between condition and prosocial chemistry motivation to examine whether different versions of the UVI might be more or less effective depending on students’ prosocial chemistry motivation. Full results from the three-cell design (Study 2a) are presented in Tables 8, 9, and 10, and full results from the two-cell design (Study 2b) are presented in Table 12. Here we discuss significant main effects of focal variables (intervention condition, FG status, confidence, prosocial chemistry motivation, and semester) and interactions between intervention condition and other focal variables. We also discuss non-significant effects when they provide needed context for experimental design or results (e.g., potential for adverse effects, patterns comparable to other significant effects). As noted, we did not focus on gender in these intervention analyses because women are not underrepresented in undergraduate chemistry, but gender was tested in all models (as well as all possible interactions with gender).
Table 8.
Primary Results Study 2a Performance Outcomes, Three-Cell Design, Majority Students
| Course Grade | Essay Grade | |||||
|---|---|---|---|---|---|---|
| β | z | p | β | z | p | |
| UVI | 0.02 | 0.72 | .471 | 0.05 | 2.30 | .022 |
| Prosocial | 0.03 | 1.30 | .195 | −0.01 | −0.36 | .716 |
| FG | −0.15 | −7.05 | .000 | −0.12 | −5.66 | .000 |
| Confidence | 0.20 | 8.66 | .000 | 0.01 | 0.30 | .767 |
| PCM | −0.01 | −0.57 | .566 | 0.03 | 1.30 | .195 |
| Spring | 0.10 | 4.74 | .000 | −0.10 | −4.55 | .000 |
| Gender | 0.00 | 0.03 | .977 | 0.22 | 9.77 | .000 |
| UVI × FG | 0.02 | 0.99 | .323 | 0.05 | 2.45 | .014 |
| Prosocial × FG | −0.02 | −1.13 | .258 | −0.02 | −0.77 | .440 |
| UVI × Confidence | −0.02 | −0.76 | .450 | −0.05 | −2.16 | .031 |
| Prosocial × Confidence | 0.01 | 0.47 | .637 | −0.01 | −0.44 | .658 |
| UVI × PCM | 0.00 | −0.08 | .938 | 0.04 | 1.78 | .075 |
| Prosocial × PCM | −0.02 | −1.00 | .315 | −0.02 | −0.71 | .479 |
| UVI × Spring | 0.02 | 1.16 | .245 | −0.04 | −1.98 | .048 |
| Prosocial × Spring | 0.05 | 2.14 | .032 | −0.02 | −0.76 | .446 |
| UVI × Gender | 0.01 | 0.23 | .815 | −0.01 | −0.41 | .683 |
| Prosocial × Gender | 0.00 | 0.15 | .880 | −0.01 | −0.32 | .747 |
| FG × Confidence | 0.05 | 2.10 | .036 | 0.00 | 0.03 | .974 |
| FG × Gender | 0.05 | 2.23 | .026 | 0.07 | 3.40 | .001 |
| Gender × Confidence | −0.03 | −1.34 | .181 | −0.07 | −3.13 | .002 |
| UVI × FG × Confidence | 0.02 | 1.05 | .292 | −0.02 | −1.00 | .318 |
| Prosocial × FG × Confidence | 0.07 | 2.95 | .003 | −0.04 | −1.93 | .053 |
| UVI × FG × Gender | 0.01 | 0.63 | .527 | −0.06 | −2.89 | .004 |
| Prosocial × FG × Gender | 0.03 | 1.37 | .171 | −0.02 | −1.14 | .253 |
| UVI × Gender × Confidence | 0.02 | 0.73 | .465 | 0.06 | 2.72 | .007 |
| Prosocial × Gender × Confidence | 0.02 | 0.74 | .462 | 0.03 | 1.29 | .196 |
Note. The UVI contrast compared the two UVIs to control; The Prosocial contrast compared Prosocial-combined UVI to the Standard UVI. Confidence and PCM were standardized and all other predictors were mean centered. UVI = UVI (+.33) vs. Control (−.67); Prosocial = Prosocial-Combined (+.5) vs. Standard UVI (−.5). FG = first-generation college students (FG = high, continuing-generation = low; Gender is coded women = high, men = low. PCM = prosocial chemistry motivation.
Table 9.
Primary Results Study 2a Survey Outcomes, Three-Cell Design, Majority Students
| Interest | Future plans | Deeper Involvement | Perceptions of Instructor’s Values | |||||||||
|---|---|---|---|---|---|---|---|---|---|---|---|---|
| β | z | p | β | z | p | β | z | p | β | z | p | |
| UVI | 0.02 | 0.76 | .446 | 0.01 | 0.54 | .587 | 0.02 | 0.74 | .462 | 0.02 | 0.89 | .376 |
| Prosocial | −0.02 | −0.91 | .361 | −0.03 | −1.22 | .224 | −0.03 | −1.37 | .171 | 0.03 | 1.22 | .222 |
| FG | 0.03 | 1.33 | .183 | 0.00 | 0.16 | .870 | 0.00 | 0.14 | .893 | 0.02 | 0.75 | .453 |
| Confidence | 0.21 | 9.24 | .000 | 0.06 | 2.51 | .012 | 0.07 | 3.17 | .002 | 0.08 | 3.34 | .001 |
| PCM | 0.36 | 17.20 | .000 | 0.28 | 12.94 | .000 | 0.37 | 17.37 | .000 | 0.13 | 5.76 | .000 |
| Spring | 0.07 | 3.52 | .000 | 0.05 | 2.22 | .026 | 0.03 | 1.34 | .180 | 0.07 | 3.20 | .001 |
| Gender | −0.07 | −3.26 | .001 | 0.23 | 10.04 | .000 | 0.10 | 4.52 | .000 | 0.00 | 0.03 | .976 |
| UVI × FG | 0.01 | 0.30 | .765 | 0.03 | 1.24 | .215 | 0.03 | 1.61 | .108 | 0.01 | 0.41 | .683 |
| Prosocial × FG | 0.01 | 0.71 | .476 | −0.02 | −0.79 | .427 | −0.01 | −0.25 | .804 | 0.00 | 0.01 | .992 |
| UVI × Confidence | 0.03 | 1.34 | .182 | 0.02 | 0.92 | .356 | 0.02 | 0.73 | .466 | −0.02 | −0.69 | .489 |
| Prosocial × Confidence | −0.03 | −1.45 | .147 | 0.01 | 0.26 | .794 | 0.00 | −0.11 | .910 | −0.05 | −1.95 | .052 |
| UVI × PCM | −0.02 | −0.90 | .369 | −0.03 | −1.52 | .128 | −0.05 | −2.30 | .021 | 0.01 | 0.43 | .664 |
| Prosocial × PCM | 0.02 | 0.75 | .451 | 0.01 | 0.61 | .541 | 0.03 | 1.64 | .101 | 0.03 | 1.24 | .217 |
| UVI × Spring | 0.04 | 2.08 | .038 | 0.01 | 0.44 | .658 | 0.02 | 1.14 | .255 | 0.05 | 2.28 | .023 |
| Prosocial × Spring | 0.01 | 0.55 | .580 | −0.01 | −0.51 | .611 | −0.01 | −0.44 | .663 | −0.01 | −0.49 | .628 |
| UVI × Gender | 0.00 | 0.02 | .988 | 0.03 | 1.45 | .148 | 0.02 | 1.07 | .285 | −0.03 | −1.31 | .191 |
| Prosocial × Gender | −0.01 | −0.39 | .693 | 0.01 | 0.39 | .695 | 0.01 | 0.51 | .614 | −0.04 | −1.84 | .066 |
| FG × Confidence | 0.03 | 1.36 | .174 | 0.02 | 1.04 | .298 | 0.03 | 1.32 | .186 | 0.05 | 1.95 | .052 |
| FG × Gender | 0.00 | −0.05 | .959 | −0.01 | −0.26 | .797 | 0.01 | 0.31 | .760 | 0.00 | 0.18 | .856 |
| Gender × Confidence | 0.05 | 2.31 | .021 | 0.00 | 0.02 | .986 | 0.05 | 2.35 | .019 | −0.07 | −2.97 | .003 |
| UVI × FG × Confidence | −0.01 | −0.46 | .647 | 0.02 | 1.01 | .314 | 0.01 | 0.34 | .735 | 0.01 | 0.53 | .599 |
| Prosocial × FG × Confid. | 0.06 | 2.60 | .009 | 0.03 | 1.20 | .228 | 0.04 | 1.67 | .096 | 0.05 | 2.13 | .033 |
| UVI × FG × Gender | 0.04 | 1.86 | .063 | 0.01 | 0.40 | .689 | 0.03 | 1.09 | .275 | 0.01 | 0.41 | .679 |
| Prosocial × FG × Gender | 0.03 | 1.33 | .183 | 0.02 | 0.79 | .433 | 0.01 | 0.66 | .507 | 0.06 | 2.59 | .010 |
| UVI × Gender × Confid. | 0.03 | 1.12 | .261 | 0.00 | 0.02 | .983 | 0.02 | 0.80 | .424 | 0.02 | 0.97 | .330 |
| Prosocial × Gender × Confid. | −0.01 | −0.54 | .589 | −0.02 | −0.83 | .406 | −0.02 | −0.73 | .464 | 0.03 | 1.31 | .192 |
Note. Confidence and PCM were standardized and all other predictors were mean centered. UVI = UVI (+.33) vs. Control (−.67); Prosocial = Prosocial-Combined (+.5) vs. Standard UVI (−.5). FG = first-generation college students (FG = high, continuing-generation = low; Gender is coded women = high, men = low. PCM = prosocial chemistry motivation.
Table 10.
Primary Results Study 2a Linguistic Outcomes, Three-Cell Design, Majority Students
| Word Count | Prosocial Words | Communion Words | Prosocial Connections | |||||||||
|---|---|---|---|---|---|---|---|---|---|---|---|---|
| β | z | p | β | z | p | β | z | p | β | z | p | |
| UVI | 0.08 | 3.77 | .000 | 0.25 | 12.05 | .000 | 0.32 | 15.39 | .000 | 0.46 | 25.31 | .000 |
| Prosocial | 0.05 | 2.46 | .014 | 0.30 | 14.74 | .000 | 0.20 | 9.79 | .000 | 0.34 | 19.15 | .000 |
| FG | −0.07 | −3.16 | .002 | 0.00 | −0.17 | .869 | −0.01 | −0.35 | .723 | 0.09 | 5.19 | .000 |
| Confidence | 0.03 | 1.08 | .278 | −0.03 | −1.57 | .115 | −0.05 | −2.04 | .042 | −0.02 | −0.83 | .409 |
| PCM | 0.07 | 2.98 | .003 | 0.04 | 1.80 | .073 | 0.00 | −0.16 | .870 | 0.04 | 2.39 | .017 |
| Spring | −0.04 | −1.78 | .075 | 0.04 | 1.72 | .085 | 0.03 | 1.58 | .114 | 0.18 | 9.97 | .000 |
| Gender | 0.09 | 3.93 | .000 | −0.03 | −1.36 | .174 | 0.04 | 2.03 | .043 | 0.01 | 0.55 | .582 |
| UVI × FG | 0.01 | 0.56 | .574 | 0.04 | 2.07 | .038 | 0.04 | 2.17 | .030 | 0.05 | 2.73 | .006 |
| Prosocial × FG | −0.03 | −1.38 | .167 | 0.03 | 1.43 | .152 | 0.05 | 2.75 | .006 | −0.01 | −0.48 | .631 |
| UVI × Confidence | 0.00 | 0.21 | .837 | −0.01 | −0.63 | .528 | −0.02 | −0.96 | .335 | 0.01 | 0.53 | .599 |
| Prosocial × Confidence | −0.02 | −0.74 | .462 | −0.01 | −0.69 | .493 | 0.00 | 0.01 | .993 | 0.00 | 0.01 | .995 |
| UVI × PCM | 0.04 | 1.76 | .078 | −0.01 | −0.60 | .551 | 0.00 | −0.08 | .936 | −0.02 | −1.23 | .220 |
| Prosocial × PCM | −0.01 | −0.28 | .782 | 0.00 | −0.02 | .985 | 0.00 | 0.18 | .855 | −0.02 | −0.88 | .381 |
| UVI × Spring | −0.03 | −1.29 | .197 | 0.03 | 1.71 | .087 | −0.01 | −0.33 | .741 | 0.09 | 5.06 | .000 |
| Prosocial × Spring | 0.01 | 0.29 | .770 | 0.00 | −0.13 | .900 | 0.00 | −0.10 | .919 | 0.01 | 0.30 | .765 |
| UVI × Gender | 0.00 | 0.04 | .966 | −0.01 | −0.59 | .552 | 0.00 | 0.22 | .829 | 0.02 | 0.86 | .392 |
| Prosocial × Gender | −0.05 | −2.26 | .024 | 0.02 | 0.85 | .397 | 0.01 | 0.28 | .780 | −0.03 | −1.46 | .144 |
| FG × Confidence | 0.00 | −0.09 | .930 | −0.03 | −1.43 | .152 | −0.02 | −0.74 | .462 | 0.01 | 0.63 | .530 |
| FG × Gender | 0.06 | 2.57 | .010 | 0.00 | 0.12 | .905 | −0.01 | −0.26 | .797 | −0.03 | −1.42 | .156 |
| Gender × Confidence | −0.04 | −1.90 | .058 | 0.03 | 1.35 | .177 | 0.02 | 0.73 | .465 | 0.02 | 1.13 | .257 |
| UVI × FG × Confidence | −0.03 | −1.13 | .258 | −0.03 | −1.33 | .184 | −0.03 | −1.45 | .148 | −0.01 | −0.33 | .744 |
| Prosocial × FG × Confidence | 0.00 | −0.03 | .977 | −0.05 | −2.14 | .032 | −0.03 | −1.34 | .180 | −0.01 | −0.45 | .651 |
| UVI × FG × Gender | −0.01 | −0.36 | .722 | −0.03 | −1.51 | .130 | −0.02 | −1.06 | .287 | −0.01 | −0.50 | .615 |
| Prosocial × FG × Gender | 0.03 | 1.59 | .111 | −0.04 | −1.88 | .060 | −0.03 | −1.33 | .185 | −0.04 | −2.00 | .046 |
| UVI × Gender × Confidence | 0.02 | 0.66 | .510 | 0.02 | 1.01 | .311 | 0.01 | 0.67 | .502 | 0.02 | 1.14 | .256 |
| Prosocial × Gender × Confid. | 0.03 | 1.20 | .230 | 0.00 | 0.06 | .954 | −0.01 | −0.46 | .648 | 0.00 | −0.15 | .878 |
Note. Confidence and PCM were standardized and all other predictors were mean centered. UVI = UVI (+.33) vs. Control (−.67); Prosocial = Prosocial-Combined (+.5) vs. Standard UVI (−.5). FG = first-generation college students (FG = high, continuing-generation = low); Gender is coded women = high, men = low. PCM = prosocial chemistry motivation
Table 12.
Primary Results Study 2b Performance, Linguistic, and Survey Outcomes, Two-Cell Design, URM Students
| Course Grade | Essay Grade | Interest | Future plans | Deeper Involvement | |||||||||||
|---|---|---|---|---|---|---|---|---|---|---|---|---|---|---|---|
| β | z | p | β | z | p | β | z | p | β | z | p | β | z | p | |
| Intervention | −.09 | −1.64 | .102 | −.02 | −0.35 | .723 | .00 | 0.08 | .934 | .12 | 1.98 | .048 | .01 | 0.23 | .815 |
| FG | −.32 | −5.44 | .000 | −.18 | −2.94 | .003 | −.05 | −0.77 | .440 | .05 | 0.78 | .433 | .03 | 0.46 | .647 |
| Confidence | .20 | 3.22 | .001 | .01 | 0.11 | .913 | .18 | 2.91 | .004 | .00 | −0.05 | .960 | −.02 | −0.32 | .751 |
| PCM | −.06 | −1.02 | .307 | .06 | 0.90 | .370 | .44 | 7.22 | .000 | .33 | 5.23 | .000 | .36 | 5.45 | .000 |
| Spring | .15 | 2.45 | .014 | −.02 | −0.24 | .808 | .12 | 1.99 | .047 | .08 | 1.21 | .226 | .07 | 1.03 | .305 |
| Gender | −.08 | −1.35 | .176 | .04 | 0.59 | .554 | −.14 | −2.40 | .016 | .24 | 3.84 | .000 | .03 | 0.39 | .695 |
| Int × FG | −.05 | −0.81 | .420 | .03 | 0.51 | .613 | .07 | 1.10 | .272 | .04 | 0.63 | .528 | .10 | 1.55 | .120 |
| Int × Conf. | .05 | 0.73 | .468 | .01 | 0.11 | .912 | .13 | 2.20 | .028 | .06 | 1.02 | .307 | .03 | 0.44 | .657 |
| Int × PCM | −.02 | −0.34 | .737 | −.03 | −0.39 | .694 | −.05 | −0.85 | .396 | .03 | 0.46 | .648 | −.03 | −0.52 | .606 |
| Int × Spring | .08 | 1.34 | .180 | −.01 | −0.21 | .834 | −.01 | −0.19 | .851 | .07 | 1.17 | .242 | −.06 | −0.94 | .347 |
| Int × Gender | .08 | 1.35 | .177 | .12 | 1.88 | .059 | .12 | 1.94 | .053 | −.02 | −0.30 | .761 | .09 | 1.31 | .190 |
| Perceptions of Instructor’s Values | Word Count | Prosocial Words | Communion Words | Prosocial Connections | |||||||||||
| β | z | p | β | z | p | β | z | p | β | z | p | β | z | p | |
| Intervention | −.01 | −0.10 | .922 | .13 | 2.19 | .028 | .25 | 4.20 | .000 | .35 | 6.08 | .000 | .62 | 12.96 | .000 |
| FG | .00 | 0.03 | .979 | .01 | 0.14 | .886 | −.07 | −1.17 | .243 | −.13 | −2.20 | .028 | −.10 | −2.08 | .037 |
| Confidence | −.02 | −0.31 | .757 | −.01 | −0.17 | .863 | .07 | 1.04 | .297 | .05 | 0.86 | .387 | −.03 | −0.49 | .627 |
| PCM | .19 | 2.77 | .006 | .07 | 1.05 | .296 | .13 | 2.07 | .039 | .05 | 0.89 | .374 | .08 | 1.61 | .106 |
| Spring | .03 | 0.44 | .658 | −.05 | −0.83 | .408 | −.05 | −0.78 | .435 | −.04 | −0.60 | .545 | −.05 | −1.01 | .313 |
| Gender | −.05 | −0.72 | .474 | −.02 | −0.38 | .703 | .03 | 0.54 | .592 | .02 | 0.35 | .726 | −.03 | −0.62 | .532 |
| Int × FG | −.06 | −0.90 | .370 | .08 | 1.29 | .198 | .04 | 0.69 | .489 | .06 | 0.96 | .339 | −.08 | −1.58 | .114 |
| Int × Conf. | .12 | 1.82 | .070 | .15 | 2.27 | .023 | .04 | 0.64 | .522 | .07 | 1.10 | .270 | .03 | 0.66 | .510 |
| Int × PCM | −.13 | −1.96 | .050 | −.03 | −0.42 | .673 | .00 | 0.05 | .963 | −.03 | −0.59 | .558 | .02 | 0.47 | .635 |
| Int × Spring | .12 | 1.69 | .090 | .08 | 1.25 | .211 | −.10 | −1.56 | .119 | −.07 | −1.16 | .247 | −.14 | −2.69 | .007 |
| Int × Gender | .11 | 1.65 | .100 | .10 | 1.53 | .127 | −.05 | −0.82 | .412 | −.09 | −1.58 | .114 | .03 | 0.64 | .519 |
Note. Confidence and PCM were standardized and all other predictors were mean centered. Intervention = Intervention (+.5) vs. Control (−.5). FG = first-generation college students (FG = high, continuing-generation = low); Gender is coded women = high, men = low. PCM = prosocial chemistry motivation. For URM students in Study 2b, the Intervention was the Prosocial-Combined UVI in Fall and the Standard UVI in Spring.
Given that students were nested within eight lecture sections, we examined intraclass correlations of all outcomes to determine whether multilevel models were necessary. Only one variable had an intraclass correlation greater than .01 between lecture sections: perceptions of instructor’s values (ICC = .10). Thus, we ran a supplementary multilevel model for this outcome (see Supplement); conclusions from this analysis were the same as from our primary analysis.
Study 2a: What Were the Effects of the UVIs for FG- and CG-Majority Students in the Three-Cell Design?
In this design, our goal was to examine the effects of the two UVIs (prosocial-combined and standard) relative to control, and whether these two interventions had differential effects as a function of FG status, confidence, prosocial science motivation and semester among racial/ethnic majority students. We tested the effects of condition using two orthogonal contrasts: UVI (prosocial-combined and standard vs. control) and Prosocial-Combined vs. Standard UVI, using the regression model detailed above (see Tables 8–10). Descriptive statistics and correlations for all variables tested in Study 2a are presented in Tables 5.
Table 5.
Descriptives and Correlations for Study 2a Three-Cell Design
| 1 | 2 | 3 | 4 | 5 | 6 | 7 | 8 | 9 | 10 | 11 | 12 | 13 | 14 | 15 | 16 | |
|---|---|---|---|---|---|---|---|---|---|---|---|---|---|---|---|---|
| 1. ACT | ||||||||||||||||
| 2. High School GPA | .18 | |||||||||||||||
| 3. Family income | .23 | .10 | ||||||||||||||
| 4. High School Pct. FRL | −.16 | −.08 | −.24 | |||||||||||||
| 5. Baseline Interest | −.01 | .04 | −.01 | .00 | ||||||||||||
| 6. Baseline confidence | .19 | .05 | .08 | −.02 | .40 | |||||||||||
| 7. Concern about background | −.16 | −.07 | −.10 | .06 | −.39 | −.61 | ||||||||||
| 8. Prosocial chem motivation | −.07 | .05 | −.01 | .04 | .57 | .15 | −.15 | |||||||||
| 9. Fam/com helping motivation | −.18 | .01 | −.07 | .02 | .12 | −.03 | .04 | .23 | ||||||||
| 10. General helping motivation | −.07 | .08 | .06 | −.04 | .15 | .00 | −.03 | .27 | .45 | |||||||
| 11. Final interest | .01 | .00 | −.01 | .02 | .63 | .27 | −.30 | .38 | .05 | .08 | ||||||
| 12. Future plans | −.15 | .08 | .01 | −.03 | .33 | .02 | −.11 | .32 | .10 | .18 | .42 | |||||
| 13. Deeper involvement | −.06 | .05 | .00 | .01 | .45 | .10 | −.16 | .40 | .13 | .18 | .62 | .69 | ||||
| 14. Perc of instr values | .04 | −.01 | .00 | .00 | .19 | .07 | −.06 | .15 | .03 | .08 | .31 | .13 | .19 | |||
| 15. Course grade | .35 | .29 | .11 | −.07 | .08 | .19 | −.19 | .01 | −.11 | −.03 | .28 | .06 | .15 | .15 | ||
| 16. Essay grade | .03 | .29 | .10 | −.08 | −.01 | −.05 | .03 | .05 | .03 | .09 | .01 | .08 | .05 | .05 | .34 | |
| Three-Cell Mean | 29.37 | 3.89 | 6.43 | 0.21 | 5.04 | 5.29 | 3.22 | 4.96 | 1.81 | 3.18 | 4.44 | 4.59 | 4.19 | 6.23 | 2.99 | 17.03 |
| Three-Cell SD | 2.90 | 0.16 | 1.66 | 0.14 | 1.10 | 1.09 | 1.17 | 1.38 | 1.05 | 1.16 | 1.37 | 2.02 | 1.77 | 1.01 | 0.91 | 2.78 |
Note. All correlations |r| > .04 are significant at p < .05.
Performance Outcomes in the Three-Cell Design with Majority Students
Course Grades.
Full results from this regression analysis are presented in Table 8. Significant main effects indicated that among majority students, CG students, more confident students, and Spring semester students all earned higher grades in the course, relative to FG-majority students, less confident students, and students in the Fall Semester, respectively (ps < .001). A significant interaction between FG status and confidence indicated that confidence was a stronger predictor of performance for FG, relative to CG students, β = .05, p = .036. In addition, there was a significant Prosocial-Combined vs. Standard UVI × FG × Confidence interaction, β = .07, p = .003, indicating that, compared to the standard UVI, the prosocial-combined UVI had a more positive effect on course grades for FG students with higher levels of confidence (and a more negative effect for those with lower levels of confidence), across both semesters, whereas the effects of the prosocial-combined and standard UVIs did not substantially differ as a function of confidence for CG students (Figure 2).
Figure 2.
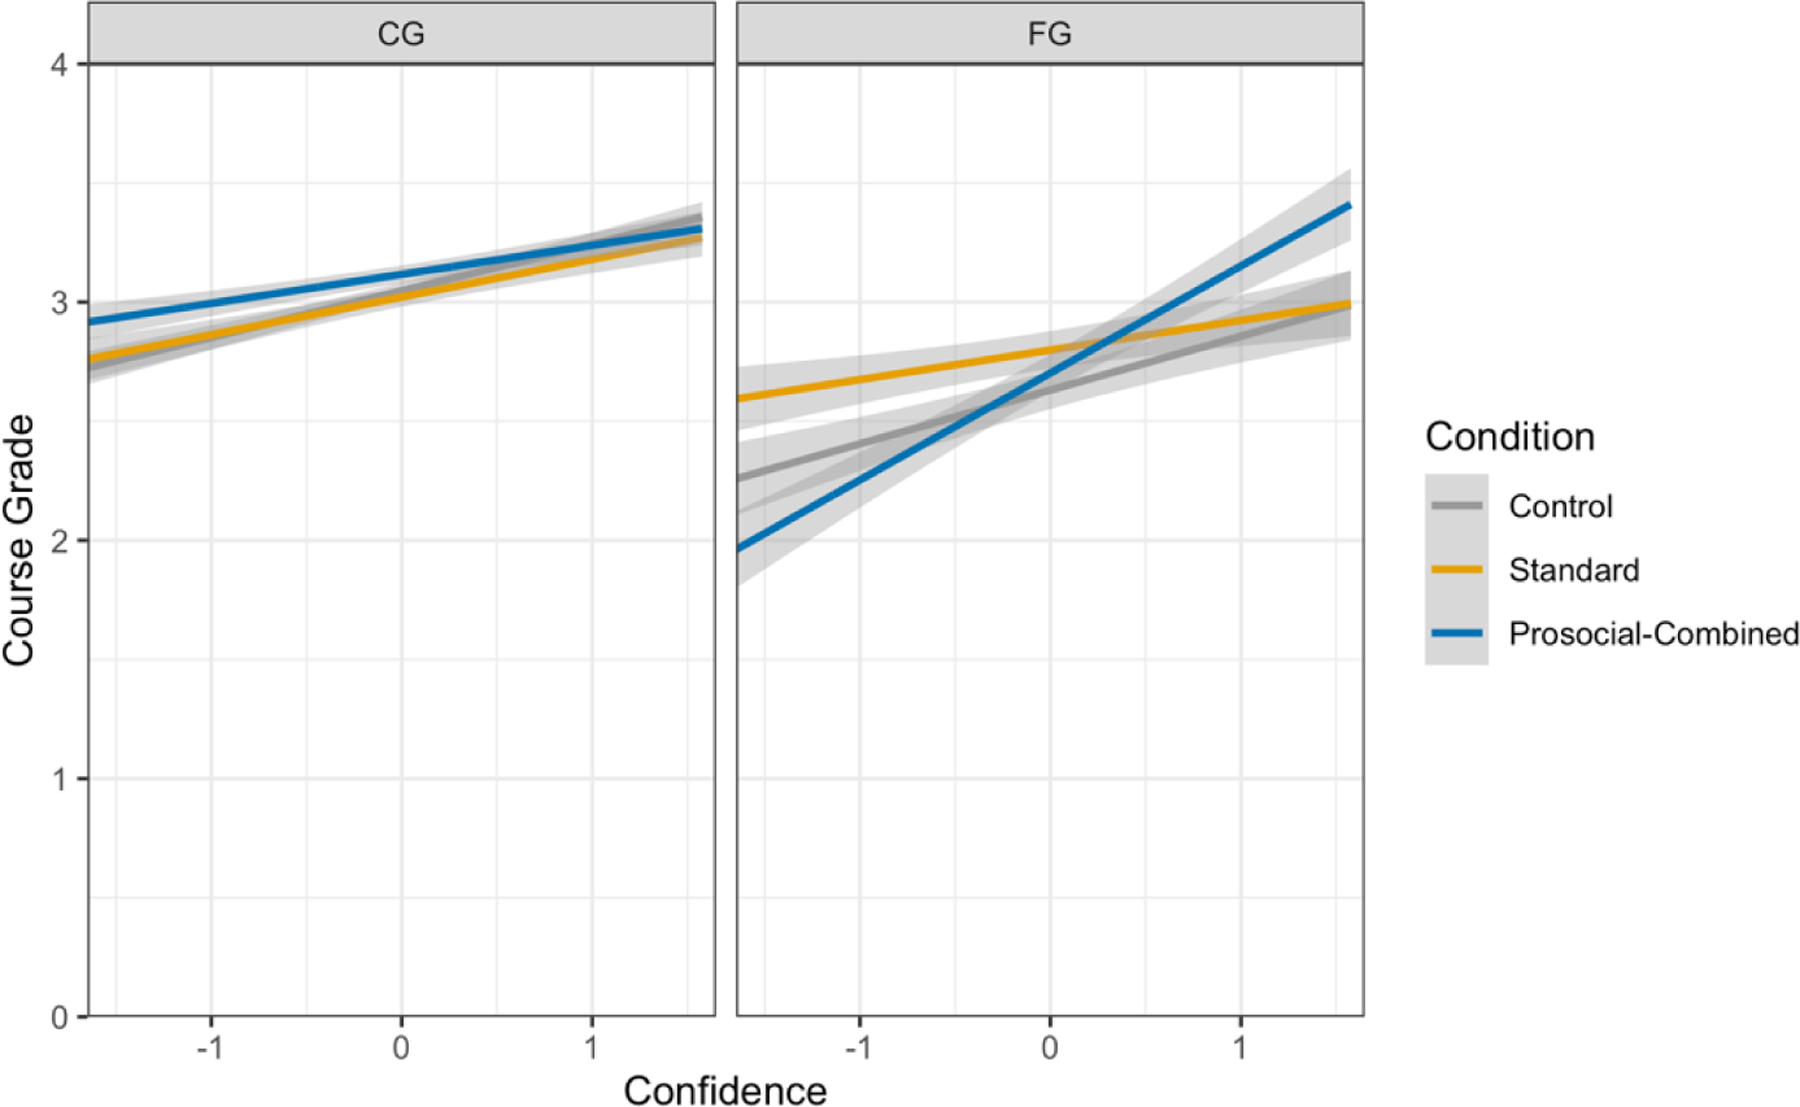
Course Grades by Experimental Condition, FG Status, and Confidence in the Three-Cell Design, Majority Students, Study 2a.
Note. Predicted values from the regression equations are graphed. Error envelopes represent +/− 1 standard error. Confidence was standardized.
There was also a significant Prosocial-Combined vs. Standard UVI × Semester interaction, β = .05, p = .032, indicating that the prosocial-combined UVI had a more positive effect on course grades for all students, on average, relative to the standard UVI, in the Spring semester compared to Fall semester (Figure 3).
Figure 3.
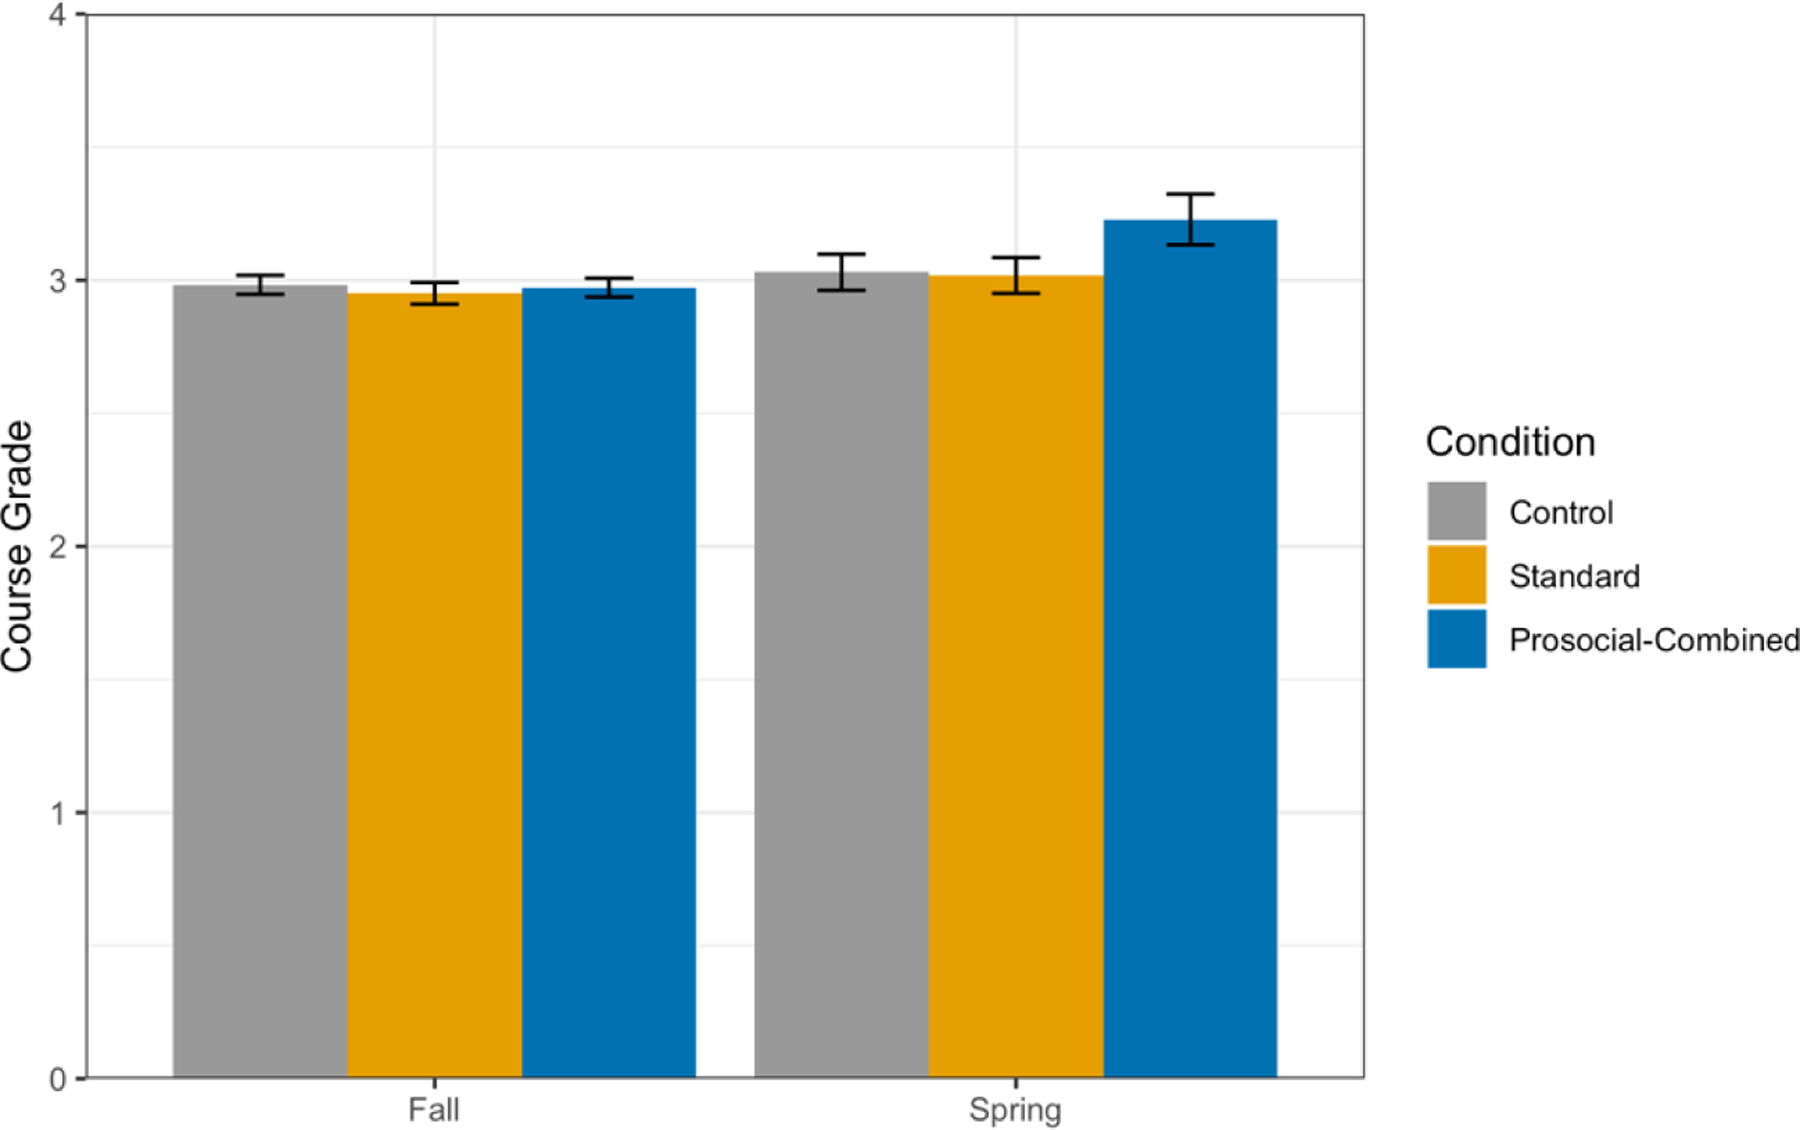
Course Grades by Experimental Condition and Semester in the Three-Cell Design, Majority Students, Study 2a.
Note. Error bars represent +/− 1 standard error of the mean.
To test whether the significant effects of the prosocial-combined intervention, relative to the standard intervention, were also significant relative to control, we also fit a secondary model that tested the effects of condition using dummy-coded contrasts (with control as the reference group). The model was otherwise identical to the primary model reported above. Significant interactions in this model again revealed benefits of the prosocial-combined UVI: (1) the prosocial-combined UVI had a more positive effect in Spring than Fall, β = .05, p = .045, relative to control, and (2) the prosocial-combined UVI had a more positive effect on course grades for FG students with higher levels of confidence, relative to control, β = .07, p = .021. To illustrate this effect, Figure 4 shows predicted scores for grades for FG and CG-majority students at one standard deviation above, below, or at the mean for confidence, in prosocial-combined and control conditions.
Figure 4.
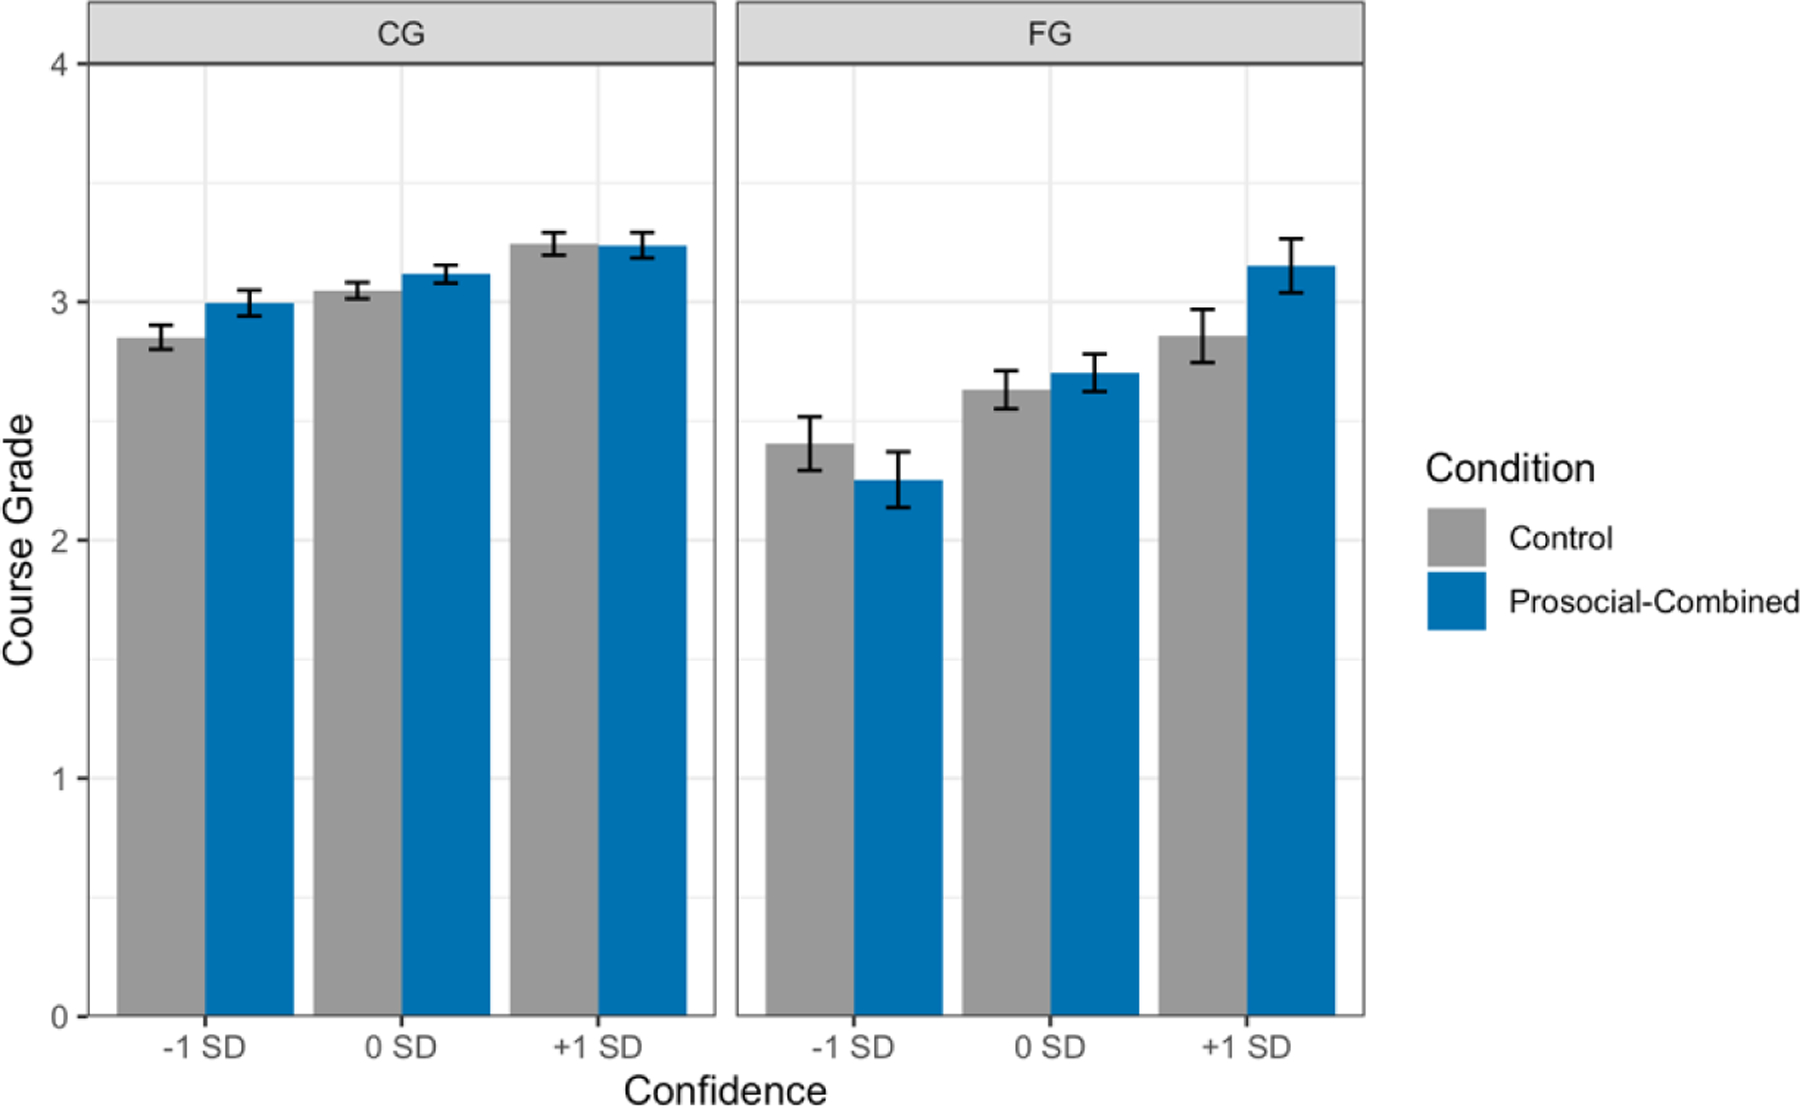
Course Grades in Prosocial-Combined and Control Conditions, FG Status, and Confidence in the Three-Cell Design (predicted values), Majority Students, Study 2a.
Note. Error bars represent +/− 1 standard error of the mean.
Considered together, these findings suggest that compared to both the standard UVI and control conditions, the prosocial-combined UVI improved grades for FG students with higher levels of confidence across semesters and it also improved grades in the class for all students, on average, by approximately 0.2 grade points in the Spring semester.
Study 2a: Motivation Outcomes in the Three-Cell Design with Majority Students
Regression results for motivation outcomes are reported in Table 9.
Interest in Chemistry.
Confidence, β = .21, p < .001, and prosocial chemistry motivation, β = .36, p < .001, were positively associated with interest. Students in the Spring semester reported higher levels of interest than those in the Fall semester, β = .07, p = .001. A significant Prosocial-Combined vs. Standard UVI × FG × Confidence interaction, β = .06, p =.009, showed that, compared to the standard UVI, the prosocial-combined UVI had a more positive effect on interest for FG-Majority students with higher levels of confidence. In contrast, the effect of the standard UVI was stronger for confident CG students, relative to the prosocial-combined UVI (Figure 5). In addition, a significant UVI × Semester interaction, β = .04, p =.038, indicated that the two UVIs had a more positive effect on interest in the Spring semester than they did in the Fall semester (Figure 6). These effects mirror a) the relative effects of prosocial-combined vs. standard UVI for FG students on course grade and b) the effect of the prosocial-combined UVI on grades in the Spring vs. Fall semester.
Figure 5.
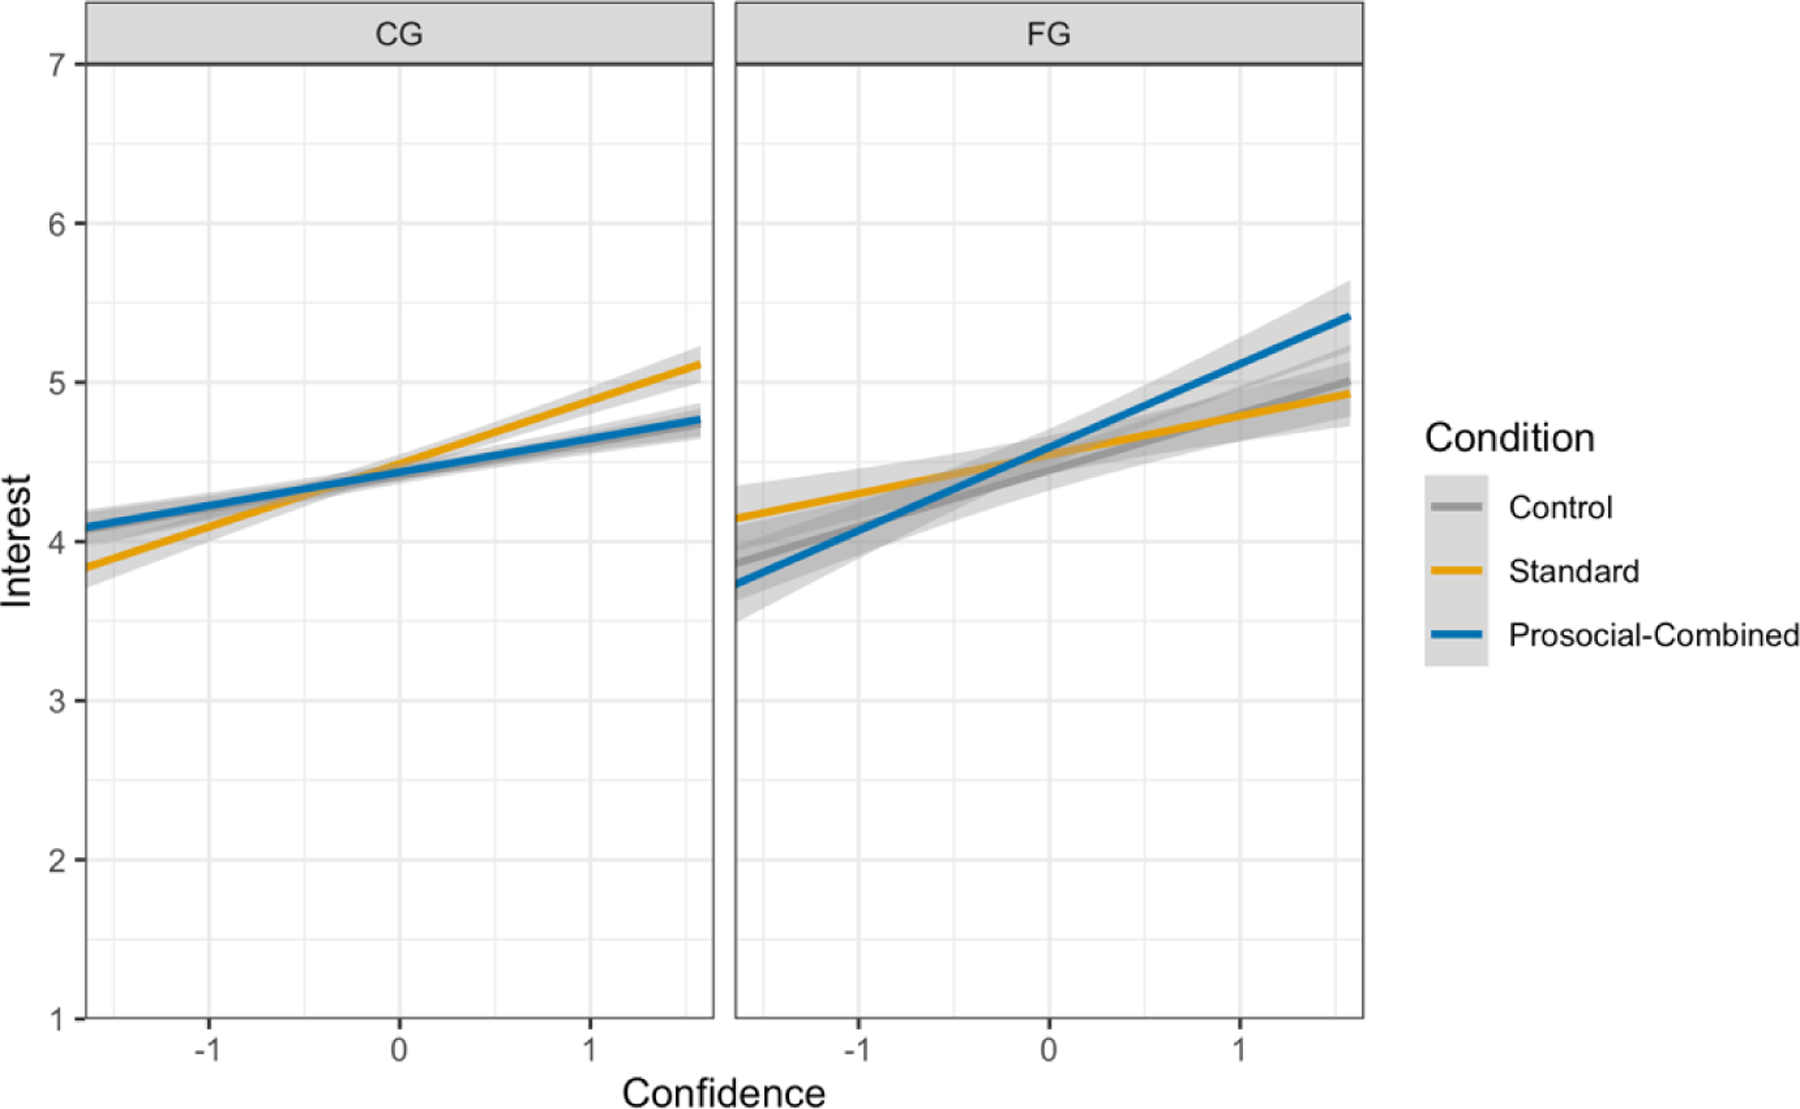
Interest by Experimental Condition, FG Status, and Confidence in the Three-Cell Design, Majority Students, Study 2a.
Note. Predicted values from the regression equations are graphed. Error envelopes represent +/− 1 standard error. Confidence was standardized.
Figure 6.
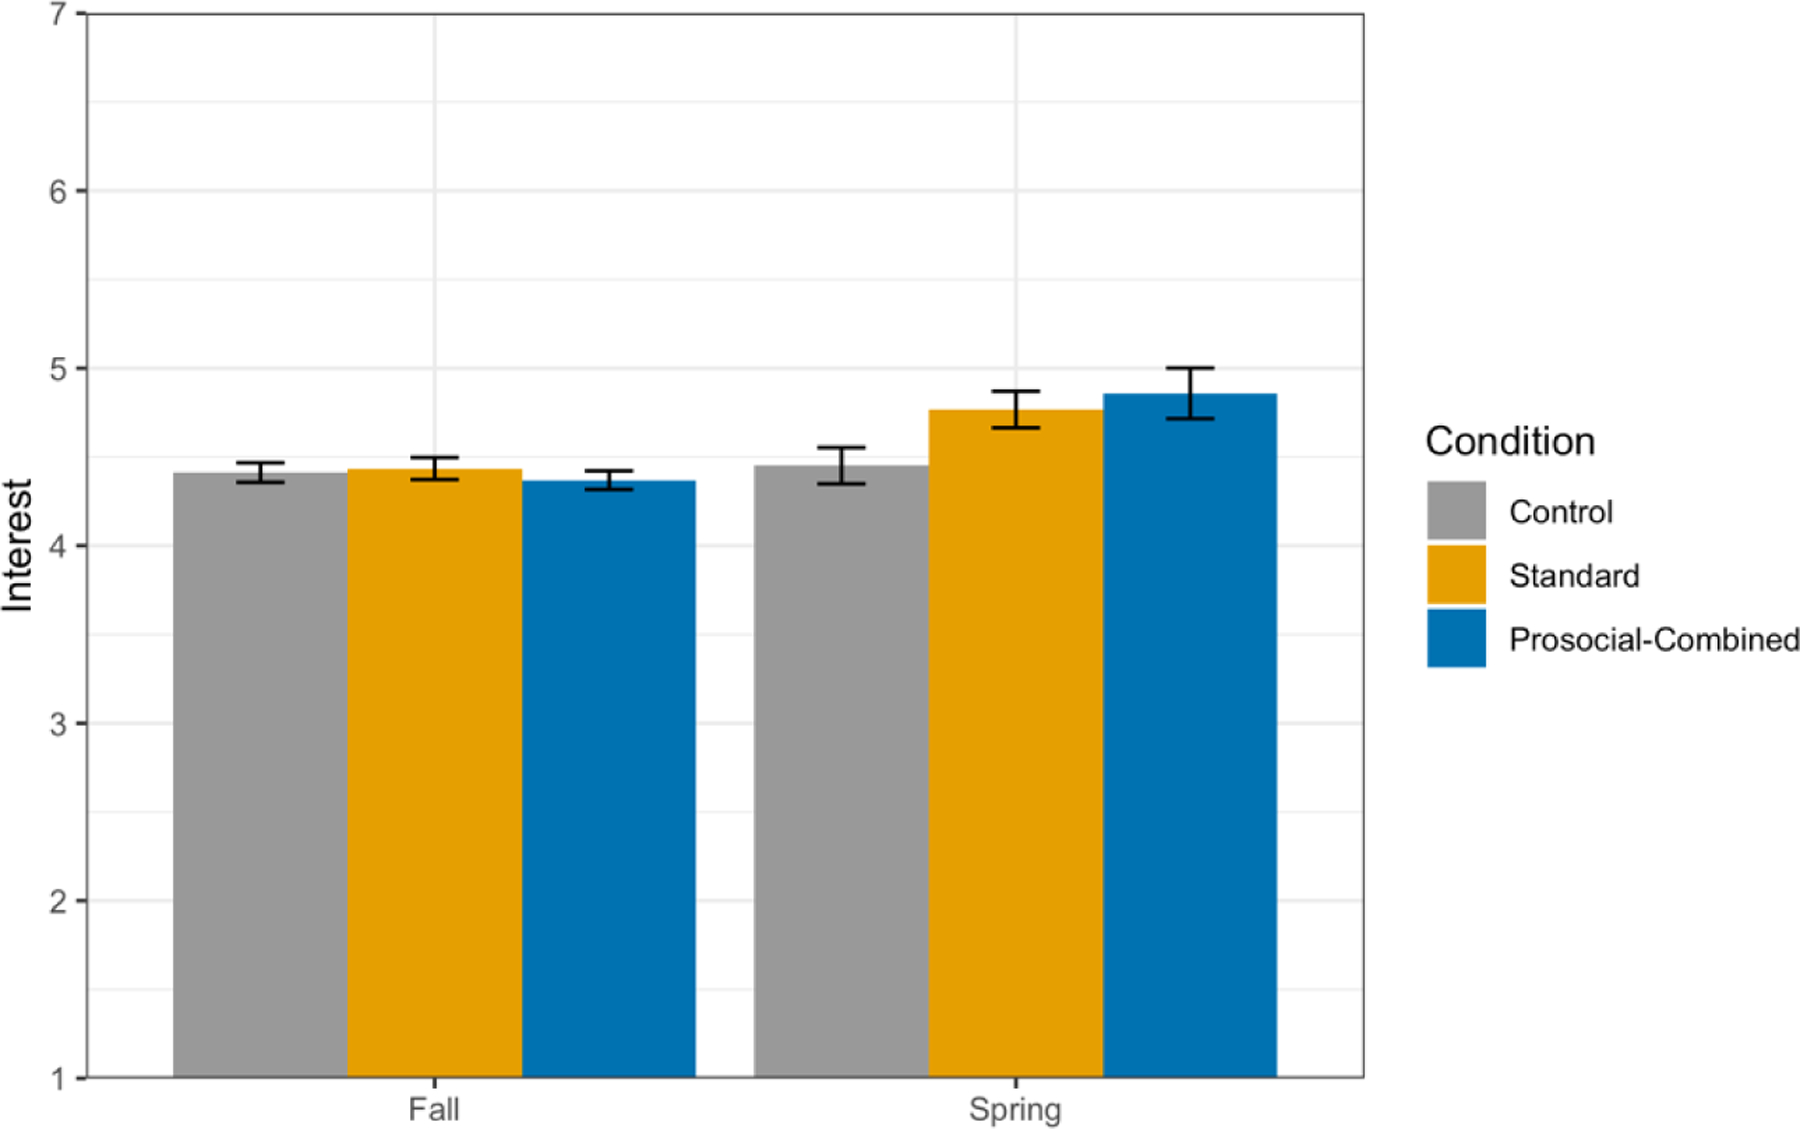
Interest by Experimental Condition and Semester in the Three-Cell Design in Study 2a.
Note. Error bars represent +/− 1 standard error of the mean.
To test whether the significant effects of the prosocial-combined intervention, relative to the standard intervention, were also significant relative to control, we fit a secondary model that tested the effects of condition using dummy-coded contrasts (with control as the reference group, just as we did to probe effects on course grade). The model was otherwise identical to the primary model reported above. Significant interactions in this model revealed benefits of the prosocial-combined UVI: (1) the prosocial-combined UVI had a more positive effect on interest in Spring than Fall, β = .05, p = .045, relative to control, and (2) confidence moderated the effects of the prosocial-combined UVI for FG students, relative to control, β = .07, p = .021. Compared to control, the prosocial-combined UVI had a more positive effect on interest to the extent that FG students were confident. Figure 7 shows predicted values for interest for FG and CG-majority students at one standard deviation above, below, or at the mean for confidence, in prosocial-combined and control conditions.
Figure 7.
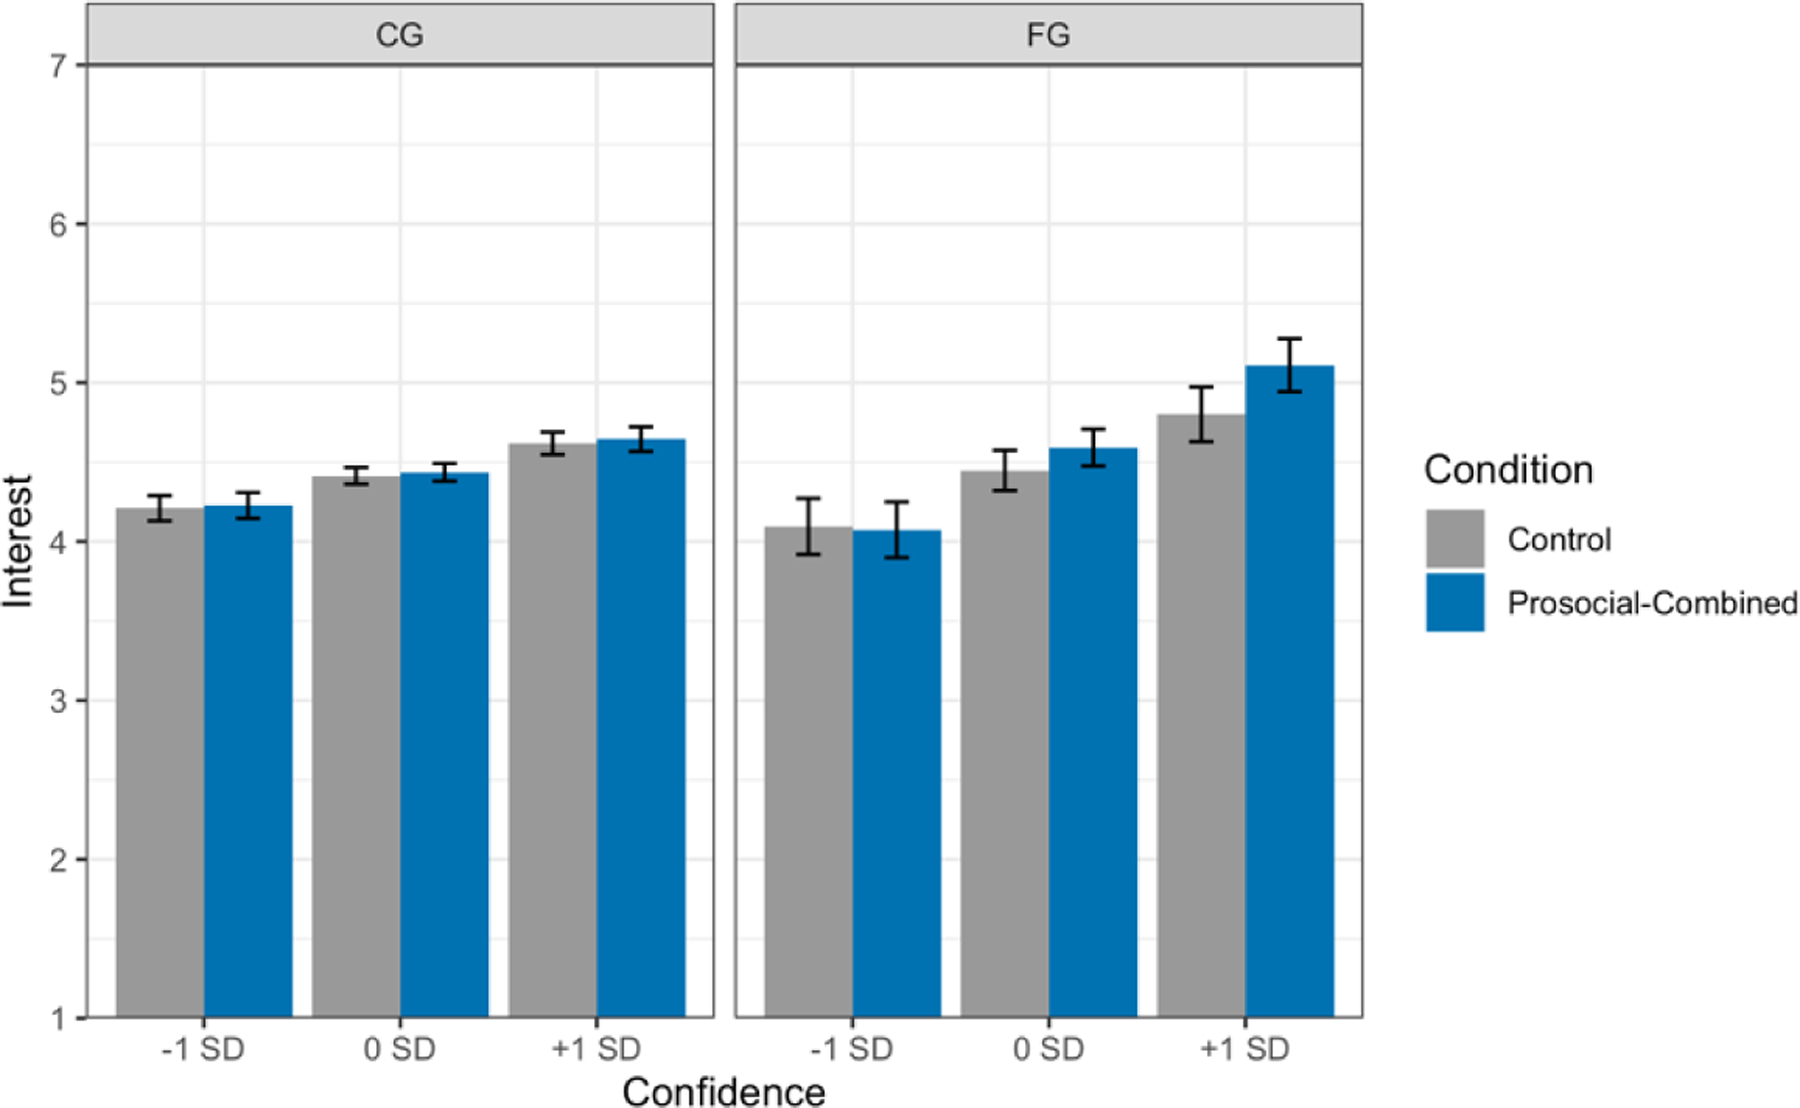
Interest in Prosocial-Combined and Control Conditions, FG Status, and Confidence in the Three-Cell Design (predicted values), Majority Students, Study 2a.
Note. Predicted values from the regression equations are graphed. Error envelopes represent +/− 1 standard error. Confidence is standardized.
Deeper Involvement.
Students with higher levels of confidence and those with higher levels of prosocial chemistry motivation reported stronger goals for deeper involvement in the chemical and health sciences (ps ≤ .002). An Intervention × prosocial chemistry motivation interaction, β = −.05, p = .021, indicated that both UVIs strengthened goals for deeper involvement among students who were lower in prosocial chemistry motivation (Figure 8). Although not significant, the pattern of the Prosocial-Combined vs. Standard UVI × FG × Confidence interaction, β = .04, p = .096, was similar to that for course grade and interest, suggesting that the effect of prosocial-combined UVI (compared to standard UVI) on deeper involvement was more positive for FG students with higher levels of confidence, relative to CG students (Figure 9, Panel A).
Figure 8.
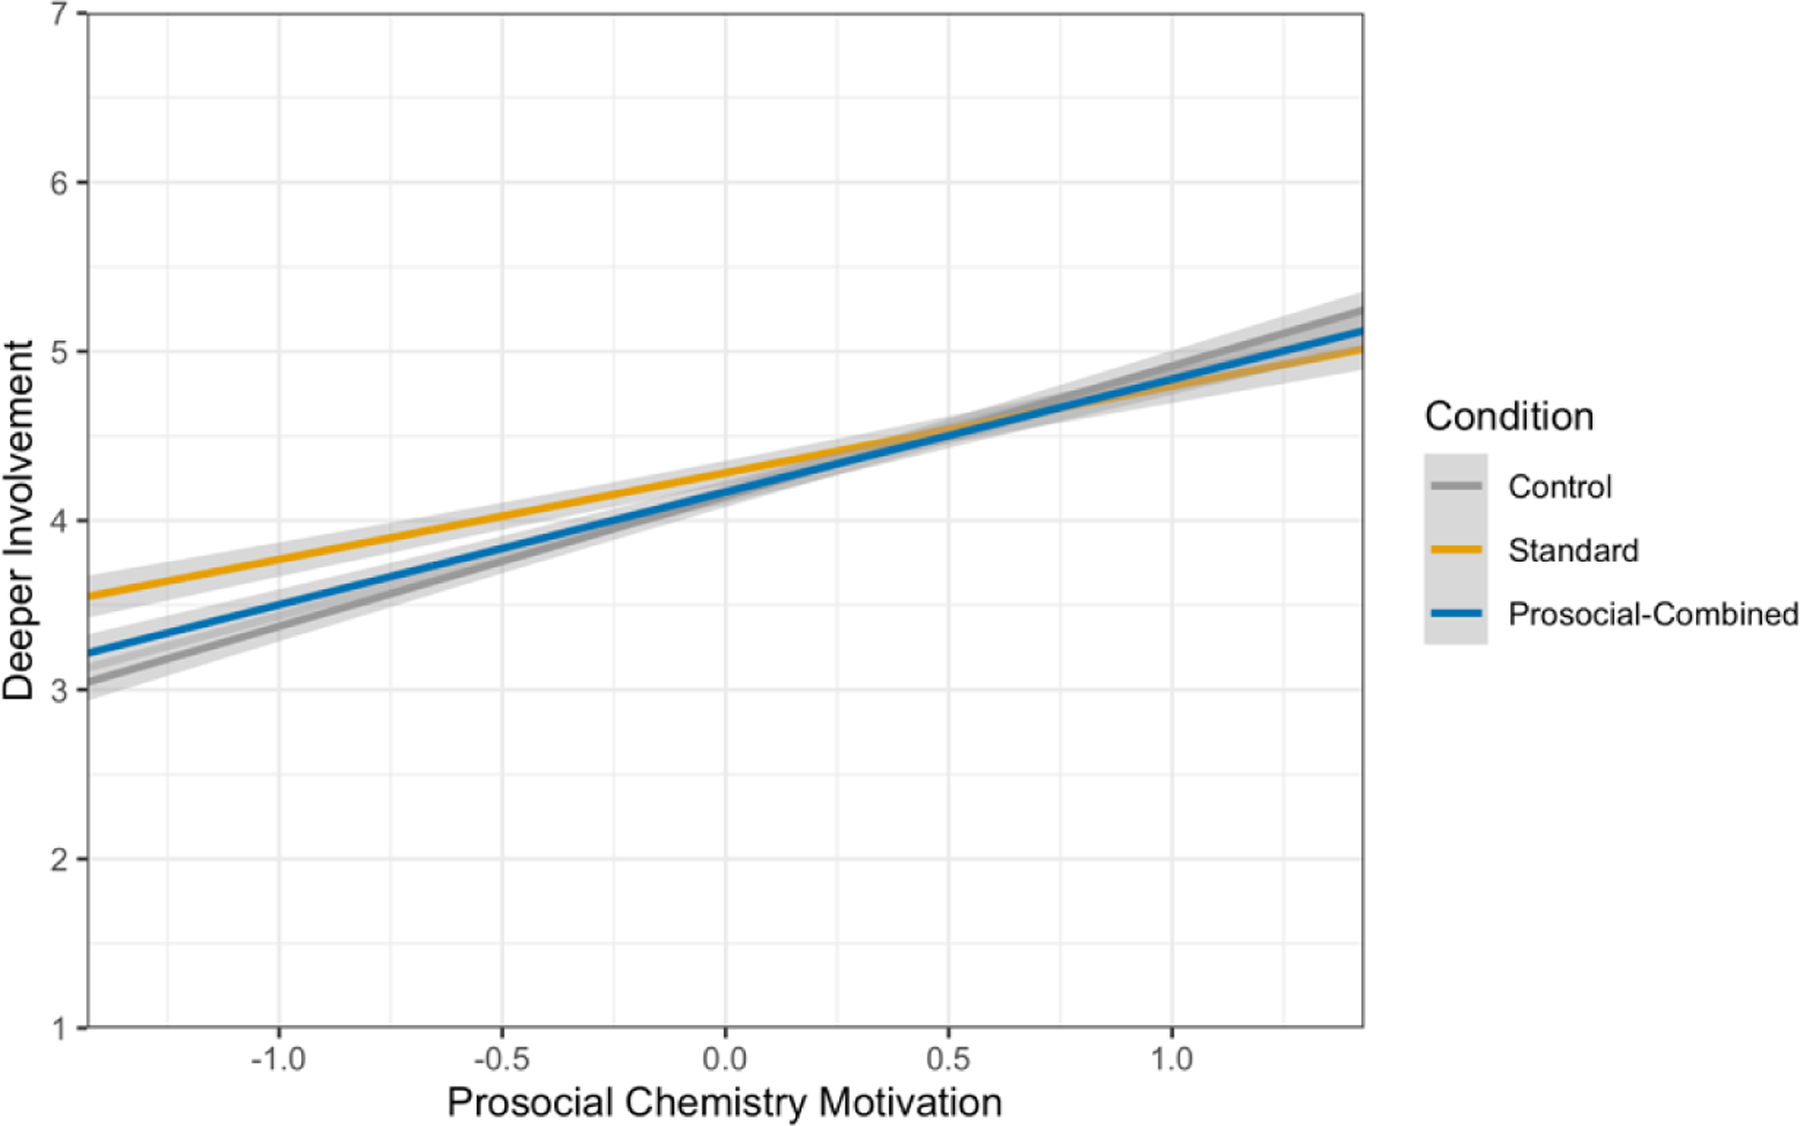
Deeper Involvement by Experimental Condition, FG Status, and Prosocial Chemistry Motivation in the Three-Cell Design, Majority Students, Study 2a.
Note. Predicted values from the regression equations are graphed. Error envelopes represent +/− 1 standard error. Confidence was standardized.
Figure 9.
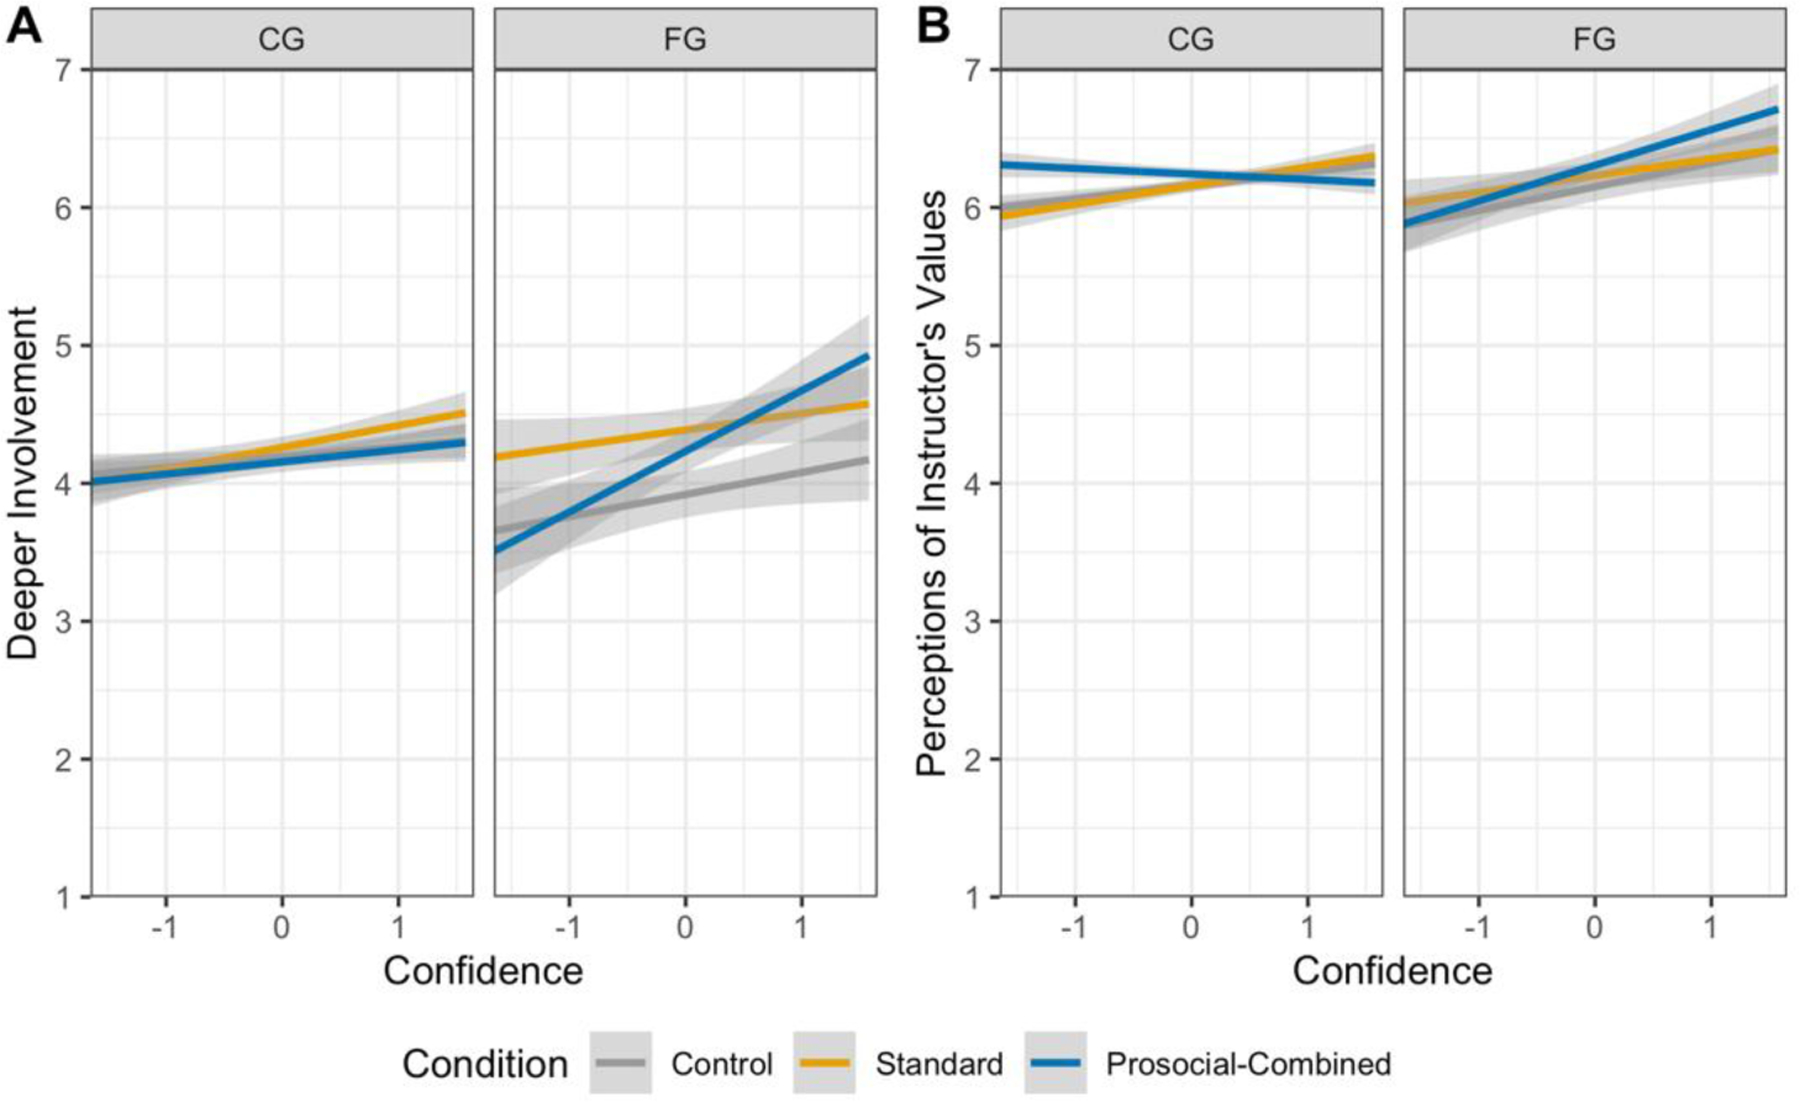
Deeper Involvement (Panel A) and Perceptions of Instructor’s Values (Panel B) by Experimental Condition, FG Status, and Confidence in the Three-Cell Design, Majority Students, Study 2a.
Note. Predicted values from the regression equations are graphed. Error envelopes represent +/− 1 standard error. Confidence was standardized.
Future plans.
Students with higher levels of confidence and those with higher levels of prosocial chemistry motivation reported stronger future plan in the chemical and health sciences (ps ≤ .012). In addition, students in the spring semester reported stronger future plans than those in the fall, β = .05, p = .026.
Perceptions of Instructor’s Values.
Students with higher levels of confidence, those with higher levels of prosocial chemistry motivation, and students in the Spring semester reported more prosocial perceptions of their instructor (ps ≤ .001). A significant Prosocial-Combined vs. Standard UVI × FG × confidence interaction, β = .05, p = .033, showed that compared to the standard UVI, the effect of prosocial-combined UVI was more positive for FG students with higher levels of confidence (Figure 9, Panel B). This effect was similar to the effects on course grade and interest. In addition, a significant UVI × Semester interaction, β = .05, p = .023, indicated that intervention effects varied by Semester: students in both UVI conditions reported higher perceptions of instructor’s prosocial values, relative to control, in Spring, but not in Fall semester. This effect was similar to the semester effect on interest.
Mediation Analysis
We found a three-way interaction indicating that the prosocial-combined UVI improved grades for confident FG students, relative to the standard UVI. We found the same interaction on interest, which was hypothesized to mediate UVI effects on course grades. Accordingly, we tested whether interest mediated the three-way interaction on course grades (see Figure 10).
Figure 10.
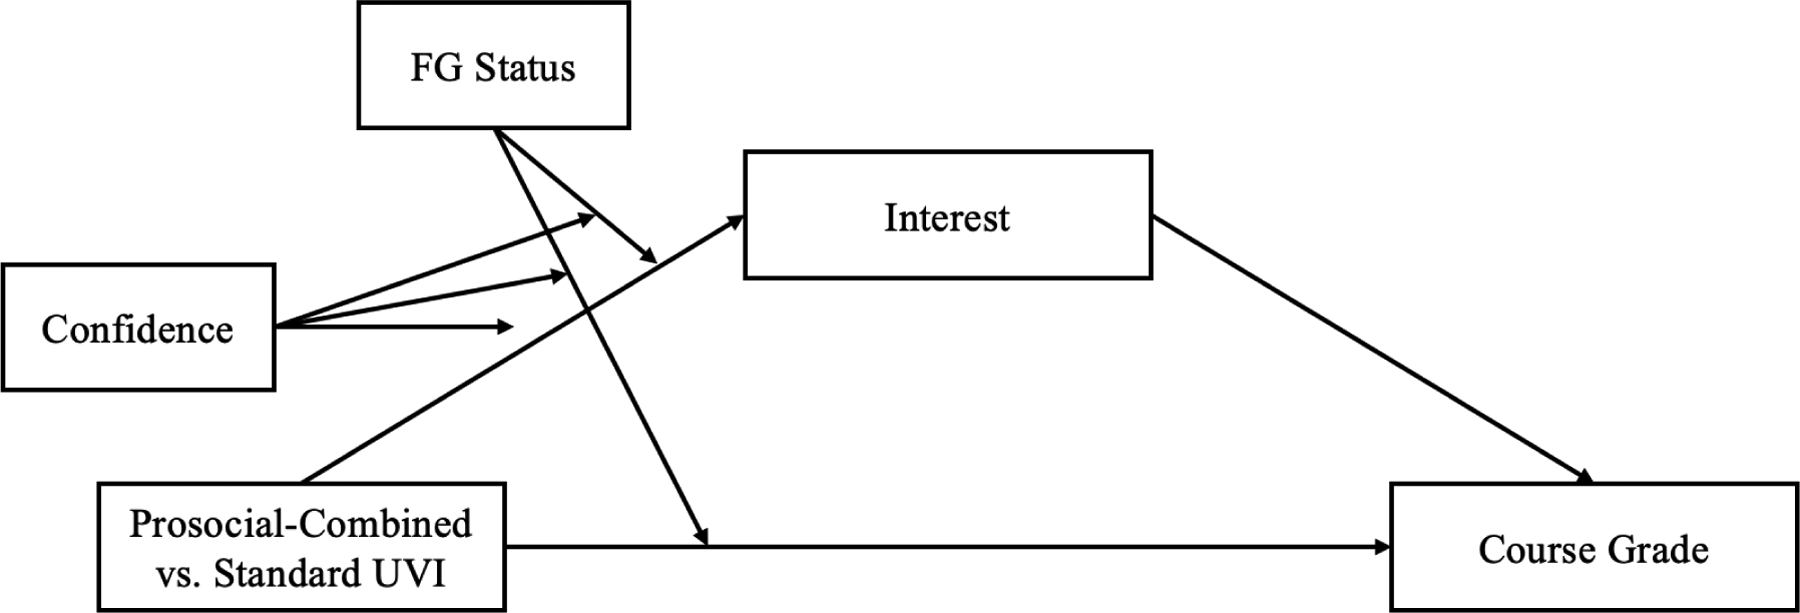
Conceptual Moderated Mediation Model for the Prosocial-Combined × FG × Confidence interaction on Course Grade in Study 2a.
To test for moderated mediation, we fit a path model in R with the lavaan package and used a bootstrapping procedure to obtain standard errors (Rosseel, 2012). For this model, we computed an index of moderated mediation (Hayes, 2015), testing whether the indirect effect through interest was moderated by FG status and confidence. Full results of this mediation analysis are reported in Table 11. The index of moderated mediation was statistically significant, 95% CIs [0.026, 0.176], suggesting that the Prosocial-Combined vs. Standard UVI × FG × confidence interaction on course grade was partially mediated by interest.9
Table 11.
Moderated Mediation of Prosocial × FG × PC Effect on Course Grade, Three-Cell Design, Majority Students
| DV: Interest | β | SE | CI Lower | CI Upper |
|---|---|---|---|---|
| UVI | .04 | 0.042 | −0.042 | 0.128 |
| Prosocial | −.05 | 0.054 | −0.158 | 0.056 |
| FG | .06 | 0.054 | −0.038 | 0.169 |
| Confidence | .22 | 0.024 | 0.169 | 0.265 |
| PCM | .36 | 0.022 | 0.316 | 0.403 |
| Spring | .18 | 0.055 | 0.069 | 0.286 |
| Gender | −.13 | 0.044 | −0.208 | −0.036 |
| UVI × FG | .03 | 0.115 | −0.192 | 0.253 |
| Prosocial × FG | .11 | 0.129 | −0.169 | 0.351 |
| UVI × Confidence | .06 | 0.048 | −0.044 | 0.152 |
| Prosocial × Confidence | −.08 | 0.060 | −0.203 | 0.026 |
| UVI × PCM | −.03 | 0.044 | −0.116 | 0.058 |
| Prosocial × PCM | .03 | 0.056 | −0.080 | 0.131 |
| UVI × Spring | .22 | 0.110 | −0.003 | 0.435 |
| Prosocial × Spring | .07 | 0.144 | −0.227 | 0.345 |
| UVI × Gender | −.03 | 0.089 | −0.205 | 0.148 |
| Prosocial × Gender | −.06 | 0.110 | −0.278 | 0.162 |
| FG × Confidence | .08 | 0.052 | −0.024 | 0.189 |
| FG × Gender | −.01 | 0.115 | −0.239 | 0.203 |
| Gender × Confidence | .09 | 0.046 | −0.002 | 0.180 |
| UVI × FG × Confidence | −.06 | 0.103 | −0.270 | 0.135 |
| Prosocial × FG × Confidence | .35 | 0.135 | 0.092 | 0.623 |
| UVI × FG × Gender | .50 | 0.259 | −0.038 | 1.004 |
| Prosocial × FG × Gender | .38 | 0.277 | −0.154 | 0.926 |
| UVI × Gender × Confidence | .12 | 0.091 | −0.073 | 0.293 |
| Prosocial × Gender × Confidence | −.04 | 0.119 | −0.291 | 0.171 |
| DV: Course grade | ||||
| UVI | .02 | 0.040 | −0.060 | 0.098 |
| Prosocial | .08 | 0.047 | −0.016 | 0.169 |
| FG | −.37 | 0.054 | −0.478 | −0.261 |
| Confidence | .12 | 0.022 | 0.078 | 0.166 |
| PCM | −.11 | 0.021 | −0.154 | −0.073 |
| Spring | .19 | 0.049 | 0.092 | 0.286 |
| Gender | .04 | 0.041 | −0.045 | 0.118 |
| UVI × FG | .10 | 0.111 | −0.116 | 0.314 |
| Prosocial × FG | −.17 | 0.129 | −0.433 | 0.073 |
| UVI × Confidence | −.05 | 0.045 | −0.140 | 0.044 |
| Prosocial × Confidence | .05 | 0.053 | −0.051 | 0.160 |
| UVI × PCM | .01 | 0.041 | −0.073 | 0.088 |
| Prosocial × PCM | −.06 | 0.048 | −0.156 | 0.039 |
| UVI × Spring | .06 | 0.093 | −0.131 | 0.236 |
| Prosocial × Spring | .26 | 0.129 | −0.004 | 0.505 |
| UVI × Gender | .03 | 0.086 | −0.143 | 0.190 |
| Prosocial × Gender | .03 | 0.101 | −0.175 | 0.234 |
| FG × Confidence | .08 | 0.054 | −0.030 | 0.187 |
| FG × Gender | .24 | 0.105 | 0.037 | 0.443 |
| Gender × Confidence | −.08 | 0.045 | −0.169 | 0.012 |
| UVI × FG × Confidence | .13 | 0.113 | −0.093 | 0.356 |
| Prosocial × FG × Confidence | .26 | 0.127 | 0.016 | 0.513 |
| UVI × FG × Gender | .00 | 0.237 | −0.471 | 0.480 |
| Prosocial × FG × Gender | .25 | 0.275 | −0.290 | 0.783 |
| UVI × Gender × Confidence | .03 | 0.091 | −0.147 | 0.216 |
| Prosocial × Gender × Confidence | .09 | 0.110 | −0.137 | 0.303 |
| Interest | .28 | 0.023 | 0.232 | 0.326 |
| Index of Moderated Mediation | Index | SE | CI Lower | CI Upper |
| .10 | 0.038 | 0.026 | 0.176 |
Note. Confidence intervals are determined using a bootstrap sample size of 1,000. CI Lower and CI Upper represent the lower and upper bounds of the 95% confidence interval. UVI = UVI (+.33) vs. Control (−.67); Prosocial = Prosocial-Combined (+.5) vs. Standard UVI (−.5). Confidence was standardized and all other predictors were mean centered.
Prosocial Motivation
Our new measure of prosocial chemistry motivation had a significant positive effect on all motivational outcomes. Specifically, students who reported that they wanted to study chemistry because of a desire to make a contribution to society, give back to their community, and/or believed that a background in chemistry would allow them to help other people were more likely to report higher levels of interest in chemistry at the end of the class, stronger goals for deeper involvement and future plans in the chemical and health sciences, and perceive their instructors as valuing prosocial applications of chemistry. Considered together, these results suggest that prosocial motivation can be important for all students.
We expected that a prosocial UVI might be especially effective for FG students, in part, because these students tend to show a higher degree of prosocial motivation than CG students. Interestingly, however, positive UVI effects for FG students in the present study were significant when controlling for prosocial chemistry motivation, suggesting that the intervention effects were not simply explained by their relatively higher scores on this general measure of prosocial motivation. There are two possible explanations for this interesting finding. First, it could be that other characteristics of FG students were also important in accounting for their positive responses to the UVIs. Indeed, these students’ background characteristics (e.g., ACT scores, high school GPA) suggest that they may have been especially at risk for poor outcomes and therefore poised to benefit more from intervention effects. Second, our measure of prosocial chemistry motivation was a general measure (i.e., it included items about giving back to one’s community, society, and to helping generally). However, as discussed previously, such a general measure may not sufficiently capture FG students’ particular types of prosocial motivation. For example, as indicated by our baseline analyses, FG students are especially motivated to give back specifically to their family and communities. Therefore, the prosocial science motivation measure may not explain effects for FG students because it does not capture the aspects of prosocial motivation that are most relevant to their sensitivity to the intervention.
Further Exploration of Intervention Mechanisms
To further examine the dynamics of the intervention effects, we explored other variables that would help illuminate the motivational pathways through which the UVIs influenced the way FG students wrote their essays and the grades they received on their writing assignments. We also explored background and motivation variables that could help explain semester differences in motivation and performance.
How Did This Intervention Work to Help FG Students? A Closer Analysis
In addition to the preregistered test of mediation, we explored other variables that provide insight into how the UVIs influenced motivation and performance for FG-majority students. We examined the frequency of prosocial connections in students’ essays (a human-coded variable), as well as the linguistic content of the essays, using the prosocial and communion dictionaries (see Studies 1a and 1b) as a function of intervention condition, FG status, and confidence, using the same regression model described above for all outcome measures. Full results of all regressions involving linguistic variables are presented in Table 10. We found that all students, on average, wrote about prosocial connections in their essays more often in both UVI conditions, relative to control, and more in prosocial-combined relative to standard conditions, replicating Studies 1a and 1b. Critically, these effects were significantly stronger for FG, relative to CG, majority students. This same pattern emerged on both LIWC dictionaries, suggesting that relative to CG students, FG-majority students found more prosocial connections and used more prosocial words in UVI conditions, and especially in the prosocial-combined condition (see Table 10 and Figure 11).
Figure 11.
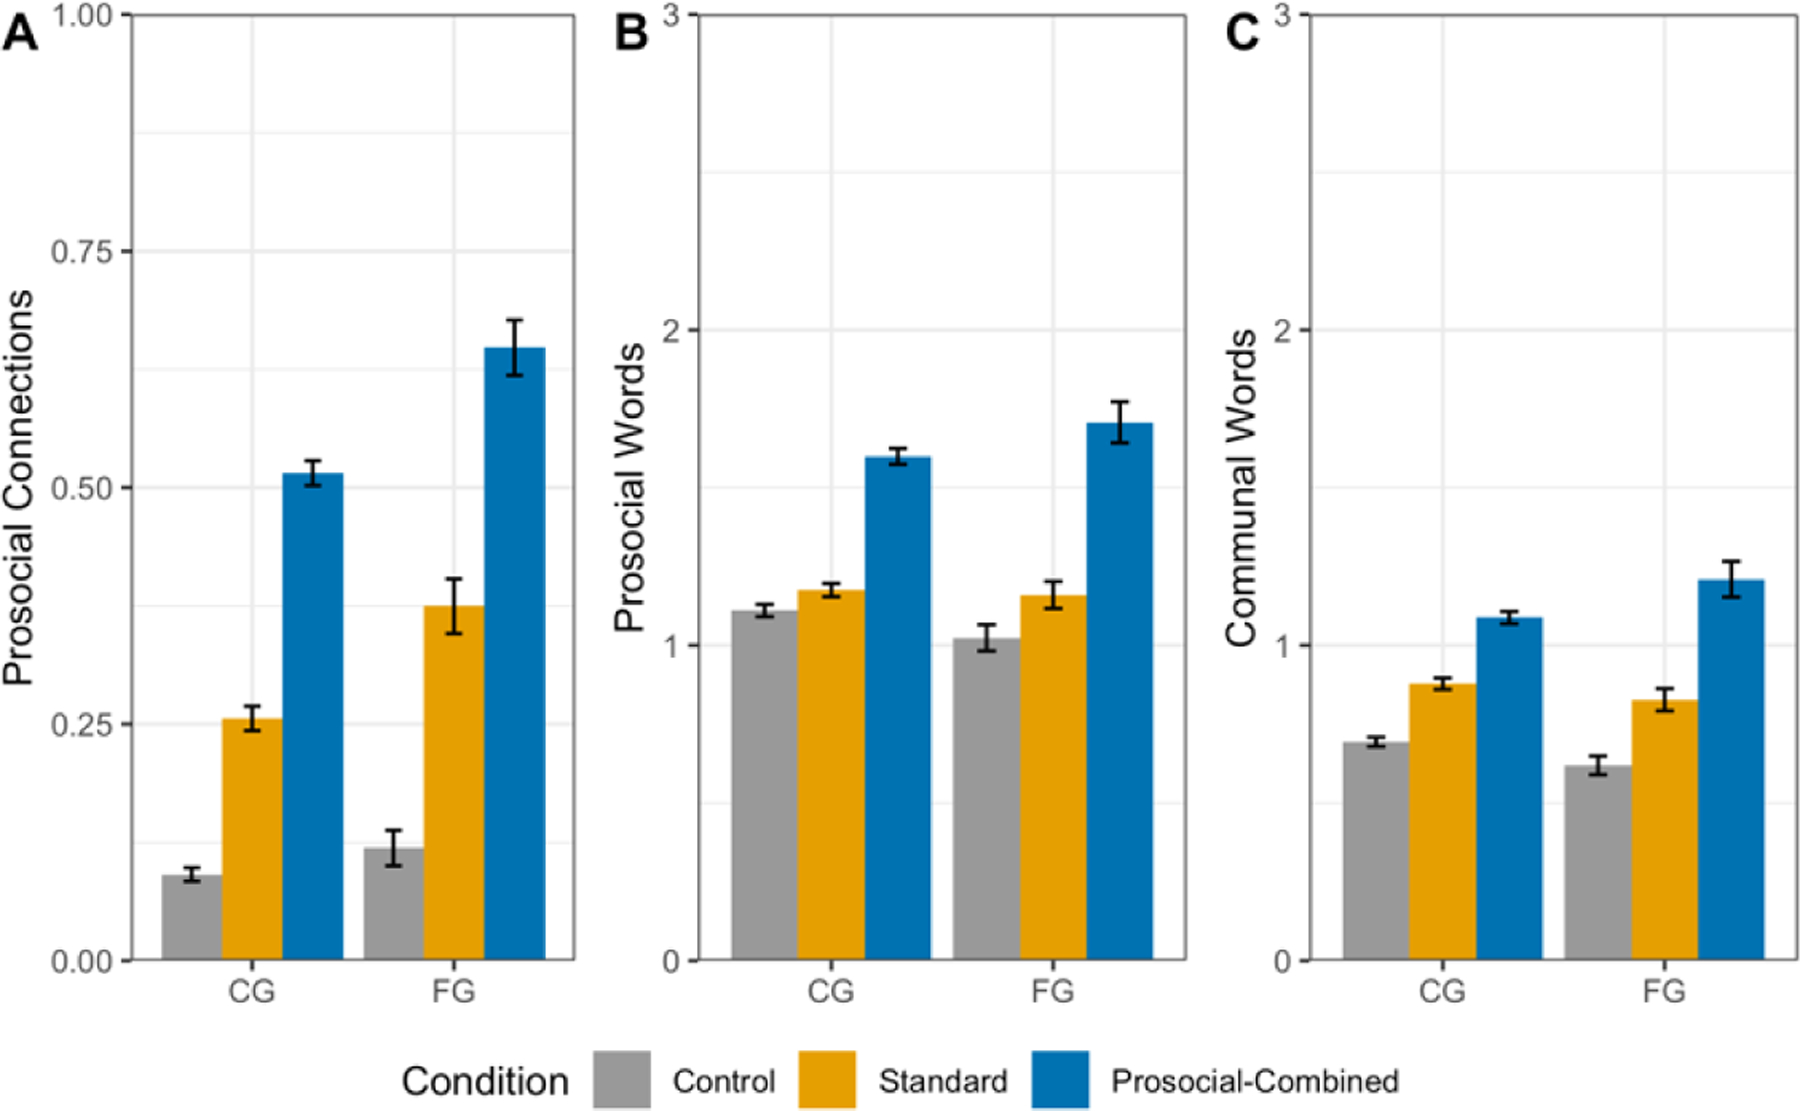
Prosocial Connections (Panel A), Prosocial Words (Panel B), and Communal Words (Panel C) by Experimental Condition and FG Status in the Three-Cell Design in Study 2a.
Note. Error bars represent +/− 1 standard error of the mean.
Essay Grades.
CG students and students in the Fall semester earned higher essay grades (ps < .001). There was also a main effect of the UVI contrast, β = .05, p = .022, indicating that students in the two UVI conditions earned higher essay grades than those in the control condition. Critically, the positive effect of the UVI contrast was qualified by a significant UVI × FG interaction, β = .05, p = .014, showing that the UVIs increased essay grades for FG-majority students, but not for CG-majority students, across semesters (Figure 12).
Figure 12.
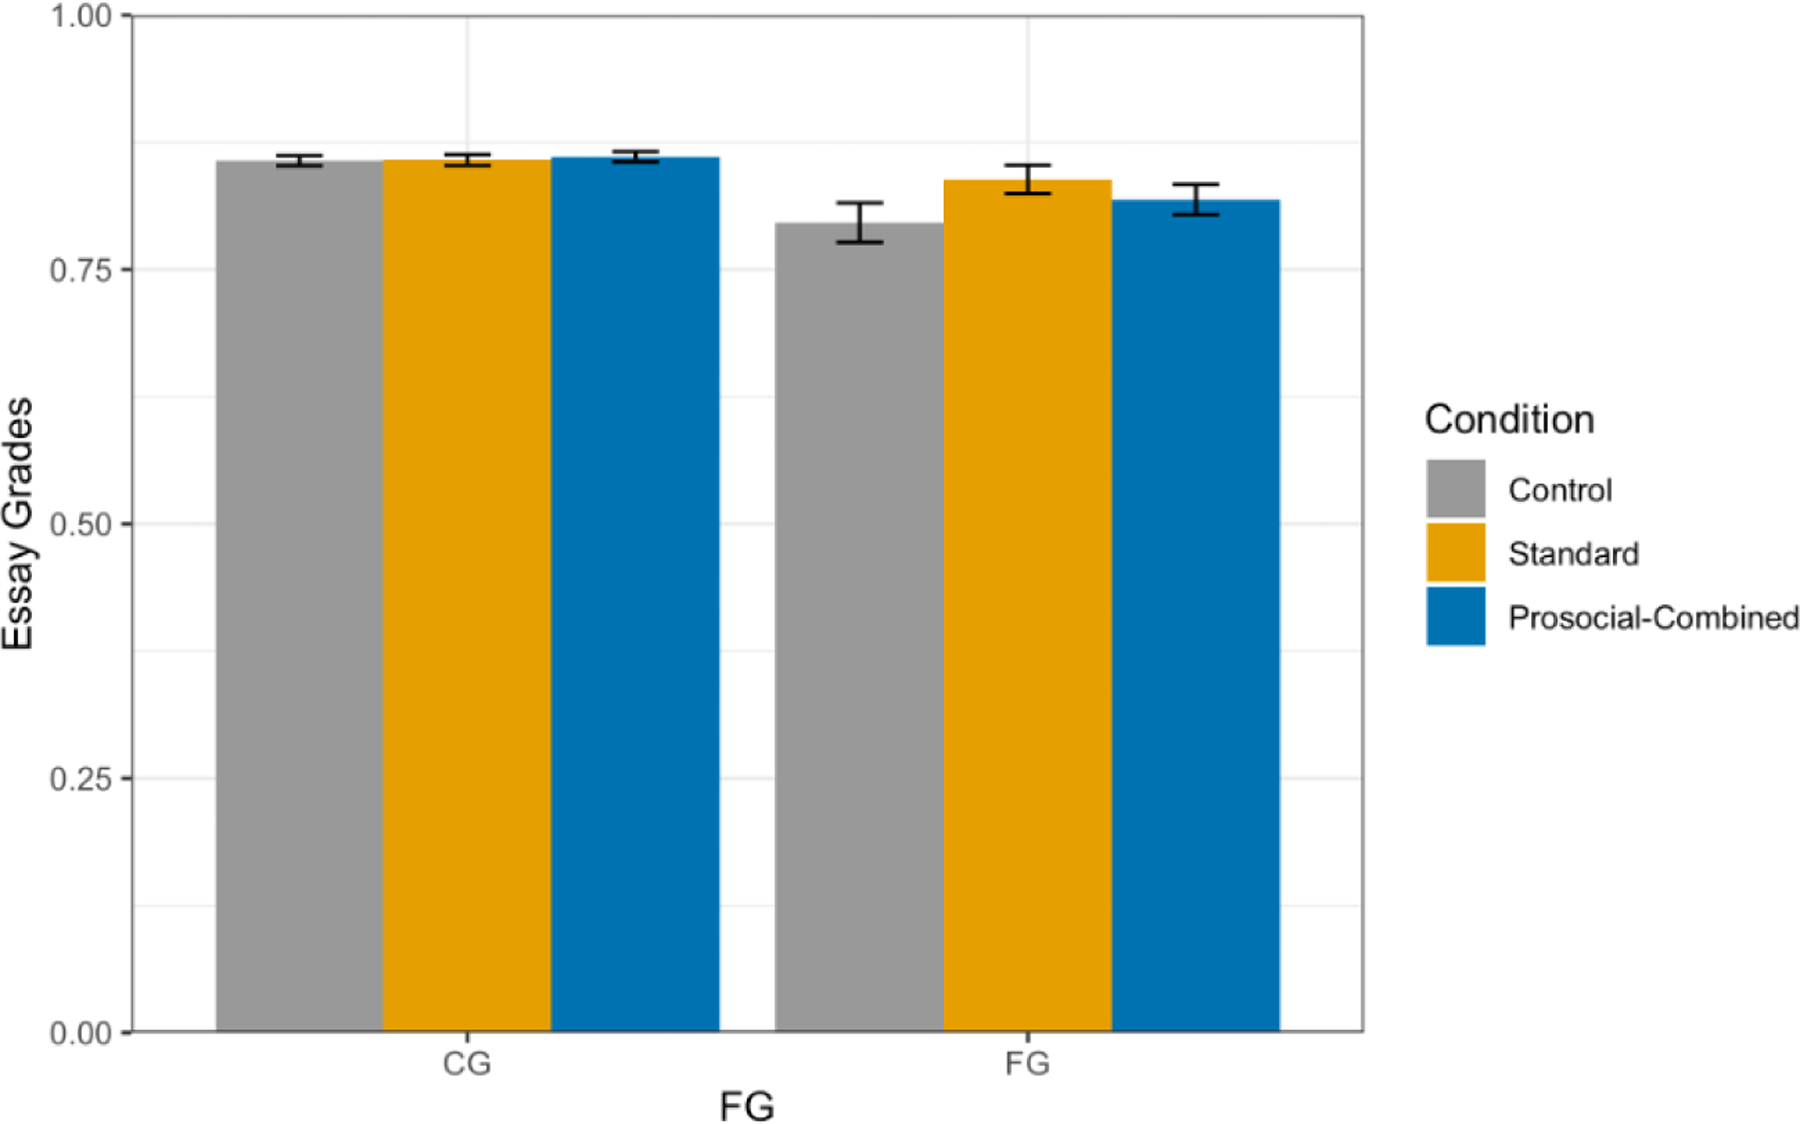
Essay Grades by Experimental Condition and FG Status in the Three-Cell Design, Majority Students, Study 2a.
Note. Error bars represent +/− 1 standard error of the mean.
In sum, FG-majority students discussed more prosocial connections, used more prosocial words, and earned higher essay grades in the two UVI conditions, relative to control, suggesting that both types of UVI may have inspired them to write stronger essays. Considered together, these findings provide insight into how the UVIs helped FG-majority students perform better on the UVI assignments—that is, by providing a course assignment that allowed them to explore and write about the utility value of course content in a personal way. In turn, this may have changed their experiences in the class, with implications for interest and course performance. Notably, these effects were not moderated by confidence. All FG-majority students, on average, showed this positive response to the prosocial-combined UVI.
What do Semester Differences Tell Us about Intervention Dynamics?
Students who take this course in the Spring semester are considered “off-track,” with respect to many pre-medical and STEM degree programs that have prescribed programs of course-taking. There are many reasons students might get a “late start” on chemistry (academic pre-requisites, background, changes in plans/interests), but it is important to note that it is not too late for students interested in STEM degrees. Students who took this introductory chemistry class in Spring differed from those who took it in Fall in many ways. First, there were relatively more FG, URM, and female students in the Spring semester (29%, 16%, 69%, respectively) compared to Fall (16%, 8%, 53%, respectively). Even when these demographic variables were controlled in our baseline analyses, we found significant semester differences revealing that ACT scores, family income, and high school GPA, were all significantly lower for Spring semester students, ps < .001, and that FRL was somewhat higher in the Spring, p = .052, compared to Fall semester (see Table 7). This pattern suggests that students who took the course in Spring were higher on many variables thought to indicate a risk for poor performance (e.g., lower ACT, high school GPA), in the same way that FG and URM students have been considered to be at risk.
With respect to differences in motivation measures, students who took the course in Spring reported significantly higher levels of concern about background and lower levels of confidence, compared to students in Fall, p <.001. Linguistic analyses conducted in the control group showed that analytic scores were lower in the Spring semester compared to the Fall, p < .001. Considered together, these background, motivation, and linguistic differences between the two semesters suggest that students who took the course in the Spring (off-sequence) may have entered the course relatively less academically prepared than those who took the course in the Fall (on-sequence). The prosocial-combined UVI may have been more effective in Spring semester because there were more students at risk of poor performance in the class. This analysis is consistent with previous findings that social-psychological interventions have proven particularly effective for students with a history of low grades and students who face structural or societal barriers to success (Harackiewicz & Priniski, 2018; Walton & Wilson, 2018).
However, semester differences may also be attributable, in part, to differences in the way the course was taught. We interviewed the instructors of the course (who taught in both fall and spring) and they confirmed that the structure and content of the course was identical across semesters, but they also indicated that they provided students with more help and scaffolding (e.g., asking for answers to intermediate steps on quizzes/exams) in the Spring semester. This may have created a supportive context in which both the standard and prosocial-combined UVIs had more potential to spark interest and confidence for all students. That is, this difference in instructor support may have helped to create a different educational context in Spring than Fall. Whether we think of this contextual difference as due to students’ backgrounds or different instructional supports, or the combination, it seems clear that this Spring context was one in which reflecting on the personal and prosocial utility value of chemistry changed students’ interest in chemistry, helping them to perform better in the class.
Study 2b: What Were the Effects of the UVI for URM Students in the Two-Cell Design?
As noted earlier, there were not enough URM students in our sample to test more than one intervention versus control, due to power concerns, and this problem was exacerbated by the decision to change the intervention between Fall and Spring semesters, after a check for adverse outcomes revealed that URM students performed more poorly in the prosocial-combined condition in the Fall semester, relative to control (d = −.25). We therefore assigned URM students to the standard UVI in the Spring semester, resulting in smaller numbers of URM students in each UVI condition: prosocial-combined (Fall): 60 CG-URM, 31 FG-URM students; standard (Spring): 17 CG-URM, 21 FG-URM students; control (Fall and Spring): 74 CG-URM, 53 FG-URM students. Accordingly, we grouped the two UVI conditions to analyze together as “intervention,” with a single Intervention vs. Control contrast. As discussed below, this makes it difficult to interpret differences in results between Fall and Spring semesters.
We regressed each outcome on the Intervention contrast, which tested the effects of receiving either a prosocial-combined or a standard UVI, relative to control, FG status, confidence, prosocial chemistry motivation, semester, gender, and the two-way interactions between the Intervention contrast and each of these other predictors. We could not test any three-way (or higher-order) interactions due to power considerations. Descriptive statistics and correlations for all variables tested in Study 2b are presented in Tables 6.
Table 6.
Descriptives and Correlations for Study 2b Two-Cell Design
| 1 | 2 | 3 | 4 | 5 | 6 | 7 | 8 | 9 | 10 | 11 | 12 | 13 | 14 | 15 | 16 | |
|---|---|---|---|---|---|---|---|---|---|---|---|---|---|---|---|---|
| 1. ACT | ||||||||||||||||
| 2. High School GPA | .28 | |||||||||||||||
| 3. Family income | .41 | .01 | ||||||||||||||
| 4. High School Pct. FRL | −.40 | −.04 | −.45 | |||||||||||||
| 5. Baseline Interest | −.05 | −.06 | .08 | .09 | ||||||||||||
| 6. Baseline confidence | .21 | .11 | .04 | .01 | .43 | |||||||||||
| 7. Concern about background | −.18 | .02 | −.18 | .16 | −.41 | −.57 | ||||||||||
| 8. Prosocial chem motivation | −.08 | .03 | −.04 | .13 | .55 | .15 | −.20 | |||||||||
| 9. Fam/com helping motivation | −.23 | −.09 | −.25 | .17 | .12 | .09 | .02 | .17 | ||||||||
| 10. General helping motivation | .07 | −.06 | .12 | .00 | .16 | .10 | −.11 | .30 | .46 | |||||||
| 11. Final interest | .04 | −.09 | .00 | .13 | .64 | .25 | −.22 | .44 | .09 | .08 | ||||||
| 12. Future plans | −.14 | −.02 | .08 | .00 | .31 | .00 | −.04 | .34 | .09 | .12 | .35 | |||||
| 13. Deeper involvement | −.06 | −.03 | .03 | .11 | .44 | .02 | −.05 | .33 | .12 | .14 | .63 | .66 | ||||
| 14. Perc of instr values | .11 | −.16 | −.04 | .00 | .24 | .01 | .01 | .19 | −.04 | .06 | .35 | .12 | .24 | |||
| 15. Course grade | .46 | .19 | .15 | −.26 | .04 | .16 | −.14 | −.06 | −.21 | −.14 | .23 | −.08 | .03 | .08 | ||
| 16. Essay grade | .07 | .13 | .13 | −.12 | .03 | −.01 | −.04 | .03 | −.05 | .06 | .08 | .08 | .13 | .00 | .30 | |
| Two-Cell Mean | 27.28 | 3.83 | 5.36 | 0.35 | 5.16 | 5.15 | 3.47 | 5.29 | 2.12 | 3.17 | 4.51 | 4.67 | 4.53 | 6.32 | 2.45 | 16.45 |
| Two-Cell SD | 3.40 | 0.20 | 2.11 | 0.24 | 1.15 | 1.12 | 1.27 | 1.35 | 0.99 | 1.07 | 1.43 | 1.98 | 1.71 | 0.98 | 1.01 | 3.30 |
Note. All correlations |r| > .15 are significant at p < .05.
Study 2b: Performance Outcomes in the Two-Cell Design with URM Students
Full results of all regression analyses for Study 2b are reported in Table 12.
Course Grades.
Significant main effects indicated that, among URM students, course grades were lower for FG students, β = −.32, p < .001, and higher for students with higher levels of confidence, β = .20, p = .001, and for students in the Spring semester, β = .15, p = .014. Students in an intervention condition performed somewhat more poorly, β = −.09, p = .102; see Figure 13. This finding is consistent with the adverse outcome noted earlier, and tests of simple effects indicated that the negative effect of the prosocial-combined intervention in Fall was significant in this model, β = −.15, p = .035, whereas the difference in Spring (when the intervention was the standard UVI) was not significant, p = .802.
Figure 13.

Course Grades by Condition and Semester in the Two-Cell design, URM Students, Study 2b.
Note. Error bars represent +/− 1 standard error of the mean.
Study 2b: Motivation Measures in the Two-Cell Design with URM Students
Interest in Chemistry.
Interest was higher for URM students with higher levels of confidence, β = .18, p = .004, and for those higher in prosocial chemistry motivation, β = .44, p < .001. There was also a significant Intervention × confidence interaction, β = .13, p = .028, indicating that students with higher levels of confidence reported higher levels of interest in chemistry in the intervention condition and less interest in the control condition, relative to less confident students, across semesters (Figure 14). This effect is comparable to the effect observed in Study 2a for confident FG-majority students, and highlights the importance of confidence in moderating the effects of UVIs on interest in a first-year chemistry course.
Figure 14.
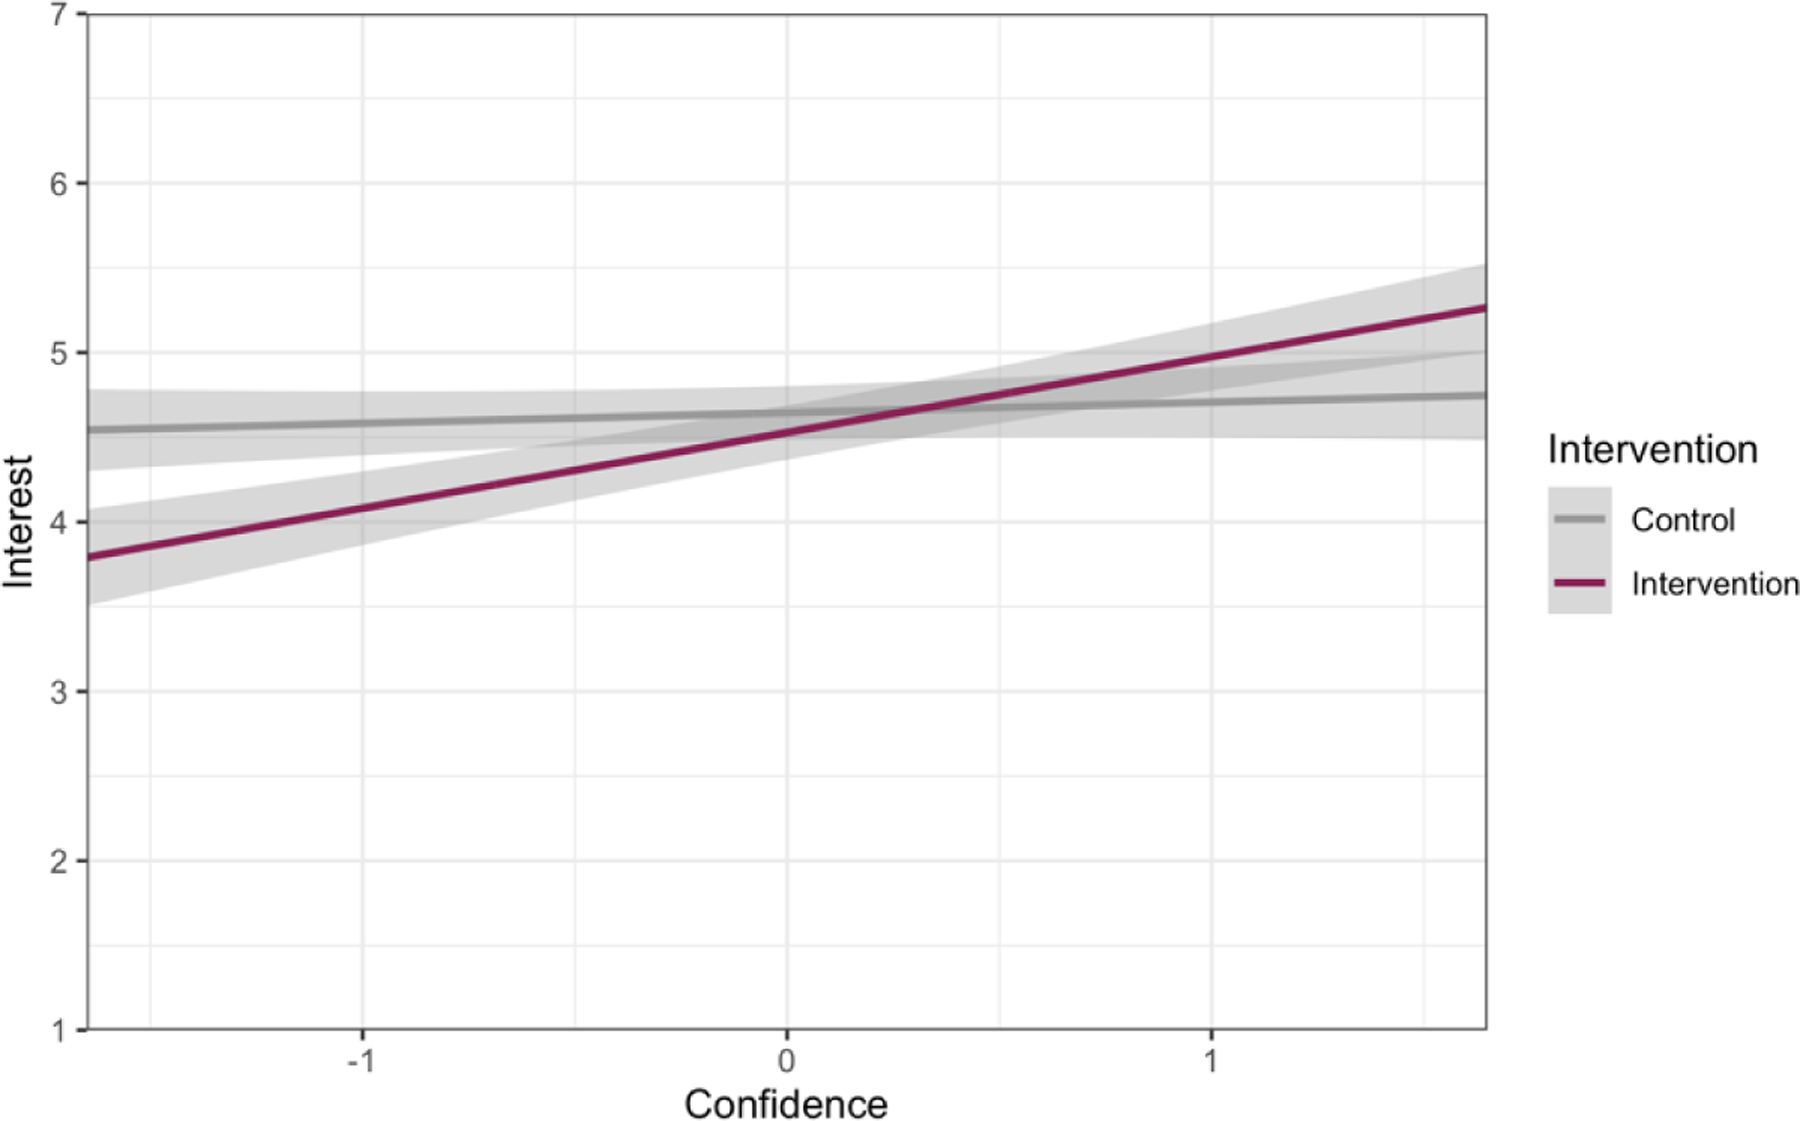
Interest by Condition and Confidence in the Two-Cell design, URM Students, Study 2b.
Note. Predicted values from the regression equations are graphed. Error envelopes represent +/− 1 standard error. Confidence was standardized.
Deeper Involvement.
Students who reported higher levels of prosocial chemistry motivation reported stronger goals for deeper involvement in chemistry, β = .36, p < .001.
Future Plans.
Students who reported higher levels of prosocial chemistry motivation reported that they were more likely to pursue a degree or career in the chemical and health sciences, β = .33, p < .001. There was also a significant main effect of the Intervention contrast on this measure, β = .12, p = .048 (Figure 15), suggesting that the intervention had a positive effect on students’ educational and career plans.
Figure 15.
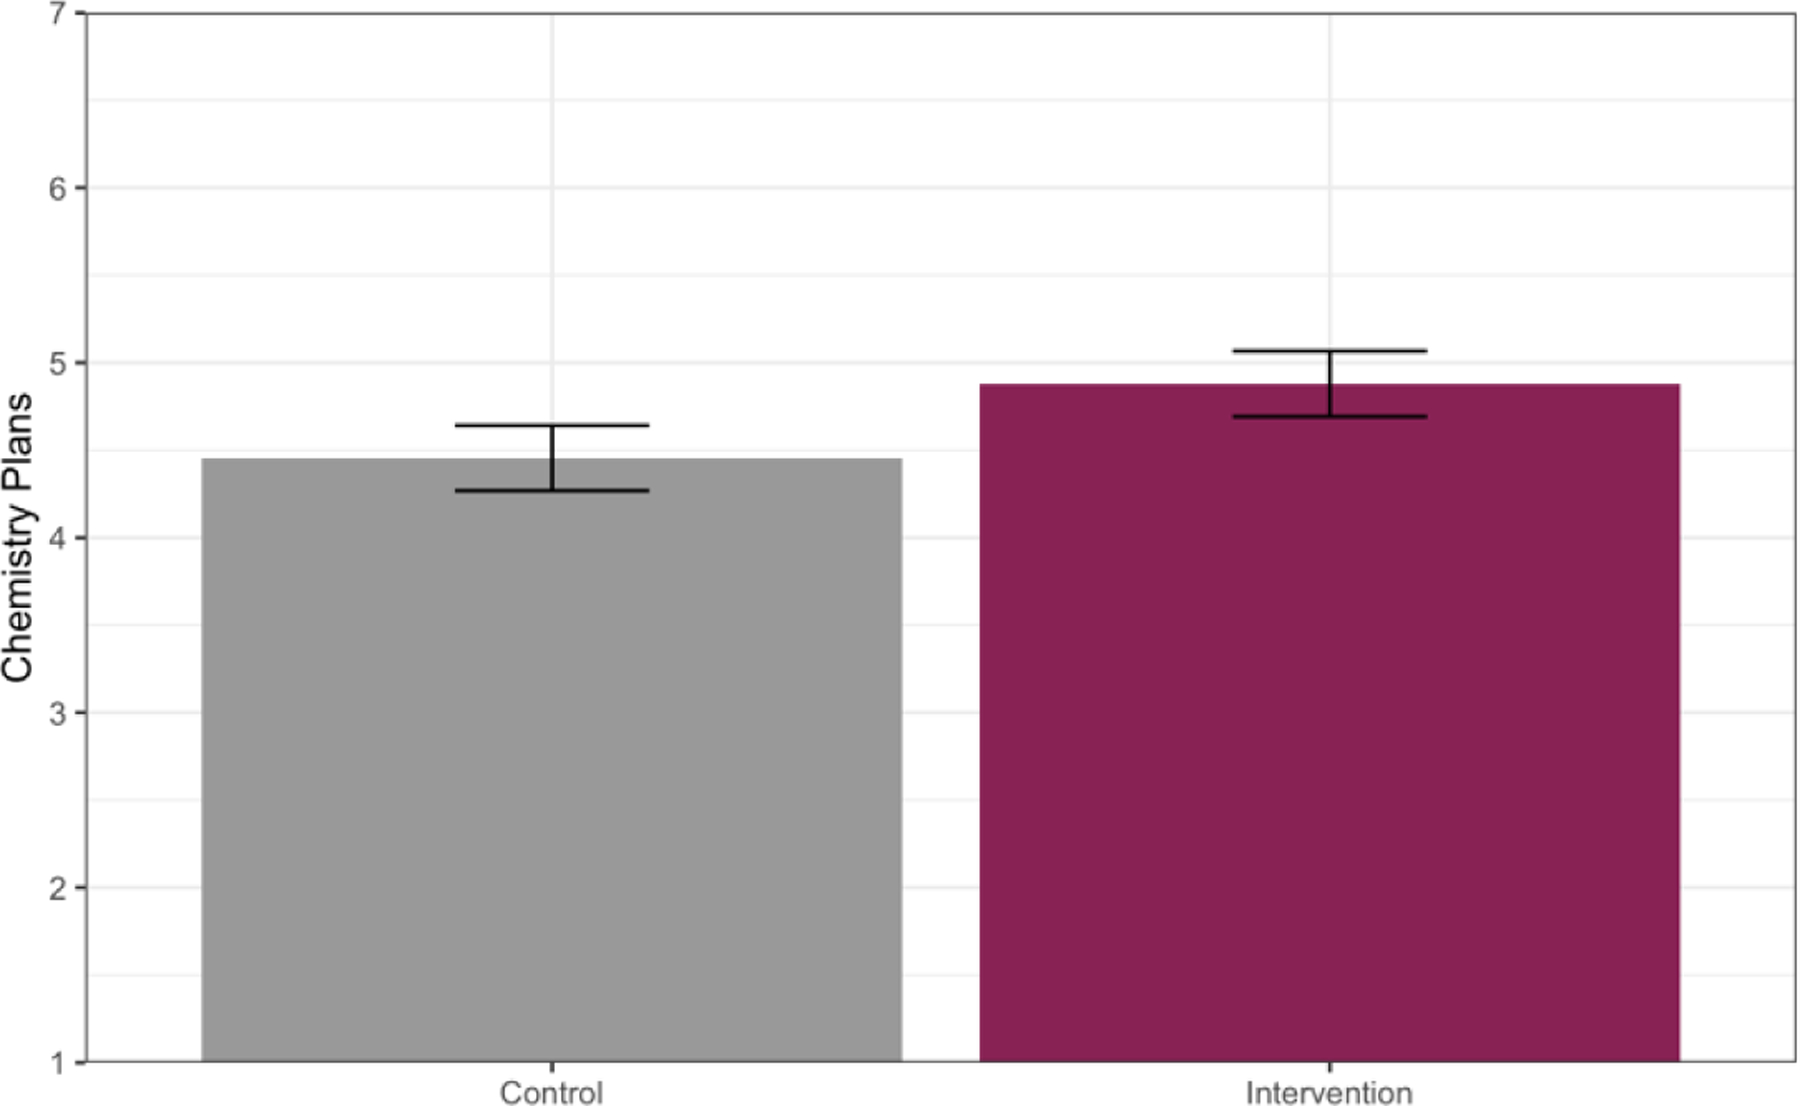
Chemistry Plans by Condition in the Two-Cell design, URM Students, Study 2b.
Students’ Perceptions of Instructor’s Values.
URM students who reported higher prosocial chemistry motivation had more positive perceptions of instructor’s prosocial values, β = .19, p = .006. In addition, a significant interaction between the UVI and prosocial chemistry motivation, β = −.13, p = .050, showed that the UVI increased perceptions of the instructor’s prosocial values for students with low prosocial chemistry motivation (See Figure 16).
Figure 16.
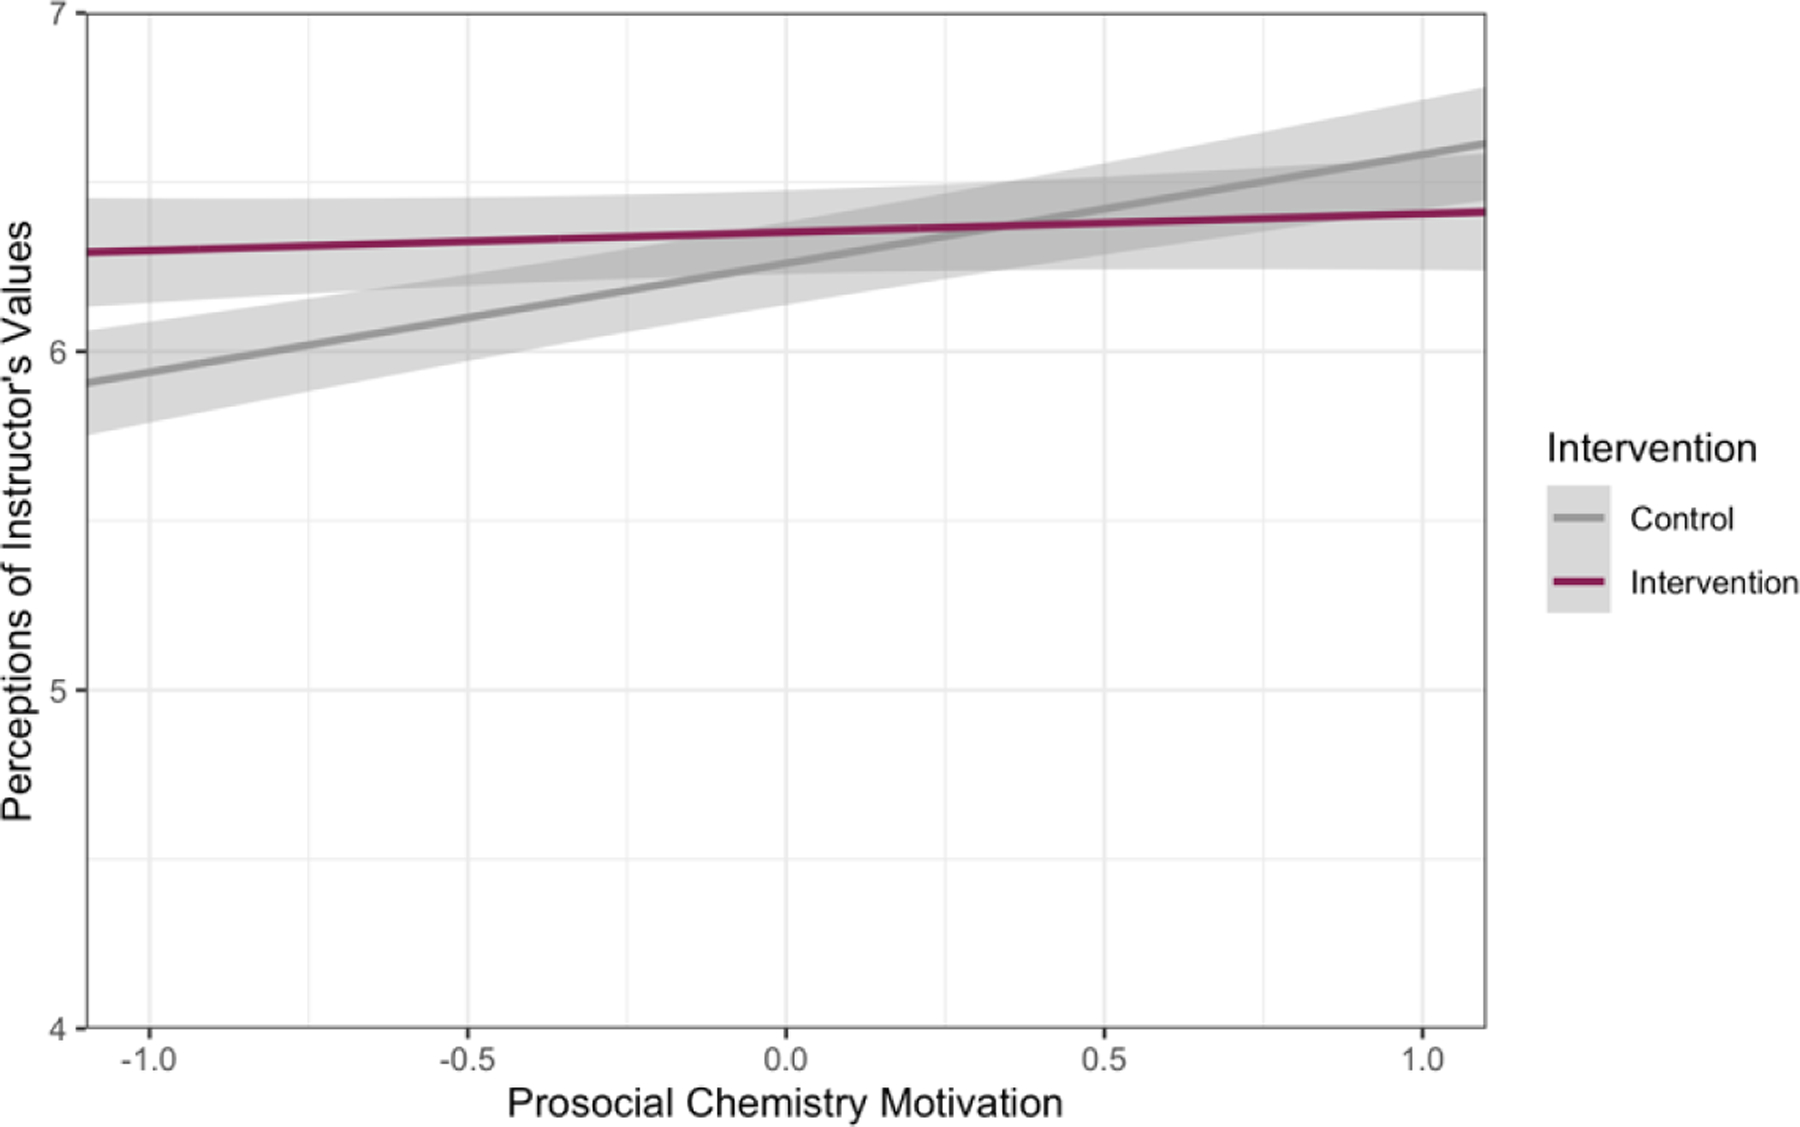
Perceptions of Instructor’s Values by Condition and Prosocial Science Motivation in the Two-Cell Design, URM Students, Study 2b.
Note. Predicted values from the regression equations are graphed. Error envelopes represent +/− 1 standard error. Confidence is standardized.
Further Exploration of Intervention Mechanisms
To examine the dynamics of the intervention effects on interest and future plans, we explored other variables that might help illuminate the motivational pathways through which the UVIs influenced the way URM students wrote their essays. There were no significant intervention effects on essay grades, but we found that URM students wrote longer essays, found more prosocial connections and used more prosocial and communion words in UVI conditions, relative to control, ps <.05. These effects did not differ as a function of FG status. We also found a significant Intervention × confidence interaction on word count, β = .15, p = .023, indicating that the intervention effect was stronger for more confident students (Figure 17). This effect was consistent with the effect on interest (see Figure 14).
Figure 17.
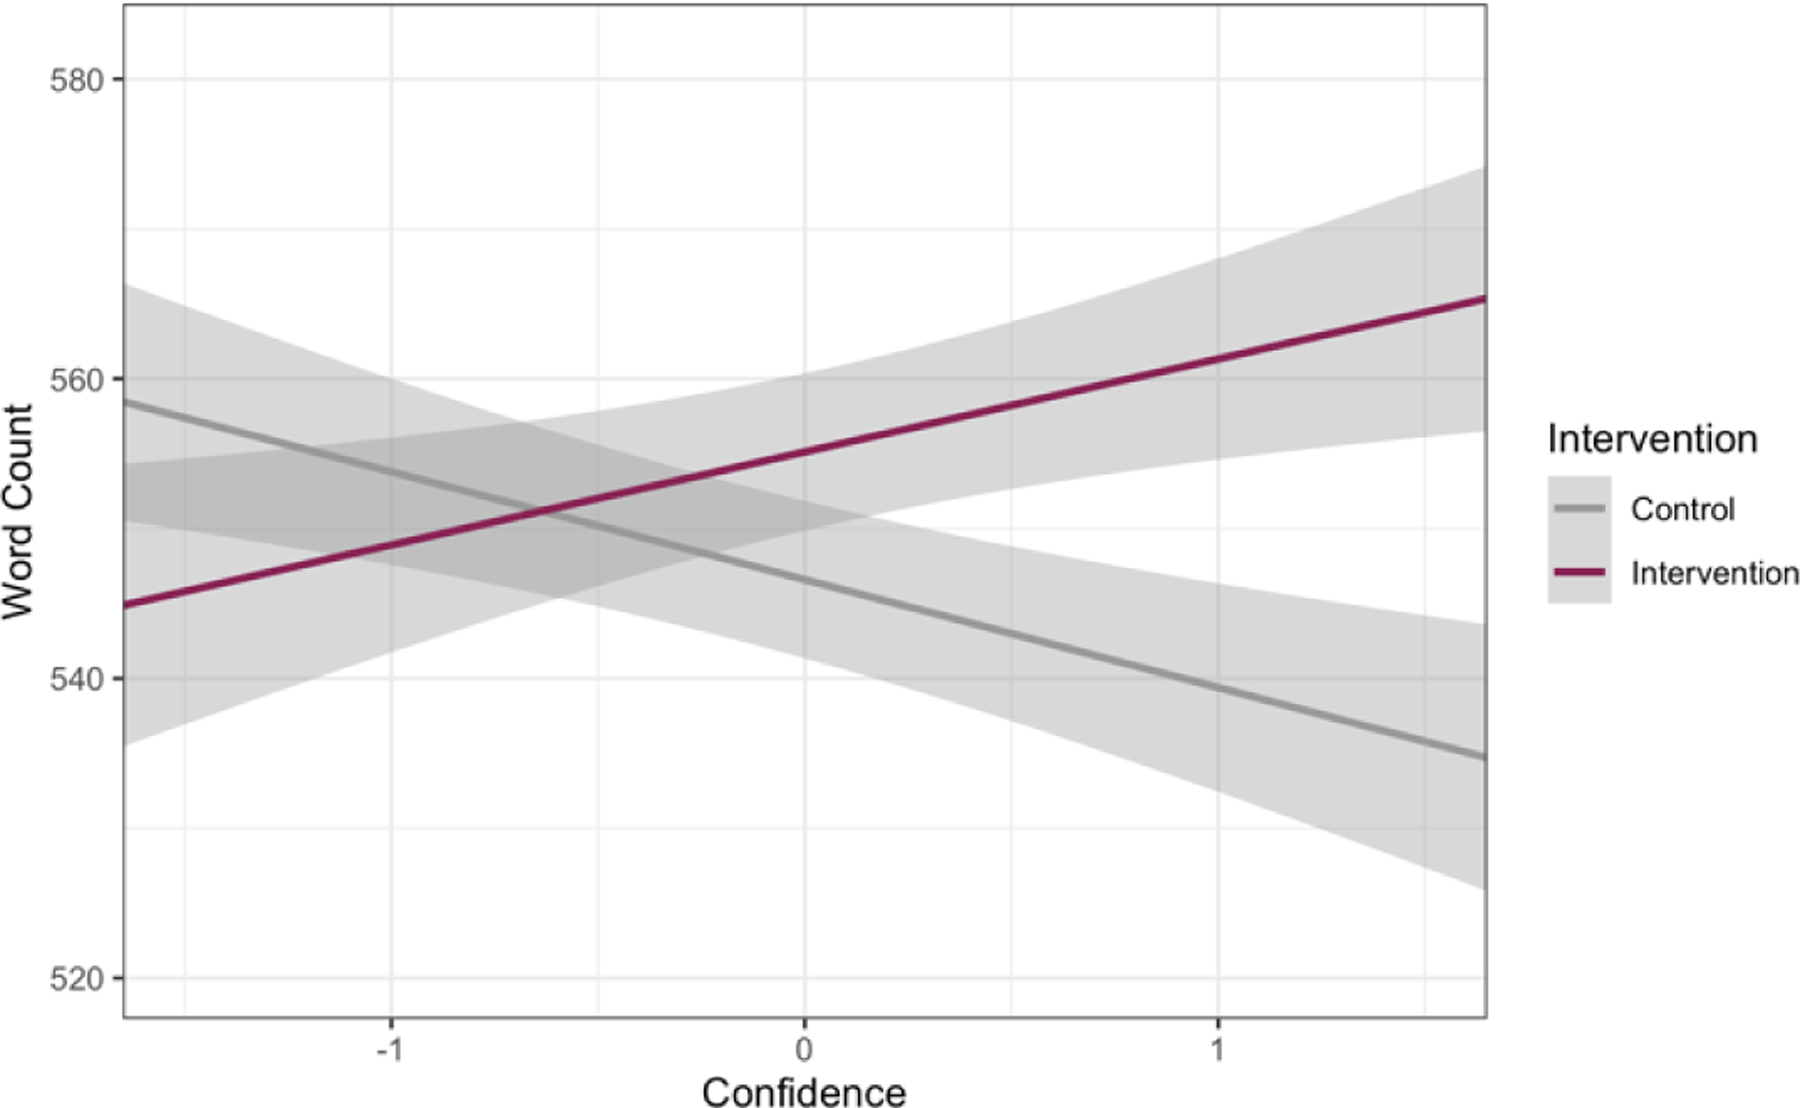
Word Count by Condition and Confidence in the Two-Cell design, URM Students, Study 2b.
Why did the UVIs promote motivation for URM students but not performance?
In contrast to FG-majority students, who received higher essay grades in UVI conditions in Study 2a, URM students in the present study did not receive higher essay grades in the UVI condition. URM students didn’t struggle with writing assignments in the same way that FG students did in the control group (see Table 2), and the UVI did not afford the same performance benefits to URM students, relative to control. In other words, it is possible that FG-majority students entered the class less prepared for scientific writing and thus had more room to benefit from a UVI writing assignment than URM students did, in terms of essay and course grades.
Although the UVI did not help URM students perform better in the class, we did find several positive effects on motivation measures. Consistent with the findings for FG-majority students in Study 2a, the UVI promoted engagement and interest across semesters for URM students who were confident. That is, URM students did not become more motivated in UVI conditions unless they were confident that they could successfully master the material. When they were more confident, however, the UVI helped them become more engaged in the writing assignment (as indexed by the word count of their essays) and may have thereby helped them to find interest in the content. This consistency across Studies 2a and 2b reveals a general pattern suggesting that students who were at risk for poor performance (whether FG or URM) could benefit from a UVI when they believed that they could learn the chemistry content. UVIs may be most effective in engaging students when they feel confident enough with the material to reflect on and write about personal and prosocial values in a scientific writing assignment.
Interestingly, there was also a main effect of the UVI on students’ plans to pursue an education and/or career in the chemical and health sciences, across semesters. It is possible that students’ engagement and interest in chemistry were dependent on their confidence in the chemistry course, as discussed, whereas their career plans were more general and could therefore be influenced by the UVI, even if they lacked confidence in the short term. The UVI may have helped URM students re-affirm and solidify their plans to pursue a career in the chemical and health sciences, with implications for their persistence in STEM (Asher et al., 2023).
Study 2 Discussion
We found that the UVIs, particularly the prosocial-combined UVI, significantly improved motivation and performance for chemistry students, revealing different patterns of effects for FG and URM students. Results from Study 2a reveal the efficacy of the prosocial-combined UVI for FG-majority students, across semesters. When FG students were confident about their performance in the class, the prosocial-combined UVI increased their course grades and also led them to report more interest and goals for deeper involvement in chemistry. The finding that UVI effects were stronger for more confident students supports the understanding of confidence as a forward-looking variable capturing students’ expectancies for success (see Hecht, Harackiewicz, et al., 2019). That is, consistent with an expectancy × value interaction model, reflecting on value may not have benefitted these students unless they also were confident that they could be successful and use the content in value-relevant ways (see Nagengast et al., 2011).
The heightened responsivity of all FG-majority students, on average, to writing assignments that required them to reflect on both the personal and prosocial value of chemistry may be due, in part, to their prosocial motivation. FG students had the highest scores on family/community helping motives, as documented in baseline analyses, and the UVI instructions emphasized family, community, and society connections. In other words, the prosocial-combined UVI was well matched to their prosocial motives. In addition, the results from the control group analyses suggest that FG students struggled with essay writing when asked to write a scientific essay that summarized content. In this condition, they earned substantially lower essay grades, as well as lower scores on analytic writing, relative to CG students. In contrast, the opportunity to write about the personal and prosocial value of chemistry provided by the prosocial-combined UVI may have inspired FG students to bring their own values into these challenging scientific writing assignments and thereby helped them to consider chemistry content in a way that triggered their interest (Renninger, Bachrach & Hidi, 2019). Indeed, we found that the positive effect of the prosocial-combined UVI on performance for confident FG students was partially mediated by increased interest in chemistry, indicating a strong link between the motivation and performance findings in Study 2a.
In other words, Study 2a provided evidence that, as predicted, FG-majority students responded in a positive manner to the prosocial-combined UVI. However, this positive response only translated to improved interest and performance for confident FG-majority students. The prosocial-combined intervention may have provided all FG students, on average, an outlet for thinking about how chemistry could help them give back to family and community, but only confident FG-majority students could envision a path where they might be able to use chemistry to achieve their prosocial aims.
Considered together, the results of Studies 2a and 2b reveal the potential of UVIs to promote motivation for FG and URM students in a gateway science course taken in the first year of college, and the potential the prosocial-combined UVI, in particular, to promote performance for FG-majority students. The results for URM students were mixed, but the positive UVI effects on interest and future plans suggest that UVIs can promote motivational processes that may have implications for persistence in STEM (Asher et al., 2023). Next, we examine the effects of the prosocial-combined UVI in a gateway course typically taken in the second year of college: Introductory Biology.
Study 3
In Study 3, we tested the effects of the prosocial-combined UVI in an introductory biology course, relative to the standard UVI. This is the same course in which Harackiewicz, Canning, and colleagues (2016) had originally documented the effectiveness of the standard UVI, relative to control. On the basis of those findings, the course instructors have continued to assign “standard” utility-value essays over the years since the original study. For Study 3, which was not preregistered, we introduced an alternative assignment into the existing curriculum: the new prosocial-combined UVI. We compared the two UVIs in a randomized design, but without a control group, given that the standard UVI was now fully integrated into the curriculum.
We hypothesized that FG students would show the same positive response to the prosocial-combined UVI, relative to the standard UVI, as observed in Study 2. We also hypothesized that confidence would not be as critical a moderator of UVI effects in this second-year course, both because students would be more experienced with college writing assignments and because personal and prosocial connections might be easier to make in the field of biology. In addition, because we conducted Study 3 during the Fall semester of 2019, and because introductory biology follows introductory chemistry in the typical STEM sequence at this university, students in the biology class may have been in the chemistry class when the UVI was tested the previous year (i.e., Studies 2a and 2b). Thus this design allows us to test longer-term effects when UVIs are adopted in multiple gateway courses, for the subset of Biology students who had been participants in Studies 2a or 2b.
Study 3 Method
This one-semester course, which is most typically taken by undergraduates in their second year of college, consists of two lectures per week, given by three different instructors in three units, and a weekly lab. It is a prerequisite for more than 30 majors (e.g., biochemistry, zoology) on campus and serves as a gateway course for students in biomedical career tracks. Data for Study 3 are not available, because they include potentially identifiable student records.
Participants
Overall, 752 students were enrolled in introductory biology, of whom 88% were second-year students. Of these 752 students, 19 students (3%) did not consent to participate in the study and an additional 21 (3%) did not complete the course. Thus, the sample for the current study consists of 712 students, of whom 150 were FG students (21%) and 562 were CG students (79%). There were 86 students (12%) from URM groups (38 Hispanic or Latinx, 35 Black, 3 Native Hawaiian or Pacific Islander, and 8 American Indian or Alaska Native) and 626 racial/ethnic majority students (88%) in the sample (534 White, 119 Asian). Regarding gender, 458 identified as women (65%), 252 as men (36%), and two (< 1%) as non-binary. The average age of students was 19.7 years (SD = 1.0 years).
Prior Participation in Chemistry Study
As noted, the vast majority of students in this class were second-year students, and in fact, 460 students (65% of this sample) participated in Study 2a or 2b in Chemistry the year earlier. These 460 students therefore represent a non-random subset (18%) of the students who participated in Studies 2a and 2b. We took prior participation into account in several ways. First, when randomizing students to condition, we blocked participants on chemistry enrollment, and if they had participated in Study 2a or 2b, we also blocked on prior UVI condition (control, standard or prosocial-combined). We controlled for chemistry enrollment in the primary analyses. For students who were in Studies 2a or 2b, we report separate analyses that test for prior chemistry intervention effects on performance and motivation in biology.
Procedure
The procedure for Study 3 was identical to that of Study 2 with the following exceptions: (1) there was no control group; rather, all students in Study 3 were randomly assigned to one of two experimental conditions: prosocial-combined or standard UVI in a single design; (2) students completed two (rather than three) assignments, as was the standard practice in this course; (3) in the UVI writing prompts, examples of connections were changed to biology from chemistry; and (4) essays were graded by graduate teaching assistants in the course, rather than undergraduate graders, but they did not grade their own students’ essays. Essay grades constituted 1% of final grades in this course.
Measures
Essay Grades and Course Grades
Instructors provided the grades for the writing assignments, on a 0–20 scale (M = 17.6, SD = 2.2). Course grades, measured on a 4.0 GPA scale, were obtained from instructors (M = 3.0, SD = 0.7).
Psychological and Linguistic Measures
The same qualitative coding measures and LIWC variables examined in Study 1a were included. We also included all questionnaire measures used in Studies 2a and 2b to assess prosocial motives for attending college (unchanged), and motivation variables (items were changed to reflect interest in biology, goals for deeper involvement, and future plans in the biomedical and heath fields), with one exception: we could not meaningfully assess students’ perceptions of their instructor’s prosocial values because the course had different instructors for each unit.
Correlations and descriptive statistics are presented in Table 13.
Table 13.
Descriptives and Correlations for Study 3
| 1 | 2 | 3 | 4 | 5 | 6 | 7 | 8 | 9 | 10 | 11 | 12 | 13 | 14 | 15 | 16 | |
|---|---|---|---|---|---|---|---|---|---|---|---|---|---|---|---|---|
| 1. ACT | ||||||||||||||||
| 2. High School GPA | .12 | |||||||||||||||
| 3. Family income | .32 | .10 | ||||||||||||||
| 4. High School Pct. FRL | −.20 | −.10 | −.35 | |||||||||||||
| 5. Baseline Interest | −.05 | .12 | .03 | .01 | ||||||||||||
| 6. Baseline confidence | .09 | .05 | .07 | −.03 | .41 | |||||||||||
| 7. Concern about background | −.02 | −.06 | −.11 | .12 | −.41 | −.54 | ||||||||||
| 8. Prosocial bio motivation | −.04 | .10 | .00 | .02 | .62 | .22 | −.21 | |||||||||
| 9. Fam/com helping motivation | −.11 | −.07 | −.15 | .06 | .13 | −.05 | .02 | .22 | ||||||||
| 10. General helping motivation | −.04 | .00 | .08 | −.08 | .17 | .03 | −.06 | .31 | .43 | |||||||
| 11. Final interest | −.02 | .09 | .01 | .09 | .67 | .29 | −.27 | .43 | .04 | .13 | ||||||
| 12. Future plans | −.07 | .10 | .04 | −.03 | .45 | .16 | −.24 | .37 | .08 | .13 | .60 | |||||
| 13. Deeper involvement | −.03 | .11 | .05 | −.02 | .45 | .15 | −.17 | .36 | .05 | .12 | .64 | .64 | ||||
| 14. Perc of instructor values | .01 | .01 | −.06 | .05 | .30 | .17 | −.13 | .29 | .06 | .16 | .47 | .18 | .29 | |||
| 15. Course grade | .33 | .26 | .22 | −.10 | .08 | .17 | −.09 | .08 | −.10 | −.03 | .19 | .13 | .13 | .08 | ||
| 16. Essay grade | .08 | .22 | .13 | −.05 | .04 | .03 | −.09 | .06 | −.04 | .04 | .06 | .07 | .08 | −.01 | .37 | |
| Study 3 Mean | 28.81 | 3.89 | 6.26 | 0.23 | 5.79 | 5.54 | 2.84 | 5.82 | 1.75 | 3.05 | 5.54 | 5.81 | 5.35 | 5.92 | 3.01 | 88.08 |
| Study 3 SD | 2.97 | 0.17 | 1.86 | 0.16 | 0.96 | 0.97 | 1.15 | 1.16 | 1.08 | 1.14 | 1.12 | 1.53 | 1.53 | 1.06 | 0.73 | 11.08 |
Note. All correlations |r| > .08 are significant at p < .05.
Study 3 Results
As was the case in Study 2, all missing data (0–7.2% for each variable) was handled using FIML. Because students attended one of three lecture sections, we controlled for these sections, using dummy codes, in all regressions on primary outcomes. All regression results for Study 3 are presented in Table 14.
Table 14.
Primary Results Study 3 Biology
| Course Grade | Essay Grade | Interest | Deeper Involvement | Future Plans | |||||||||||
|---|---|---|---|---|---|---|---|---|---|---|---|---|---|---|---|
| β | z | p | β | z | p | β | z | p | β | z | p | β | z | p | |
| −.06 | −1.53 | .126 | −.03 | −0.74 | .460 | −.02 | −0.56 | .579 | −.03 | −0.86 | .391 | .04 | 1.12 | .264 | |
| FG | −.15 | −4.14 | .000 | −.07 | −1.81 | .070 | −.01 | −0.26 | .795 | −.02 | −0.43 | .666 | .01 | 0.23 | .816 |
| URM | −.15 | −4.09 | .000 | −.10 | −2.68 | .007 | −.01 | −0.14 | .891 | .01 | 0.18 | .859 | −.03 | −0.67 | .500 |
| Confidence | .19 | 4.86 | .000 | .07 | 1.56 | .120 | .29 | 7.24 | .000 | .16 | 3.81 | .000 | .16 | 4.07 | .000 |
| Gender | .05 | 1.42 | .155 | .17 | 4.52 | .000 | .08 | 2.00 | .045 | .10 | 2.60 | .009 | .11 | 2.87 | .004 |
| Prosocial × FG | .07 | 1.96 | .050 | .08 | 2.11 | .035 | .01 | 0.20 | .839 | .08 | 2.10 | .036 | .07 | 1.87 | .061 |
| Prosocial × URM | −.01 | −0.19 | .850 | −.05 | −1.30 | .192 | −.02 | −0.46 | .649 | −.08 | −2.03 | .043 | −.08 | −2.13 | .033 |
| Prosocial × Confidence | .01 | 0.15 | .877 | .01 | 0.30 | .764 | −.07 | −1.82 | .069 | −.01 | −0.37 | .714 | −.03 | −0.80 | .422 |
| Prosocial × Gender | −.01 | −0.22 | .826 | .00 | 0.10 | .922 | .03 | 0.78 | .435 | .05 | 1.20 | .229 | −.01 | −0.13 | .897 |
| FG × Confidence | .00 | 0.08 | .936 | .08 | 1.95 | .051 | .10 | 2.35 | .019 | .02 | 0.45 | .655 | .07 | 1.68 | .094 |
| Gender × Confidence | −.05 | −1.22 | .221 | −.03 | −0.82 | .411 | −.03 | −0.75 | .454 | .03 | 0.69 | .489 | .01 | 0.22 | .825 |
| Prosocial × FG × Confidence | .01 | 0.28 | .777 | .01 | 0.25 | .801 | .08 | 2.01 | .044 | −.02 | −0.60 | .548 | −.03 | −0.84 | .400 |
| Prosocial × Gender × Conf. | −.04 | −0.94 | .345 | −.03 | −0.68 | .496 | −.02 | −0.60 | .546 | −.03 | −0.83 | .407 | .04 | 1.05 | .296 |
| Prior Chem Student | .09 | 2.62 | .009 | .04 | 1.00 | .316 | .18 | 4.91 | .000 | .21 | 5.61 | .000 | .30 | 8.29 | .000 |
| Lecture Section 2 | .03 | 0.69 | .489 | −.04 | −1.08 | .281 | .07 | 1.65 | .099 | .05 | 1.23 | .219 | .01 | 0.35 | .729 |
| Lecture Section 3 | −.11 | −2.77 | .006 | −.08 | −1.96 | .050 | .03 | 0.81 | .417 | .01 | 0.24 | .810 | .02 | 0.60 | .547 |
Note. Prosocial = Prosocial-Combined (+.5) vs. Standard UVI (−.5). Confidence was standardized, and the contrasts for lecture section compared lecture sections 2 and 3 to lecture section 1 (the reference group) with dummy codes. All other predictors were mean centered. FG = first-generation college students (FG = high, continuing-generation = low); URM = underrepresented minority students (URM = high, majority = low); Gender is coded women = high, men = low.
How Did the Prosocial-Combined and Standard UVIs Affect Performance Outcomes and Motivation Variables in Biology?
In this study, there was a single experimental design, so FG and URM status could both be tested as factors in the regression models. Critically, this single design also means that any effects of FG status include both FG-Majority (N = 112) and FG-URM (N = 38) students. To develop the analytic model for comparing the two UVIs in Biology, we followed the same power-based procedures described in Study 2. We compared conditions with a Prosocial-Combined vs Standard UVI contrast, which was identical to the contrast tested in the three-cell design of study 2, but because there was no control group in this study, our analyses simply concern comparisons of the two UVIs. The resulting model contained the Prosocial-Combined contrast, confidence (standardized), mean-centered contrasts for demographic variables (FG status, URM status, and gender), and the five two-way interactions between the Prosocial-Combined contrast and each of the other predictors. Due to power considerations, we were only able to test two three-way interactions: the Prosocial-Combined × FG × confidence interaction, and the Prosocial-Combined × gender × confidence interaction. To test these three-way interactions, we included two lower-order two-way interactions: FG status × confidence and gender × confidence. There were too few URM students to test three-way interactions between condition, URM status and any other variable. We also controlled for enrollment in Introductory Chemistry at this university the previous year during Study 2.10
Course Grades
FG students received lower course grades than CG students, β = −.15, p < .001, and URM students received lower grades than majority students, β = −.15, p < .001. Students with higher levels of confidence, β = .19, p < .001, and those who had taken Chemistry the previous year, β = .09, p = .009, earned higher grades. The Prosocial-Combined main effect was not significant, β = −.06, p = .126, but there was a significant Prosocial-Combined × FG interaction, β = .07, p = .050, indicating that there was a more positive effect of the prosocial-combined UVI, relative to the standard UVI, for FG compared to CG students (Figure 18, Panel A).
Figure 18.
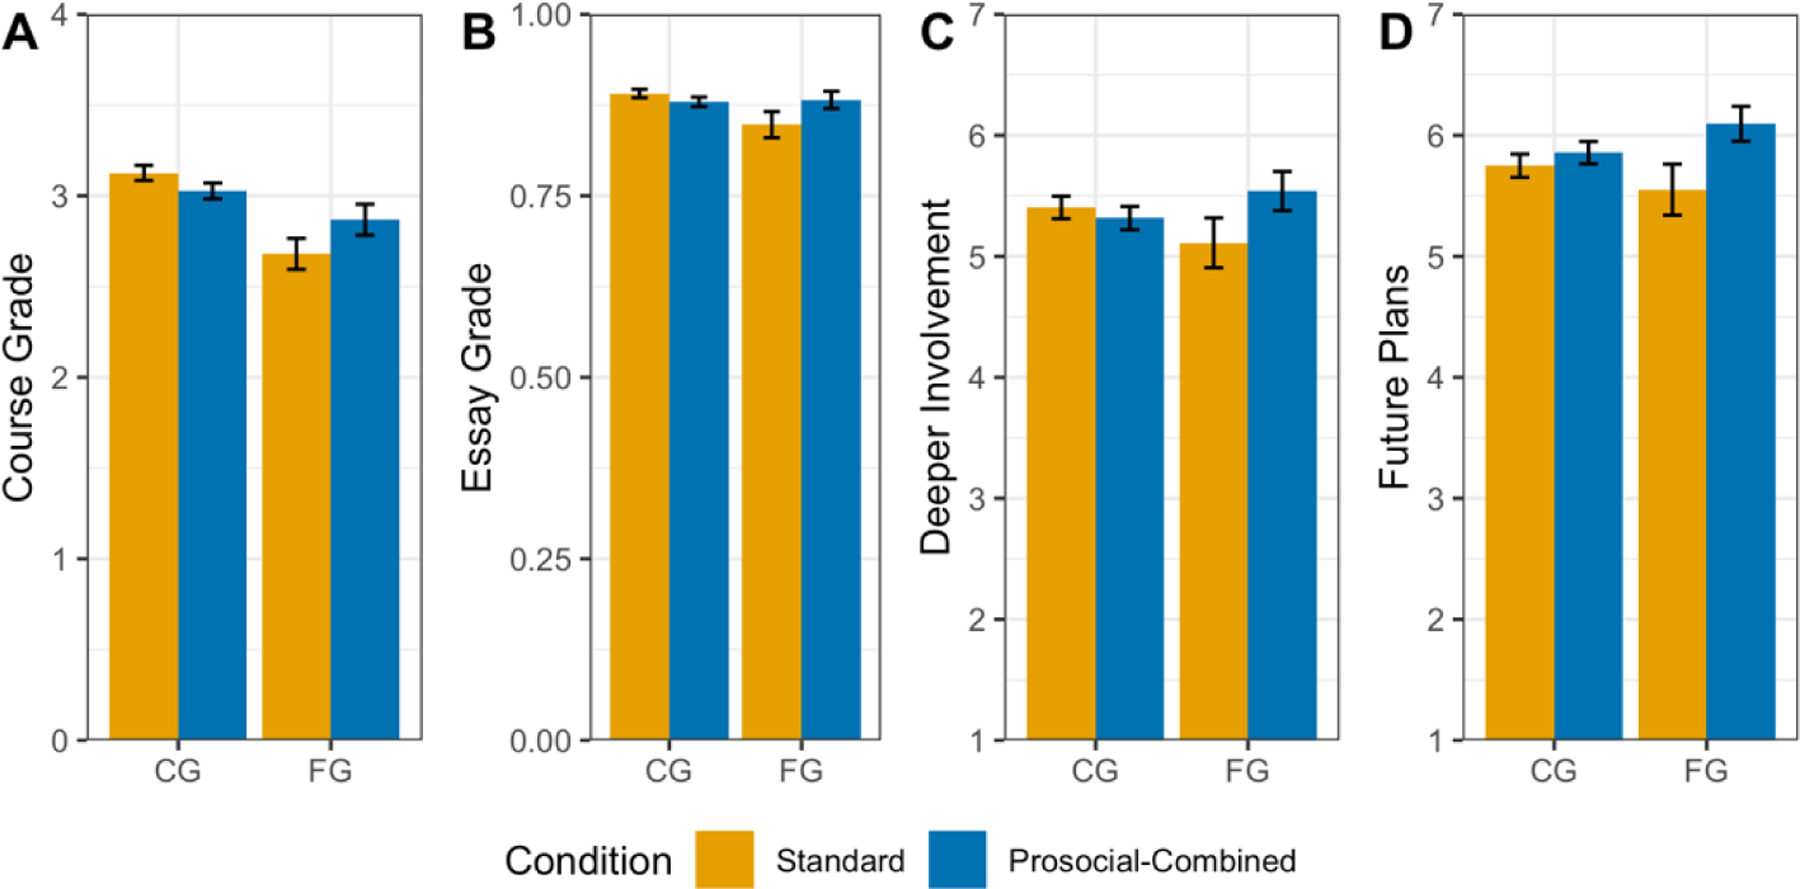
Course Grade (Panel A), Essay Grades (Panel B), Deeper Involvement (Panel C), and Future Plans (Panel D) by Experimental Condition and First-Generation College Student Status in Study 3
Note. Error bars represent +/− 1 standard error of the mean.
Essay Grades
Women received higher essay grades than men, β = .17, p < .001, and URM students received lower essay grades than majority students, β = −.10, p = .007. A significant Prosocial-Combined × FG interaction indicated that FG students received higher essay grades in the prosocial-combined condition, relative to standard, β = .08, p = .035 (Figure 18, Panel B).
Interest
Students who had taken Chemistry the previous year reported higher levels of interest in Biology, β = .18, p < .001, as did more confident students, β = .29, p < .001. A three-way Prosocial-Combined × FG × Confidence interaction, β = .08, p = .044, indicated that confidence moderated the effect of the prosocial-combined UVI on interest to a greater degree for FG relative to CG students, and this pattern was similar to that observed in Study 2 (Figure 19).
Figure 19.
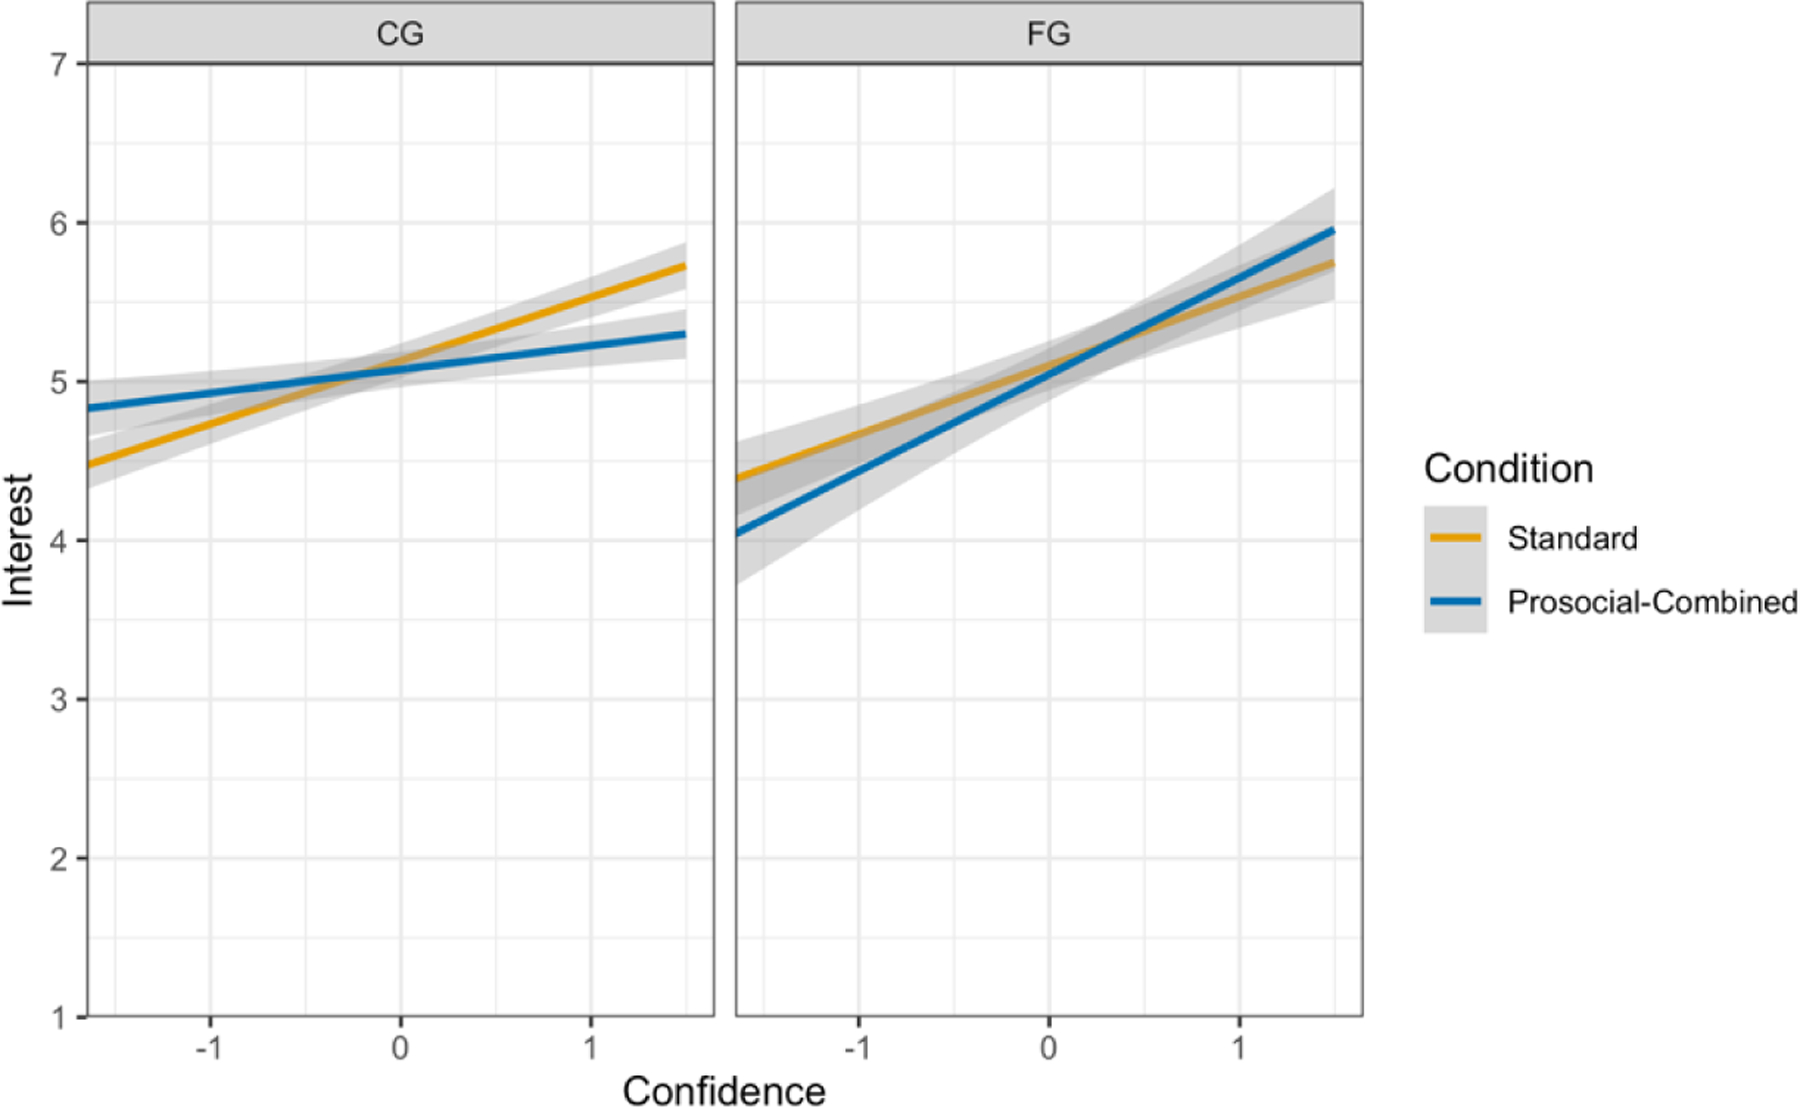
Interest by Experimental Condition, FG Status, and Confidence in Study 3
Goals for Deeper Involvement and Future Plans in the Biomedical and Health Sciences
Deeper involvement.
Prior chemistry students reported stronger goals for deeper involvement in the biomedical and health sciences, as did more confident students, ps < .001. A Prosocial-Combined × FG interaction, β = .08, p = .036, showed that FG students reported stronger goals in the prosocial-combined condition, relative to standard (Figure 18, Panel C). In contrast, a Prosocial-Combined × URM interaction, β = −.08, p = .043, indicated that URM students reported deeper involvement in the standard condition (Figure 20, Panel A).
Figure 20.

Deeper Involvement (Panel A) and Future Plans (Panel B) by Experimental Condition and URM Status in Study 3.
Note. Error bars represent +/− 1 standard error of the mean.
Future plans.
Confidence was positively associated with plans to pursue a degree or career in the biomedical and health science, as was previous enrollment in chemistry, ps < .001. In addition, women reported stronger future plans than did men, β = .06, p < .001. Mirroring the effects on deeper involvement, the Prosocial-Combined × FG and Prosocial-Combined × URM interactions on future plans were marginal, β = .07, p = .061 (Figure 18, Panel D) and significant, respectively, β = −.08, p = .033 (Figure 20, Panel B), suggesting that FG students reported stronger plans in the prosocial-combined condition, and that URM students reported stronger plans in the standard condition.
Effects of Prior UVI (or Control) Experience
As mentioned earlier, 460 students in this study had participated in Study 2a or 2b, and thus it was possible to explore the effects of prior UVI experience on performance, interest, deeper involvement, and future plans in this Biology class for this subsample. Although these students were blocked on prior Chemistry condition before random assignment to condition in Biology, they constitute a non-random subset of participants in the Chemistry study. For this analysis of with the reduced sample (N = 460), we replaced the “prior chemistry” contrast from our basic model with a set of two dummy coded contrasts that compared each prior Chemistry UVI condition to control, two two-way interactions between the Biology and Chemistry condition contrasts, two-way interactions between the chemistry condition contrasts and demographic factors, and baseline GPA as a covariate.11
The results revealed that Biology students who had previously received a prosocial-combined UVI in Chemistry earned higher grades in Biology than those who had been in the control condition in Chemistry, β = .09, p = .031. In addition, students who had been in the prosocial-combined condition in Chemistry were also more likely to report stronger goals for deeper involvement in the biological and health sciences than those who had been in the control condition in Chemistry, β = .11, p = .031. This effect was in the same direction, but not significant, for future plans, β = .08, p = .120, and there were no significant effects of prior Chemistry interventions on interest in biology. The significant effects of the prior Prosocial-Combined UVI on performance and deeper involvement held across experimental conditions in Biology (i.e., there was no interaction between prior Chemistry and Biology conditions). Full results of this analysis are reported in Table 15. Critically, the effects documented in the full Biology sample remained significant in this subsample in which prior intervention effects could be tested. In particular, the Prosocial-combined × FG interaction on course grades remained significant among prior chemistry students, β = .07 p = .042.12 See Supplement for more details.
Table 15.
Study 3: Effects of Prior UVI Experience in Chemistry
| Course Grade | Essay Grade | Interest | Deeper Involvement | Future Plans | |||||||||||
|---|---|---|---|---|---|---|---|---|---|---|---|---|---|---|---|
| β | z | p | β | z | p | β | z | p | β | z | p | β | z | p | |
| −.12 | −2.03 | .042 | −.05 | −0.61 | .540 | −.08 | −1.03 | .304 | −.15 | −1.86 | .063 | −.07 | −0.81 | .420 | |
| Chem Standard vs. Control | −.03 | −0.83 | .407 | −.01 | −0.17 | .862 | .02 | 0.29 | .771 | .06 | 1.14 | .256 | .01 | 0.18 | .859 |
| Chem Prosocial vs. Control | .09 | 2.16 | .031 | .03 | 0.63 | .528 | .02 | 0.43 | .669 | .11 | 2.16 | .031 | .08 | 1.56 | .120 |
| FG | −.15 | −2.34 | .019 | −.07 | −0.93 | .351 | .00 | −0.03 | .973 | −.06 | −0.69 | .491 | .05 | 0.59 | .558 |
| URM | −.07 | −1.89 | .059 | −.04 | −0.95 | .343 | −.02 | −0.37 | .713 | −.02 | −0.38 | .701 | −.04 | −0.84 | .401 |
| Confidence | .09 | 2.38 | .018 | .08 | 1.54 | .123 | .32 | 6.30 | .000 | .15 | 2.87 | .004 | .18 | 3.45 | .001 |
| Gender | .11 | 1.87 | .062 | .19 | 2.50 | .013 | .16 | 1.95 | .052 | .16 | 1.97 | .049 | .21 | 2.53 | .011 |
| Bio Prosocial × Chem Standard | .02 | 0.48 | .633 | −.02 | −0.39 | .695 | .01 | 0.16 | .876 | .06 | 0.93 | .354 | .05 | 0.83 | .404 |
| Bio Prosocial × Chem Prosocial | .01 | 0.24 | .813 | .02 | 0.28 | .778 | .01 | 0.12 | .905 | .03 | 0.44 | .661 | −.01 | −0.18 | .861 |
| Bio Prosocial × FG | .07 | 2.03 | .042 | .07 | 1.57 | .116 | .02 | 0.38 | .703 | .11 | 2.12 | .034 | .06 | 1.29 | .196 |
| Bio Prosocial × URM | −.02 | −0.59 | .557 | −.07 | −1.58 | .115 | −.07 | −1.35 | .177 | −.12 | −2.42 | .015 | −.12 | −2.43 | .015 |
| Bio Prosocial × Confidence | .04 | 1.17 | .244 | −.03 | −0.54 | .590 | −.03 | −0.52 | .604 | .02 | 0.46 | .645 | .03 | 0.57 | .566 |
| Bio Prosocial × Gender | .03 | 0.67 | .503 | .00 | 0.07 | .946 | .05 | 1.10 | .270 | .11 | 2.13 | .033 | −.02 | −0.35 | .727 |
| Chem Standard × FG | .02 | 0.41 | .683 | .04 | 0.60 | .549 | .00 | 0.04 | .965 | .06 | 0.92 | .356 | −.06 | −0.85 | .396 |
| Chem Prosocial × FG | .05 | 0.95 | .342 | .01 | 0.09 | .926 | .02 | 0.33 | .742 | −.01 | −0.09 | .927 | .00 | 0.00 | .997 |
| Chem Standard × Gender | −.08 | −1.79 | .074 | −.05 | −0.85 | .397 | −.16 | −2.50 | .012 | −.12 | −1.85 | .065 | −.18 | −2.71 | .007 |
| Chem Prosocial × Gender | −.07 | −1.40 | .161 | −.03 | −0.41 | .678 | −.01 | −0.22 | .824 | .02 | 0.36 | .719 | −.03 | −0.43 | .667 |
| FG × Confidence | .01 | 0.26 | .798 | .14 | 2.87 | .004 | .03 | 0.52 | .606 | −.02 | −0.41 | .685 | .00 | −0.08 | .933 |
| Gender × Confidence | −.03 | −0.79 | .429 | −.01 | −0.20 | .838 | −.05 | −0.89 | .373 | −.03 | −0.56 | .579 | .00 | 0.06 | .949 |
| Bio Prosocial × FG × PC | −.02 | −0.48 | .629 | −.06 | −1.17 | .242 | .09 | 1.88 | .060 | −.02 | −0.39 | .697 | −.05 | −0.93 | .352 |
| Bio Prosocial × Gender × Conf. | −.07 | −1.76 | .078 | −.03 | −0.64 | .520 | −.07 | −1.28 | .199 | −.10 | −1.80 | .072 | −.03 | −0.65 | .513 |
| Lecture Section 2 | .04 | 1.05 | .292 | .00 | 0.09 | .926 | .13 | 2.52 | .012 | .11 | 2.09 | .037 | .04 | 0.85 | .396 |
| Lecture Section 3 | −.08 | −2.12 | .034 | −.07 | −1.42 | .157 | .07 | 1.34 | .182 | .07 | 1.36 | .175 | .09 | 1.74 | .082 |
| College GPA | .59 | 16.29 | .000 | .26 | 5.53 | .000 | −.03 | −0.68 | .494 | −.08 | −1.55 | .121 | .00 | −0.03 | .980 |
Note. The Chem Standard vs. Control and Chem Prosocial vs. Control contrasts are both dummy coded. Bio Prosocial = Prosocial-Combined (+.5) vs. Standard UVI (−.5). Confidence was standardized, and the contrasts for lecture section compared lecture sections 2 and 3 to lecture section 1 (the reference group). All other predictors were mean centered. FG = first-generation college students (FG = high, continuing-generation = low); URM = underrepresented minority students (URM = high, majority = low); Gender is coded women = high, men = low.
These results are consistent with previous research showing that the UVI can have long-term effects on motivational variables and persistence (Canning et al., 2018; Hecht, Harackiewicz et al., 2019). However, this is the first demonstration to our knowledge that the UVI can affect performance over time, in a different course. Of course these results should be interpreted with caution given that only a subset of the original Chemistry sample was enrolled in this particular Biology class.
Study 3 Discussion
In a Biology course, we found that the prosocial-combined UVI improved FG students’ course grades and essay grades and increased their goals for deeper involvement and future plans in the biomedical and health sciences, relative to the standard UVI. These results are consistent with the findings in Introductory Chemistry (Study 2a), in which the prosocial-combined UVI improved performance (and increased interest and goals for deeper involvement) among FG-majority students who were more confident about their performance in the class. The importance of confidence as a moderator in Chemistry, but not Biology, may be due to the fact that students in this Biology course were primarily second-year students who had already completed introductory STEM courses (e.g., 65% had completed Introductory Chemistry at this institution the previous year). These students had chosen to continue in the biomedical and health sciences track, suggesting that they were likely confident about their abilities in the field. Furthermore, confidence may have played a smaller role in their responsiveness to the UVI in this second-year biology course because students were more experienced with college writing assignments and/or because personal and prosocial connections were easier to make in biology. As such, it is not surprising that the prosocial-combined UVI had an overall positive effect for FG students in this class, rather than being moderated by confidence. Moreover, these positive effects for FG students extended to both FG-Majority and FG-URM students in this study.
Interestingly, we found that URM students reported stronger goals for deeper involvement (i.e., plans to pursue internships and/or research opportunities) and stronger future career plans in the biomedical and health sciences when they received the standard, as opposed to prosocial-combined, UVI. This seems consistent with the finding in Introductory Chemistry (Study 2b) that URM students were more likely to benefit more from the standard UVI (administered in the spring) as compared to the prosocial-combined UVI (administered in the fall), in terms of their interest in chemistry and future course-taking plans. As discussed earlier, the interactions with semester in the Study 2 two-cell design must be interpreted with caution because semester and intervention type were confounded for URM students. However, the findings from this study shed additional light on the chemistry findings and suggest that with respect to deeper involvement and future plans, URM students may benefit more from standard UVIs, which allow them to make prosocial connections if they wish, but without a specific focus on prosocial connections. This is an issue to study further with larger and more diverse samples.
Our sample was not large or diverse enough to examine FG and URM differences in performance or future plans with an intersectional lens, or even test whether intervention effects differed for FG-majority and FG-URM students. FG-URM students are a small numeric minority of students at this university, and even in a sample of 712 students, we lacked statistical power to examine effects for FG-URM students, who comprised just 5% of our sample. As a result, it is difficult to compare these findings directly with those of Harackiewicz, Canning, et al. (2016), conducted in this same Introductory Biology course. That study was conducted across four semesters to ensure a larger and reasonably diverse sample of students, affording an intersectional analysis of race and FG status not possible here. Our struggles with statistical power, even in these very large classes, highlights one of the rather obvious problems for intervention researchers who hope to promote diversity in STEM: underrepresented students are low in number, and statistical power is an ongoing challenge.
Harackiewicz, Canning, et al. (2016) found a small positive effect of the standard UVI on biology grades, for all students, on average, and a particularly positive effect for FG-URM students, but they did not find the same effect for FG-majority students. In that study, a lingering question concerned why there was a positive effect of the standard UVI for FG-URM students, but not for FG-majority students. By contrast, in Studies 2a and 2b of the current project, we ask the opposite question: why did we find positive effects of the prosocial-combined UVI for FG-majority students, but not for FG-URM students? The results of Study 3 shed some light on this question. FG students (75% of whom were FG-majority) were not as responsive to the standard UVI tested in the current study, or in Chemistry (Study 2a, where 100% of the FG students were FG-majority), as they were to the prosocial-combined UVI, replicating the results of Harackiewicz et al. (2016). In Studies 2a and 3, however, FG students earned higher essay and course grades when the UVI emphasized prosocial value, in addition to personal value. This finding helps to resolve some inconsistencies by documenting how important a specific focus on prosocial connections can be for some FG students, and it highlights the importance of returning to this biology class (if only for a single semester) to test the prosocial-combined UVI in a second-year course. More research with larger and more diverse samples will be necessary to explore these intersectional questions in more detail, but the present results build on Studies 2a and 2b, and prior research to suggest that UVIs can promote motivation and performance in gateway classes.
General Discussion
The three studies reported here sought to determine whether prosocial utility-value interventions would be effective in improving students’ performance and experiences in gateway STEM courses, with a particular eye toward closing performance gaps between first-generation (FG) and continuing-generation (CG) college students. In Study 1a, we developed prompts for utility-value writing assignments designed to encourage students to think about the prosocial utility value of biology topics in their introductory course. The prosocial-combined prompt, which encouraged students to think about both personal and prosocial utility value, was successful in stimulating this type of writing. These linguistic findings were replicated in Study 1b, which was conducted at a different university and in a different domain (chemistry).
Study 2, conducted in a large introductory chemistry class with mostly first-year students, incorporated two primary designs: (a) a three-cell design that tested effects for FG vs. CG-majority students, comparing the prosocial-combined UVI vs. the standard UVI vs. control and (b) a two-cell design that tested effects for URM vs. majority students, comparing either the prosocial-combined or the standard utility-value intervention (UVI) vs. control. This study was conducted across two semesters, and the results indicated that the prosocial-combined UVI fostered interest and improved course grades for FG-majority students who were confident about their performance in the class, across semesters. We also found stronger intervention effects in the Spring, relative to Fall semester. In the Spring semester, the prosocial-combined intervention improved performance for all majority students, on average, and also promoted interest and perceptions that the instructor valued the application of chemistry for real life problems. Results for underrepresented racial/ethnic minority (URM) students were mixed, however, with null or negative effects on performance, but positive effects on important motivational outcomes such as engagement, interest, and career plans, across both semesters.
In Study 3, we returned to introductory biology, but at the same university as the chemistry course. We compared the new prosocial-combined UVI to the standard UVI, which had been incorporated into the curriculum of this course. Results indicated that the prosocial-combined UVI improved FG students’ course grades and increased their plans for deeper involvement in the biomedical and health sciences, replicating and extending the results of Study 2a. This study was also the first to test the effects of prior exposure to UVIs in subsequent courses (from chemistry to biology) and we found that all students who had received a prosocial-combined UVI in chemistry earned higher grades in biology, on average, relative to students who had been in the control condition in the chemistry class. These results illustrate the potential for longer-term effects of the prosocial-combined UVI.
Complexity of Findings: Implications for Intervention
Although we found many positive effects of the prosocial-combined UVI on course performance and interest – for confident FG-majority students in introductory chemistry, for both FG and CG-majority students taking introductory chemistry in spring semester, for FG-majority and FG-URM students in biology, and for biology students who had received the prosocial-combined UVI in chemistry a year earlier, this intervention was not a magic bullet that helped all students perform better in gateway classes. Two groups of students were least likely to benefit from the prosocial-combined intervention in terms of course performance: less confident FG students and URM students, and it is important to consider why the intervention may not have worked as well for these students. URM students (at a predominantly White institution) and less confident FG students may have shared challenges in doubting whether they could enact the values articulated in their essays. For example, all FG-majority students in chemistry responded positively to the prosocial-combined prompt in terms of their writing – they discussed more prosocial connections, used more prosocial words, and earned higher essay grades, but these effects did not translate into better performance for less confident FG-majority students, perhaps because they could not envision themselves mastering chemistry well enough to achieve their prosocial goals. URM students also discussed more prosocial connections and used more prosocial words in the prosocial-combined UVI condition, but they did not earn higher grades on their essays, and they received lower course grades in this condition, relative to control. It is possible that the prosocial-combined UVI did not inspire better performance for URM students because the UVI prompt did not match their prosocial goals as well as it did for FG students, or perhaps because the examples used in the prompt did not seem authentic to their experiences. In this case, we might expect a less structured, more open-ended UVI to be more effective – one such as the standard UVI that is less explicitly focused on prosocial connections. Indeed, although we were unable to compare the two types of UVI directly for URM students in Chemistry, due to design issues, we did find that the Standard UVI did not impair performance in the Spring semester. Moreover, direct comparisons of the prosocial-combined and standard UVI in Study 3 suggest that URM students responded more positively to the standard than prosocial-combined UVI in biology. Considered together, these results highlight some potential limitations of the prosocial-combined UVI.
The negative effects on performance were countered by some positive effects on motivational outcomes for URM students, however, and it is important to consider these effects as well, especially considering the implications for long-term persistence in STEM. First, consistent with the findings for FG-majority students in Study 2a, the UVI promoted engagement and interest across semesters for confident URM students. That is, URM students did not become more engaged or interested in chemistry in UVI conditions unless they were confident that they could successfully master the material. This may reveal a general pattern suggesting that students who are at risk for poor performance (whether FG or URM) might only benefit from a UVI when they believe that they can learn the chemistry content. UVIs may be most effective in engaging students when they feel confident enough with the material to reflect on and write about personal and prosocial values in a scientific writing assignment.
Second, and more critically, the UVI influenced URM students’ plans to pursue an education and/or career in the chemical and health sciences, across semesters. In other words, the UVI may have helped URM students re-affirm and solidify their plans to pursue a career in the chemical and health sciences. This suggests that the UVIs might have broader effects that extend beyond the chemistry class, with implications for persistence in STEM. In fact, a follow-up study found that URM students in Study 2 were 14% more likely to remain in a STEM major two and a half years later if they were in the UVI condition, relative to controls (Asher et al., 2023). Moreover, this direct intervention effect on persistence was partially mediated by the future plans variable, providing strong evidence for the importance of motivational processes in UVI dynamics and understanding persistence in the STEM pipeline.
Given these mixed findings, what are the implications for educators who want to help their students learn and persist in STEM? Our recommendation would be for educators to think about their students’ cultural backgrounds and goals, and think about the best way to 1) support students with writing assignments in their class, especially in first-year classes, to inspire confidence, and 2) think about the best ways to engage students in thinking about prosocial connections in their particular context, perhaps using examples generated from focus groups. One possibility would be to mix prosocial-combined and standard UVIs across a semester, to capitalize on the power of the standard UVI and the additional benefits of the prosocial-combined UVI that worked to promote motivation and performance in these studies.
How Does the UVI Work?
The UVI, in general, is an assignment that encourages a different kind of engagement with course content. It promotes active learning and personal, narrative writing which can foster personally meaningful connections with the material, within the context of a content-based course assignment. It has long been known that active learning and well-designed writing assignments can improve performance in college science classes (Bean & Melzer, 2021; Freeman et al., 2014, Handelsman et al., 2004), but even when writing assignments are part of the science curriculum, they may not emphasize personal values or prosocial applications of course content. The UVI is a short essay assignment that focuses on scientific content, and it leverages this active learning tool to promote engagement with course content, to foster both learning and motivation. As our linguistic analyses revealed, the genre of the writing assignment (summarizing course material and discussing the value of the topics vs. only summarizing) changes the style of students’ writing, resulting in essays that are longer (indicating increased engagement) and more narrative. Furthermore, within the context of such utility-value writing assignments, changes to the assignment itself (focusing on personal and prosocial value vs. a singular focus on personal value) changes the content of students’ writing, with prosocial UVIs eliciting more words about helping others. Introducing these features into course assignments provides a forum for students to explore connections between what they are learning and their broader values and goals, with important consequences for motivation, performance, and persistence in STEM.
Why is the Prosocial-Combined UVI Particularly Effective for FG Students?
This type of assignment goes against the grain of “typical” writing assignments in science classes (e.g., lab reports, scientific summaries), but it allows students who are inclined to write in a more personal and narrative way to bring these strengths and this perspective to their work in gateway science courses. Our analyses in the control group (Study 2), where students were writing more typical scientific essays, revealed that FG students wrote less analytically and earned lower essay grades. However, in UVI conditions (which encourage a less analytic style) in both Studies 2a and 3, FG students earned higher essay grades.
Although FG-majority students earned higher essay grades in both UVI conditions (standard and prosocial-combined), they showed heightened responsivity when the assignment asked them to write about both personal and prosocial values: FG-majority students with high levels of confidence then became more interested in the course, and they perceived their instructors as having more prosocial values in the prosocial-combined UVI condition. In Study 2, we examined the psychological processes through which the prosocial-combined UVI promoted performance for confident FG students, and we found evidence for interest in chemistry as a mechanism. Among more confident FG students, the prosocial-combined UVI increased interest in chemistry and this partially mediated the effect on course grades for these students. In other words, the intervention changed the way they felt about the subject of chemistry (becoming more interested), and this change helped more confident FG students perform better in the course. This novel finding provides the first evidence for how prosocial UVIs can be used to change students’ experiences in introductory courses and their perceptions of the field in ways that can help to broaden participation in STEM.
The prosocial-combined UVI is a great fit for some students, especially first-generation students, who focus on family and community connections when navigating a new academic experience in higher education. Furthermore, many students, across demographic groups, endorse prosocial goals for their education and careers (e.g., Allen et al., 2015; Gibbs & Griffin, 2013; Thoman et al., 2015), and they can all benefit from prosocial-combined UVIs, as seen in the more general effects in the Spring semester of chemistry, and the long-term effects of the prosocial-combined UVI in chemistry on performance in the biology class (Study 3). A UVI that provides students with a platform to explore prosocial connections has the potential to support student motivation and persistence in STEM, for all students, but especially those for whom prosocial goals are central to their personal and/or cultural identities.
How Does the Prosocial-Combined UVI Change Perceptions of STEM Fields?
Although many students are initially attracted to STEM fields because they want to make the world a better place, give back to their communities and families, and help others, they often encounter gateway science courses where these prosocial reasons for studying STEM are not emphasized (Benson-Greenwald et al., 2021; Cech, 2014; Harper et al., 2019). We developed the prosocial-combined UVI by expanding the standard UVI to explicitly include prosocial values. This small curricular change may establish an expectation for students that prosocial connections with the material are valued by their instructors and (by extension) scientists and the field more generally. This could have longer-term effects on students’ academic decisions. Importantly, the prosocial-combined intervention is flexible, allowing students to make the kinds of personal and prosocial connections that are most important to them. For example, FG students, who had the strongest motives to give back to their families and communities, used more family words in the prosocial-combined UVI condition. This flexibility makes the UVI an ideal tool to help reimagine the introductory STEM classroom experience to appeal to a larger number of students. In sum, the prosocial-combined UVI provides opportunities for students to (re)explore the connections between what they’re learning and the personal and prosocial goals that brought them to STEM in the first place.
Do UVI Effects Depend on Contextual Factors?
An emerging perspective in behavioral science, informed by a growing body of empirical work, suggests that most interventions should be expected to have different effects in different contexts (see Bryan et al., 2021; Walton & Yeager, 2020). The present research tested the effects of a UVI across several different types of learning environments: across universities (Study 1 vs. Studies 2 and 3), across disciplines within the same university (Study 2 vs. Study 3), and across semesters within a single course (Study 2). This provided an unprecedented opportunity to explore potential heterogeneity of UVI effects within a single program of research, and to examine two novel potential sources of heterogeneity (i.e., differences in effects across disciplines and semesters).
Consistent with this heterogeneity-informed perspective on interventions, we found that, indeed, effects of the UVI varied across contexts. For example, in the Spring semester of the chemistry course (Study 2), the prosocial-combined UVI increased course grades, confidence, interest, and perceptions of instructors’ prosocial values and decreased concern about background (whereas effects in the Fall semester depended more on student characteristics). Similarly, the positive intervention effects for FG students in the biology course (Study 3) did not depend on confidence, whereas these effects did depend on confidence in the chemistry course.
These findings point to several contextual factors that could potentially explain heterogeneous UVI results. For example, the Fall and Spring semesters of chemistry differed in terms of the makeup of peers in the class (i.e., on-sequence vs. off-sequence students) and the availability of academic supports for students. Similarly, the chemistry and biology classes differed in terms of peer makeup (i.e., first-year vs. second- or third-year students), and discipline. Recent research suggests that interventions may be more effective in contexts that provide more support (or “affordances”) for students to enact the potentially-adaptive learning behaviors promoted by an intervention (see Hecht et al., 2021; Walton & Yeager, 2020). Therefore, it is possible that the additional academic supports in the spring semester of chemistry, the peer culture and norms of more advanced STEM students in biology, or other factors that differed between the contexts may have facilitated stronger overall effects in these two contexts, whereas effects depended more on student characteristics in the Fall semester of chemistry. An exciting and important avenue for future research will be to use heterogeneity-informed scientific methods (e.g., use of probability sampling, informed selection of potential contextual moderators; see Bryan et al., 2021) to systematically study such heterogeneity of UVI effects. The present research lays a critical foundation to inform that future work by highlighting several characteristics of the context that may determine where and for whom UVIs can be most effective.
What Are the Potential Long-Term Effects of UVIs?
How might these effects carry forward? Any boost in performance in a gateway class, especially if taken the first or second year of college, can have significant consequences. Performance in gateway courses can send a strong signal to students of their potential to succeed in the field, and the confidence and motivation that higher grades in these courses can stimulate may embolden them to proceed in the field (Harris et al., 2020; Hecht, Priniski, et al., 2019). In addition, higher grades in these courses may promote persistence for more practical or structural reasons. For example, students may abandon a major if they believe they could achieve a higher GPA and thereby improve their career prospects in a different field. Finally, if a UVI helps to develop students’ interest in a field, this may motivate them to enroll in additional courses, and possibly choose a major or a career in that field (Rosenzweig et al., 2021).
Indeed, the UVI stimulates all of these processes, and the effects on the future planning variables in Studies 2 and 3 (career/degree plans and deeper involvement) are two markers of the significance of UVIs for future consequences (Asher et al., 2023). Furthermore, in Study 3 we found the first evidence that a UVI implemented in one course (introductory chemistry) can have positive effects on performance in a second gateway course (introductory biology). Our analyses with the subset of students who participated in both Study 2 and Study 3 suggest that multiple exposures to UVIs may have additive benefits, with positive effects in the biology course of both the current and previous prosocial-combined UVI. These results suggest that implementation of UVIs across multiple courses in the STEM introductory sequence could help to address inequities in course performance while also helping to change students’ perceptions of the culture of STEM. Small curricular changes in gateway science classes may create real change, making STEM courses more responsive to students’ personal and prosocial values, with important implications for promoting diversity in STEM fields.
Supplementary Material
Acknowledgments
This material is based upon the work supported by the National Institute of Health (Grants R35GM141556 and R01GM102703 to the University of Wisconsin). Cameron A. Hecht, Michael W. Asher, and Stacy J. Priniski were all supported by grants from the Institute of Educational Sciences, U.S. Department of Education, through Award R305B090009 and R305B150003 to the University of Wisconsin-Madison. We thank Jing Shen and Jenna Heinze for their management of this project, as well as Alexander Latham, Craig Lundeen, Jonathan Tansey and Taiming Xue for their leadership in the lab. We thank Clark Landis, Edwin Sibert and the UW Chemistry faculty for their support. We also thank the course instructors, Paul Hooker, Gilbert Nathanson, Linda Zelewski, and Martin Zanni for their cooperation, and we thank senior instructional technology specialist Rachel Bain for her help in implementing this study in introductory chemistry. We thank Kerry Martin, Julia Collins, Jeremiah Yahn, and Seth Blair, as well as all the instructional faculty in introductory biology for their continued support of this research project. Finally, we thank Megan Bruun, Cora Parrisius and Emily Rosenzweig for their help with many aspects of this study, and we thank all the research assistants who helped with data collection. Preregistrations for Study 2 are available on AsPredicted (see https://aspredicted.org/N7M_HSH, https://aspredicted.org/5LL_2D3, and https://aspredicted.org/HX8_12S). Deidentified data and analysis scripts for Studies 1 and 2 are available at https://osf.io/kmnrw.
Appendix A. Prompts and Examples
| Leading Text | Select a concept that was covered in lecture and formulate a question. Use this question as the title of your essay. Write a 500–600 word essay answering this question, and discuss how the information could be …. |
| Standard UVI Prompt | …useful to you in your own life. |
| Standard UVI Examples |
|
| Prosocial-Only UVI Prompt | …helpful to other people (e.g., useful for benefiting society, giving back to your community, or helping your friends or family members). |
| Prosocial-Only UVI Examples |
|
| Prosocial-Combined UVI Prompt | …useful to you in your own life and how this information could be helpful to other people (e.g., useful for benefiting society, giving back to your community, or helping your friends or family members). |
| Prosocial-Combined UVI Examples |
|
Appendix B. Scales
| Measure | Items |
|---|---|
| Confidence |
|
| Concern about background |
|
| Future plans |
|
| Interest |
|
| Prosocial chemistry motivation | I want to study chemistry because…
|
| Family/community helping motives |
|
| General helping motives |
|
| Plans for involvement in chemical and health sciences |
|
| Perceptions of instructor’s values | My instructor…
|
Appendix C. Power Analysis
For Study 2, we wished to understand the sample size required to test for treatment effects with small, intersectional subgroups of students (e.g. those who were FG, URM, and Male). Prior UVI researchers (Harackiewicz, Canning, et al., 2016) tested for and detected a treatment effect (of d = .55) with a subgroup of 64 FG-URM students. We wanted to understand if it was appropriate to continue testing for treatment effects for subgroups of this approximate size.
In our present research, we expected to have less statistical power than Harackiewicz and colleagues did, as they included college GPA as a covariate in all analyses of effects on course grade, and we lack this variable because our sample primarily consists of first-semester freshmen. Based on prior correlations of confidence and course performance, we assumed that a nine-term model (that includes terms for UVI vs. control, FG status, gender, perceived competence, semester, and four two-way interactions between UVI vs. control and the other terms) would have an R2 of approximately .1.
Using “PowerUp!” software in R (Dong, Kelcey, Spybrook, & Maynard, 2017), we generated power estimates given these assumptions about covariates for an effect size of d = .55:
Figure C2.
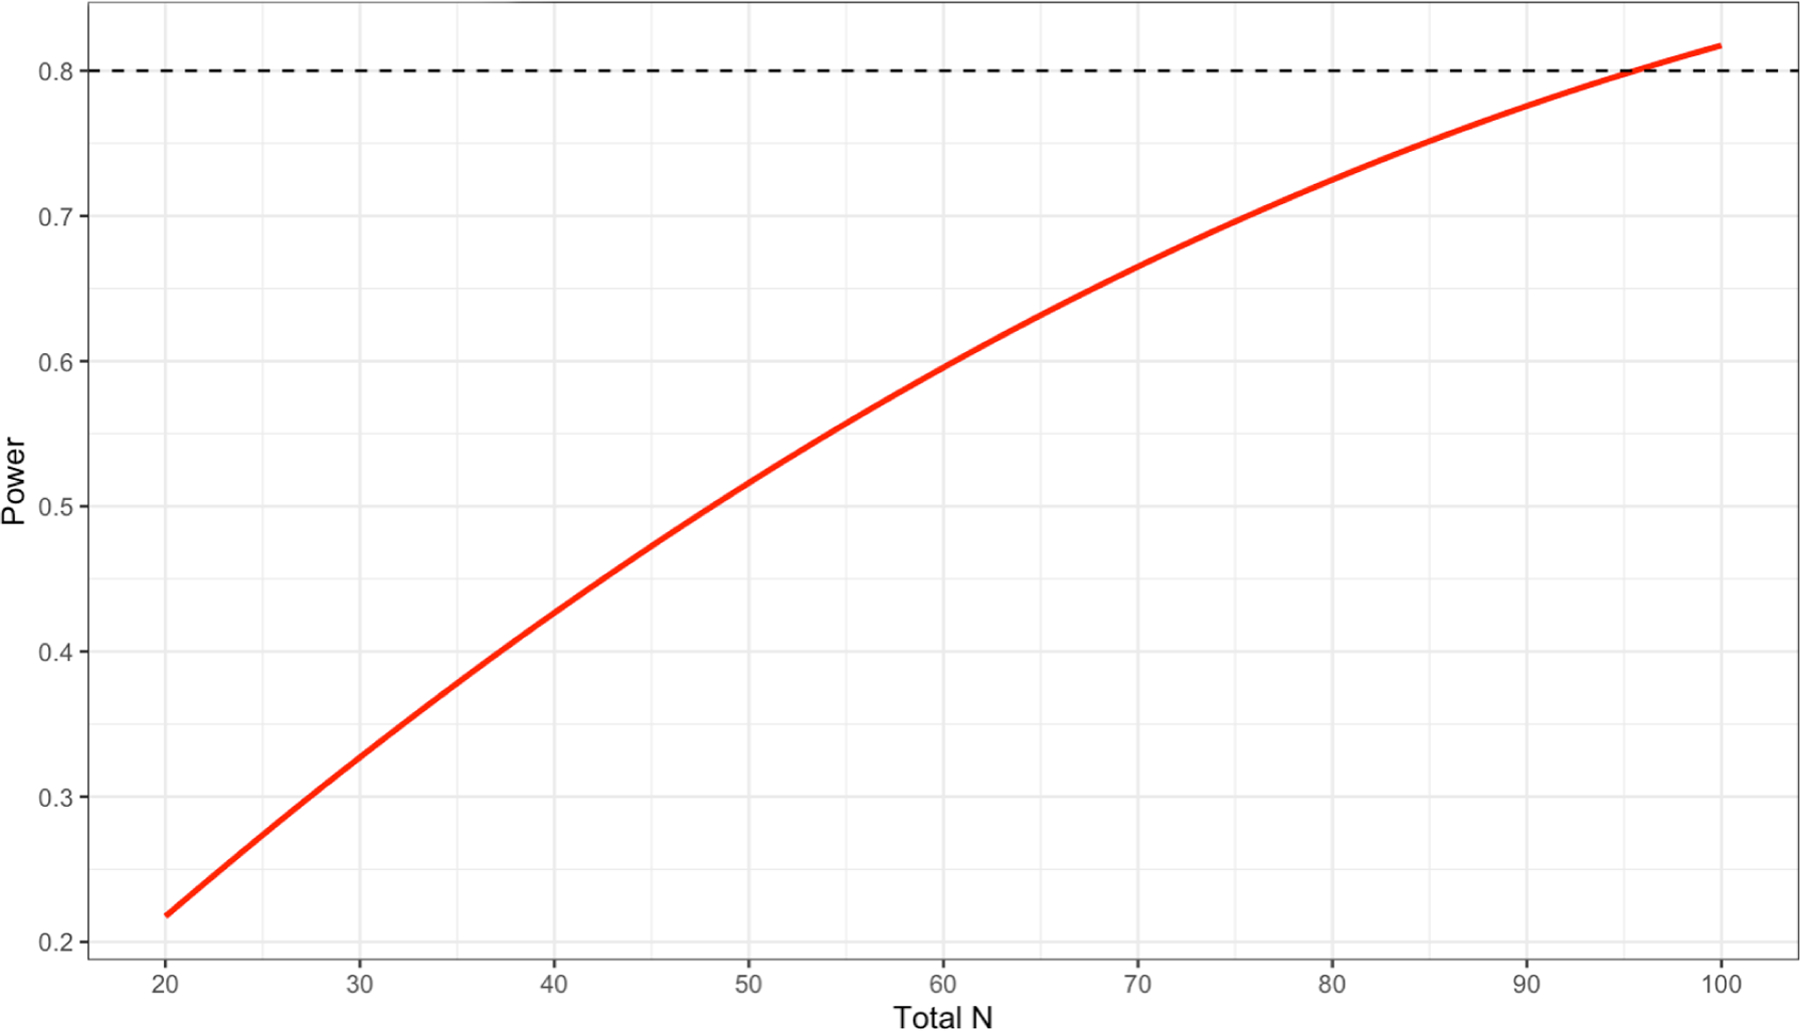
Power analysis for subgroups.
This analysis shows that we would require 96 participants (48 per condition) to detect a treatment effect of the size observed in prior literature with 80% power. It also shows that if we were we to analyze the data with approximately 30 participants per condition (as has been done in prior UVI research), there would be ~60% power. This is not an ideal level of power, but given that underrepresented students are, by definition, rare in science classes, we decided to proceed with subgroup analyses when we have at least 30 subgroup members per condition.
Footnotes
Research has shown that women have higher levels of communal motivation and endorse more prosocial goals (Brown et al., 2015; Diekman et al., 2010). However, we did not focus on gender in this set of intervention studies, because women are not underrepresented in undergraduate chemistry or biology. Chemistry is the most equitable of the physical sciences with respect to bachelor’s degree attainment, and women are well represented in undergraduate biology (over 50% of chemistry degrees and 63% of biology degrees awarded to women in 2018; NCSES, 2021). Nonetheless, greater inequities may be present in terms of advanced degrees and career options, and we tested for gender effects in all analyses.
Replication tests in Studies 2a and 2b, which included FG and URM students, were consistent with the replication results reported here. Furthermore, these results were also replicated in Study 3. See Supplement for details.
In the present study, confidence was significantly correlated with other measures of background and preparation, but these correlations were also low (r’s for ACT, .19, high school GPA, .05, and family income, .08; see Table 5), suggesting that measures of prior performance and confidence may function differently in the context of college science courses.
Some of the data reported in Study 2 were previously published in Asher et al., 2023. Whereas the present research focuses on the shorter-term effects of the UVIs, assessed during and immediately following the chemistry course, Asher and colleagued (2023) focused on how the UVIs influenced persistence in STEM fields, assessed approximately 2.5 years post intervention.
174 students were assigned to the prosocial-only condition for Study 1b. They are not included in Study 2.
In all analyses, the three students who identified as non-binary were not assigned a score on the gender variable; their remaining data were retained using full information maximum likelihood estimation.
Previous research has examined students’ prior college GPA as a baseline measure (e.g., Harackiewicz, Canning, et al., 2016), but the vast majority of the students in the Fall sample (93%) were first-semester freshmen and therefore did not have prior GPAs. We include composite ACT scores and high school GPA as indicators of preparation for college, but these measures were not available for all students.
The other three items did not concern helping, but rather, other aspects of interdependence: “Bring honor to my community,” “Show that people with my background can do well,” “Be a role model for people in my community”
We also tested a comparable model testing interest as a mediator of the effect of the Prosocial-Combined UVI vs. Control × Semester effect. As with the previous moderated mediation model, we found a significant index of moderated mediation (see Supplement for more details).
We omitted prosocial biology motivation from the model because this variable was at ceiling and had little variance, in stark contrast to the prosocial chemistry motivation tested in Study 2. See Supplement for details.
Based on our previously specified power rules, we were unable to test interactions between prior Chemistry condition and URM status, or between prior Chemistry condition and Chemistry semester.
In addition, given that UVI condition and semester were confounded for URM students due to design issues, we also tested this model with only the students who had been in Study 2a (i.e., majority students), in which both UVI conditions were tested each semester. In this model, the positive effect of Chemistry prosocial-combined UVI on course grade remained significant and unchanged in magnitude. The effect of Chemistry prosocial-combined UVI on deeper involvement was slightly smaller and non-significant in this subsample, β = .10, p = .081.
References
- Allen JM, Muragishi GA, Smith JL, Thoman DB, & Brown ER (2015). To grab and to hold: Cultivating communal goals to overcome cultural and structural barriers in first-generation college students’ science interest. Translational Issues in Psychological Science, 1(4), 331–341. 10.1037/tps0000046 [DOI] [PMC free article] [PubMed] [Google Scholar]
- Alvero AJ, Giebel S, Gebre-Medhin B, Antonio AL, Stevens ML, & Domingue BW (2021). Essay content is strongly related to household income and sat scores: Evidence from 60,000 undergraduate applications. Science Advances, 7(42). 10.1126/sciadv.abi9031 [DOI] [PMC free article] [PubMed] [Google Scholar]
- Aronson J, Fried CB, & Good C (2002). Reducing the effects of stereotype threat on African American college students by shaping theories of intelligence. Journal of Experimental Social Psychology, 38(2), 113–125. 10.1006/jesp.2001.1491 [DOI] [Google Scholar]
- Asai D, Alberts B, & Coffey J Redo college intro science. Science, 375, 1321–1321. [DOI] [PubMed] [Google Scholar]
- Asher MW, Harackiewicz JM, Beymer PN, Hecht CA, Lamont LB, Else-Quest NM, Priniski SJ, Thoman DB, Hyde JS, & Smith JL (2023). Utility-value intervention promotes persistence and diversity in STEM. Proceedings of the National Academy of Science (PNAS), 120, No. 19. 10.1073/pnas.2300463120 [DOI] [PMC free article] [PubMed] [Google Scholar]
- Bandura A (1982). Self-efficacy mechanism in human agency. American Psychologist, 37(2), 122–147. 10.1037/0003-066X.37.2.122 [DOI] [Google Scholar]
- Bean JC, & Melzer D (2021). Engaging ideas: The professor’s guide to integrating writing, critical thinking, and active learning in the classroom (3rd edition). John Wiley & Sons, Incorporated. [Google Scholar]
- Belanger AL, Diekman AB, & Steinberg M (2017). Leveraging communal experiences in the curriculum: Increasing interest in pursuing engineering by changing stereotypic expectations. Journal of Applied Social Psychology, 47(6), 305–319. 10.1111/jasp.12438 [DOI] [Google Scholar]
- Benson-Greenwald T, Trujillo A, White AD, & Diekman A (2021). Science for others or the self? Presumed motives for science shape public trust in science. Personality and Social Psychology Bulletin, 1–17. 10.1177/01461672211064456 [DOI] [PubMed] [Google Scholar]
- Brady ST, Reeves SL, Garcia J, Purdie-Vaughns V, Cook JE, Taborsky-Barba S, Tomasetti S, Davis EM, & Cohen GL (2016). The psychology of the affirmed learner: Spontaneous self-affirmation in the face of stress. Journal of Educational Psychology, 108(3), 353–373. 10.1037/edu0000091 [DOI] [Google Scholar]
- Brown ER, Smith JL, Thoman DB, Allen JM, & Muragishi G (2015). From bench to bedside: A communal utility value intervention to enhance students’ biomedical science motivation. Journal of Educational Psychology, 107(4), 1116–1135. 10.1037/edu0000033 [DOI] [PMC free article] [PubMed] [Google Scholar]
- Bryan CJ, Tipton E, & Yeager DS (2021). Behavioural science is unlikely to change the world without a heterogeneity revolution. Nature Human Behaviour, 5(8), 980–989. 10.1038/s41562-021-01143-3 [DOI] [PMC free article] [PubMed] [Google Scholar]
- Canning EA, Harackiewicz JM, Priniski SJ, Hecht CA, Tibbetts Y, & Hyde JS (2018). Improving performance and retention in introductory biology with a utility-value intervention. Journal of Educational Psychology, 110(6), 834–849. 10.1037/edu0000244 [DOI] [PMC free article] [PubMed] [Google Scholar]
- Cech EA (2014). Culture of disengagement in engineering education? Science, Technology, & Human Values, 39(1), 42–72. 10.1177/0162243913504305 [DOI] [Google Scholar]
- Chang MJ, Sharkness J, Hurtado S, & Newman CB (2014). What matters in college for retaining aspiring scientists and engineers from underrepresented racial groups. Journal of Research in Science Teaching, 51(5), 555–580. 10.1002/tea.21146 [DOI] [Google Scholar]
- Covarrubias R, Herrmann SD, & Fryberg SA (2016). Affirming the interdependent self: Implications for Latino student performance. Basic and Applied Social Psychology, 38(1), 47–57. 10.1080/01973533.2015.1129609 [DOI] [Google Scholar]
- Diekman AB, Brown ER, Johnston AM, & Clark EK (2010). Seeking congruity between goals and roles: A new look at why women opt out of science, technology, engineering, and mathematics careers. Psychological Science, 21(8), 1051–1057. 10.1177/0956797610377342 [DOI] [PubMed] [Google Scholar]
- Diekman AB, Clark EK, & Belanger AL (2019). Finding common ground: Synthesizing divergent theoretical views to promote women’s STEM pursuits. Social Issues and Policy Review, 13(1), 182–210. 10.1111/sipr.12052 [DOI] [Google Scholar]
- Diekman AB, Clark EK, Johnston AM, Brown ER, & Steinberg M (2011). Malleability in communal goals and beliefs influences attraction to stem careers: Evidence for a goal congruity perspective. Journal of Personality and Social Psychology, 101(5), 902–918. 10.1037/a0025199 [DOI] [PubMed] [Google Scholar]
- Diekman AB, Joshi MP, & Benson-Greenwald TM (2020). Goal congruity theory: Navigating the social structure to fulfill goals. In Gawronski B (Ed.), Advances in experimental social psychology (Vol. 62, pp. 189–244). Academic Press. 10.1016/bs.aesp.2020.04.003 [DOI] [Google Scholar]
- Diekman AB, & Steinberg M (2013). Navigating social roles in pursuit of important goals: A communal goal congruity account of STEM pursuits. Social and Personality Psychology Compass, 7(7), 487–501. 10.1111/spc3.12042 [DOI] [Google Scholar]
- Dong N, & Maynard RA (2013). PowerUp!: A tool for calculating minimum detectable effect sizes and minimum required sample sizes for experimental and quasi-experimental design studies. Journal of Research on Educational Effectiveness, 6(1), 24–67. [Google Scholar]
- Eccles JS, Adler TF, Futterman R, Goff SB, Kaczala CM, Meece JL, & Midgley C (1983). Expectations, values and academic behaviors. In Spence JT (Ed.), Perspective on achievement and achievement motivation (pp. 75–146). Freeman. [Google Scholar]
- Eccles JS, & Wigfield A (2020). From expectancy-value theory to situated expectancy-value theory: A developmental, social cognitive, and sociocultural perspective on motivation. Contemporary Educational Psychology, 61, 101859. 10.1016/j.cedpsych.2020.101859 [DOI] [Google Scholar]
- Flanders GR (2017). The effect of gateway course completion on freshman college student retention. Journal of College Student Retention: Research Theory & Practice, 19(1), 2–24. 10.1177/1521025115611396 [DOI] [Google Scholar]
- Freeman S, Eddy SL, McDonough M, Smith MK, Okoroafor N, Jordt H, & Wenderoth MP (2014). Active learning increases student performance in science, engineering, and mathematics. Proceedings of the National Academy of Sciences, 111(23), 8410–8415. 10.1073/pnas.1319030111 [DOI] [PMC free article] [PubMed] [Google Scholar]
- Frimer JA, Schaefer NK, & Oakes H (2014). Moral actor, selfish agent. Journal of Personality and Social Psychology, 106(5), 790–802. 10.1037/a0036040 [DOI] [PubMed] [Google Scholar]
- Fryberg SA, & Markus HR (2007). Cultural models of education in American Indian, Asian American and European American contexts. Social Psychology of Education, 10(2), 213–246. 10.1007/s11218-007-9017-z [DOI] [Google Scholar]
- Gasiewski JA, Eagan MK, Garcia GA, Hurtado S, & Chang MJ (2012). From gatekeeping to engagement: A multicontextual mixed method study of student academic engagement in introductory stem courses. Research in Higher Education, 53, 229–261. 10.1007/s11162-011-9247-y [DOI] [PMC free article] [PubMed] [Google Scholar]
- Gaspard H, Parrisius C, Piesch H, Kleinhansl M, Wille E, Nagengast B, Trautwein U, & Hulleman CS (2021). The potential of relevance interventions for scaling up: A cluster-randomized trial testing the effectiveness of a relevance intervention in math classrooms. Journal of Educational Psychology, 113(8), 1507–1528. 10.1037/edu0000663 [DOI] [Google Scholar]
- Gibbs KD, & Griffin KA (2013). What do I want to be with my PhD? The roles of personal values and structural dynamics in shaping the career interests of recent biomedical science PhD graduates. CBE- Life Sciences Education, 12, 711–723. [DOI] [PMC free article] [PubMed] [Google Scholar]
- Gray DL, Ali JN, McElveen TL, & Sealy M (2022). The cultural significance of “we-ness”: Motivationally influential practices rooted in a scholarly agenda on black education. Educational Psychology Review. 10.1007/s10648-022-09708-y [DOI] [Google Scholar]
- Handelsman J, Ebert-May D, Beichner R, Bruns P, Chang A, DeHaan R, Gentile J, Lauffer S, Stewart J, Tilghman SM, & Wood WB (2004). Scientific teaching. Science, 23(304), 521–522. 10.1126/science.1096022 [DOI] [PubMed] [Google Scholar]
- Harackiewicz JM, Canning EA, Tibbetts Y, Giffen CJ, Blair SS, Rouse DI, & Hyde JS (2014). Closing the social class achievement gap for first-generation students in undergraduate biology. Journal of Educational Psychology, 106, 375–389. 10.1037/a0034679 [DOI] [PMC free article] [PubMed] [Google Scholar]
- Harackiewicz JM, Canning EA, Tibbetts Y, Priniski SJ, & Hyde JS (2016). Closing achievement gaps with a utility-value intervention: Disentangling race and social class. Journal of Personality and Social Psychology, 111(5), 745–765. 10.1037/pspp0000075 [DOI] [PMC free article] [PubMed] [Google Scholar]
- Harackiewicz JM, Durik AM, Barron KE, Linnenbrink-Garcia L, & Tauer J (2008). The role of achievement goals in the development of interest: Reciprocal relations between achievement goals, interest, and performance. Journal of Educational Psychology, 100, 105–122. 10.1037/0022-0663.100.1.105 [DOI] [Google Scholar]
- Harackiewicz JM, & Priniski SJ (2018). Improving student outcomes in higher education: The science of targeted intervention. Annual Review of Psychology, 69(1), 409–435. 10.1146/annurev-psych-122216-011725 [DOI] [PMC free article] [PubMed] [Google Scholar]
- Harackiewicz JM, Smith JL, & Priniski SJ (2016). Interest matters. Policy Insights from the Behavioral and Brain Sciences, 3(2), 220–227. 10.1177/2372732216655542 [DOI] [PMC free article] [PubMed] [Google Scholar]
- Harackiewicz JM, Tibbetts Y, Canning EA, & Hyde JS (2014). Harnessing values to promote motivation in education. In Karabenick S and Urden T (Eds.), Motivational interventions, advances in motivation and achievement, Vol 18 (pp. 71–105), Emerald Group Publishing. [DOI] [PMC free article] [PubMed] [Google Scholar]
- Harper RP, Weston TJ, & Seymour E (2019). Student responses to problematic STEM teaching methods. In Seymour E & Hunter AB (Eds.) Talking about leaving revisited (pp. 149–196). Springer. [Google Scholar]
- Harris RB, Mack MR, Bryant J, Theobald EJ, & Freeman S (2020). Reducing achievement gaps in undergraduate general chemistry could lift underrepresented students into a “hyperpersistent zone”. Science Advances, 6(24). 10.1126/sciadv.aaz5687 [DOI] [PMC free article] [PubMed] [Google Scholar]
- Hayes AF (2015). An index and test of linear moderated mediation. Multivariate Behavioral Research, 50, 1–22. 10.1080/00273171.2014.962683 [DOI] [PubMed] [Google Scholar]
- Hecht CA, Harackiewicz JM, Priniski SJ, Canning EA, Tibbetts Y, & Hyde JS (2019). Promoting persistence in the biological and medical sciences: An expectancy-value approach to intervention. Journal of Educational Psychology, 111(8), 1462–1477. 10.1037/edu0000356 [DOI] [PMC free article] [PubMed] [Google Scholar]
- Hecht CA, Priniski SJ, & Harackiewicz JM (2019). Understanding long-term effects of motivation interventions in a changing world. In Gonida E & Lemos M (Eds.), Motivation in education at a time of global change: Theory, research, and implications for practice, Advances in Motivation and Achievement, Vol 20 (pp. 81–98), Esmerald Group Publishing. [DOI] [PMC free article] [PubMed] [Google Scholar]
- Hecht CA, Yeager DS, Dweck CS, & Murphy MC (2021). Beliefs, affordances, and adolescent development: Lessons from a decade of growth mindset interventions. Advances in Child Development and Behavior, 169–197. 10.1016/bs.acdb.2021.04.004 [DOI] [PMC free article] [PubMed] [Google Scholar]
- Hidi SE, Renninger KA, & Northoff G (2019). The educational benefits of self-related information processing. In Renninger KA & Hidi SE (Eds.), The Cambridge Handbook of Motivation and Learning (pp. 15–35). Cambridge University Press. 10.1017/9781316823279.003 [DOI] [Google Scholar]
- Huerta M, & Garza T (2019). Writing in science: Why, how, and for whom? A systematic literature review of 20 years of intervention research (1996–2016). Educational Psychology Review, 31(3), 533–570. 10.1007/s10648-019-09477-1 [DOI] [Google Scholar]
- Hulleman CS, Godes O, Hendricks BL, & Harackiewicz JM (2010). Enhancing interest and performance with a utility value intervention. Journal of Educational Psychology, 102(4), 880–895. 10.1037/a0019506 [DOI] [Google Scholar]
- Hulleman CS, & Harackiewicz JM (2009). Promoting interest and performance in high school science classrooms. Science, 326(5958), 1410–1412. 10.1126/science.1177067 [DOI] [PubMed] [Google Scholar]
- Hulleman CS, & Harackiewicz JM (2020). The utility-value intervention. In Walton GM and Crum A (Eds.), The handbook of wise interventions (pp. 100–125). Guilford Press. [Google Scholar]
- Hulleman CS, Kosovich JJ, Barron KE, & Daniel DB (2017). Making connections: Replicating and extending the utility value intervention in the classroom. Journal of Educational Psychology, 109(3), 387–404. 10.1037/edu0000146 [DOI] [Google Scholar]
- Ives J, & Castillo-Montoya M (2020). First-generation college students as academic learners: A systemic review. Review of Educational Research, 90(2), 139–178. 10.3102/0034654319899707 [DOI] [Google Scholar]
- Jackson MC, Galvez G, Landa I, Buonora P, & Thoman DB (2016). Science that matters: The importance of a cultural connection in underrepresented students’ science pursuit. CBE—Life Sciences Education, 15(3), ar42. 10.1187/cbe.16-01-0067 [DOI] [PMC free article] [PubMed] [Google Scholar]
- Koch AK (2017). It’s about the gateway courses: Defining and contextualizing the issue. New Directions for Higher Education, 2017(180), 11–17. 10.1002/he.20257 [DOI] [Google Scholar]
- LaMeres BJ, Burns MS, Thoman DB, & Smith JL (2019). The role of prosocial goal congruity on student motivation in electrical engineering. IEEE Transactions on Education, 62(4), 256–263. 10.1109/te.2019.2897265 [DOI] [Google Scholar]
- Martin JE, & Martin EP (1985). The helping tradition in the Black family and community. National Association of Social Workers Press. [Google Scholar]
- McGee E, & Bentley L (2017). The equity ethic: Black and latinx college students reengineering their STEM careers toward justice. American Journal of Education, 124(1), 1–36. 10.1086/693954 [DOI] [Google Scholar]
- Morra B (2018). The chemistry connections challenge: Encouraging students to connect course concepts with real-world applications. Journal of Chemical Education, 95(12), 2212–2215. 10.1021/acs.jchemed.8b00137 [DOI] [Google Scholar]
- Nagengast B, Marsh HW, Scalas LF, Xu MK, Hau K, & Trautwein U (2011). Who took the “x” out of expectancy-value theory? A psychological mystery, a substantive-methodological synergy, and a cross-national generalization. Psychological Science, 22(8), 1058–1066. 10.1177/0956797611415540 [DOI] [PubMed] [Google Scholar]
- National Academies of Sciences, Engineering, and Medicine (2018). Advancing economic development and workforce readiness in micropolitan areas. Retrieved from https://www.nap.edu/catalog/25339/advancing-economic-development-and-workforce-readiness-in-micropolitan-areas-proceedings
- National Center for Education Statistics (2022). Elementary/ Secondary Information System. Retrieved from https://nces.ed.gov/ccd/elsi
- National Center for Science and Engineering Statistics (NCSES) (2021). Women, minorities, and persons with disabilities in science and engineering (NSF-21–321). Alexandria, VA: National Science Foundation. Retrieved from https://ncses.nsf.gov/pubs/nsf21321/data-tables#group4 [Google Scholar]
- National Institutes of Health (2019). Notice of NIH’s interest in diversity. Retrieved from https://grants.nih.gov/grants/guide/notice-files/NOT-OD-20-031.html
- National Science Board. (2019). The skilled technical workforce: Crafting America’s science & engineering enterprise (NSB-2019–23). Arlington, VA: National Science Foundation. Retrieved from https://www.nsf.gov/nsb/publications/2019/nsb201923.pdf [Google Scholar]
- Oyserman D (2007). Social identity and self-regulation. In Kruglanski AW & Higgins ET (Eds.), Social psychology: Handbook of basic principles (2nd ed.). Guilford. [Google Scholar]
- Pennebaker JW, Boyd RL, Jordan K, & Blackburn K (2015). The development and psychometric properties of LIWC2015. University of Texas at Austin. [Google Scholar]
- Pennebaker JW, Chung CK, Frazee J, Lavergne GM, & Beaver DI (2014). When small words foretell academic success: The case of college admissions essays. PLoS ONE, 9(12): e115844. 10.1371/journal.pone.0115844 [DOI] [PMC free article] [PubMed] [Google Scholar]
- Petersen J (2018). Gender differences in verbal performance: A meta-analysis of United States state performance assessments. Educational Psychology Review, 30(4), 1269–1281. 10.1007/s10648-018-9450-x [DOI] [Google Scholar]
- Pietraszkiewicz A, Formanowicz M, Sendén MG, Boyd RL, Siksröm S, & Sczesny S (2019). The big two dictionaries: Capturing agency and communion in natural language. European Journal of Social Psychology, 49 (5), 871–887. 10.1002/ejsp.2561 [DOI] [Google Scholar]
- Priniski SJ, Hecht CA, & Harackiewicz JM (2018). Making learning personally meaningful: A new framework for relevance research. The Journal of Experimental Education, 86(1), 11–29. 10.1080/00220973.2017.1380589 [DOI] [PMC free article] [PubMed] [Google Scholar]
- Priniski SJ, Rosenzweig EQ, Canning EA, Hecht CA, Tibbetts Y, Hyde JS, & Harackiewicz JM (2019). The benefits of combining value for the self and others in utility-value interventions. Journal of Educational Psychology, 111(8), 1478–1497. 10.1037/edu0000343 [DOI] [PMC free article] [PubMed] [Google Scholar]
- Reilly D, Neumann DL, & Andrews G (2019). Gender differences in reading and writing achievement: Evidence from the national assessment of educational progress (NAEP). American Psychologist, 74(4), 445–458. 10.1037/amp0000356 [DOI] [PubMed] [Google Scholar]
- Renninger KA, Bachrach JE, & Hidi SE (2019). Triggering and maintaining interest in early phases of interest development. Learning, Culture and Social Interaction, 23, 100260. 10.1016/j.lcsi.2018.11.007 [DOI] [Google Scholar]
- Renninger KA, & Hidi S (2011). Revisiting the conceptualization, measurement, and generation of interest. Educational Psychologist, 46, 168–184. [Google Scholar]
- Rosenzweig EQ, Wigfield A, & Hulleman CS (2020). More useful or not so bad? Examining the effects of utility value and cost reduction interventions in college physics. Journal of Educational Psychology, 112(1), 166–182. 10.1037/edu0000370 [DOI] [Google Scholar]
- Rosenzweig EQ, Wigfield A, Gaspard H, & Guthrie JT (2018). How do perceptions of importance support from a reading intervention affect students’ motivation, engagement, and comprehension? Journal of Research in Reading, 41(4), 625–641. 10.1111/1467-9817.12243 [DOI] [PMC free article] [PubMed] [Google Scholar]
- Rosseel Y (2012). Lavaan: An R package for structural equation modeling. Journal of Statistical Software, 48(2), 1–36. 10.18637/jss.v048.i02 [DOI] [Google Scholar]
- Seymour E, & Hunter A-B (2019). Talking about leaving revisited persistence, relocation, and loss in undergraduate STEM Education. Springer International Publishing. 10.1007/978-3-030-25304-2 [DOI] [Google Scholar]
- Shaw EJ, & Barbuti S (2010). Patterns of persistence in intended college major with a focus on STEM majors. NACADA Journal, 30(2), 19–34. 10.12930/0271-9517-30.2.19 [DOI] [Google Scholar]
- Smith JL, Cech E, Metz A, Huntoon M, & Moyer C (2014). Giving back or giving up: Native American student experiences in science and engineering. Cultural Diversity & Ethnic Minority Psychology, 20(3), 413–429. 10.1037/a0036945 [DOI] [PubMed] [Google Scholar]
- Stephens NM, Fryberg SA, Markus HR, Johnson CS, & Covarrubias R (2012). Unseen disadvantage: How American universities’ focus on independence undermines the academic performance of first-generation college students. Journal of Personality and Social Psychology, 102, 1178–1197. 10.1037/a0027143 [DOI] [PubMed] [Google Scholar]
- Stephens NM, Markus HR, & Phillips LT (2014). Social class culture cycles: How three gateway contexts shape selves and fuel inequality. Annual Review of Psychology, 65(1), 611–634. 10.1146/annurev-psych-010213-115143 [DOI] [PubMed] [Google Scholar]
- Stephens NM, Townsend SS, & Dittmann AG (2018). Social-class disparities in higher education and professional workplaces: The role of cultural mismatch. Current Directions in Psychological Science, 28(1), 67–73. 10.1177/0963721418806506 [DOI] [Google Scholar]
- Stephens NM, Townsend SSM, Hamedani MG, Destin M, & Manzo V (2015). A difference-education intervention equips first-generation college students to thrive in the face of stressful college situations. Psychological Science, 26(10), 1556–1566. 10.1177/0956797615593501 [DOI] [PubMed] [Google Scholar]
- Stout JG, Dasgupta N, Hunsinger M, & McManus MA (2011). STEMing the tide: Using ingroup experts to inoculate women’s self-concept in science, technology, engineering, and mathematics (STEM). Journal of Personality and Social Psychology, 100(2), 255–270. 10.1037/a0021385 [DOI] [PubMed] [Google Scholar]
- Terenzini PT, Springer L, Yaeger PM, Pascarella ET, & Nora A (1996). First-generation college students: Characteristics, experiences, and cognitive development. Research in Higher Education, 37(1), 1–22. 10.1007/bf01680039 [DOI] [Google Scholar]
- Thoman DB, Brown ER, Mason AZ, Harmsen AG, & Smith JL (2015). The role of altruistic values in motivating underrepresented minority students for biomedicine. BioScience, 65(2), 183–188. 10.1093/biosci/biu199 [DOI] [PMC free article] [PubMed] [Google Scholar]
- Thorp HH (2022). Stop passing the buck on intro science. Science, 378(6616), 117–117. 10.1126/science.adf2231 [DOI] [PubMed] [Google Scholar]
- Walton GM, & Yeager DS (2020). Seed and soil: Psychological affordances in contexts help to explain where wise interventions succeed or fail. Current Directions in Psychological Science. 29(3), 219–226. 10.1177/0963721420904453 [DOI] [PMC free article] [PubMed] [Google Scholar]
- Wang Y, Rocabado GA, Lewis JE, & Lewis SE (2021). Prompts to promote success: Evaluating utility value and growth mindset interventions on general chemistry students’ attitude and academic performance. Journal of Chemical Education, 98(5), 1476–1488. 10.1021/acs.jchemed.0c01497 [DOI] [Google Scholar]
- Wigfield A & Eccles JS (2020). 35 years of research on students’ subjective task values and motivation: A look back and a look forward. In Elliot AJ (Ed.), Advances in motivation science (Vol. 7, pp. 161–198). Elsevier Inc. 10.1016/bs.adms.2019.05.002 [DOI] [Google Scholar]
- Yeager DS, Henderson MD, Paunesku D, Walton GM, D’Mello S, Spitzer BJ, & Duckworth AL (2014). Boring but important: A self-transcendent purpose for learning fosters academic self-regulation. Journal of Personality and Social Psychology, 107(4), 559–580. 10.1037/a0037637 [DOI] [PMC free article] [PubMed] [Google Scholar]
Associated Data
This section collects any data citations, data availability statements, or supplementary materials included in this article.