

Abstract
INTRODUCTION
The secreted phosphoprotein 1 (SPP1) gene expressed by CD11c+ cells is known to be associated with microglia activation and neuroinflammatory diseases. As most studies rely on mouse models, we investigated these genes and proteins in the cortical brain tissue of older adults and their role in Alzheimer's disease (AD) and related disorders.
METHODS
We leveraged protein measurements, single‐nuclei, and RNASeq data from the Religious Orders Study and Rush Memory and Aging Project (ROSMAP) of over 1200 samples for association analysis.
RESULTS
Expression of SPP1 and its encoded protein osteopontin were associated with faster cognitive decline and greater odds of common neuropathologies. At single‐cell resolution, integrin subunit alpha X (ITGAX) was highly expressed in microglia, where specific subpopulations were associated with AD and cerebral amyloid angiopathy.
DISCUSSION
The study provides evidence of SPP1 and ITGAX association with cognitive decline and common neuropathologies identifying a microglial subset associated with disease.
Keywords: CD11c, cognition, ITGAX, microglia, neuropathologies, OPN, osteopontin, RNASeq, SPP1, snRNASeq
1. BACKGROUND
An estimated 55 million people worldwide have dementia, and the social and economic impact is substantial. In 2019, the estimated global cost of dementia was US$1.3 trillion, and these costs are expected to surpass US$2.8 trillion by 2030 (WHO*). Dementia can be attributable to several neuropathologies that are common in the aging brain, among which Alzheimer's disease (AD) is regarded as the most common contributor to this condition. 1 , 2 AD causes brain atrophy and cell death, and it is characterized by the accumulation of β‐amyloid (Aβ) plaques and neurofibrillary tangles caused by hyperphosphorylated tau. 3 , 4 , 5 Genetic studies have revealed distinct cell‐type pathways that are implicated in the disease, suggesting potential cell‐specific prognostic/diagnostic markers and therapeutic targets for AD. 6 , 7 , 8 Microglia, the innate immune cells of the central nervous system (CNS), have been directly involved in different brain responses to AD pathology. 9 , 10 , 11 Specifically, the microglial production of osteopontin (OPN) in mice has been implicated in various CNS disorders including AD. 12
The secreted phosphoprotein 1 (SPP1) gene encodes the OPN protein and has been implicated in several AD‐related pathways. The CD11c protein encoded by the integrin subunit alpha X (ITGAX) gene is a dendritic cell marker, also expressed in microglial cells in the CNS, which are involved in phagocytosis mediation, as detected by multiple single cell (scRNASeq) studies. 13 , 14 We have previously described a subset of OPN‐producing CD11c+ microglia that regulates the engulfment of synaptic proteins, and the proliferation and development of a proinflammatory phenotype in a mouse model of AD, 15 and more recently reported that this CD11c+OPN+ microglial subset drives pathology in a mouse model of AD. 16 The extent to which human cortical SPP1 and ITGAX are associated with the clinical and neuropathological manifestations of AD and related disorders (ADRD) is unknown. Here, we extend these findings leveraging multi‐omics data of the human brain. We investigated the SPP1 and ITGAX gene expressions and their encoded proteins (OPN and CD11c) in cortical brain tissue of community‐dwelling older adults and their role in ADRD. First, we examined the association of these genes and proteins measured in bulk brain tissue with cognitive decline and common neuropathologies. Next, we explored the cell‐type specific expression profiles of targeted genes by leveraging single‐nuclei RNASeq (snRNASeq). Finally, we investigated specific microglial subpopulations that potentially drive the results. Figure 1 shows an overview of the work.
FIGURE 1.
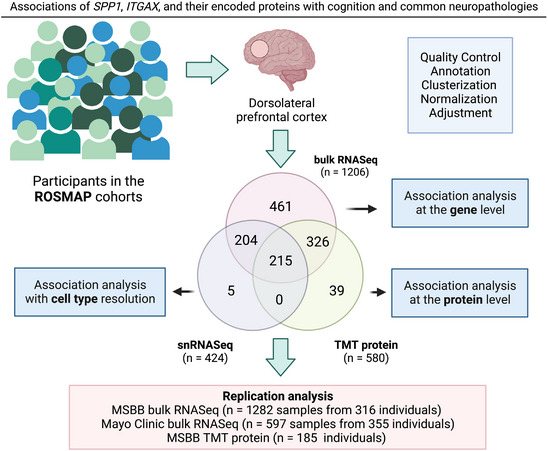
Schematic of the study. We analyzed three distinct layers of omics data from the dorsolateral prefrontal cortex brain region: bulk RNASeq (N = 1206), TMT protein measurements (N = 580), and snRNASeq (N = 424), plus a replication analysis with external datasets. Figure created with Biorender. ITGAX, integrin subunit alpha X; MSBB, Mount Sinai Brain Bank; ROSMAP, Religious Orders Study and Rush Memory and Aging Project; SPP1, secreted phosphoprotein 1; TMT, tandem mass tag
2. METHODS
2.1. Participants
Participants came from two prospective studies of aging, the Religious Orders Study (ROS) and the Rush Memory and Aging Project (MAP), commonly referred to as ROSMAP. The enrollment began in 1994 for ROS and in 1997 for MAP. 17 Both are cohort studies of risk factors for cognitive decline, AD, and other aging‐related outcomes. The ROS enrolls older Catholic priests, nuns, and monks across the USA. The MAP enrolls older laypersons from the greater metropolitan area of Chicago, Illinois. The participants agreed to annual detailed clinical and cognitive evaluations and organ donation at the time of death. The participants enrolled without known dementia and provided written informed consent, and signed the Anatomical Gift Act. Each study was approved by a Rush University Medical Center Institutional Review Board.
At the time of these analyses, bulk RNASeq data were available from 1206 participants who had completed clinical, neuropathological, and cognitive evaluations. Tandem mass tag (TMT) proteomics and snRNASeq data were available from 580 and 424 participants, respectively.
2.2. Clinical evaluations
Uniform structured clinical evaluations are administered each year by examiners blinded to data from prior years. The cognitive battery examination contains 21 tests, 19 of which were used to construct a global composite measure of cognitive function and separated summary measures of five cognitive domains (episodic, working, and semantic memory; perceptual speed; and visuospatial ability). Raw scores for individual tests were standardized using the baseline means and standard deviations of the entire cohorts, and then averaged across the tests to obtain the composite score. 18 , 19
2.3. Neuropathologic evaluations
At autopsy, the brain was removed, weighed, and cut coronally into 1 cm slabs. One hemisphere was frozen in a −80°C freezer for biochemical studies, and the other was fixed in 4% paraformaldehyde for neuropathologic evaluations. 20 , 21 The average post‐mortem interval was 8.4 h (SD = 6.0). The evaluations were conducted by examiners blinded to all clinical data, allowing for an unbiased examination. The post‐mortem evaluations assessed neuropathologies of AD, non‐AD degeneration (ie, Lewy bodies [LB], hippocampal sclerosis [HS], and limbic‐predominant age‐related TDP‐43 encephalopathy [LATE]), and cerebrovascular conditions (ie, macroscopic infarcts, microinfarcts, cerebral amyloid angiopathy [CAA], atherosclerosis, and arteriolosclerosis) with a standard protocol. 22
For the pathologic diagnosis of AD, Bielschowsky silver stain was used to visualize neuritic plaques, diffuse plaques, and neurofibrillary tangles in five areas of the brain: frontal, temporal, parietal, entorhinal, and hippocampal cortices. 21 A pathologic diagnosis of AD was based on the National Institute on Aging‐Reagan Institute criteria. Overall burden of AD was created from 15 counts of modified Bielschowsky stained tissue. 23 Unbiased methods were employed to quantify the accumulation of Aβ plaques and paired helical filaments (PHF)‐tau tangles, enabling access to specific indices of AD pathology. Immunohistochemistry was conducted using three monoclonal antibodies targeting Aβ, namely 4G8 (1:9000; Covance Labs, Madison, WI, USA), 6F/3D (1:50; Dako North America, Inc, Carpinteria, CA, USA), and 10D5 (1:600; Elan Pharmaceuticals, San Francisco, CA, USA). Images were captured at each grid, and the Image J software was employed to calculate the percentage of Aβ detection. For the assessment of PHF‐tau tangle pathology, the antibody AT8 was used. Skilled specialists outlined the tissues, and images were captured, utilizing the Stereo Investigator software version 9 (MicroBrightfield, Colchester, VT, USA) and an Olympus (Tokyo, Japan) BX‐51 microscope with an attached motorized stage. A grid was randomly placed over the outlined area, and approximately 25% to 50% of the brain region was sampled. Following camera and illumination calibration, images at each sampling site were obtained with a motorized stage. Quantification of Aβ load was accomplished by image processing in an automated, multistage computational image analysis protocol; this was based on about 90 images from the cortex (relatively larger brain regions) and about 20 from smaller brain regions (eg, hippocampus). Mean fraction (percentage area positive for Aβ) per brain region and per subject was computed. Details about the Aβ estimates and tangle density were previously described. 24 , 25
RESEARCH IN CONTEXT
Systematic review: Microglia has been implicated in different brain responses to AD pathology. Specifically, we have described a subset of OPN‐producing CD11c+ microglia cells involved in a proinflammatory phenotype and also driving pathology in a mouse model of Alzheimer's disease (AD). Still, the extent of these findings translating into the clinical and neuropathological manifestations of AD and related disorders (ADRD) in the human brain are unknown.
Interpretation: Here, we investigated SPP1, ITGAX, and their encoded proteins (OPN, CD11c) in the cortical brain tissue of community‐dwelling older adults and their role in ADRD. Multiple analysis shows their associations with cognitive decline and common neuropathologies. Also, there is evidence of an OPN+ CD11c+ microglial subset associated with AD and cerebral amyloid angiopathy.
Future directions: Future work with additional single‐cell analysis focused on brain vasculature, genetics, spatial transcriptomics, and in vitro experiments is necessary for causal inferences.
Brain sections (6 μm) were stained with α‐synuclein for assessment of LB. Depending on the morphology and region, distinct types of LB were identified and classified according to a modified McKeith criteria. 26 Nigral LB were identified as round, intracytoplasmic structures with a darker halo, being present only in the substantia nigra without evidence of LB in other regions. The limbic‐type disease included cases with positive staining for anterior cingulate or entorhinal (typically with nigral pathology) but negative in the neocortical. Neocortical‐type LB pathology classification was assigned when the staining was positive in either midfrontal, temporal, or inferior parietal cortex. Then, each case could be categorized as 0 = no LB, 1 = nigral predominant, 2 = limbic‐type or 3 = neocortical‐type pathology. 27 The presence of neocortical LB was used in the analyses.
HS was evaluated unilaterally in a coronal section of the midhippocampus using hematoxylin and eosin (H&E) stain. A grade of absent or present was based on severe neuronal loss and astrogliosis in CA1 and/or subiculum regions. 28 LATE neuropathology changes were accessed by immunohistochemistry using a monoclonal antibody to phosphorylated TDP‐43. TDP‐43 staining was performed on six brain regions: amygdala, hippocampus, dentate gyrus, entorhinal cortex, and midfrontal and middle temporal cortices. Semiquantitative measures of pathogenic TDP‐43 were analyzed for neurons and glia in a 0.25 mm2 area of most density. Then, four stages were created based on the pathologic distribution of TDP‐43: 0 = no TDP‐43 lesions created, 1 = TDP‐43 localized to the amygdala, 2 = extension of TDP‐43 to the hippocampus or entorhinal cortex, 3 = extension into the neocortex. 29
CAA pathology was assessed in four regions: midfrontal, midtemporal, angular, and calcarine cortices. For each region, meningeal and parenchymal vessels were assessed for amyloid deposition and scored from 0 to 4 based on the Aβ spread. 30 A four‐level semi‐quantitative measure (none, mild, moderate, severe) was used for analysis. Macroscopic infarctions were identified during gross examination. Number, volume, and region distribution were recorded and summarized as a binary variable (ie, presence vs absence). Microinfarcts were detected using H&E stained sections from at least nine brain regions. 31 Cerebral vessel disease has been documented in large vessels (atherosclerosis) and small vessels (arteriolosclerosis). During gross examination, lipid plasma proteins, and plaque deposition formed by calcium, were assessed through visual inspection. Severity of atherosclerosis was graded from 0 (no atherosclerosis) to 6 (severe atherosclerosis, with all visualized arteries affected or one artery completely occluded). Arteriolosclerosis was detected histologically by H&E staining sections of the anterior basal ganglia (caudate, putamen, globus pallidus, and internal capsule). The severity of arteriolosclerosis was graded from 0 (no arteriolosclerosis) to 7 (complete small vessel occlusion). 32 A four‐level semi‐quantitative measure (none, mild, moderate, severe) was used for the statistical analysis.
2.4. Protein expression
Frozen DLPFC tissue was used for TMT proteomics analysis. First, the samples were homogenized, and the protein concentration measured. Isobaric TMT peptide labels were added, and high pH fractionation was performed. The fractions were analyzed by liquid chromatography‐mass spectrometry, and the spectra generated by the mass spectrometry experiment were matched with the UniProt database. Technical confounders were removed from the data, and a total of 8425 proteins in 580 persons passed the final quality control. The method was previously published in detail. 33 , 34 , 35 The protein abundance of OPN and CD11c were pulled for downstream analyses.
2.5. Bulk RNASeq expression
RNA was extracted using the Chemagic RNA tissue kit (Perkin Elmer, CMG‐1212). RNA was concentrated (Zymo, R1080) and RNA quality number (RQN) calculated using Fragment Analyzer (Agilent, DNF‐471). RNA concentration was determined using Qubit broad range RNA assay (Invitrogen, Q10211) according to the manufacturer's instructions. Totally, 500 ng total RNA was used for RNASeq library generation and rRNA was depleted with RiboGold (Illumina, 20020599). A Zephyr G3 NGS workstation (Perkin Elmer) was utilized to generate TruSeq stranded sequencing libraries (Illumina, 20020599) with custom unique dual indexes according to the manufacturer's instructions. Libraries were normalized for molarity and sequenced on a NovaSeq 6000 (Illumina) at 40 to 50 million reads, 2 × 150 bp paired‐end. The RNASeq data processing involves three parallel pipelines, an RNASeq quality control (QC) pipeline, a gene/transcripts quantification pipeline, and a 3ʹ‐UTR quantification pipeline. First, the paired‐end sequences were aligned by STAR v2.6 to a human reference genome and annotated with GENCODE (Release 27 GRCh38). To check for quality of RNASeq data, the metrics from Picard tools were analyzed. For quantification, the transcript raw counts were calculated by Kallisto (v0.46) and the transcript counts were aggregated at the gene level. Samples with less than 5 million reads mapped to the reference were excluded. A total of 17,294 genes were expressed in > 50% of the samples with at least 10 counts in each. For normalization, conditional quantile normalization (CQN) was applied to adjust for guanin‐cytosine content and gene length. The gene counts matrix was converted to log2 counts per million (CPM), followed by quantile normalization using the voom lima function. 36 Finally, the data were adjusted to remove technical confounders and the linear regression model included variables of post‐mortem interval, sequencing batch, RQN, total spliced reads reported by STAR aligner, and quality metrics reported by Picard and Kallisto. 37
2.6. snRNASeq dataset
Previous publications have extensively described the snRNASeq dataset used in this work. 38 , 39 Briefly, nuclei were isolated from 479 DLPFC tissues of ROSMAP. Tissues were processed as 60 batches, and each batch consisted of eight donors. In each batch, nuclei suspension of eight donors were mixed together, and a single‐nucleus RNASeq library was prepared using the 10x Genomics 3 Gene Expression kit (v3 chemistry). The libraries were sequenced, and read mapping and number of unique molecular identifier (UMI) counting were performed using Cell Ranger v6.0.0 with GENCODE v32 and GRCh38.p13. Original donors of droplets in each batch were inferred by comparing single nucleotide polymorphisms in RNA reads with ROSMAP whole genome sequencing (WGS) VCF files using genetic demultiplexing software demuxlet. Over 1.64 million high‐quality nuclei profiles from 465 participants were retained to annotate major and subpopulations of cells. The nuclei were classified into eight major cell types. Each was analyzed separately, generating 96 subpopulations or cell clusters. Here, we selected the cell types with at least 1% of cells, encompassing six major cell types: astrocytes (ast), excitatory neurons (ext), inhibitory neurons (inh), microglia (mic), oligodendrocytes (oli), and oligodendrocyte precursor cell (OPCs). Doublets were removed using DoubletFinder, and cells were clustered using Seurat. 40 As a QC, genotype concordance of RNA and WGS, sex check, duplicated donors, WGS QC, and sequencing depth were assessed, and 424 donors passed the QC.
The number of UMI counts (nUMI) and unique genes (nGene) were checked during the QC. Since each cell type has different RNA quantities, specific thresholds were optimized based on these parameters. For the removal of low‐quality cells, the median of all nUMI and nGene parameters was calculated, and a score generated using the harmonic mean of the precision and recall. Finally, the thresholds by cell type of nUMI and nGene, respectively, included for downstream analysis were as follows: for ast, 800 and 616; for ext, 2232 and 1916; for inh, 800 and 100; for mic, 400 and 253; for oli, 400 and 253; for OPCs 695 and 253.
The sub‐clustering analysis was performed by cell type. The Seurat FindAllMarkers function was used for differential gene expression per cluster, followed by gene set enrichment analysis and comparison with previously published papers. Each subpopulation was characterized by the expression profile of marker genes (eg, P2RY12 marker of homeostatic microglia, APOE damage‐associated microglia [DAM] stage 1 and ITGAX DAM stage 2) followed by pathway analysis. 38 For downstream analysis, pseudo‐bulk matrices were created by summing counts per donor. The genes were filtered by each cell type, keeping genes with CPM > 1 in 80% of samples. Different methods were tested: CPM, transcripts per million (TPM), CQN, trimmed mean of M values voom, and quantile‐voom. Finally, TPM was applied for the final matrices and we pulled out the expression of the targeted genes, SPP1 and ITGAX.
2.7. Statistical analysis
We examined the associations of gene, and separately protein, expression with cognitive decline in a series of linear mixed effects models with random intercept and random slope. In these models, annual global cognitive scores were the continuous longitudinal outcome. The models included a term for time in year before death that estimates the mean annual rate (slope) of change in global cognition, a term for gene or protein that estimates the expression association with the level of cognition proximate to death, and a term for gene or protein interaction with time that estimates the expression association with the slope of change in cognition. A positive and significant coefficient for the interaction term would indicate that higher gene or protein level was associated with slower cognitive decline.
Separately, we examined the gene or protein associations with common neuropathologic indices in a series of logistic regression models. The presence or the severity of individual neuropathology was the binary or ordinal outcome, and the gene or protein expression was the predictor. The coefficient estimates the odds of having the corresponding neuropathology, or more severe burden of the neuropathology, with every unit higher in the gene or protein level. All the models were adjusted for age, sex, and education.
2.8. Replication with external datasets
For replication, we downloaded external RNASeq data from the Mount Sinai Brain Bank (MSBB) and Mayo Clinic. The MSBB dataset comprised 1282 samples from 316 unique individuals, while the Mayo Clinic dataset included 597 samples from 355 unique individuals. These datasets were accessed through Synapse using the codes syn27068756 and syn27024965. Additionally, we accessed a TMT protein dataset from the MSBB (syn21347564) which contained data for 185 individuals. We selected the expression of the targeted genes/proteins and tested the associations with the covariates available, CERAD score, Braak stage, that refers to the AD progression of neurofibrillary pathology, Clinical Dementia Rating scale (CDR), and density of neuritic plaques for MSBB, 41 and diagnosis, Braak and Thal for Mayo Clinic. 42 For the data with repeated measures, with multiple brain regions from the same individuals, we ran a linear mixed model with the individualID as a random effect. For the TMT data, we ran a linear regression model. The models were adjusted by age at death, sex, and ethnicity, whenever this information was available.
3. RESULTS
3.1. Characteristics of study participants
Bulk RNASeq data were available in 1206 ROSMAP participants. These participants enrolled at a mean age of 80.8 (SD: 6.9) years, and died at an average age of 89.6 (SD: 6.6). A majority were female (∼70%). During an average of 8 years of annual follow‐up visits, there was an overall decline in cognition (estimate of slope was −0.100, SE = 0.003, p < 0.001). At death, 35% had no cognitive impairment, 25% had mild cognitive impairment (MCI), and the remaining 40% had dementia. At autopsy, 61% had a pathologic AD diagnosis. Neocortical LB and HS were present in 13% and 9% of the brains respectively. TDP‐43 pathology extending beyond the amygdala (LATE) was detected in 30% of the brains. Over 32% of individuals showed macroscopic infarcts, and at least 25% showed microinfarcts. Other cerebrovascular diseases were also common. CAA, atherosclerosis, and arteriolosclerosis were detected in 30% of the brains. The characteristics were similar for individuals with TMT or snRNASeq data (Table 1).
TABLE 1.
Description of study participants
| Characteristics | Bulk (N=1206) | TMT (N=580) | snRNASeq (N=424) |
|---|---|---|---|
| Age at baseline, mean (SD), years | 80.8 (6.9) | 81.3 (6.8) | 81.3 (7.1) |
| Age at death, mean (SD), years | 89.6 (6.6) | 89.6 (6.4) | 89.2 (6.8) |
| Male sex, No. (%) | 386 (32.0) | 181 (31.2) | 136 (32.1) |
| Educational level, mean (SD), years | 16.2 (3.5) | 15.4 (3.4) | 16.3 (3.5) |
| Length of follow‐up, mean (SD), years | 8.7 (5.1) | 8.3 (4.6) | 7.9 (4.5) |
| MMSE score, median (IQR)—at baseline | 28 (26.9 to 29) | 29 (27 to 29) | 28 (27 to 29) |
| MMSE score, median (IQR)—proximate to death | 25 (16 to 28) | 26 (19.8 to 28) | 25 (16 to 28) |
| Global cognition score, mean (SD)—at baseline | −0.13 (0.65) | −0.01 (0.5) | −0.1 (0.6) |
| Global cognition score, mean (SD)—proximate to death | −0.96 (1.16) | −0.79 (1.07) | −0.9 (1.1) |
| MCI, No. (%) | 285 (23.6) | 169 (29.1) | 110 (25.9) |
| Dementia, No. (%) | 526 (43.6) | 204 (35.2) | 171 (40.3) |
| NIA‐Reagan AD, No. (%) a | 769 (63.8) | 356 (61.4) | 266 (62.7) |
| Aβ load, median (IQR) | 3.11 (0.58 to 6.73) | 3.69 (0.58 to 7.83) | 3.01 (0.51 to 7.41) |
| PHF‐tau tangle density, median (IQR) | 4.20 (1.62 to 8.76) | 3.78 (1.63 to 7.62) | 3.82 (1.49 to 7.80) |
| Global AD pathologic score, median (IQR) | 0.63 (0.18 to 1.13) | 0.53 (0.16 to 1.08) | 0.6 (0.2 to 1.1) |
| Post‐mortem interval, mean (SD) | 8.4 h (6.0) | 8.1 h (5.3) | 7.7 h (5.1) |
| Neuritic plaques score, median (IQR) | 0.70 (0.04 to 1.34) | 0.64 (0.03 to 1.23) | 0.6 (0.0 to 1.3) |
| Diffuse plaques score, median (IQR) | 0.52 (0.06 to 1.12) | 0.5 (0.05 to 1.06) | 0.5 (0.0 to 1.3) |
| Neurofibrillary tangles score, median (IQR) | 4.2 (1.61 to 8.75) | 3.78 (1.63 to 7.62) | 3.8 (1.5 to 7.8) |
| Macroscopic infarcts, No. (%) | 425 (35.2) | 188 (32.4) | 158 (37.2) |
| Microinfarcts, No. (%) | 347 (28.8) | 159 (27.4) | 109 (25.7) |
| Neocortical Lewy bodies, No. (%) | 159 (13.2) | 69 (11.9) | 33 (7.8) |
| TDP‐43, No. (%) b | 365 (31.8) | 168 (29.21) | 124 (30.9) |
| Hippocampal sclerosis, No. (%) | 109 (9.1) | 45 (7.8) | 38 (9.03) |
| Amyloid angiopathy, No. (%) c | 412 (34.8) | 177 (30.6) | 141 (33.8) |
| Atherosclerosis, No. (%) c | 399 (33.2) | 184 (31.7) | 173 (40.9) |
| Arteriolosclerosis, No. (%) c | 406 (33.9) | 188 (32.6) | 161 (38.2) |
Abbreviations: AD, Alzheimer disease; IQR, interquartile range; MCI, mild cognitive impairment; MMSE, mini‐mental state examination; NIA, national institute on aging; PHF, paired helical filaments; TDP‐43, transactive response DNA‐binding protein 43; TMT, tandem mass tag.
Intermediate or high likelihood.
Inclusion beyond the amygdala.
Moderate or severe.
3.2. Associations of SPP1 and ITGAX with cognitive decline and neuropathologies
First, we investigated the associations of SPP1 and ITGAX at mRNA and protein levels with cognitive decline. Higher SPP1 gene and, separately, higher OPN protein expression were associated with faster decline in cognition (estimate: −0.017, SE: 0.003, p < 0.001, and estimate: −0.013, SE: 0.004, p = 0.003, respectively). The results indicate that individuals with high expression (90th percentile) of the targeted gene, and of the respective protein, would have an 18% faster decline in cognition compared to those with average expression (Figure 2A‐B). We also evaluated the associations of the SPP1 gene and OPN with clinical diagnosis at death in a series of ordinal logistic regression models. Consistent with the results for cognitive decline, higher level of SPP1 expression was associated with greater odds of having more severe diagnosis (odds ratio [OR] = 1.363, 95% confidence interval [CI]: 1.207 to 1.539). A similar result was also observed for the OPN protein (OR = 1.301, 95% CI: 1.110 to 1.525), Table S01.
FIGURE 2.
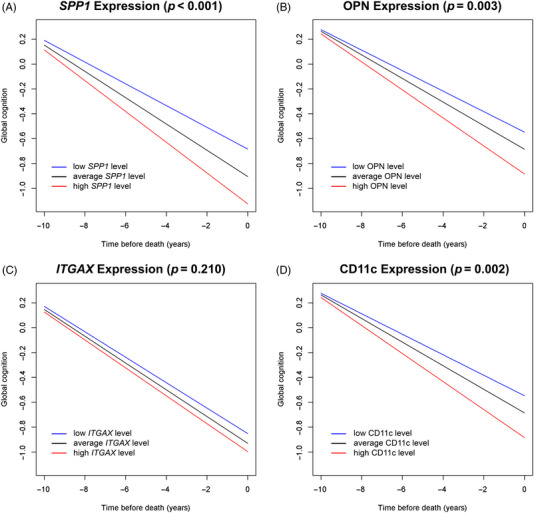
The associations of secreted phosphoprotein 1 (SPP1) and integrin subunit alpha X (ITGAX) genes and their encoded proteins with cognitive decline. (A,B) Associations of SPP1 and osteopontin (OPN) with cognitive decline. (C,D) Associations of ITGAX and CD11c with cognitive decline. Red: high gene/protein expression; black: average gene/protein expression; blue: low gene/protein expression.
We did not observe an association of ITGAX gene expression with cognitive decline (p = 0.210) (Figure 2C). However, elevated levels of the CD11c protein encoded by ITGAX were associated with a faster decline in cognition (estimate: −0.013, SE: 0.004, p = 0.002). Compared to individuals with average CD11c expression, those with high expression (90th percentile) had 17% faster decline in cognitive function (Figure 2D). Comparing each gene with its encoded protein, we observed a high correlation for SPP1 and OPN (r = 0.487, p < 0.0001) and a low correlation for ITGAX and CD11c (r = 0.166, p < 0.0003). Figure S1 illustrates the results.
Next, we checked the associations of the targeted genes and neuropathologic evaluations of AD, non‐AD degeneration (ie, LB, HS, and LATE), and cerebrovascular conditions (ie, macroscopic infarcts, microinfarcts, CAA, atherosclerosis, and arteriolosclerosis) (Figure 3). Higher SPP1 gene expression was associated with greater odds of AD (OR = 1.233, 95% CI: 1.076 to 1.413), HS (OR = 1.437, 95% CI: 1.168 to 1.768), LATE (OR = 1.196, 95% CI: 1.059 to 1.35), and CAA (OR = 1.151, 95% CI: 1.025 to 1.292) (Figure 3A). The result for the OPN protein was similar, such that higher protein level was associated with greater odds of AD, LATE, and CAA (Figure 3B). Similarly, both ITGAX gene and protein expressions were associated with AD (OR = 1.429, 95% CI: 1.203 to 1.697 for gene and OR = 1.74, 95% CI: 1.415 to 2.14 for protein), LATE (OR = 1.204, 95% CI: 1.025 to 1.414 for gene and OR = 1.195, 95% CI: 1.01 to 1.414 for protein), and CAA (OR = 1.322, 95% CI: 1.138 to 1.535 for gene and OR = 1.438, 95% CI: 1.218 to 1.698 for protein) (Figure 3C,D). Notably, the associations with neuropathologies were almost restricted to degeneration, as opposed to vascular indices.
FIGURE 3.
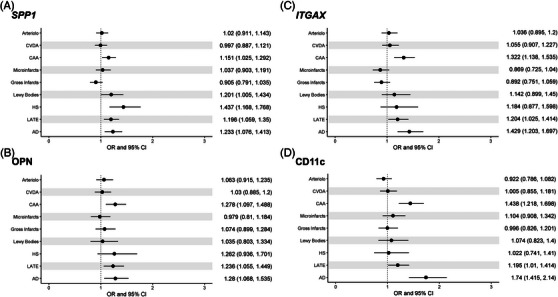
Associations of secreted phosphoprotein 1 (SPP1) and integrin subunit alpha X (ITGAX) expression with neuropathologies. (A,B) SPP1 gene and its protein, osteopontin (OPN). (C‐D) ITGAX gene and its protein, CD11c. For each neuropathologic index tested, the horizontal line represents the odds ratio (OR) and 95% confidence interval (CI). Dashed vertical line highlights the cutoff for significant association. AD, Alzheimer's disease; Arterio, arteriolosclerosis; CAA, cerebral amyloid angiopathy; CVDA, atherosclerosis; HS, hippocampal sclerosis; LATE, limbic‐predominant age‐related TDP‐43 encephalopathy
We next conducted replication analyses using bulk RNASeq data from the MSBB (n = 1282 samples from 316 individuals) and Mayo Clinic (n = 597 samples from 355 individuals), and separately, the TMT protein from the MSBB (n = 185 individuals). Consistent with the results from ROSMAP, data from both the MSBB and Mayo Clinic showed that higher SPP1 and ITGAX levels were associated with higher burdens of AD pathologies as well as cognitive impairment. Both SPP1 and ITGAX genes were associated with Braak stage (SPP1 p = 0.001; ITGAX p < 0.001), CDR (SPP1 p < 0.001; ITGAX p < 0.001), and plaques (SPP1 p = 0.031; ITGAX p < 0.001) in the MSBB RNASeq dataset. In the Mayo RNASeq dataset, SPP1 was associated with Braak stage (p = 0.016) and Thal (p = 0.040) with a suggestive association for AD (p = 0.098). The ITGAX gene was associated with the same covariates, plus the diagnosis of progressive supranuclear palsy (p = 0.002). At the protein level, OPN and CD11c were associated with Braak stage (OPN p = 0.002; CD11c p < 0.001), CDR (OPN p = 0.031; CD11c p < 0.001), and plaques (OPN p = 0.015; CD11c p < 0.001) (Tables S2–S4).
3.3. SPP1 and ITGAX expression by cell type
Further, we examined the expression of SPP1 and ITGAX and their associations with cognitive decline and with neuropathologic indices with snRNASeq from 424 individuals and six major cell types (ast, ext, inh, mic, oli, and OPCs) plus 81 subpopulations from over 1.6 million nuclear transcriptomes. 38 , 39 We found that ITGAX is expressed only in microglia, and SPP1 is expressed in all major cell types of the DLPFC, highest in microglial and oligodendrocytes populations (Figure 4A). Our results indicate that individuals with higher SPP1 expression in excitatory neurons, inhibitory neurons, and oligodendrocytes had faster cognitive decline. Specifically, individuals exhibiting elevated SPP1 expression in excitatory neurons had a decline that was 18% faster compared to those with average expression. In inhibitory neurons, the decline was 22% faster, and in oligodendrocytes, it reached 35%. Consistent with the result for bulk gene expression, the association of ITGAX in microglia with cognitive decline was not significant (Table 2).
FIGURE 4.
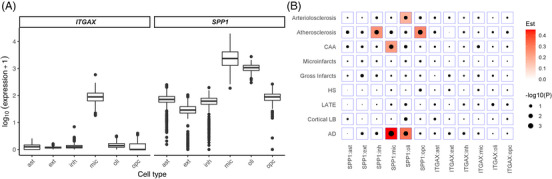
Expression level of secreted phosphoprotein 1 (SPP1) and integrin subunit alpha X (ITGAX) and neuropathologies association analysis by cell type. (A) Expression level of the ITGAX and SPP1 genes by cell type (cell types: ast = astrocytes, ext = excitatory neurons, inh = inhibitory neurons, mic = microglia, oli = oligodendrocytes, and OPCs = oligodendrocyte precursor cells). (B) The associations of gene expression and neuropathologies, by cell type. Red represents a positive association. AD, Alzheimer's disease; CAA, cerebral amyloid angiopathy; Est, estimate; HS, hippocampal sclerosis; LATE, limbic‐predominant age‐related TDP‐43 encephalopathy; LB, Lewy bodies
TABLE 2.
Associations of cell‐type specific SPP1 and ITGAX with cognitive decline
| Cell type | SPP1 | ITGAX |
|---|---|---|
| Astrocytes | −0.0066 (0.0054, 0.2261) | NA |
| Excitatory neurons | −0.0159 (0.0057, 0.0052) | NA |
| Inhibitory neurons | −0.0183 (0.0056, 0.0011) | NA |
| Microglia | −0.0093 (0.0056,0.0971) | 0.0101 (0.0055, 0.0641) |
| Oligodendrocytes | −0.0277 (0.0054,0.0000) | NA |
| Oligodendrocyte precursor cells | −0.0105 (0.0056, 0.0611) | NA |
Note: In each cell, the three numbers are point estimate (slope of change with one unit increase in expression), standard error, and p‐value. NA = Not available, meaning the gene is not expressed in that particular cell type. ITGAX, integrin subunit alpha X; SPP1, secreted phosphoprotein 1.
We found that the associations between gene expression and neuropathologies are cell type dependent. Figure 4B shows that SPP1 in oligodendrocytes and microglial cells were associated with pathological AD diagnosis (OR = 1.367, 95% CI = 1.103 to 1.694 and OR = 1.57, 95% CI = 1.214 to 2.031, respectively). Separately, we observed that SPP1 in microglia was also associated with CAA, SPP1 in inhibitory neurons and OPCs were associated with atherosclerosis, and SPP1 in oligodendrocytes was associated with arteriolosclerosis. ITGAX in microglia was not associated with neuropathologies (Figure 4B).
An in situ analysis of CD11c+OPN+ microglia at the protein level using brain tissues from a small cohort of AD patients and controls from the MSBB revealed that the percentage of CD11c+OPN+ microglia strongly correlates with cognitive impairment and neuropathology (neuritic plaques and tau tangles) of AD patients. 16 To extend these findings of a clinical correlation between OPN/CD11c and AD pathology, we investigated cell subpopulations, especially ITGAX+ SPP1+ microglial sub‐clusters, using a much larger ROSMAP cohort to provide a more comprehensive understanding. We found that ITGAX is expressed in seven of 16 microglia subpopulations (mic.2, mic.3, mic.4, mic.5, mic.7, mic.12, mic.13) (Figure S2A). SPP1 is also expressed in the same cells plus another eight microglia subtypes, being expressed in all but the mic.14 cluster (Figure S2B). This gene is also expressed in all 13 oligodendrocytes subpopulations annotated (Figure S2C).
Because OPN‐producing CD11c+ microglia is involved in phagocytosis mediation 15 and this subset is implicated in various CNS disorders, 12 we focused on this cell population for downstream analysis (Figure S3). The SPP1 microglial subpopulations of mic.3, mic.12, and mic.13 were associated with pathologic AD (OR = 1.308, 95% CI = 1.093 to 1.566, OR = 1.615, 95% CI = 1.393 to 1.873, and OR = 1.437, 95% CI = 1.242 to 1.661, respectively). The subpopulations mic.12 and mic.13 were also positively associated with CAA (OR = 1.209, 95% CI = 1.082 to 1.352 and OR = 1.204, 95% CI = 1.076 to 1.346, respectively) (Figure 5A). These subpopulations or cell states were previously annotated as homeostatic/tau‐associated (mic.3) and lipid‐associated/disease‐elevated (mic.12 and mic.13) 38 (Table S05). Results for ITGAX were inconclusive (Figure 5B).
FIGURE 5.
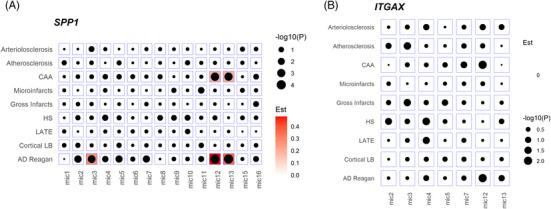
Neuropathologies association analysis for the microglia sub‐clusters. (A) Association of secreted phosphoprotein 1 (SPP1) gene expression and neuropathologic indexes for the microglial subpopulations. (B) Association of integrin subunit alpha X (ITGAX) gene expression and neuropathologic indexes for the microglial subpopulations. Red represents a positive association (ie, higher expression is associated with more or higher odds of the pathology). AD, Alzheimer's disease; CAA, cerebral amyloid angiopathy; Est, estimate; HS, hippocampal sclerosis; LATE, limbic‐predominant age‐related TDP‐43 encephalopathy; LB, Lewy bodies; mic, microglia
4. DISCUSSION
We systematically investigated the SPP1 and ITGAX gene expressions and their encoded proteins in cortical brain tissue of community‐dwelling older adults and their role in ADRD. We showed that SPP1 and OPN in bulk brain tissue are associated with faster cognitive decline, while CD11c, but not ITGAX, is associated with faster decline in cognition, consistent with the preclinical murine model. 15
The neuropathologic analyses showed that the signals are almost restricted to neurodegenerative as opposed to vascular pathologies. Further, by leveraging a snRNASeq dataset, we found that ITGAX is expressed only in microglia, while SPP1 is expressed in all major cell types of the DLPFC region with higher levels in microglia and oligodendrocytes. These two cell types are also the main drivers of the association with AD, with a stronger association found in three microglial cell subpopulations.
In a dataset of over 1200 samples for bulk RNASeq and 580 samples for proteins, we examined the associations of SPP1, ITGAX, and their encoded proteins with cognitive decline and common neuropathological indices. We found that higher cortical SPP1 levels were associated with a faster cognitive decline over time. Our results are consistent with those of prior studies that reported plasma OPN being upregulated in vascular diseases as well as in AD. 43 In cerebrospinal fluid, SPP1 and OPN were correlated with cognitive decline in early AD and HIV‐infected individuals. 44 , 45 , 46 , 47
While previous studies focused only on AD, 16 here we define the association of SPP1 and ITGAX with broader neuropathologies, including AD, LATE, LB, HS, and CAA. We observed that SPP1 was associated with higher odds of AD, LATE, HS, and CAA, with similar results at the protein level. SPP1 has been extensively described as associated with activated microglia and neuroinflammatory disorders. In AD, SPP1 is involved in maintaining the DAM and human Alzheimer's microglia (HAM) signature lists, also known for modulating microglial synaptic engulfment and phagocytosis. 12 , 48 , 49 Additionally, SPP1 presents altered intercellular communications in AD leptomeninges. 50 In multiple sclerosis, subpopulations of microglia secreting OPN serve as binding partners for several integrin receptors contributing to the infiltration of peripheral immune cells in inflamed CNS. 51 , 52 , 53 Additionally, HS is graded based on neuronal loss and astrogliosis in hippocampal CA1 and subiculum, 28 which is out of proportion to AD and strongly associated with LATE. 54 , 55
Even though microglia are associated with these pathologies, little is known about the association of SPP1 or ITGAX expression with HS, LATE, and other TDP‐43 related pathologies. Except for CAA, no consistent signals were found for either SPP1 or ITGAX for cerebrovascular indices. Recently, SPP1 was described as upregulated in a specific subgroup of stroke‐associated myeloid cells in the parenchyma. 56 Previous studies found an association between elevated SPP1 expression and the risk of developing CAA. Van der Weerd and colleagues hypothesize that the calcification of CAA vessels observed in hereditary cerebral hemorrhage with amyloidosis‐Dutch type may be induced by extracellular OPN. 57 , 58 Also, immunohistochemistry analysis showed that OPN was present in different patterns of calcium deposition. 59 Adding to that, humans express multiple OPN isoforms with potentially distinct biological functions, 60 and further investigation is required to check for specific isoforms associated with neuropathologic indices.
Both SPP1 and ITGAX genes are upregulated in DAM cells, 12 a signature list generated from mice AD models. However, ITGAX was not significantly associated in the signature list generated from human dataset (HAM). 48 In our analysis, we also did not see an association of ITGAX gene expression with human cognitive decline, but we do see an association at protein level.
ITGAX/CD11c is extensively described as a cell marker gene/protein, widely used as a marker for dendritic cells. 61 , 62 , 63 , 64 The first report to explicitly identify CD11c+ cells in the CNS as microglia was published in 2006. The authors identified populations of CD11c+ cells in a mouse model for AD as microglia based on their location and co‐expression of isolectin B4 and CD11b. 65 Since then, other groups have reported ITGAX as highly expressed in microglia and being upregulated in disease‐associated cells, 66 and as having a shared effect between monocytes (blood myeloid cells) and microglia (brain myeloid cells). 67 Both genes were also described in mice models of AD 12 and upregulated in a recent study of amyotrophic lateral sclerosis human patients. 68 Our results showed that ITGAX is associated with higher odds of CAA, LATE, and AD at the gene and protein levels. Previously, ITGAX was found to be upregulated in a mouse model study of CAA, along with other genes enriched in endothelial development of blood‐brain barrier leakage. 69
More than a sole cell marker, CD11c+ cells expressing SPP1 define a mouse microglial subpopulation that regulates neuronal development and proinflammatory responses. 15 , 16 Thus, we leveraged a snRNASeq dataset of 424 DLPFC human brains searching for associations at single‐cell resolution. In our data and in the Human Protein Atlas, SPP1 is expressed in both glial and neuronal cells, with higher expression in oligodendrocytes and microglia while ITGAX is expressed only in microglia. 70 By performing analysis with the cell‐specific expression data, we observed a significant association of SPP1 with cognitive decline in excitatory and inhibitory neurons, and in oligodendrocytes. This is in line with the crescent body of evidence that SPP1 plays distinct roles in a cell‐specific context. It may act as a regulator of myelination in oligodendrocytes, 71 and possibly modulates microglia‐mediated synaptic engulfment with a functional role in perivascular cell crosstalk. 49
OPN is already known to play a role in dementia and other diseases, 44 , 72 , 73 , 74 but to our knowledge, this is the first study to demonstrate its association with a decline in cognition over the years in the human brain in specific cell types. It is important to note that neurons are the most abundant cell in the brain, accounting for 55% of cells (ext) in our dataset, while oligodendrocytes and microglia account for 20% and 5%, respectively. Separately, ITGAX/CD11c in microglia cells were not significantly associated with cognition, in line with the bulk RNASeq results.
The neuropathologic associations revealed that SPP1 in glial cells was associated with greater odds of arteriolosclerosis, CAA, and AD. The expression of SPP1 in OPCs and inhibitory neurons was associated with atherosclerosis. At the bulk RNA level, we did not see these associations with cerebrovascular conditions, and in the snRNASeq, we did not see associations for LATE and HS. These different results can be attributed to distinct aspects of the analyzed datasets. First, the sample size is different, and the bulk RNASeq is almost three times the size of the single‐nuclei. Also, it is important to highlight that for the snRNASeq experiment, only the RNA from the nucleus was isolated, so we do not have expression from the cytoplasm RNAs. 75 In contrast, the bulk experiment captures the RNAs from the complete cell. Adding to that, disparities are expected when comparing distinct omics modalities. 37 Specifically, microglial subpopulations were associated with CAA (mic.12 and mic.13) and pathologic AD (mic.3, mic.12, and mic.13). These subpopulations were annotated in an unsupervised way, potentially representing cell states. Differentially expressed features were used as cluster biomarkers, and these groups of cells were classified as homeostatic and tau‐associated (mic.3) or lipid‐associated (mic.12 and mic.13) states. Of note, mic.3 is also described as surveilling, expressing the CX3CR1 marker gene. The lipid‐associated mic.12 and mic.13 express both the AD risk genes APOE and GPNMB, with mic.13 also expressing high levels of SPP1 and TREM2 compared to other subpopulations. 38 An interesting pattern can be emerging here.
The study has strengths and limitations. On the one hand, the ROSMAP is a community‐based cohort study with much less referral bias, and the participants are free of known dementia at enrollment. Nevertheless, our study has limitations as well. The ROSMAP participants are typically older, non‐Latino White individuals with high education and are not representative of the general population. Thus, the results presented here provide evidence of SPP1 and ITGAX association with neuropathologies, but further analysis and in vitro experiments are needed for causal inferences.
AUTHOR CONTRIBUTIONS
David A. Bennett and Harvey Cantor: Conception and design of the study. David A. Bennett: Major role in data acquisition, funding, and supervision. Katia de Paiva Lopes and Lei Yu: Drafting of the manuscript and data analysis. Katia de Paiva Lopes: Single‐nuclei analysis. Lei Yu: Statistical analysis. Shinya Tasaki: Bulk RNASeq data normalization and adjustment. Katia de Paiva Lopes, Lei Yu, Xianli Shen, Yiguo Qiu, Shinya Tasaki, Artemis Iatrou, Michal Schnaider Beeri, Nicholas T. Seyfried, Vilas Menon, Yanling Wang, Julie A. Schneider, Harvey Cantor, and David A. Bennett: Interpretation of results and manuscript revision. All authors reviewed the manuscript.
CONFLICT OF INTEREST STATEMENT
N.T.S. is a co‐founder of a company called Emtherapro. The other authors declare no conflicts of interest.
CONSENT STATEMENT
The ROS and MAP studies were approved by an Institutional Review Board (IRB) of Rush University Medical Center, Chicago, IL. All participants agreed to annual clinical evaluation and organ donation at death. Each participant signed an informed consent form and an Anatomical Gift Act (AGA) for research purposes.
Supporting information
The bulk RNASeq, TMT proteins expression and snRNASeq datasets are deposited on Synapse (https://www.synapse.org/) IDs syn3388564, syn17015098 and syn31512863 respectively. Tables, figures and extended methods are available in the supplementary material of this paper. ROSMAP resources can be requested at https://www.radc.rush.edu
Supporting Information
ACKNOWLEDGMENTS
The authors thank all the ROSMAP participants, as well the investigators and staff at the Rush Alzheimer's Disease Center. ROSMAP is supported by the National Institute on Aging P30AG10161, P30AG72975, R01AG15819, R01AG17917, U01AG46152, U01AG61356. The Cantor lab is supported by the LeRoy Schecter Research Foundation and National Institutes of Health R01AI48124.
Lopes KP, Yu L, Shen X, et al. Associations of cortical SPP1 and ITGAX with cognition and common neuropathologies in older adults. Alzheimer's Dement. 2024;20:525–537. 10.1002/alz.13474
Footnotes
World Health Organization. https://www.who.int/news‐room/fact‐sheets/detail/dementia accessed on Oct 21st, 2022.
REFERENCES
- 1. Ballard C, Gauthier S, Corbett A, Brayne C, Aarsland D, Jones E. Alzheimer's disease. Lancet. 2011;377(9770):1019‐1031. [DOI] [PubMed] [Google Scholar]
- 2. Ferrari C, Sorbi S. The complexity of Alzheimer's disease: an evolving puzzle. Physiol Rev. 2021;101(3):1047‐1081. [DOI] [PubMed] [Google Scholar]
- 3. Montine TJ, Monsell SE, Beach TG, et al. Multisite assessment of NIA‐AA guidelines for the neuropathologic evaluation of Alzheimer's disease. Alzheimers Dement. 2016;12(2):164‐169. [DOI] [PMC free article] [PubMed] [Google Scholar]
- 4. Thal DR, Rüb U, Orantes M, Braak H. Phases of A beta‐deposition in the human brain and its relevance for the development of AD. Neurology. 2002;58(12):1791‐1800. [DOI] [PubMed] [Google Scholar]
- 5. Braak H, Alafuzoff I, Arzberger T, Kretzschmar H, Del Tredici K. Staging of Alzheimer disease‐associated neurofibrillary pathology using paraffin sections and immunocytochemistry. Acta Neuropathol. 2006;112(4):389‐404. [DOI] [PMC free article] [PubMed] [Google Scholar]
- 6. Karch CM, Goate AM. Alzheimer's disease risk genes and mechanisms of disease pathogenesis. Biol Psychiatry. 2015;77(1):43‐51. [DOI] [PMC free article] [PubMed] [Google Scholar]
- 7. Ertekin‐Taner N, De Jager PL, Yu L, Bennett DA. Alternative approaches in gene discovery and characterization in Alzheimer's disease. Current Genetic Medicine Reports. 2013;1(1):39‐51. doi: 10.1007/s40142-013-0007-5 [DOI] [PMC free article] [PubMed] [Google Scholar]
- 8. Raj T, Rothamel K, Mostafavi S, et al. Polarization of the effects of autoimmune and neurodegenerative risk alleles in leukocytes. Science. 2014;344(6183):519‐523. [DOI] [PMC free article] [PubMed] [Google Scholar]
- 9. Ransohoff RM. How neuroinflammation contributes to neurodegeneration. Science. 2016;353(6301):777‐783. [DOI] [PubMed] [Google Scholar]
- 10. Kosoy R, Fullard JF, Zeng B, et al. Genetics of the human microglia regulome refines Alzheimer's disease risk loci. Nat Genet. 2022;54(8):1145‐1154. [DOI] [PMC free article] [PubMed] [Google Scholar]
- 11. Krasemann S, Madore C, Cialic R, et al. The TREM2‐APOE pathway drives the transcriptional phenotype of dysfunctional microglia in neurodegenerative diseases. Immunity. 2017;47(3):566‐581. [DOI] [PMC free article] [PubMed] [Google Scholar]
- 12. Keren‐Shaul H, Spinrad A, Weiner A, et al. A unique microglia type associated with restricting development of Alzheimer's disease. Cell. 2017;169(7):1276‐1290.e17. [DOI] [PubMed] [Google Scholar]
- 13. Li Q, Cheng Z, Zhou L, et al. Developmental heterogeneity of microglia and brain myeloid cells revealed by deep single‐cell RNA sequencing. Neuron. 2019;101(2):207‐223.e10. [DOI] [PMC free article] [PubMed] [Google Scholar]
- 14. Hammond TR, Dufort C, Dissing‐Olesen L, et al. Single‐cell RNA sequencing of microglia throughout the mouse lifespan and in the injured brain reveals complex cell‐state changes. Immunity. 2019;50(1):253‐271.e6. [DOI] [PMC free article] [PubMed] [Google Scholar]
- 15. Shen X, Qiu Y, Wight AE, Kim HJ, Cantor H. Definition of a mouse microglial subset that regulates neuronal development and proinflammatory responses in the brain. Proc Natl Acad Sci U S A. 2022;119(8). doi: 10.1073/pnas.2116241119 [DOI] [PMC free article] [PubMed] [Google Scholar]
- 16. Qiu Y, Shen X, Ravid O, et al. Definition of the contribution of an Osteopontin‐producing CD11c+ microglial subset to Alzheimer's disease. Proc Natl Acad Sci U S A. 2023;120(6):e2218915120. [DOI] [PMC free article] [PubMed] [Google Scholar]
- 17. Bennett DA, Buchman AS, Boyle PA, Barnes LL, Wilson RS, Schneider JA. Religious orders study and rush memory and aging project. J Alzheimers Dis. 2018;64(s1):S161‐S189. [DOI] [PMC free article] [PubMed] [Google Scholar]
- 18. Boyle PA, Yu L, Wilson RS, Leurgans SE, Schneider JA, Bennett DA. Person‐specific contribution of neuropathologies to cognitive loss in old age. Ann Neurol. 2018;83(1):74‐83. [DOI] [PMC free article] [PubMed] [Google Scholar]
- 19. Wilson RS, Boyle PA, Yu L, et al. Temporal course and pathologic basis of unawareness of memory loss in dementia. Neurology. 2015;85(11):984‐991. [DOI] [PMC free article] [PubMed] [Google Scholar]
- 20. Bennett DA, Schneider JA, Buchman AS, Mendes de Leon C, Bienias JL, Wilson RS. The Rush Memory and Aging Project: study design and baseline characteristics of the study cohort. Neuroepidemiology. 2005;25(4):163‐175. [DOI] [PubMed] [Google Scholar]
- 21. Schneider JA, Arvanitakis Z, Leurgans SE, Bennett DA. The neuropathology of probable Alzheimer disease and mild cognitive impairment. Ann Neurol. 2009;66(2):200‐208. [DOI] [PMC free article] [PubMed] [Google Scholar]
- 22. Boyle PA, Wang T, Yu L, et al. To what degree is late life cognitive decline driven by age‐related neuropathologies? Brain. 2021;144(7):2166‐2175. [DOI] [PMC free article] [PubMed] [Google Scholar]
- 23. Bennett DA, Schneider JA, Tang Y, Arnold SE, Wilson RS. The effect of social networks on the relation between Alzheimer's disease pathology and level of cognitive function in old people: a longitudinal cohort study. Lancet Neurol. 2006;5(5):406‐412. [DOI] [PubMed] [Google Scholar]
- 24. Kapasi A, Leurgans SE, Arvanitakis Z, Barnes LL, Bennett DA, Schneider JA. Aβ (Amyloid Beta) and tau tangle pathology modifies the association between small vessel disease and cortical microinfarcts. Stroke. 2021;52(3):1012‐1021. [DOI] [PMC free article] [PubMed] [Google Scholar]
- 25. Wilson RS, Arnold SE, Schneider JA, Tang Y, Bennett DA. The relationship between cerebral Alzheimer's disease pathology and odour identification in old age. J Neurol Neurosurg Psychiatry. 2007;78(1):30‐35. [DOI] [PMC free article] [PubMed] [Google Scholar]
- 26. McKeith IG, Galasko D, Kosaka K, et al. Consensus guidelines for the clinical and pathologic diagnosis of dementia with Lewy bodies (DLB): report of the consortium on DLB international workshop. Neurology. 1996;47(5):1113‐1124. [DOI] [PubMed] [Google Scholar]
- 27. Schneider JA, Arvanitakis Z, Yu L, Boyle PA, Leurgans SE, Bennett DA. Cognitive impairment, decline and fluctuations in older community‐dwelling subjects with Lewy bodies. Brain. 2012;135(Pt 10):3005‐3014. [DOI] [PMC free article] [PubMed] [Google Scholar]
- 28. Nag S, Yu L, Capuano AW, et al. Hippocampal sclerosis and TDP‐43 pathology in aging and Alzheimer disease. Annals of Neurology. 2015;77(6):942‐952. doi: 10.1002/ana.24388 [DOI] [PMC free article] [PubMed] [Google Scholar]
- 29. Kapasi A, Yu L, Boyle PA, Barnes LL, Bennett DA, Schneider JA. Limbic‐predominant age‐related TDP‐43 encephalopathy, ADNC pathology, and cognitive decline in aging. Neurology. 2020;95(14):e1951‐e1962. [DOI] [PMC free article] [PubMed] [Google Scholar]
- 30. Boyle PA, Yu L, Nag S, et al. Cerebral amyloid angiopathy and cognitive outcomes in community‐based older persons. Neurology. 2015;85(22):1930‐1936. [DOI] [PMC free article] [PubMed] [Google Scholar]
- 31. Schneider JA, Wilson RS, Bienias JL, Evans DA, Bennett DA. Cerebral infarctions and the likelihood of dementia from Alzheimer disease pathology. Neurology. 2004;62(7):1148‐1155. [DOI] [PubMed] [Google Scholar]
- 32. Arvanitakis Z, Capuano AW, Leurgans SE, Bennett DA, Schneider JA. Relation of cerebral vessel disease to Alzheimer's disease dementia and cognitive function in elderly people: a cross‐sectional study. Lancet Neurol. 2016;15(9):934‐943. [DOI] [PMC free article] [PubMed] [Google Scholar]
- 33. Yu L, Tasaki S, Schneider JA, et al. Cortical proteins associated with cognitive resilience in community‐dwelling older persons. JAMA Psychiatry. 2020;77(11):1172‐1180. [DOI] [PMC free article] [PubMed] [Google Scholar]
- 34. Wingo AP, Fan W, Duong DM, et al. Shared proteomic effects of cerebral atherosclerosis and Alzheimer's disease on the human brain. Nat Neurosci. 2020;23(6):696‐700. [DOI] [PMC free article] [PubMed] [Google Scholar]
- 35. Higginbotham L, Carter EK, Dammer EB, et al. Unbiased classification of the human brain proteome resolves distinct clinical and pathophysiological subtypes of cognitive impairment. bioRxiv. 2022. doi: 10.1101/2022.07.22.501017. Published online. [DOI] [PMC free article] [PubMed] [Google Scholar]
- 36. Law CW, Chen Y, Shi W, Smyth GK. voom: precision weights unlock linear model analysis tools for RNA‐seq read counts. Genome Biol. 2014;15(2):R29. [DOI] [PMC free article] [PubMed] [Google Scholar]
- 37. Tasaki S, Xu J, Avey DR, et al. Inferring protein expression changes from mRNA in Alzheimer's dementia using deep neural networks. Nat Commun. 2022;13(1):655. [DOI] [PMC free article] [PubMed] [Google Scholar]
- 38. Green GS, Fujita M, Yang HS, et al. Cellular dynamics across aged human brains uncover a multicellular cascade leading to Alzheimer's disease. bioRxivorg. 2023. doi: 10.1101/2023.03.07.531493. Published online March 9. [DOI] [Google Scholar]
- 39. Fujita M, Gao Z, Zeng L, et al. Cell‐subtype specific effects of genetic variation in the aging and Alzheimer cortex. bioRxivorg. 2022. doi: 10.1101/2022.11.07.515446. Published online. [DOI] [Google Scholar]
- 40. Hao Y, Hao S, Andersen‐Nissen E, et al. Integrated analysis of multimodal single‐cell data. Cell. 2021;184(13):3573‐3587.e29. [DOI] [PMC free article] [PubMed] [Google Scholar]
- 41. Wang M, Beckmann ND, Roussos P, et al. The Mount Sinai cohort of large‐scale genomic, transcriptomic and proteomic data in Alzheimer's disease. Sci Data. 2018;5(1):180185. [DOI] [PMC free article] [PubMed] [Google Scholar]
- 42. Allen M, Carrasquillo MM, Funk C, et al. Human whole genome genotype and transcriptome data for Alzheimer's and other neurodegenerative diseases. Sci Data. 2016;3:160089. [DOI] [PMC free article] [PubMed] [Google Scholar]
- 43. Chai YL, Chong JR, Raquib AR, et al. Plasma osteopontin as a biomarker of Alzheimer's disease and vascular cognitive impairment. Sci Rep. 2021;11(1):4010. [DOI] [PMC free article] [PubMed] [Google Scholar]
- 44. Comi C, Carecchio M, Chiocchetti A, et al. Osteopontin is increased in the cerebrospinal fluid of patients with Alzheimer's disease and its levels correlate with cognitive decline. J Alzheimers Dis. 2010;19(4):1143‐1148. [DOI] [PubMed] [Google Scholar]
- 45. Johnson ECB, Dammer EB, Duong DM, et al. Large‐scale proteomic analysis of Alzheimer's disease brain and cerebrospinal fluid reveals early changes in energy metabolism associated with microglia and astrocyte activation. Nat Med. 2020;26(5):769‐780. [DOI] [PMC free article] [PubMed] [Google Scholar]
- 46. Brown A, Islam T, Adams R, et al. Osteopontin enhances HIV replication and is increased in the brain and cerebrospinal fluid of HIV‐infected individuals. J Neurovirol. 2011;17(4):382‐392. [DOI] [PMC free article] [PubMed] [Google Scholar]
- 47. Burdo TH, Ellis RJ, Fox HS. Osteopontin is increased in HIV‐associated dementia. J Infect Dis. 2008;198(5):715‐722. [DOI] [PMC free article] [PubMed] [Google Scholar]
- 48. Srinivasan K, Friedman BA, Etxeberria A, et al. Alzheimer's patient microglia exhibit enhanced aging and unique transcriptional activation. Cell Rep. 2020;31(13):107843. [DOI] [PMC free article] [PubMed] [Google Scholar]
- 49. De Schepper S, Ge JZ, Crowley G, et al. Perivascular cells induce microglial phagocytic states and synaptic engulfment via SPP1 in mouse models of Alzheimer's disease. Nat Neurosci. 2023;26(3):406‐415. [DOI] [PMC free article] [PubMed] [Google Scholar]
- 50. Kearns N, Iatrou A, Flood D, et al. Dissecting the Human Leptomeninges at single‐cell resolution. bioRxiv. Published online December 18, 2022:2022.12.15.520647. doi: 10.1101/2022.12.15.520647 [DOI]
- 51. Steinman L. A molecular trio in relapse and remission in multiple sclerosis. Nat Rev Immunol. 2009;9(6):440‐447. [DOI] [PubMed] [Google Scholar]
- 52. Chabas D, Baranzini SE, Mitchell D, et al. The influence of the proinflammatory cytokine, Osteopontin, on autoimmune demyelinating disease. 3rd International Conference on Osteopontin and SIBLING (Small Integrin‐Binding Ligand, N‐linked Glycoprotein) Proteins, 2002. Published online 2002. doi: 10.1100/tsw.2002.326 [DOI]
- 53. Rosmus DD, Lange C, Ludwig F, Ajami B, Wieghofer P. The role of osteopontin in microglia biology: current concepts and future perspectives. Biomedicines. 2022;10(4). doi: 10.3390/biomedicines10040840 [DOI] [PMC free article] [PubMed] [Google Scholar]
- 54. Bachstetter AD, Van Eldik LJ, Schmitt FA, et al. Disease‐related microglia heterogeneity in the hippocampus of Alzheimer's disease, dementia with Lewy bodies, and hippocampal sclerosis of aging. Acta Neuropathol Commun. 2015;3:32. [DOI] [PMC free article] [PubMed] [Google Scholar]
- 55. Murray ME, Cannon A, Graff‐Radford NR, et al. Differential clinicopathologic and genetic features of late‐onset amnestic dementias. Acta Neuropathol. 2014;128(3):411‐421. [DOI] [PMC free article] [PubMed] [Google Scholar]
- 56. Beuker C, Schafflick D, Strecker JK, et al. Stroke induces disease‐specific myeloid cells in the brain parenchyma and pia. Nat Commun. 2022;13(1):945. [DOI] [PMC free article] [PubMed] [Google Scholar]
- 57. Bulk M, Moursel LG, van der Graaf LM, et al. Cerebral amyloid angiopathy with vascular iron accumulation and calcification. Stroke. 2018;49(9):2081‐2087. [DOI] [PubMed] [Google Scholar]
- 58. Grand Moursel L, van der Graaf LM, Bulk M, van Roon‐Mom WMC, van der Weerd L. Osteopontin and phospho‐SMAD2/3 are associated with calcification of vessels in D‐CAA, an hereditary cerebral amyloid angiopathy. Brain Pathol. 2019;29(6):793‐802. [DOI] [PMC free article] [PubMed] [Google Scholar]
- 59. Fujita D, Terada S, Ishizu H, et al. Immunohistochemical examination on intracranial calcification in neurodegenerative diseases. Acta Neuropathol. 2003;105(3):259‐264. [DOI] [PubMed] [Google Scholar]
- 60. Lok ZSY, Lyle AN. Osteopontin in vascular disease. Arterioscler Thromb Vasc Biol. 2019;39(4):613‐622. [DOI] [PMC free article] [PubMed] [Google Scholar]
- 61. Wu J, Wu H, An J, Ballantyne CM, Cyster JG. Critical role of integrin CD11c in splenic dendritic cell capture of missing‐self CD47 cells to induce adaptive immunity. Proc Natl Acad Sci U S A. 2018;115(26):6786‐6791. [DOI] [PMC free article] [PubMed] [Google Scholar]
- 62. Rhodes JW, Tong O, Harman AN, Turville SG. Human Dendritic Cell Subsets, Ontogeny, and Impact on HIV Infection. Front Immunol. 2019;10:1088. [DOI] [PMC free article] [PubMed] [Google Scholar]
- 63. Merad M, Sathe P, Helft J, Miller J, Mortha A. The dendritic cell lineage: ontogeny and function of dendritic cells and their subsets in the steady state and the inflamed setting. Annu Rev Immunol. 2013;31:563‐604. [DOI] [PMC free article] [PubMed] [Google Scholar]
- 64. Bertram KM, Botting RA, Baharlou H, et al. Identification of HIV transmitting CD11c+ human epidermal dendritic cells. Nat Commun. 2019;10(1):2759. [DOI] [PMC free article] [PubMed] [Google Scholar]
- 65. Butovsky O, Koronyo‐Hamaoui M, Kunis G, et al. Glatiramer acetate fights against Alzheimer's disease by inducing dendritic‐like microglia expressing insulin‐like growth factor 1. Proc Natl Acad Sci U S A. 2006;103(31):11784‐11789. [DOI] [PMC free article] [PubMed] [Google Scholar]
- 66. Olah M, Menon V, Habib N, et al. Single cell RNA sequencing of human microglia uncovers a subset associated with Alzheimer's disease. Nat Commun. 2020;11(1):6129. [DOI] [PMC free article] [PubMed] [Google Scholar]
- 67. de Lopes K P, Snijders GJL, Humphrey J, et al. Genetic analysis of the human microglial transcriptome across brain regions, aging and disease pathologies. Nat Genet. 2022;54(1):4‐17. [DOI] [PMC free article] [PubMed] [Google Scholar]
- 68. Humphrey J, Venkatesh S, Hasan R, et al. Integrative transcriptomic analysis of the amyotrophic lateral sclerosis spinal cord implicates glial activation and suggests new risk genes. Nat Neurosci. 2022. doi: 10.1038/s41593-022-01205-3. Published online. [DOI] [PubMed] [Google Scholar]
- 69. Situ M, Citalan‐Madrid AF, Stamatovic SM, Keep RF, Andjelkovic AV. Transcriptomic profile of blood‐brain barrier remodeling in cerebral amyloid angiopathy. Front Cell Neurosci. 2022;16:931247. [DOI] [PMC free article] [PubMed] [Google Scholar]
- 70. Thul PJ, Åkesson L, Wiking M, et al. A subcellular map of the human proteome. Science. 2017;356(6340). doi: 10.1126/science.aal3321 [DOI] [PubMed] [Google Scholar]
- 71. Selvaraju R, Bernasconi L, Losberger C, et al. Osteopontin is upregulated during in vivo demyelination and remyelination and enhances myelin formation in vitro. Mol Cell Neurosci. 2004;25(4):707‐721. [DOI] [PubMed] [Google Scholar]
- 72. Rentsendorj A, Sheyn J, Fuchs DT, et al. A novel role for osteopontin in macrophage‐mediated amyloid‐β clearance in Alzheimer's models. Brain Behav Immun. 2018;67:163‐180. [DOI] [PMC free article] [PubMed] [Google Scholar]
- 73. Mahmud FJ, Du Y, Greif E, et al. Osteopontin/secreted phosphoprotein‐1 behaves as a molecular brake regulating the neuroinflammatory response to chronic viral infection. J Neuroinflammation. 2020;17(1):273. [DOI] [PMC free article] [PubMed] [Google Scholar]
- 74. Morisaki Y, Niikura M, Watanabe M, et al. Selective expression of osteopontin in ALS‐resistant motor neurons is a critical determinant of late phase neurodegeneration mediated by matrix metalloproteinase‐9. Sci Rep. 2016;6:27354. [DOI] [PMC free article] [PubMed] [Google Scholar]
- 75. Thrupp N, Sala Frigerio C, Wolfs L, et al. Single‐nucleus RNA‐seq is not suitable for detection of microglial activation genes in humans. Cell Rep. 2020;32(13):108189. [DOI] [PMC free article] [PubMed] [Google Scholar]
Associated Data
This section collects any data citations, data availability statements, or supplementary materials included in this article.
Supplementary Materials
The bulk RNASeq, TMT proteins expression and snRNASeq datasets are deposited on Synapse (https://www.synapse.org/) IDs syn3388564, syn17015098 and syn31512863 respectively. Tables, figures and extended methods are available in the supplementary material of this paper. ROSMAP resources can be requested at https://www.radc.rush.edu
Supporting Information