

Abstract
Phthalates are a family of industrial and consumer product chemicals, among which diethyl phthalate (DEP) has been widely used. DEP is metabolized into the active metabolite monoethyl phthalate (MEP) and exposure to DEP may induce male reproductive toxicity, developmental toxicity and hepatotoxicity. To better assess the toxicity of DEP and MEP, it is important to understand and predict their internal concentrations, especially in reproductive organs. Here we present a human physiologically based pharmacokinetic (PBPK) model of DEP. Implemented in R, the PBPK model consists of seven tissue compartments, including blood, gut, liver, fat, skin, gonad, and rest of body (RB). In the blood both DEP and MEP partition into free and bound forms, and tissue distribution is considered as blood flow-limited. DEP is metabolized in the gut and liver into MEP which is further glucuronidated and cleared through the urine. The chemical-specific parameters of the model were predicted in silico or estimated based on published human urinary MEP data after exposure to DEP in the air at 250 or 300 μg/m3 for 3 or 6 hours through inhalation and dermal absorption. Sensitivity analysis identified important parameters including partition coefficients of DEP for fat, RB, and skin compartments, and the rate constants for glucuronidation of MEP and urinary excretion, with regard to Cmax, area under the curve (AUC), and clearance half-lives of DEP and MEP. A subset of the sensitive parameters was then included in hierarchical population Bayesian Markov chain Monte Carlo (MCMC) simulations to characterize the uncertainty and variability of these parameters. The model is consistent with the notion that dermal absorption represents a significant route of exposure to DEP in ambient air and clothing can be an effective barrier. The developed human PBPK model can be utilized upon further refinement as a quantitative tool for DEP risk assessment.
Keywords: diethyl phthalate, monoethyl phthalate, PBPK, Bayesian
Graphical Abstract

Introduction
Phthalates are widely used synthetic compounds. Depending on the ester groups, phthalates exist in many different forms, including di(2-ethylhexyl) phthalate (DEHP), dibutyl phthalate (DBP), and diethyl phthalate (DEP). Their primary application is as plasticizers, but they are also used as solvents, in personal care products and medical devices. Being semi-volatile organic compounds (SVOCs) and not covalently bound in the end products, phthalate esters can easily leak out and pollute the environment, including air, dust, water, and food (Gao and Wen 2016). Human exposure to phthalate can be through food ingestion, inhalation, dermal contact, and medical procedures. Exposure to phthalates has been shown to be associated with or cause reproductive, developmental, and metabolic adverse outcomes in both animals and humans (Jaakkola and Knight 2008, Hatch et al. 2010, Martino-Andrade and Chahoud 2010, Svensson et al. 2011, Kay et al. 2014, Radke et al. 2019).
The production and usage of DEHP, DBP, butylbenzyl phthalate (BBP), diisobutyl phthalate (DIBP), di-isononyl phthalate (DINP), di-isodecyl phthalate (DIDP), and di-n-octyl phthalate (DnOP) have been forbidden or severely reduced worldwide in recent years by legislatures out of concern of their toxicity (Kamrin 2009, Ventrice et al. 2013). In contrast, DEP, dimethyl phthalate (DMP), and di(2-propylheptyl) phthalate (DPHP) are not banned or restricted and are still in wide use. DEP is detected in indoor air and dust in nearly all geographic locations (Rudel et al. 2003, Wensing et al. 2005, Weschler and Nazaroff 2008). Studies have shown that DEP and its metabolite monoethyl phthalate (MEP) can cause androgen-independent male reproductive toxicity, female reproductive toxicity, developmental toxicity and liver toxicity (Weaver et al. 2020). MEP may induce female reproductive toxicity by interfering with aromatase enzymes or peroxisome proliferator-activated receptors (Lovekamp-Swan and Davis 2003).
Experimental pharmacokinetic studies in animals and humans demonstrated that the absorption, distribution, metabolism, and excretion (ADME) of phthalates have the following general characteristics (Albro et al. 1982, Albro and Lavenhar 1989, Kavlock et al. 2002, Frederiksen et al. 2007, Domínguez-Romero and Scheringer 2019). The gastrointestinal (GI) tract plays a significant role, in addition to the liver, in metabolizing the phthalate diesters into monoesters. Therefore, for oral exposure, monoesters can be the principal compound form that is absorbed. For DEP specifically, one of its two diethyl chains is hydrolyzed through phase I biotransformation to produce the monoester MEP primarily in the liver and GI (Lake et al. 1977, Rowland et al. 1977, Kayano et al. 1997). MEP then undergoes phase II biotransformation to form glucuronide conjugate that is excreted into the urine (Silva et al. 2003). Such metabolic pathways of phthalates seem to be conserved across species with mainly quantitative differences. Phthalates in the blood circulation can exist in highly bound form with plasma proteins, mainly albumin, such that the free fraction can be considerably low (Xie et al. 2011, Yue et al. 2014). Monoester metabolites are quickly eliminated from the body through the urinary system, and some phthalate species exhibit biliary excretion and enterohepatic recycling. Urinary monoesters such as MEP have been used as biomarkers for phthalate exposures in humans (Api 2001). The half-lives of phthalates, as measured in blood, plasma, or urine, are generally shorter than 24 hours in both humans and rodents (Domínguez-Romero and Scheringer 2019).
In general, for less hydrophobic phthalates, such as DEP, they tend to be absorbed through the skin and lung with higher bioavailability than more hydrophobic ones such as DEHP (Scott et al. 1987, Kademoglou et al. 2018, Krais et al. 2018). Therefore, uptake through inhalation and dermal penetration can be significant routes of exposure to DEP (Janjua et al. 2007, Janjua et al. 2008, Weschler et al. 2015, Krais et al. 2018). Particularly, DEP and other low-molecular-weight phthalates are used widely in personal care products as solvents and adhesives (Wormuth et al. 2006, Dodson et al. 2012). Transdermal absorption can also be a major exposure route for DEP even via air exposure, in the absence of direct skin contact as in lotion or cosmetics (Weschler and Nazaroff 2014, Weschler et al. 2015, Krais et al. 2018).
Physiologically based pharmacokinetic (PBPK) models of phthalates have been developed over the years, including those for DEHP and its metabolite MEHP in rats and humans (Keys et al. 1999, Gentry et al. 2011, Campbell et al. 2018, Sharma et al. 2018), and for DBP and its metabolite MBP in normal or pregnant rats (Keys et al. 2000, Clewell et al. 2008). Jeong et al. developed a PBPK model for DEP and MEP in rats based on intravenous and oral DEP exposure kinetic data and allometrically extrapolated it into a human model without validation (Jeong et al. 2020). A human population PK model for DEP was developed without the complication of physiologically based structures (Wu et al. 2021). More recently, Hu et al. have adapted the human version of Jeong’s model by adding the skin compartment and used it to conduct an in-depth quantification of transdermal absorption of DEP from exposure to personal care products and air (Hu et al. 2022). However, a fundamental mechanistic understanding of the kinetics of DEP and MEP as well the variability and uncertainty involved are still lacking. In the present study we presented a human PBPK model of DEP based on published exposure and urinary MEP data. With the model we explored the role of dermal exposure in DEP and MEP tissue dosimetry. Through population hierarchical Bayesian simulations, we characterized the uncertainties and variabilities of parameters that are influential on the ADME of DEP and MEP. The developed model can be used upon further improvement as an in silico tool for DEP risk assessment.
Methods
1. Model structure
The PBPK model consists of seven tissue compartments including the Blood compartment, tracking the concentrations of both the parent compound DEP and the metabolite MEP (Fig. 1). The tissue compartments include Gut, Liver, Adipose, Skin, Gonad, and Rest of Body (RB) and are all simulated as blood flow-limited. DEP is metabolized in the Gut and Liver into MEP. Liver MEP is further glucuronidated and then cleared through urinary excretion. Glucuronidated MEP is assumed to be the only phthalate species that is excreted into the urine. In the Blood, both DEP and MEP partition into free and bound forms.
Figure 1. The structure of the human PBPK model for DEP and MEP.

Light green boxes: body compartments as indicated, blue arrows: blood flow, orange arrows: internal metabolism of DEP to MEP in Liver and Gut, red arrows: DEP exposure through inhalation or dermal absorption, purple arrow: urinary excretion of MEP.
2. Urine MEP kinetics data
Two kinetics studies of DEP exposure in humans (Table S1) were used for parameter estimation and model validation (Weschler et al. 2015, Krais et al. 2018). The Weschler study included 6 healthy Caucasian men aged between 27–66 years. The participants were divided into two groups, three each. During the exposure experiments, they wore only shorts with the legs and upper body exposed. Participants in Group 1 were first exposed to DEP in air at 250 μg/m3 concentration for 6 h by wearing a hood breathing clean air. One week later, they were exposed to DEP in the air at the same concentration also for 6 h without wearing a hood. Participants in Group 2 had similar exposure paradigms except that hoods were worn only in the second week. Urine samples were collected starting in the mornings of the exposure and continuously for up to 54 h after the onset of each exposure episode. MEP concentrations in urine samples were measured after enzymatic deconjugation of the phthalate metabolites from the glucuronidated form by 2-D high-performance liquid chromatography coupled to tandem mass spectrometry (LC/LC–MS/MS) and were normalized to urinary creatinine. The numerical values of the concentrations of each participant were obtained by digitizing Figure 1 in (Weschler et al. 2015) using WebPlotDigitizer (https://automeris.io/WebPlotDigitizer).
The second study, by Krais et al., included 16 Caucasians (9 women and 7 men) aged between 19–47 years. During the exposure experiments, they wore loosely-fitted hospital cotton clothes with hands, neck and head uncovered. They were exposed to deuterium-labelled DEP in air at 300 μg/m3 concentration for 3 h, and as in the Weschler study, each participant either wore or didn’t wear hood, separated by a washout period of at least one week. Urine samples were collected continuously, from the beginning of each exposure episode for up to 24 h. Urine MEP concentrations were measured similarly as in the Weschler study.
3. Model parameterization and equations
The default values and reference sources for physiological and chemical-specific parameters including estimated skin exposure areas are provided in Table S2. The parameters for Gut and Liver enzyme kinetics, dermal absorption of DEP, and urinary excretion of MEP were estimated by using the skin exposure-only (wearing hood) urinary data from the Weschler study. A constant creatinine production rate of 20 mg/kg BW/day was used to normalize the urine MEP concentrations. The ordinary differential equations (ODEs) tracking the amount changes of DEP and MEP in tissue compartments are provided in Table S3. For inhalation exposure, the relevant parameters were set so that DEP is absorbed 100%, which is consistent with in vitro studies showing that less hydrophobic phthalates such as DEP have >75% bioavailability through inhalation (Kademoglou et al. 2018).
4. Simulation tools and model sharing
The PBPK model was coded, simulated, and analyzed in R (version 3.5.3). The package “desolve” was used to solve the ODEs numerically, “sensitivity” was used for the sensitivity analysis, and “FME” was used for Bayesian Markov chain Monte Carlo (MCMC) simulations. All model code is available at https://github.com/pulsatility/2023-DEP-PBPK-Model.git.
5. Model simulation and analysis
5.1. Sensitivity analysis
A global sensitivity analysis was performed using the hood-wearing 6-h exposure regimen as reported in the Weschler study to evaluate the influence of chemical-specific parameters on maximal concentrations (Cmax), 60-h areas under the curve (AUC), and half-lives of plasma DEP and MEP, Gonad DEP and MEP, and Urine MEP using the Morris method in the “sensitivity” R package. The Morris method is efficient for estimating global sensitivities for large parameter sets (Paleari et al. 2021). After the termination of exposure, the chemical species concentrations in the above 3 compartments generally follow a two-phase decay profile where the first phase is mainly the distribution phase while the second phase is the metabolism phase. The half-lives associated with both phases were calculated. For the first decay phase, the half-life was determined by taking the first time point at which the concentration is equal or less than half of the Cmax and then subtracting the exposure duration. For the second decay phase, the slope, kslope, on the semi-log concentration scale was measured between 40–50 h, and then ln(2)/(-kslope) was used to calculate the half-life. In Morris screening, the influence of each parameter is assessed with two sensitivity measures: μ, which measures the overall influence of a parameter, and σ, which estimates the interaction propensity or non-linearity effect. Each of the parameters was sampled within the range of ±1% of the default value for each iteration, and the corresponding Cmax, AUCs, and half-lives were computed. Three cycles were run to obtain the average sensitivity results.
5.2. Bayesian MCMC
Definition of prior distributions of parameters:
Based on the parameter sensitivity analysis results for Urine MEP, the following 4 most sensitive parameters were selected for optimization for the hierarchical Bayesian MCMC simulation: kSkin_absorption, kUrine_MEP, PSkin_plasma_DEP, and PRB_plasma_DEP. The setup of prior distributions and Bayesian simulation follows the procedure in (Chou and Lin 2019). Briefly, the uncertainty prior distribution for the population mean (μ) of each parameter was defined as log-normal, with a hyperparameter mean value (M) and variance (S2). The M value for each of the 4 parameters was the default value provided in Table S2. The S value for each parameter was assumed to be 50% of M. The uncertainty prior distribution for the population variance (Σ2) of each parameter was defined as inverse gamma distributions: Γ−1(α, β), where α is the shape parameter (α > 0) and β the inverse scale parameter (β > 0). Based on the assumption of 100% coefficient of uncertainty, α was set to 3, and β to (α−1) ∙ Σ02, where Σ02 is the central value of population variance (Σ2), and was set to 30% for a moderate level of variations. The prior distribution of unknown error (σ2) followed a log-uniform distribution with 0.5 as the central value and 0.01–3.3 as the boundary for the Urine MEP.
MCMC using no-hood data in Weschler study:
With a set of prior parameters (θ, φ, E, t) and an independent variance σ2, the PBPK model simulated the no-hood DEP exposure scenario in the Weschler study to predict the Urine MEP concentrations at the individual level. Three Markov chains of 100,000 iterations each were run with the first 50,000 as “burn-in” iterations and the last 50,000 iterations were used to derive the posterior distributions.
Convergence:
The convergences of the posterior parameter distributions of each chain were assessed by the potential scale reduction factor (R) and Brooks-Gelman multivariate shrink factor (MPSRF). A convergence diagnostic R value of 1.2 or less was used as the criterion for acceptable convergence.
Global evaluation of model fit and validation:
For global evaluation of model fit, the “Best parameters” of the population mean posterior distributions obtained after MCMC by the FME package in R were used to simulate the Urine MEP concentrations for individuals in the no-hood exposure regimen in the Weschler study, where each individual had different body weight and skin surface area. The simulated Urine MEP concentrations were compared with each individual’s data. For validation, the independent dataset in the Krais study was used. Every 10th parameter values in the posterior distributions were used to run the PBPK model for the hood and no-hood exposure scenarios in the Krais study and the simulated time-course of Urine MEP was compared with the data.
Results
1. Estimation of default model parameters using urine MEP data
The initial calibration of the model was focused on estimating the following 5 parameters, kSkin_absorption, kUrine_MEP, CLGint, CLLint, and kglucuronidation, as detailed in Table S2, which are the most uncertain ones compared with the others that are either well-defined physiological parameters or chemical-specific parameters experimentally measured or predicted with established chemoinformatic algorithms. Compared with the Krais study, the Weschler study (i) had a much longer urine sampling time (24 vs. 54 h) which revealed two distinct clearance phases of MEP, and (ii) the hood-wearing experiment has a much larger skin area exposed, which can reduce the uncertainty in dermal exposure estimation (Weschler et al. 2015). In the hood-wearing scenario, only dermal exposure needs to be considered, eliminating another source of uncertainty on the relative contributions by dermal vs. respiratory exposure when the latter is also present. Therefore, the averaged urine MEP concentrations of the 6 hood-wearing human subjects in the Weschler study were used for initial parameter estimation. The details of parameter estimation are provided in Table S2.
With the estimated parameter values, the simulated creatinine-adjusted Urine MEP concentrations recapitulated the Weschler’s hood-wearing data very well (Fig. 2A), with R2 at 0.91 and RMSE at 0.21 for log-transformed values, and the averaged fold difference at 1.10. The predicted plasma DEP and MEP concentrations are shown in Fig. 2B. The exposure through skin absorption lasted 6 h, at which point plasma DEP, MEP and Urine MEP all peaked. The clearance of plasma DEP and MEP exhibited 2 distinct phases, a fast phase lasting about 7–9 hours followed by a slow phase. The plasma DEP and MEP declined nearly in parallel in the first phase with projected half-life of 1.54 h and 2.27 h respectively, however, their second phases diverged with MEP (half-life 15 h) cleared faster than DEP (half-life 17.2 h).
Figure 2. Comparison of PBPK model simulations with experimental data of Weschler et al. 2015.
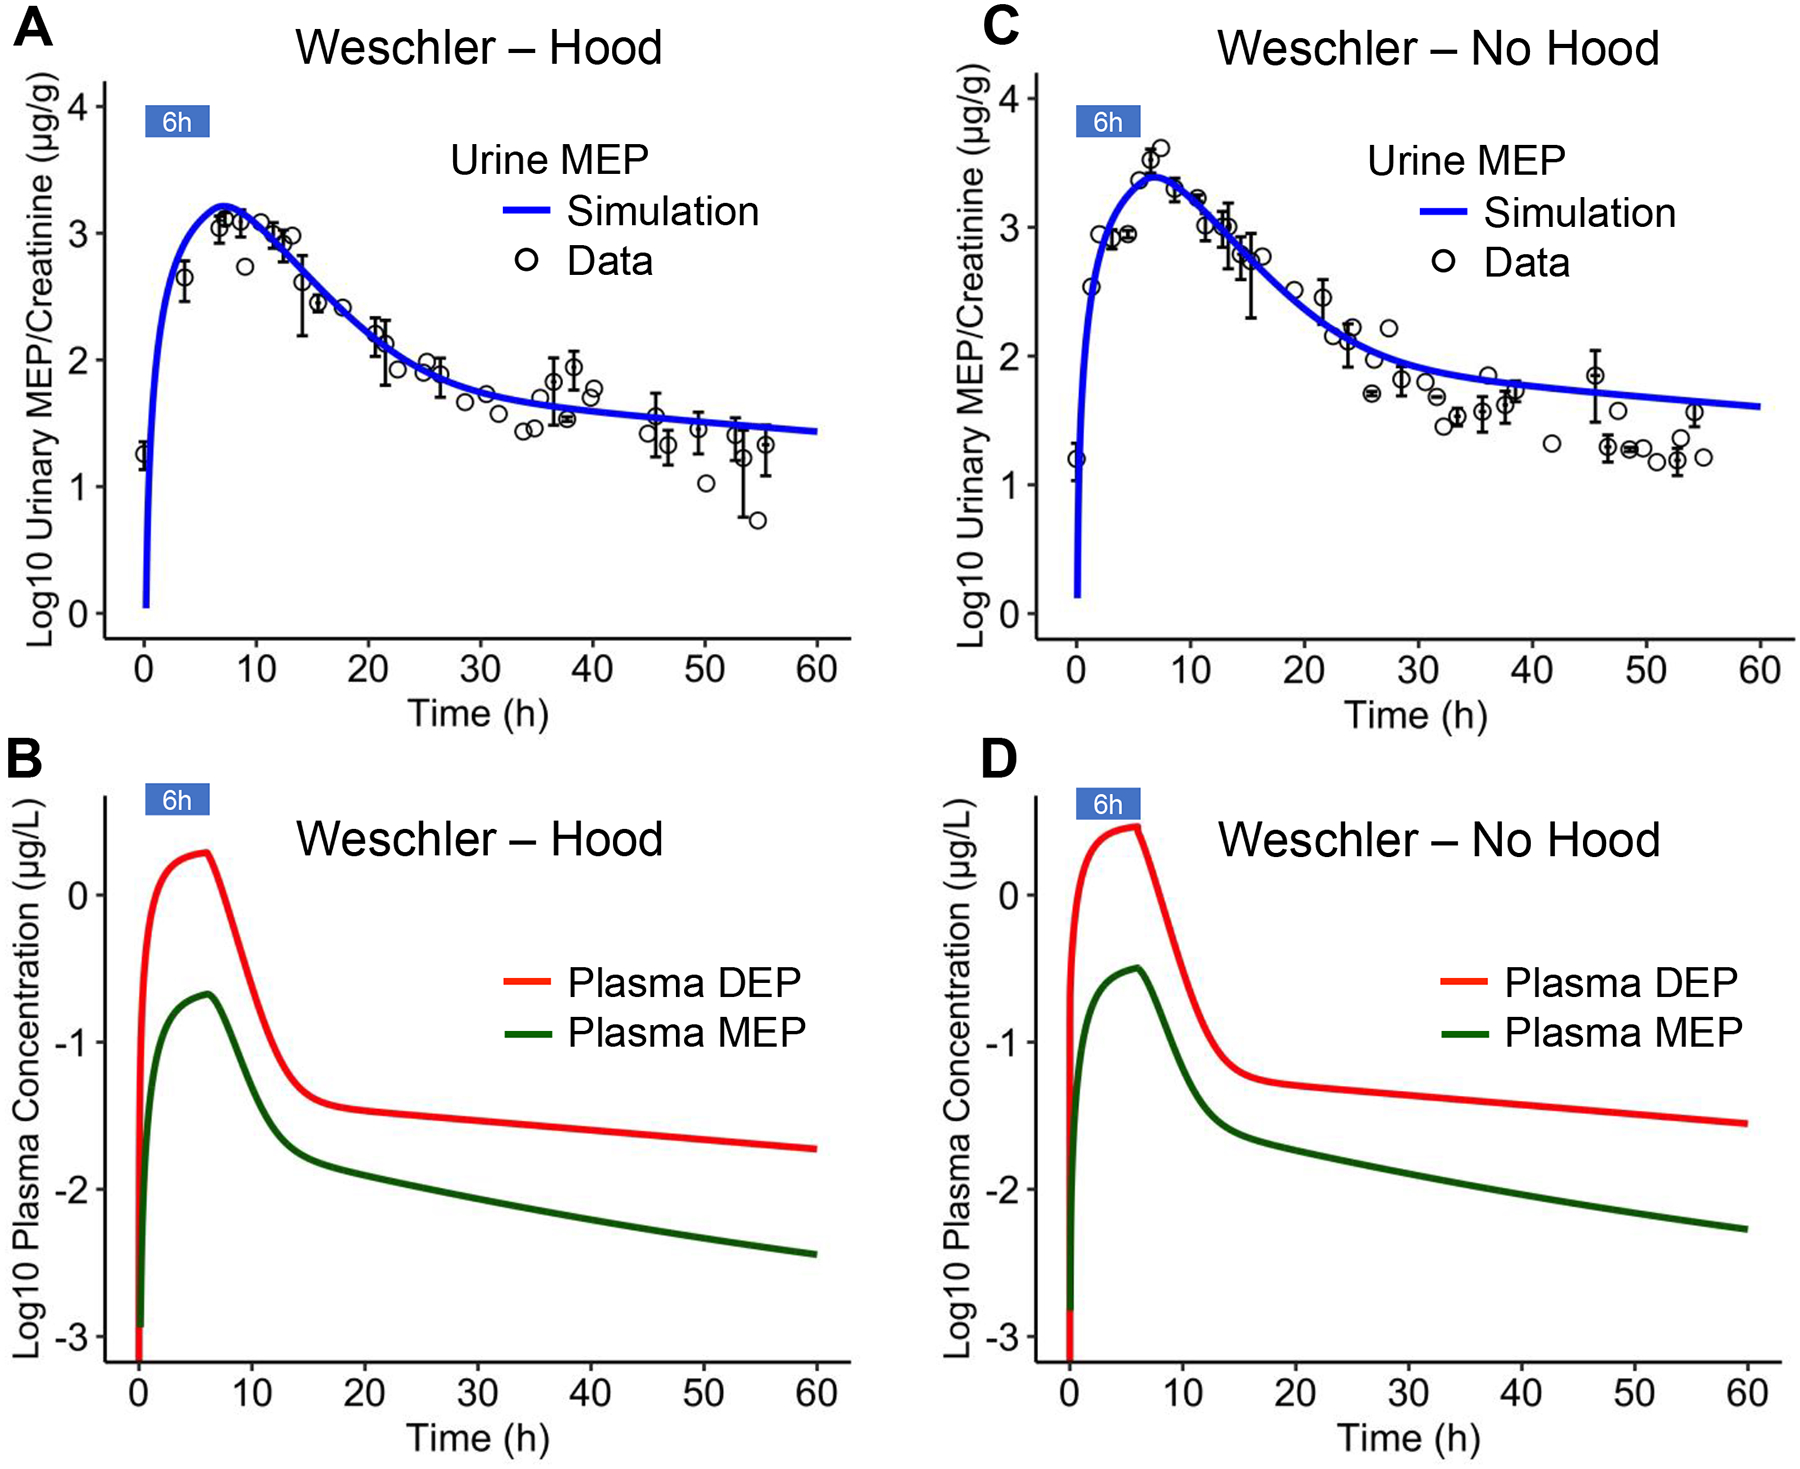
(A) Creatinine-adjusted Urine MEP concentrations from Weschler et al. 2015 (circles) and model simulations (blue line) for human individuals exposed to 250 μg/m3 DEP in room air for 6 hours but breathing clean air by wearing hood. (B) Model-predicted plasma DEP and MEP concentrations for exposure regimen in (A). (C) Creatinine-adjusted Urine MEP concentrations from Weschler et al. 2015 (circles) and model simulations (blue line) for human individuals exposed to 250 μg/m3 DEP in room air for 6 hours without wearing hood. (D) Model-predicted plasma DEP and MEP concentrations for exposure regimen in (C). Standard error of means (SEM) for Urine MEP concentrations are indicated by vertical bars and SEM for urine collection time are indicated by horizontal bars, where available.
With the PBPK model calibrated based on the hood-wearing data, we next predicted for the no-hood exposure scenario by turning on ventilation. Here the assumption is that all inhaled DEP will be absorbed. As shown in Fig. 2C, without further parameter adjustment, the model predicts the Urine MEP concentrations reasonably well, with R2 at 0.94, RMSE at 0.24, and averaged fold difference at 1.44, thus lending confidence to the calibrated model. The only exception is that the model slightly overestimated the Urine MEP concentrations in the second clearance phase. The predicted plasma DEP and MEP concentrations for no-hood exposure are shown in Fig. 2D.
2. Sensitivity analysis
Global sensitivity analyses on multiple kinetic properties of DEP and MEP were performed on the hood-wearing, 6-h exposure scenario by using the Morris method in the “sensitivity” R package.
2.1. Cmax, AUC and half-lives of Plasma and Gonad DEP
For Cmax and AUC of Plasma DEP, the most sensitive parameter is kSkin_absorption, as expected, which is the first-order skin absorption rate constant (Fig. 3A). For the Cmax of Plasma DEP, the partition coefficients of the Skin, RB and Fat compartments have the most negative effects in that order among all tissue partition coefficients. For the AUC of Plasma DEP, the partition coefficient in the Fat compartment has the most negative effect. CLGint and CLLint, as well as fuDEP also negatively influence Cmax and AUC. The half-life of plasma DEP in the first clearance phase, evaluated by calculating the time taken to drop from Cmax to half of the value, is only influenced by the partition coefficients of the Skin and RB compartments, suggesting that how fast DEP is released from the initially absorption site, the Skin, and then how fast it is distributed to RB primarily determine the rate of the first clearance phase. The half-life of plasma DEP in the second clearance phase, calculated by measuring the slope on the log concentration scale, is most sensitive to the partition coefficient of DEP in Fat, indicating that the holding back of DEP by fat tissue plays an important role in slowing down DEP metabolism. The second most sensitive parameter is fuDEP, followed by CLGint and CLLint, but their effects are much smaller than the partition coefficient of DEP in Fat. The relative insensitivity to CLGint and CLLint suggests that the metabolism of DEP is not biochemically-limited.
Figure 3.

Global parameter sensitivity analyses on Plasma DEP (A) and Gonad DEP (B), Plasma MEP (C), Gonad MEP (D), and Urine MEP (E) for different kinetic metrics: Cmax, AUC, and half-lives of the first and second clearance phases for simulations of human exposure to 250 μg/m3 DEP in room air for 6 hours wearing hood.
For Cmax and AUC of Gonad DEP, the order of parameter sensitivity is similar to Plasma DEP, except that the partition coefficient of Gonad is equally as sensitive as kSkin_absorption (Fig. 3B). For Gonad DEP half-life in the first clearance phase, the partition coefficients of Skin, RB, and Gonad compartments have the most positive influence, and CLGint and CLLint have smaller but negative effects. For Gonad DEP half-life in the second clearance phase, the sensitivity follows the same order as that for Plasma DEP.
2.2. Cmax, AUC and half-lives of Plasma and Gonad MEP
For Cmax and AUC of Plasma MEP, kSkin_absorption has the most positive effect (Fig. 3C). kglucuronidation and fuMEP are the two most sensitive parameters that have negative effects. Among the remaining parameters, partition coefficients of DEP in Skin and RB compartments have some minor negative influences on Cmax. Plasma MEP half-life in the first clearance phase is mostly affected positively by the partition coefficients of DEP in Skin and RB, followed by that of MEP in RB and Gut and of DEP in Liver. The partition coefficient of MEP in Fat tends to shorten the half-life. The Plasma MEP half-life in the second clearance phase is most sensitive to the partition coefficient of MEP in Fat. The partition coefficient of DEP in Fat is the second most sensitive parameter. fuDEP, CLGint and CLLint, and the partition coefficients of DEP and MEP in RB play negative but much minor roles.
For Cmax and AUC of Gonad MEP, the sensitive parameters are almost identical to those influencing Plasma MEP (Fig. 3D), except for the partition coefficient of MEP in Gonad, which plays an almost equally sensitive and positive role as kSkin_absorption. For Gonad MEP half-life in the first clearance phase, the partition coefficients of DEP in Skin and RB and that of MEP in RB and Gonad have positive effects, and that of MEP in Fat and CLLint have negative effects. For Gonad MEP half-life in the second clearance phase, the sensitivity follows the same order as Plasma MEP.
2.3. Cmax, AUC and half-lives of Urine MEP
Like the Cmax and AUC for DEP and MEP in other compartments, kSkin_absorption is the most influential parameter that can increase the Cmax and AUC of Urine MEP (Fig. 3E). kUrine_MEP, which is the first-order rate constant of glucuronidated MEP excretion to Urine, is the second most sensitive parameter for the Cmax of Urine MEP. Partition coefficients of DEP in Skin and RB are the most sensitive negative parameters. For the AUC of Urine MEP, partition coefficient of DEP in Fat has the most negative effect. The half-life of Urine MEP in the first clearance phase is most negatively regulated by kUrine_MEP, followed by CLLint and fuDEP, and positively regulated by partition coefficients of DEP in Skin and RB. The Urine MEP half-life in the second clearance phase is most sensitive to the partition coefficient of DEP in Fat, followed by kUrine_MEP. fuDEP, CLLint, and the partition coefficients of DEP in Skin and RB play negative but much minor roles.
In summary, skin absorption has the most influence on the concentrations of both DEP and MEP. While the partition coefficients of DEP in Skin and RB have the most influence on slowing down the first clearance (distribution) phase, that of MEP in Fat has an opposite effect on plasma MEP and Gonad MEP. The partition coefficients of DEP and MEP in Fat plays the most influential role in slowing down the second clearance (metabolism) phase in most compartments.
2.4. Effects of large parameter variation
The sensitivity analysis above suggests that the tissue partition coefficients play some major roles in clearance, while other parameters such as those for DEP metabolism in the Liver (CLLint) and Gut (CLGint), MEP glucuronidation (kglucuronidation), and MEP urinary excretion (kUrine_MEP) also have some effects. Sensitivity analysis was performed with each parameter varied by a small percentage, however, it is unknown whether when a parameter is altered by a much big fold change, similar effects remain. In this section we further confirmed the roles of these parameters in DEP and MEP clearance through simulations by varying each parameter to a much greater extent, i.e., 10-fold lower or higher than the default values.
Increasing the partition coefficients PSkin_plasma_DEP and PRB_plasma_DEP by 10-fold reduces the peak levels of all DEP and MEP species and considerably slows down the first clearance phase (Fig. 4A and 4B), which is consistent with the sensitivity analysis. However, decreasing the two partition coefficients by 10-fold from the default values only has a minimal impact on the kinetics. Consistent with the sensitivity analysis, increasing (decreasing) PFat_plasma_DEP markedly slows down (accelerates) the second clearance phase without affecting much the slope of the first clearance phase and Cmax (Fig. 4C), indicating that the storage of DEP in fat tissues plays an important role in the metabolic clearance of DEP. PGonad_plasma_DEP only has an effect on the Gonad DEP without affecting the overall kinetics of DEP and MEP in other tissues (Fig. 4D).
Figure 4.


Effects of various parameters on the kinetic profiles of multiple tissue DEP and MEP concentrations as indicated for simulations of human exposure to 250 μg/m3 DEP in room air for 6 hours wearing hood. Red, green, and blue curves denote simulations using 0.1, 1, and 10-fold of default parameter values.
The glucuronidation of MEP does not affect DEP while it dramatically alters Plasma and Gonad MEP and to a smaller extent Urine MEP (Fig. 4E). Increasing (decreasing) kglucuronidation decreases (increases) Cmax of Plasma MEP, with the time-course profile also shifting downward (upward) in parallel. Increasing kglucuronidation doesn’t tangibly affect Urine MEP, but decreasing it alters the clearance of Urine MEP (Fig. 4E). Increasing kUrine_MEP accelerates the first clearance phase of Urine MEP, bringing the time-course profile closer to that of Plasma MEP (Fig. 4F). However, the second clearance phase is not affected, with the same slope. Decreasing kUrine_MEP slows down Urine MEP decline, eliminating the fast first clearance phase.
At the default parameter setting, liver and gut metabolism of DEP is blood flow-limited, not biochemically-limited, since the sensitivities to CLGint and CLLint are relatively low for Cmax, AUC and half-lives of DEP (Fig. 3). This blood flow-limited feature is confirmed when CLGint and CLLint are increased or decreased by 10-fold, where the kinetic profile of Plasma DEP remains nearly identical to the profile at default CLGint and CLLint values, and so are Plasma MEP and Urine MEP (Fig. 4G and 4H), suggesting that in the liver and gut, DEP is already metabolized at nearly 100% of what is supplied by the perfusing blood.
Decreasing fuDEP increases the Cmax of Plasma and Gonad DEP, and slightly decreases the Cmax of Plasma, Gonad, and Urine MEP while making their second clearance phase slower. In contrast, increasing fuDEP by 10-fold has basically no effect (Fig. 4I). Decreasing fuMEP greatly increases the Cmax of Plasma MEP and Gonad MEP while increasing it by 10-fold has a much smaller effect (Fig. 4J).
3. Bayesian analysis
3.1. Bayesian MCMC convergence
Bayesian simulations for the 4 selected sensitive parameters, PSkin_plasma_DEP, PRB_plasma_DEP, kUrine_MEP, and kskin_absorption, indicate that the 3 MCMC chains, running for 100K iterations each, all converged for the population means and population variances (Fig. 5A), so are the model error sig2. The Gelman and Rubin Shrink Factors all approached to unity (Fig. 5B).
Figure 5.

Bayesian MCMC simulation results for human exposure to 250 μg/m3 DEP in room air for 6 hours without wearing hood. (A) Trace of the 3 Markov chains of the last-half of the 100K iterations of the natural logarithmic values of population mean and population variance of 4 model parameters, and model error sig2 as indicated. (B) Gelman and Rubin Shrink Factors indicating convergence.
3.2. The prior vs posterior population uncertainty distributions for the 4 parameters are shown in Fig. 6. For the population means, PSkin_plasma_DEP shifted slightly to higher values, while PRB_plasma_DEP slightly to lower values with a slightly broadening of the distribution. The distribution of kUrine_MEP mean narrowed considerably and shifted slightly to higher values. The distribution of kskin_absorption mean narrowed even more and shifted to lower values. The posterior distribution of sig2 experienced a similar change. For the population variance of the 4 parameters, the posterior distributions all shifted considerably to higher values and broadened. We next examined the correlations between the 4 parameters’ posterior distributions of the population means. Pearson correlation analysis of the logarithmic values showed that among the 6 pairs, PSkin_plasma_DEP and PRB_plasma_DEP are negatively correlated significantly with r=−0.32 and p<0.001; PSkin_plasma_DEP and kUrine_MEP are positively correlated significantly with r=0.53 and p<0.001, while the remaining pairs are less correlated (Fig. 7).
Figure 6.

Probability density of the prior and posterior uncertainty distributions on natural logarithmic scale for the population mean and population variance of the 4 model parameters and model error sig2 as indicated. Results were obtained from one Markov Chain (iterations 50K-100K).
Figure 7.

Pearson correlation analysis between natural logarithmic values of pairs of posterior distributions of population means as indicated.
3.3. Using the “Best Parameter” values output by the MCMC FME package for PSkin_plasma_DEP, PRB_plasma_DEP, kUrine_MEP, and kSkin_absorption, we ran the simulations for each individuals wearing no hood in the study by Weschler et al. 2015. The simulated time-course of Urine MEP is shown in Fig. S1B. Global evaluation of goodness of model fit showed that the predicted and observed Urine MEP values are clustered around the diagonal (Fig. 8A). The model has a tendency of overestimation for lower concentrations and underestimation for high concentrations. However, the predicted/observed ratios are largely within 2-fold (Fig. 8B). A similar good fit was also observed for the individuals wearing hood in the study by Weschler et al. 2015 (Fig. S1A).
Figure 8.

Comparisons of model predictions with Urine MEP data under no-hood DEP exposure from Weschler et al. 2015. (A) Global evaluation of goodness of model fit. Symbols denote different individuals. The vertical line on each symbol represents the residual of fitted linear regression. (B) Predicted/observed ratio vs. predicted values. Dashed red lines: 2-fold ratio range; black line: fitted polynomial curve; histogram: residuals.
3.4. Validation with independent Krais study dataset. Running the PBPK model for 5000 times with every 10th parameters in the posterior distribution produced time-course as shown in Fig. 9 for Krais hood and no-hood scenarios with the median and 2.5%−97.5% quantile indicated. The model predicted Urine MEP for the hood exposure scenario is similar to the experimental data (Fig. 9A), which represents a slight improvement over using the default parameter values (Fig. 3A). In comparison, the model considerably overpredicted the Urine MEP levels in the clearance phases for no-hood scenario (Fig. 9B), as did when using the default parameter values (Fig. 3B).
Figure 9.

Comparisons of model predictions using 5000 sets of posterior population mean parameter values with Urine MEP data under DEP exposure from Krais et al. 2018. (A) Hood-wearing (B) No-hood exposure scenarios. For simulations, solid blue line: median, light blue shade: 2.5%−97.5% quantile. For data, empty circle: mean of Urine MEP concentrations, vertical bar: SEM.
Discussion
In the present study we presented a human PBPK model of DEP and its metabolite MEP for inhalation and dermal exposures. To our knowledge, this is the first human DEP/MEP model that is calibrated and validated by using urine MEP data. Sensitive analysis identified that the partition coefficients of DEP for fat, skin, and RB compartments, and the rate constants for glucuronidation of MEP and urinary excretion are important parameters in determining the Cmax, AUC and clearance half-lives. Due to the flow-limited metabolism, the DEP metabolic rate constants in the liver and gut are not sensitive parameters.
1. Inhalation vs. dermal absorption contribution to DEP intake
Our model confirmed that dermal absorption through naked skin can be a significant route of exposure to DEP in ambient air. Our model predicted that in the Weschler study where the subjects were topless, the dermally absorbed dose of DEP is comparable to the intake through inhalation. In contrast, in the Krais study where only the head and hands were exposed to the DEP-containing air, the dermally absorbed dose was estimated by our model to be only 1/8 of that through inhalation. Therefore, clothing can be a significant barrier to dermal absorption of DEP. However, it has also been demonstrated that the protective role of clothing against phthalate exposure could be compromised if the clothes are pre-exposed to air containing DEP or DnBP, and in some cases they can even significantly increase the absorption of these phthalates (Morrison et al. 2016). It will be interesting to investigate in future human studies whether the protection provided by fresh clothing will lose its effect if they are worn in phthalate-containing air for an extended period of time. In real-world environmental exposure settings, dermal exposure to DEP more likely comes from direct contact with personal care product than air. Through sensitivity analysis of a compartmental PK model, it was shown that personal care products are the top contributor to body DEP burden (Wu et al. 2021).
2. Ovarian concentrations and reproductive health
Urine MEP concentration is associated with lower numbers of total, mature, and fertilized oocytes (Machtinger et al. 2018). Our model predicts that for simulations of human exposure to 250 μg/m3 DEP in room air for 6 hours wearing hood, the gonadal concentration of MEP can reach above 0.2 μg/L. In comparison, it has been reported that the mean MEP concentration in the ovarian follicular fluid of preconception women seeking in vitro fertilization (IVF) is 0.33±3.36 (GM±SD) μg/L (Yuan et al. 2020), and the concentrations are negatively associated with intrafollicular progesterone level (Du et al. 2019) and positively associated with the birth weight of infants (Wu et al. 2020). Indoor air DEP concentrations have been estimated to have median values of 0.6 μg/m3 with a wide range that can go up to 4 μg/m3 in some studies (Rudel et al. 2003, Fromme et al. 2004). Since the exposure levels in the studies by Weschler et al. and Krais et al. are much higher than normal populations, these results suggest that the value of the partition coefficient for the gonad used in the model may be either too low or in vivo ovarian follicles may actively uptake circulating MEP or DEP which is then metabolized into MEP therein. Ionization of phthalate plays a crucial role in the partitioning of phthalates into tissues. For instance, by considering the ionization of MnBP and MEHP at physiological pH, partition coefficient values predicted with the Poulin and Krishna method became closer to experimentally measured values (Keys et al. 1999, Keys et al. 2000).
3. Possible explanation of overprediction of urine MEP
While our model predictions are generally in agreement with measured urine MEP concentrations in both studies (Weschler et al. 2015, Krais et al. 2018), there are some discrepancies. With the best parameter values obtained after Bayesian MCMC, our model slightly overpredicts the urine MEP concentrations a day after DEP exposure (the second clearance phase) in the no-hood Weschler study (Fig. S1B). The model also overpredicts the urine MEP concentrations after the offset of the exposure in the Krais study particularly for the no-hood scenario by a large margin, using either the posterior parameter distributions (Fig. 9B) or the default parameter values (Fig. S2B). Part of the slight discrepancy with the Weschler study may lie in the data themselves. A closer examination of the data points in the Weschler study revealed that the urine MEP concentrations in the last few hours of the no-hood exposure scenario were actually lower than those of the hood-wearing exposure scenario (Fig. 2A vs. Fig. 2C). This is not expected since the human subjects were exposed to DEP both through skin and inhalation in the no-hood scenario while only exposed to DEP through skin in the hood-wearing scenario. This discrepancy may suggest variability in MEP measurement or possible liver or gut enzyme induction by high DEP doses.
Another explanation for the overprediction could be due to the desorption of dermal DEP back to the air and clothing after termination of the exposure. It has been shown that a skin absorption model would overpredict the amount of DEP and DnBP transferred into blood for not considering desorption (Gong et al. 2014). Desorption is not considered in our model and could be responsible for the generally higher urine MEP predicted. Showering or bathing may also accelerate the desorption. Interestingly, the subjects in the Weschler study were not allowed to have shower or bath at least 24 h after the exposure, while in the Krais study, the subjects were required to shower using phthalate-free soaps right after the exposure. This experimental procedural differences may thus well explain the earlier and larger overprediction by our model for the Krais study than the Weschler study. Another possibility is the metabolism of phthalate in the skin. It has been shown that DnBP and DEHP can be metabolized to monoesters in human and animal skins (Beydon et al. 2010, Hopf et al. 2014). Therefore, DEP may also be metabolized in the skin reducing its absorption into the systemic circulation after exposure. Lastly, the larger overprediction for the Krais study may be due to difference in the human subjects.
4. Model comparison, parameter uncertainty, and limitations
Wu et al. constructed a framework of multiple phthalate exposure and PK/PBPK models by using probabilistic approach to estimate urine and plasma phthalate and metabolite concentrations for the purpose of comparing with ToxCast in vitro data for margin of safety assessment (Wu et al. 2021). However, only the DEHP model was structured as PBPK, while the DEP model is a simple PK model. Jeong et al. developed a rat PBPK model for DEP based on experimental data and extrapolated it to a human model without validation to predict the reference dose for DEP exposure. (Jeong et al. 2020). By using their chemical-specific parameter values, including tissue partition coefficient, plasma free fractions, and liver and gut intrinsic clearance, we ran our model for the 4 different DEP exposure scenarios as in the Weschler and Krais studies. The simulations showed that the clearance of Urine MEP, as well as Plasma DEP and MEP only exhibits one phase (Fig. S3), lacking the tissue distribution phase as observed for urine MEP in the Weschler and Krais studies.
Inspecting the parameter values used in the Jeong study revealed that this lack of tissue distribution phase is likely due to the much smaller partition coefficient values used for most of the tissues such as muscle and fat. The partition coefficients have various impacts on the PK behaviors of plasma DEP, MEP and Urine MEP. The sensitivity analysis of our model showed that among all the partition coefficients, those of DEP for skin, RB and fat and of MEP for fat appear to play a bigger role than others, in determining Cmax, AUC, and the half-life of the clearance phases. The initially estimated values of skin and RB DEP partition coefficient using the PK-Sim for these parameters didn’t change much after the Bayesian parameter estimation. Those for DEP and MEP fat partitioning are 64.42 and 17.42 respectively, which are highly consistent with the range estimated for human and rats in (Domínguez-Romero and Scheringer 2019). In contrast, the partition coefficients in the Jeong study are close to unity or lower.
In the Jeong study, the estimated liver and gut clearance rate constants CLGint and CLLint are 100 and 24-fold lower respectively than our model. One reason for the discrepancy is because our fat partition coefficient of DEP is much greater than their value, about 40-fold higher, as a result most DEP is initially distributed to fat, not available for liver and gut metabolism. Therefore, the CL values in our model need to be higher to achieve appropriate levels of metabolism of DEP. In addition, the hepatic artery blood flow in the Jeong study is 23% of QC, which is too high compared with the normal physiological value of about 5%, while their portal vein blood flow is 17.4% which is about right (normally 19% for man). Therefore, if their model is flow-limited for DEP metabolism, then this erroneous high hepatic artery blood flow requires an even smaller CLLint.
More recently, Hu et al. adapted Jeong’s human model to study dermal exposure to DEP (Hu et al. 2022). They added a skin compartment to Jeong’s model and used their own experimental data obtained from dermal application and also from others for model calibration and validation. Since it inherited largely Jeong’s model, it suffers from the same issue of inappropriate hepatic blood flow fractioning – specifically, their hepatic artery:portal vein blood flow ratio is at 1.55:1, which is even higher than the already disproportionally high value of 1.32:1 used in Jeong’s model (for reference, physiologically it is about 1:4). Although Hu’s model was also calibrated and validated by using the Weschler and Krais studies as we did here, they have used cumulative urine MEP which does not involve creatinine correction, yet it is unclear whether their model was able to recapitulate the bi-phasic clearance profile in the time frame of observation. Compared with the Hu study, our sensitivity analysis is not limited to the Cmax and AUC of plasma DEP only, as we comprehensively covered both DEP and MEP’s Cmax and AUCs in multiple tissues and also for their bi-phasic clearance half-lives. After sensitivity analysis, we further conducted a more in-depth analysis and interpretation of the mechanisms of why different parameters have vastly different sensitivities and their implications for the ADME of DEP and MEP. Lastly, we used hierarchical Bayesian MCMC to conduct parameter variability and uncertainty analysis, which is a preferred approach than the simple MC simulation done in the Hu study.
Several parameters in our DEP PBPK model are estimated by using in silico methods or by fitting the model to the urinary data. Therefore, there are uncertainties with these values. According to (Weschler et al. 2015), the amount of DEP inhaled is very close to the amount of DEP in the inhaled air, suggesting that nearly all (>90%) DEP in the inhaled air is absorbed. Accordingly for inhalation exposure, our model uses a high plasma:air partition coefficient value such that nearly 100% of DEP inhaled is deposited into the body. This configuration produces a respiratory DEP update rate of 0.004 μg/kg BW/ μg/m3/h in our model, which is close to the range of 0.0059 ± 0.0045 (mean±SD) estimated by (Andersen et al. 2018).
The rate constant kskin_absorption determines how fast DEP is absorbed by the skin. The current value produces a dermal DEP uptake rate of 0.00051 μg/kg BW/ μg/m3/h in our model for the clothing condition in the Krais study. This value is close to the range of 0.00073 ± 0.00051 (mean±SD) estimated by (Andersen et al. 2018), in which the subjects had a similar clothing condition. Both our model and the study by Anderson et al. indicate that in a clothing condition where the two hands are the main exposed skin area, the dermal uptake rate of DEP is about 12% of the respiratory uptake rate.
In our model, glucuronidated MEP is cleared from the plasma directly into the urine with a first-order rate constant kUrine_MEP at 0.25/h for the default and 0.22/h as the best parameter after Bayesian MCMC. In contrast, the urinary excretion rate constant used in Jeong et al. is 245.7/h, which is 1000 times higher than our value. Part of the discrepancy is because in their model urine MEP is produced in the kidney, which is about 14–15 times smaller in volume than the plasma. It is worth noting that the human model developed by Jeong et al was extrapolated from a rat model and was not validated against any human data. Another uncertainty in our model is the urinary creatinine excretion rate, which was used to correct for urine MEP concentrations in the Weschler and Krais studies. Although urine creatinine has been traditionally used due to its relative constant excretion rate to adjust for biomarker concentrations in urine biomonitoring samples, it is also well known that such usage has its limitations as the creatinine excretion rate may vary considerably between individuals due to circadian rhythm and body hydration status, etc. (Greenberg and Levine 1989, Sallsten and Barregard 2021). Our model only considered a constant creatinine excretion rate per kg body weight, therefore some uncertainties in our model-predicted creatinine-adjusted urine MEP concentrations may result from this simplification. Future iteration of the model may consider the uncertainty and variation in creatinine excretion.
By comparing the prior and posterior distributions of the Bayesian analysis, it showed that the uncertainties of the population mean for PSkin_plasma_DEP, and PRB_plasma_DEP remained largely unchanged, while those for kUrine_MEP and kSkin_absorption were markedly reduced, suggesting the Weschler non-hood data, which was used for the Bayesian MCMC, provided more information to define the two latter parameters. Interestingly, the population variance for all 4 parameters increased and their uncertainty distributions also widened, suggesting that there is a larger inter-individual variability in these parameters but with higher uncertainties.
5. Future plan and conclusions
In summary, we have developed and calibrated a human PBPK model of DEP based on human urine MEP data. The model provides important insights into the ADME characteristics of DEP and MEP. Future iteration of the model may consider several modifications as sufficient information for humans becomes available. For instance, biliary excretion and entero-hepatic recyclizing MEP may be considered, which has been suggested based on experimental data in rats (Payan et al. 2001, Knudsen et al. 2017, Jeong et al. 2020). The model may also be expanded to include gender and age-specific factors as phthalate metabolism can vary depending on these physiological conditions (Koch et al. 2005, Huang et al. 2014, Weng et al. 2017). Upon further improvements, the model may be used as an in silico tool for DEP and MEP tissue dosimetry prediction as well as traditional and new approach method-based risk assessment.
Supplementary Material
Highlights.
A human PBPK model of DEP and MEP was developed
The model comprises blood, gut, liver, fat, skin, gonad, and rest of body compartments
The model recapitulated urine MEP levels in humans exposed to DEP in indoor air
Skin can be a significant route of exposure to DEP in air absent adequate clothing
Bayesian MCMC simulations characterized the parameter uncertainty and variability
Acknowledgement
We would like to thank Dr. Annette Krais for providing the numerical values of urine MEP concentrations published in (Krais et al. 2018), and Dr. Wei-Chun Chou for his technical assistance with Bayesian modeling.
Funding
This research was supported in part by NIEHS HERCULES grant P30ES019776.
Footnotes
Publisher's Disclaimer: This is a PDF file of an unedited manuscript that has been accepted for publication. As a service to our customers we are providing this early version of the manuscript. The manuscript will undergo copyediting, typesetting, and review of the resulting proof before it is published in its final form. Please note that during the production process errors may be discovered which could affect the content, and all legal disclaimers that apply to the journal pertain.
Declaration of interests statement
The authors declare that they have no known competing financial interests or personal relationships that could have appeared to influence the work reported in this paper.
References
- Albro PW, Corbett JT, Schroeder JL, Jordan S and Matthews HB (1982). “Pharmacokinetics, interactions with macromolecules and species differences in metabolism of DEHP.” Environ Health Perspect 45: 19–25. [DOI] [PMC free article] [PubMed] [Google Scholar]
- Albro PW and Lavenhar SR (1989). “Metabolism of di(2-ethylhexyl)phthalate.” Drug Metab Rev 21(1): 13–34. [DOI] [PubMed] [Google Scholar]
- Andersen C, Krais AM, Eriksson AC, Jakobsson J, Löndahl J, Nielsen J, Lindh CH, Pagels J, Gudmundsson A and Wierzbicka A (2018). “Inhalation and Dermal Uptake of Particle and Gas-Phase Phthalates-A Human Exposure Study.” Environ Sci Technol 52(21): 12792–12800. [DOI] [PubMed] [Google Scholar]
- Api AM (2001). “Toxicological profile of diethyl phthalate: a vehicle for fragrance and cosmetic ingredients.” Food Chem Toxicol 39(2): 97–108. [DOI] [PubMed] [Google Scholar]
- Beydon D, Payan JP and Grandclaude MC (2010). “Comparison of percutaneous absorption and metabolism of di-n-butylphthalate in various species.” Toxicol In Vitro 24(1): 71–78. [DOI] [PubMed] [Google Scholar]
- Campbell JL Jr., Yoon M, Ward PL, Fromme H, Kessler W, Phillips MB, Anderson WA, Clewell HJ 3rd and Longnecker MP (2018). “Excretion of Di-2-ethylhexyl phthalate (DEHP) metabolites in urine is related to body mass index because of higher energy intake in the overweight and obese.” Environ Int 113: 91–99. [DOI] [PubMed] [Google Scholar]
- Chou WC and Lin Z (2019). “Bayesian evaluation of a physiologically based pharmacokinetic (PBPK) model for perfluorooctane sulfonate (PFOS) to characterize the interspecies uncertainty between mice, rats, monkeys, and humans: Development and performance verification.” Environ Int 129: 408–422. [DOI] [PubMed] [Google Scholar]
- Clewell RA, Kremer JJ, Williams CC, Campbell JL Jr., Andersen ME and Borghoff SJ (2008). “Tissue exposures to free and glucuronidated monobutylyphthalate in the pregnant and fetal rat following exposure to di-n-butylphthalate: evaluation with a PBPK model.” Toxicol Sci 103(2): 241–259. [DOI] [PubMed] [Google Scholar]
- Dodson RE, Nishioka M, Standley LJ, Perovich LJ, Brody JG and Rudel RA (2012). “Endocrine disruptors and asthma-associated chemicals in consumer products.” Environ Health Perspect 120(7): 935–943. [DOI] [PMC free article] [PubMed] [Google Scholar]
- Domínguez-Romero E and Scheringer M (2019). “A review of phthalate pharmacokinetics in human and rat: what factors drive phthalate distribution and partitioning?” Drug Metab Rev 51(3): 314–329. [DOI] [PubMed] [Google Scholar]
- Du Y, Guo N, Wang Y, Teng X, Hua X, Deng T, Yao Y, Yuan X and Li Y (2019). “Follicular fluid concentrations of phthalate metabolites are associated with altered intrafollicular reproductive hormones in women undergoing in vitro fertilization.” Fertil Steril 111(5): 953–961. [DOI] [PubMed] [Google Scholar]
- Frederiksen H, Skakkebaek NE and Andersson AM (2007). “Metabolism of phthalates in humans.” Mol Nutr Food Res 51(7): 899–911. [DOI] [PubMed] [Google Scholar]
- Fromme H, Lahrz T, Piloty M, Gebhart H, Oddoy A and Rüden H (2004). “Occurrence of phthalates and musk fragrances in indoor air and dust from apartments and kindergartens in Berlin (Germany).” Indoor Air 14(3): 188–195. [DOI] [PubMed] [Google Scholar]
- Gao DW and Wen ZD (2016). “Phthalate esters in the environment: A critical review of their occurrence, biodegradation, and removal during wastewater treatment processes.” Sci Total Environ 541: 986–1001. [DOI] [PubMed] [Google Scholar]
- Gentry PR, Clewell HJ 3rd, Clewell R, Campbell J, Van Landingham C and Shipp AM (2011). “Challenges in the application of quantitative approaches in risk assessment: a case study with di-(2-ethylhexyl)phthalate.” Crit Rev Toxicol 41 Suppl 2: 1–72. [DOI] [PubMed] [Google Scholar]
- Gong M, Zhang Y and Weschler CJ (2014). “Predicting dermal absorption of gas-phase chemicals: transient model development, evaluation, and application.” Indoor Air 24(3): 292–306. [DOI] [PubMed] [Google Scholar]
- Greenberg GN and Levine RJ (1989). “Urinary creatinine excretion is not stable: a new method for assessing urinary toxic substance concentrations.” J Occup Med 31(10): 832–838. [DOI] [PubMed] [Google Scholar]
- Hatch EE, Nelson JW, Stahlhut RW and Webster TF (2010). “Association of endocrine disruptors and obesity: perspectives from epidemiological studies.” Int J Androl 33(2): 324–332. [DOI] [PMC free article] [PubMed] [Google Scholar]
- Hopf NB, Berthet A, Vernez D, Langard E, Spring P and Gaudin R (2014). “Skin permeation and metabolism of di(2-ethylhexyl) phthalate (DEHP).” Toxicol Lett 224(1): 47–53. [DOI] [PubMed] [Google Scholar]
- Hu M, Zhang Y, Zhan M, He G, Qu W and Zhou Y (2022). “Physiologically-based toxicokinetic modeling of human dermal exposure to diethyl phthalate: Application to health risk assessment.” Chemosphere 307(Pt 2): 135931. [DOI] [PubMed] [Google Scholar]
- Huang T, Saxena AR, Isganaitis E and James-Todd T (2014). “Gender and racial/ethnic differences in the associations of urinary phthalate metabolites with markers of diabetes risk: National Health and Nutrition Examination Survey 2001–2008.” Environ Health 13(1): 6. [DOI] [PMC free article] [PubMed] [Google Scholar]
- Jaakkola JJ and Knight TL (2008). “The role of exposure to phthalates from polyvinyl chloride products in the development of asthma and allergies: a systematic review and meta-analysis.” Environ Health Perspect 116(7): 845–853. [DOI] [PMC free article] [PubMed] [Google Scholar]
- Janjua NR, Frederiksen H, Skakkebaek NE, Wulf HC and Andersson AM (2008). “Urinary excretion of phthalates and paraben after repeated whole-body topical application in humans.” Int J Androl 31(2): 118–130. [DOI] [PubMed] [Google Scholar]
- Janjua NR, Mortensen GK, Andersson A-M, Kongshoj B and Wulf HC (2007). “Systemic Uptake of Diethyl Phthalate, Dibutyl Phthalate, and Butyl Paraben Following Whole-Body Topical Application and Reproductive and Thyroid Hormone Levels in Humans.” Environmental Science & Technology 41(15): 5564–5570. [DOI] [PubMed] [Google Scholar]
- Jeong SH, Jang JH, Cho HY and Lee YB (2020). “Risk assessment for humans using physiologically based pharmacokinetic model of diethyl phthalate and its major metabolite, monoethyl phthalate.” Arch Toxicol 94(7): 2377–2400. [DOI] [PubMed] [Google Scholar]
- Kademoglou K, Giovanoulis G, Palm-Cousins A, Padilla-Sanchez JA, Magnér J, de Wit CA and Collins CD (2018). “In Vitro Inhalation Bioaccessibility of Phthalate Esters and Alternative Plasticizers Present in Indoor Dust Using Artificial Lung Fluids.” Environmental Science & Technology Letters 5(6): 329–334. [Google Scholar]
- Kamrin MA (2009). “Phthalate risks, phthalate regulation, and public health: a review.” J Toxicol Environ Health B Crit Rev 12(2): 157–174. [DOI] [PubMed] [Google Scholar]
- Kavlock R, Boekelheide K, Chapin R, Cunningham M, Faustman E, Foster P, Golub M, Henderson R, Hinberg I, Little R, Seed J, Shea K, Tabacova S, Tyl R, Williams P and Zacharewski T (2002). “NTP Center for the Evaluation of Risks to Human Reproduction: phthalates expert panel report on the reproductive and developmental toxicity of di-n-butyl phthalate.” Reprod Toxicol 16(5): 489–527. [DOI] [PubMed] [Google Scholar]
- Kay VR, Bloom MS and Foster WG (2014). “Reproductive and developmental effects of phthalate diesters in males.” Crit Rev Toxicol 44(6): 467–498. [DOI] [PubMed] [Google Scholar]
- Kayano Y, Watanabe K, Matsunaga T, Yamamoto I and Yoshimura H (1997). “Involvement of a Novel Mouse Hepatic Microsomal Esterase, ES46.5K, in the Hydrolysis of Phthalate Esters.” Biological & Pharmaceutical Bulletin 20(7): 749–751. [DOI] [PubMed] [Google Scholar]
- Keys DA, Wallace DG, Kepler TB and Conolly RB (1999). “Quantitative evaluation of alternative mechanisms of blood and testes disposition of di(2-ethylhexyl) phthalate and mono(2-ethylhexyl) phthalate in rats.” Toxicol Sci 49(2): 172–185. [DOI] [PubMed] [Google Scholar]
- Keys DA, Wallace DG, Kepler TB and Conolly RB (2000). “Quantitative evaluation of alternative mechanisms of blood disposition of di(n-butyl) phthalate and mono(n-butyl) phthalate in rats.” Toxicol Sci 53(2): 173–184. [DOI] [PubMed] [Google Scholar]
- Knudsen GA, Sanders JM and Birnbaum LS (2017). “Disposition of the emerging brominated flame retardant, bis(2-ethylhexyl) tetrabromophthalate, in female Sprague Dawley rats: effects of dose, route and repeated administration.” Xenobiotica 47(3): 245–254. [DOI] [PMC free article] [PubMed] [Google Scholar]
- Koch HM, Preuss R, Drexler H and Angerer J (2005). “Exposure of nursery school children and their parents and teachers to di-n-butylphthalate and butylbenzylphthalate.” Int Arch Occup Environ Health 78(3): 223–229. [DOI] [PubMed] [Google Scholar]
- Koch HM, Wittassek M, Brüning T, Angerer J and Heudorf U (2011). “Exposure to phthalates in 5–6 years old primary school starters in Germany—A human biomonitoring study and a cumulative risk assessment.” International Journal of Hygiene and Environmental Health 214(3): 188–195. [DOI] [PubMed] [Google Scholar]
- Krais AM, Andersen C, Eriksson AC, Johnsson E, Nielsen J, Pagels J, Gudmundsson A, Lindh CH and Wierzbicka A (2018). “Excretion of Urinary Metabolites of the Phthalate Esters DEP and DEHP in 16 Volunteers after Inhalation and Dermal Exposure.” Int J Environ Res Public Health 15(11). [DOI] [PMC free article] [PubMed] [Google Scholar]
- Lake BG, Phillips JC, Linnell JC and Gangolli SD (1977). “The in vitro hydrolysis of some phthalate diesters by hepatic and intestinal preparations from various species.” Toxicol Appl Pharmacol 39(2): 239–248. [DOI] [PubMed] [Google Scholar]
- Lovekamp-Swan T and Davis BJ (2003). “Mechanisms of phthalate ester toxicity in the female reproductive system.” Environ Health Perspect 111(2): 139–145. [DOI] [PMC free article] [PubMed] [Google Scholar]
- Machtinger R, Gaskins AJ, Racowsky C, Mansur A, Adir M, Baccarelli AA, Calafat AM and Hauser R (2018). “Urinary concentrations of biomarkers of phthalates and phthalate alternatives and IVF outcomes.” Environ Int 111: 23–31. [DOI] [PMC free article] [PubMed] [Google Scholar]
- Martino-Andrade AJ and Chahoud I (2010). “Reproductive toxicity of phthalate esters.” Molecular Nutrition & Food Research 54(1): 148–157. [DOI] [PubMed] [Google Scholar]
- Morrison GC, Weschler CJ, Bekö G, Koch HM, Salthammer T, Schripp T, Toftum J and Clausen G (2016). “Role of clothing in both accelerating and impeding dermal absorption of airborne SVOCs.” J Expo Sci Environ Epidemiol 26(1): 113–118. [DOI] [PubMed] [Google Scholar]
- Paleari L, Movedi E, Zoli M, Burato A, Cecconi I, Errahouly J, Pecollo E, Sorvillo C and Confalonieri R (2021). “Sensitivity analysis using Morris: Just screening or an effective ranking method?” Ecological Modelling 455: 109648. [Google Scholar]
- Payan JP, Marty JP, Fabry JP, Beydon D, Boudry I, Ferrari E, Canel F, Grandclaude MC and Vincent CM (2001). “In vivo and in vitro percutaneous absorption of [(14)C]di-N-butylphthalate in rat.” Drug Metab Dispos 29(6): 843–854. [PubMed] [Google Scholar]
- Radke EG, Glenn BS, Braun JM and Cooper GS (2019). “Phthalate exposure and female reproductive and developmental outcomes: a systematic review of the human epidemiological evidence.” Environment International 130: 104580. [DOI] [PMC free article] [PubMed] [Google Scholar]
- Rowland IR, Cottrell RC and Phillips JC (1977). “Hydrolysis of phthalate esters by the gastro-intestinal contents of the rat.” Food Cosmet Toxicol 15(1): 17–21. [DOI] [PubMed] [Google Scholar]
- Rudel RA, Camann DE, Spengler JD, Korn LR and Brody JG (2003). “Phthalates, Alkylphenols, Pesticides, Polybrominated Diphenyl Ethers, and Other Endocrine-Disrupting Compounds in Indoor Air and Dust.” Environmental Science & Technology 37(20): 4543–4553. [DOI] [PubMed] [Google Scholar]
- Sallsten G and Barregard L (2021). “Variability of Urinary Creatinine in Healthy Individuals.” Int J Environ Res Public Health 18(6). [DOI] [PMC free article] [PubMed] [Google Scholar]
- Scott RC, Dugard PH, Ramsey JD and Rhodes C (1987). “In vitro absorption of some o-phthalate diesters through human and rat skin.” Environ Health Perspect 74: 223–227. [DOI] [PMC free article] [PubMed] [Google Scholar]
- Sharma RP, Schuhmacher M and Kumar V (2018). “Development of a human physiologically based pharmacokinetic (PBPK) model for phthalate (DEHP) and its metabolites: A bottom up modeling approach.” Toxicol Lett 296: 152–162. [DOI] [PubMed] [Google Scholar]
- Silva MJ, Barr DB, Reidy JA, Kato K, Malek NA, Hodge CC, Hurtz D, Calafat AM, Needham LL and Brock JW (2003). “Glucuronidation patterns of common urinary and serum monoester phthalate metabolites.” Archives of Toxicology 77(10): 561–567. [DOI] [PubMed] [Google Scholar]
- Svensson K, Hernández-Ramírez RU, Burguete-García A, Cebrián ME, Calafat AM, Needham LL, Claudio L and López-Carrillo L (2011). “Phthalate exposure associated with self-reported diabetes among Mexican women.” Environ Res 111(6): 792–796. [DOI] [PMC free article] [PubMed] [Google Scholar]
- Ventrice P, Ventrice D, Russo E and De Sarro G (2013). “Phthalates: European regulation, chemistry, pharmacokinetic and related toxicity.” Environ Toxicol Pharmacol 36(1): 88–96. [DOI] [PubMed] [Google Scholar]
- Weaver JA, Beverly BEJ, Keshava N, Mudipalli A, Arzuaga X, Cai C, Hotchkiss AK, Makris SL and Yost EE (2020). “Hazards of diethyl phthalate (DEP) exposure: A systematic review of animal toxicology studies.” Environ Int 145: 105848. [DOI] [PMC free article] [PubMed] [Google Scholar]
- Weng TI, Chen MH, Lien GW, Chen PS, Lin JC, Fang CC and Chen PC (2017). “Effects of Gender on the Association of Urinary Phthalate Metabolites with Thyroid Hormones in Children: A Prospective Cohort Study in Taiwan.” Int J Environ Res Public Health 14(2). [DOI] [PMC free article] [PubMed] [Google Scholar]
- Wensing M, Uhde E and Salthammer T (2005). “Plastics additives in the indoor environment--flame retardants and plasticizers.” Sci Total Environ 339(1–3): 19–40. [DOI] [PubMed] [Google Scholar]
- Weschler CJ, Bekö G, Koch HM, Salthammer T, Schripp T, Toftum J and Clausen G (2015). “Transdermal Uptake of Diethyl Phthalate and Di(n-butyl) Phthalate Directly from Air: Experimental Verification.” Environ Health Perspect 123(10): 928–934. [DOI] [PMC free article] [PubMed] [Google Scholar]
- Weschler CJ and Nazaroff WW (2008). “Semivolatile organic compounds in indoor environments.” Atmospheric Environment 42(40): 9018–9040. [Google Scholar]
- Weschler CJ and Nazaroff WW (2014). “Dermal Uptake of Organic Vapors Commonly Found in Indoor Air.” Environmental Science & Technology 48(2): 1230–1237. [DOI] [PubMed] [Google Scholar]
- Wormuth M, Scheringer M, Vollenweider M and Hungerbühler K (2006). “What Are the Sources of Exposure to Eight Frequently Used Phthalic Acid Esters in Europeans?” Risk Analysis 26(3): 803–824. [DOI] [PubMed] [Google Scholar]
- Wu LJ, Teng XM, Yao YC, Liu C, Du YY, Deng TR, Yuan XQ, Zeng Q, Li YF and Guo N (2020). “Maternal preconception phthalate metabolite concentrations in follicular fluid and neonatal birth weight conceived by women undergoing in vitro fertilization.” Environ Pollut 267: 115584. [DOI] [PubMed] [Google Scholar]
- Wu Y, Song Z, Little JC, Zhong M, Li H and Xu Y (2021). “An integrated exposure and pharmacokinetic modeling framework for assessing population-scale risks of phthalates and their substitutes.” Environ Int 156: 106748. [DOI] [PubMed] [Google Scholar]
- Xie X, Wang Z, Zhou X, Wang X and Chen X (2011). “Study on the interaction of phthalate esters to human serum albumin by steady-state and time-resolved fluorescence and circular dichroism spectroscopy.” J Hazard Mater 192(3): 1291–1298. [DOI] [PubMed] [Google Scholar]
- Yuan XQ, Du YY, Liu C, Guo N, Teng XM, Hua X, Yao YC, Deng YL, Zeng Q, Deng TR and Li YF (2020). “Phthalate metabolites and biomarkers of oxidative stress in the follicular fluid of women undergoing in vitro fertilization.” Sci Total Environ 738: 139834. [DOI] [PubMed] [Google Scholar]
- Yue Y, Liu J, Liu R, Sun Y, Li X and Fan J (2014). “The binding affinity of phthalate plasticizers-protein revealed by spectroscopic techniques and molecular modeling.” Food and Chemical Toxicology 71: 244–253. [DOI] [PubMed] [Google Scholar]
- Zota AR, Calafat AM and Woodruff TJ (2014). “Temporal trends in phthalate exposures: findings from the National Health and Nutrition Examination Survey, 2001–2010.” Environ Health Perspect 122(3): 235–241. [DOI] [PMC free article] [PubMed] [Google Scholar]
Associated Data
This section collects any data citations, data availability statements, or supplementary materials included in this article.