

Abstract
Organophosphate ester flame retardants and plasticizers (OPEs) are common exposures in modern built environments. Toxicological models report that some OPEs reduce dopamine and serotonin in the brain. Deficiencies in these neurotransmitters are associated with anxiety and depression. We hypothesized that exposure to higher concentrations of OPEs in house dust would be associated with a greater risk of depression and stress in mothers across the prenatal and postpartum periods.
We conducted a nested prospective cohort study using data collected on mothers (n=718) in the CHILD Cohort Study, a longitudinal multi-city Canadian birth cohort (2008-2012). OPEs were measured in house dust sampled at 3-4 months postpartum. Maternal depression and stress were measured at 18 and 36 weeks gestation and 6 months and 1 year postpartum using the Centre for Epidemiologic Studies for Depression Scale (CES-D) and Perceived Stress Scale (PSS). We used linear mixed models to examine the association between a summed Z-Score OPE index and continuous depression and stress scores. In adjusted models, one standard deviation increase in the OPE Z-score index was associated with a 0.07-point (95% CI: 0.01, 0.13) increase in PSS score. OPEs were not associated with log-transformed CES-D (β: 0.63%, 95% CI: −0.18%, 1.46%). The effect of OPEs on PSS score was strongest at 36 weeks gestation and weakest at 1 year postpartum.
We observed small increases in maternal perceived stress levels, but not depression, with increasing OPEs measured in house dust during the prenatal and early postpartum period in this cohort of Canadian women. Given the prevalence of prenatal and postpartum anxiety and the ubiquity of OPE exposures, additional research is warranted to understand if these chemicals affect maternal mental health.
Keywords: OPE, OPFR, pregnancy, maternal exposure, depression, stress
1. Introduction
Flame retardant chemicals have been incorporated into construction materials and consumer products since the 1960s to meet fire safety standards.1 Currently, organophosphate ester flame retardants (OPEs) are the prominent chemical class in use.2 OPEs are also used as plasticizers in floor polishes, coatings, thermoplastics, and epoxy resins. OPEs are detected in outdoor and indoor air, dust, drinking water, sediment, and biota.1 They are also found in baby products,3,4 furniture,5 electronics,6 nail polish,7 construction materials,8 textiles, and numerous other products. Flame retardants and plasticizers are typically added after polymerization and are not chemically bound to a product. Therefore, they migrate from the polymer to which they are added to enter air and then can sorb to particulate matter and house dust.9–12 Subsequently, OPEs are commonly measured in house dust samples. Exposure assessment studies report weak to moderate positive correlations between specific OPE compounds measured in house dust and metabolites in urine, including some of the more abundant OPEs like tris(1,3-dichloro-2-propyl) phosphate (TDCPP) and triphenyl phosphate (TPHP).13–16
Humans are exposed to OPEs through inhalation, ingestion of dust, and dermal absorption.17–20 OPEs are ubiquitously detected in biomarkers in studies conducted in China,21 Japan, the Philippines, Vietnam,22 Sweden23, Canada,24 and the United States. Biomonitoring data in the United States shows that over 80% of the general population have at least four OPE metabolites in their urine.25 The level of some OPEs appear to be increasing over time.26 A meta-analysis of studies that measured urinary metabolites bis(1,3-dichloro-2-propyl) phosphate (BDCIPP) and diphenyl phosphate (DPHP) found that BDCIPP concentrations measured in 2014-2015 were over 15 times greater than concentrations measured in 2002-2003.26 Yet little is known about whether these exposures impact human health and wellbeing.
Because of their structural similarity to organophosphate pesticides, OPEs are hypothesized to target the nervous system.27,28 OPE neurotoxicity has been evaluated in vitro29 and in zebrafish,12,30–35 mice,36 and nematode models.37 In vitro analysis using PC12 cells showed OPEs with aromatic and chlorinated alkyl groups significantly inhibited O-linked N-acetylglucosamine transferase (OGT).29 OGT helps maintain the health of neuronal cells, and its absence is associated with neurodegenerative diseases like Alzheimer’s Disease. A study using neonatal mice found that TDCPP exerted dose-dependent apoptotic and pro-inflammatory effects in the hippocampus after exposure via oral gavage.36 Results from follow-up in vitro analysis using harvested murine microglia suggested neuronal damage occurred by microglia-mediated inflammation. A study in male mice also found exposure to TPHP can initiate inflammation in the brain.38 A study using zebrafish demonstrated that TDCPP dampened dopamine signaling pathways in larvae.32 Another study in zebrafish showed no impacts in the larval stage, but noted significant reductions in dopamine and serotonin levels in the brain tissue of adult females following chronic embryonic exposure.34 Deficiencies or excess reuptake of dopamine and serotonin in the human brain are associated with neurodegenerative diseases like Parkinson’s disease and common mental health disorders such as anxiety and depression.39 Some zebrafish models show no association between OPE exposure and altered acetylcholinesterase activity,33 which is widely recognized as the mechanism of action for organophosphate pesticides. However, recent evidence suggests certain OPEs like TPHP may be strong acetylcholinesterase inhibitors.35 Mechanisms of action appear to vary by compound, but experimental studies indicate that some OPEs (e.g. tri(2-chloroethyl)phosphate [TCEP], tris(2-chloroisopropyl) phosphate [TCiPP], TDCPP,40 and perhaps TPHP) are neurotoxic.
Observational studies support an association between some OPEs and neurotoxicity in children.41–46 While epidemiological studies have focused on characterizing the risk posed by early life exposure to OPEs on children’s health, reproductively active women may also be vulnerable to OPE-related neurotoxicity. In the peripartum period, women experience marked and abrupt anatomical, physiological, and lifestyle changes, including alternations in hormone signaling and brain composition.47,48 A study found first-time mothers (n=9 by natural conception and 16 by fertility treatment) experienced gray matter volume reductions in the cerebral cortex, which persisted for at least two years postpartum.48 Fathers and nulliparous control groups did not demonstrate these changes. These changes suggest a biologically-based neural pruning or adaptation process in preparation for motherhood. Other brain changes observed during pregnancy in toxicological models include enlargement of the pituitary gland, decreased dendritic length and complexity of CA1/CA3 pyramidal neurons in the hippocampus, increased spines density on CA1 pyramidal neurons, and fluctuations in cell proliferation in the subventricular zone.47 While adaptations during pregnancy and the postpartum period are normal, disruptions or stressors can lead to pathologies like preeclampsia and depression.47 For example, 10-15% of new mothers experience postpartum depression (PPD)49 and 15-20% experience postpartum anxiety (PPA).50 PPD and PPA make parenthood and life more challenging for mothers and can also disrupt bonding between mother and child.51–53 For instance, mothers who experience PPD or PPA may not initiate or may terminate breastfeeding earlier.54 Chronic PPD or PPA can also negatively impact child development.55,56
It is important to improve our understanding of modifiable factors that contribute to PPD and PPA. Our primary objective was to investigate the hypothesis that OPE exposures are associated with maternal mental health. We tested this hypothesis with the CHILD Cohort Study. CHILD is a prospective, longitudinal, multi-city birth cohort consisting of women recruited during pregnancy from the general Canadian population.57 The CHILD Cohort Study measured OPEs in house dust at 3-4 months postpartum and had repeated measures of maternal depression and stress. We hypothesized that mothers living in homes with higher concentrations of OPEs in house dust would exhibit higher depression and stress levels across prenatal and postpartum time periods, after adjusting for confounders.
2. Materials and Methods
2.1. Study Design and Participants
We conducted a nested prospective cohort study design using data collected during the prenatal and postnatal periods in the CHILD Cohort Study (2008-2012) to examine the association between OPE concentrations in dust and maternal stress (proxy for anxiety) and depression. The CHILD Cohort Study was originally designed to examine determinants of child asthma and allergies.57 As described previously,58 the CHILD Cohort Study recruited adult pregnant women who were in their second trimester from health centers located across Canada (e.g. Edmonton, Toronto, Winnipeg, Morden-Winkler, and Vancouver). Among other eligibility criteria, mothers had to be able to communicate in English, and their infant had to be born at 35 weeks gestation or later. Assessment of participants occurred at regular intervals between 18 weeks gestation and 5 years of age. These assessments included detailed questionnaires about health, the home environment, collection of biological and environmental samples, and clinical assessments of the mother and child.57 This study utilizes maternal data collected at four time points (e.g. 18- and 36 weeks gestation and 6 months, and 1 year) and OPE data measured in dust collected at 3-4 months postpartum.
Participants were considered for inclusion in this nested case-cohort study, which was initially focused on phthalate exposures, if the child was genotyped as part of a related study and if the child was clinically assessed at age 5.59 Additionally, participants needed to have house dust collected (>12.5 milligrams for each room) and multiple aliquots available for analysis. There were 2,319 participants meeting these criteria (out of n=3,628). From this eligible subgroup, a random sample of 436 children were selected and then further augmented with all remaining eligible children with asthma or recurrent wheeze, leading to a total of 726 children. Finally, 8 participants were subsequently excluded due to issues analyzing OPEs in their dust samples. Thus, our analysis comprised 718 participants with OPEs measured in their house dust. The characteristics of this sub-sample were similar to those in the full cohort, although missingness in the sub-sample was generally lower than in the full cohort (see Table S1). For instance, the mean maternal age was 31.8 (σ=4.7) in the full cohort and 32.1 (σ=4.6) in our sample. Sixty-eight percent of participants in the full cohort identified as White compared to 74% in our sample. Eighty-seven percent reported being married or in a common law partnership in the full cohort compared to 93% in our sample. Forty-one percent in the full cohort reported an annual household income greater than $100,000, and 46% reported this income level in the sub-sample. Other covariates showed even narrower differences (i.e. depression status, depression medication use, and prenatal smoking status). According to our inclusion criteria, all 718 participants had mental health outcome data available for at least one of our four timepoints.
2.2. House Dust Collection and OPE Analysis
Dust samples were collected in participants’ homes when the children were 3-4 months of age. A depyrogenated aluminum nozzle with two nylon mesh thimbles was affixed to a standardized vacuum cleaner and used to collect samples from the child’s sleeping area and the most used living area. In the sleeping area, dust was pulled from the mattress sheet or cover on which the child slept and an adjacent 2m2 area of carpeted flooring or the whole floor if uncarpeted. A similar approach was taken in the living area without sampling bedding. If there was no or little carpet, the whole floor of the room was vacuumed until a sufficient sample was collected. Quality control samples were also obtained during data collection by placing 100 mg of NIST standard reference material for vacuum dust (SRM 2585) into a thimble and taken to the homes in a closed bottle. The bottle was then opened in the homes while preparing the vacuum heads and placing the thimbles for dust sample collection in the vacuum head. Once sample and data collection were completed, sample thimbles and NIST controls were stored in depyrogenated glass bottles at room temperature for two weeks maximum before shipment to a processing lab. Large particles (e.g., food crumbs, rocks) were manually removed at the lab before weighing and size fractionating by shaking through a US Standard 100 mesh sieve. The remaining fine dust (<150 μm) was re-weighed, divided into 50 mg aliquots, and stored at −80°C. Samples for sleeping area and living area were processed separately. Additional details about dust collection methods are provided elsewhere.59
For laboratory analysis, equal aliquots from the child’s sleeping area and living area dust samples were combined and homogenized. Subsamples of 25 mg were extracted with dichloromethane and analyzed for 29 OPEs using gas-chromatography mass spectrometry.60 Target OPEs for this analysis are listed in Table S2. Twenty-five of the 29 targeted OPEs were detected in any of the samples. Some of the most frequently detected were tris(2-butoxyethyl) phosphate (TBOEP), tris(2-chloro-isopropyl) phosphate (TCiPP) and its isomer bis(2-chloro-1-methylethyl) (2-cholorpropyl) phosphate (TCPP2), tris(2-chloroethyl) phosphate (TCEP), triphenyl phosphate (TPHP), and 2-ethylhexyl diphenyl phosphate (EHDPP).60 CHILD implemented a 60% detection frequency cutoff, so 14 of 29 OPEs were available for our analysis.60 NIST control samples (SRM 2585) were analyzed at 1 of every 25 house dust samples (n=36), and laboratory blanks with precleaned sodium sulfate were analyzed at 1 of every 10 house dust samples (n=90). Blank and recovery corrections were not applied as all blanks were below detection limits and OPE recoveries were sufficient (71-116%). OPEs below the detection limit were imputed with web application NDExpo (http://www.expostats.ca).61 OPE limits of detection can be found in Table S3.
To account for different OPE concentration ranges in the dust, we calculated Z-scores for each compound. We subtracted the mean concentration for the jth compound from the ith participant’s concentration and divided by the standard deviation of the jth compound. We then summed Z-scores from all compounds for participant i to create a total OPE Z-score (ΣOPE), which we used as our primary exposure index (Equation 1). The sum score index method for OPEs is common practice in epidemiological literature41,42,45 and is used as a means to capture the full scope of OPE exposures while evidence of compound-specific toxicity builds.
| Equation 1. |
Where i=1…N participants
x=OPE concentration (ng/g)
j=1…14 OPE compounds
2.3. Depression and Stress Scores
We used the Perceived Stress Scale (PSS) to quantify maternal stress. It is a 10-item questionnaire with 5-point Likert type scales (score range: 0-40). Chronic stress can contribute to the development or increase of anxiety.62 PSS is a classic measure for assessing stress as distinct from depression and shows good reliability (mean α of 0.85 from 3 samples).63 We treated PSS scores as a continuous outcome in our primary models. However, because scores of 27 or above are considered “high stress” and scores below 27 considered “low to moderate stress,” we also treated PSS as a binary outcome in supplemental models and in Table 1. While these categories are described with the PSS,64 we are not aware of a clinically relevant validated cut-off score for PSS. We used the Centre for Epidemiologic Studies for Depression Scale (CES-D) to quantify maternal depression. CES-D is a depression screening tool with 20 questionnaire items and 4-point Likert type scales (score range: 0-60).65 It also has good internal consistency at a Cronbach’s α of 0.85.66 Like PSS, we treated this as a continuous outcome in our primary models. However, respondents may be referred for depression treatment at scores of 16 or above, so we also treated this as a binary outcome in supplemental models and Table 1.67
Table 1.
Characteristics of mothers from CHILD cohort included in this study at baseline (18 weeks gestation, n=673) stratified by Centre for Epidemiologic Studies for Depression Scale scores (clinically relevant score of ≥16 or not clinically relevant at <16) and Perceived Stress Scale scores (high stress score of ≥27 or low to moderate stress score of <27).
| Not clinically relevant CES-D score (n=555) | Clinically relevant CES-D score (n=118) | P-valuesa | Low to Moderate PSS score (n=656) | High PSS score (n=17) | P-valuesa | |
|---|---|---|---|---|---|---|
| Study Center | ||||||
| Edmonton | 96 (17.3%) | 15 (12.7%) | 0.014* | 110 (16.8%) | 1 (5.9%) | 0.42 |
| Toronto | 156 (28.1%) | 37 (31.4%) | 188 (28.7%) | 5 (29.4%) | ||
| Vancouver | 148 (26.7%) | 19 (16.1%) | 164 (25.0%) | 3 (17.6%) | ||
| Winnipeg/Morten-Winkler | 155 (27.9%) | 47 (39.8%) | 194 (29.6%) | 8 (47.1%) | ||
| Age | ||||||
| Mean ± SD | 32.5 ± 4.3 | 31.1 ± 5.6 | 0.020* | 32.3 ± 4.50 | 30.7 ± 5.82 | 0.35 |
| Median [Min, Max] | 33.0 [19.0, 44.0] | 32.0 [19.0, 42.0] | 32.0 [19.0, 44.0] | 31.0 [20.0, 40.0] | ||
| Ethnicity | ||||||
| White | 423 (76.2%) | 79 (66.9%) | 0.0028** | 495 (75.5%) | 7 (41.2%) | 0.0030** |
| Asian | 78 (14.1%) | 14 (11.9%) | 88 (13.4%) | 4 (23.5%) | ||
| Mixed or Other | 52 (9.4%) | 25 (21.2%) | 71 (10.8%) | 6 (35.3%) | ||
| Missing | 2 (0.4%) | 0 (0%) | 2 (0.3%) | 0 (0%) | ||
| Parity | ||||||
| Parous | 235 (42.3%) | 60 (50.8%) | 0.10† | 288 (43.9%) | 7 (41.2%) | 1 |
| Nulliparous | 299 (53.9%) | 53 (44.9%) | 344 (52.4%) | 8 (47.1%) | ||
| Missing | 21 (3.8%) | 5 (4.2%) | 24 (3.7%) | 2 (11.8%) | ||
| Mode of Delivery | ||||||
| Caesarean | 142 (25.6%) | 34 (28.8%) | 0.42 | 169 (25.8%) | 7 (41.2%) | 0.17 |
| Vaginal | 405 (73.0%) | 81 (68.6%) | 476 (72.6%) | 10 (58.8%) | ||
| Missing | 8 (1.4%) | 3 (2.5%) | 11 (1.7%) | 0 (0%) | ||
| Marital Status | ||||||
| Single, divorced, or separated | 21 (3.8%) | 17 (14.4%) | <0.01** | 33 (5.0%) | 5 (29.4%) | 0.0012** |
| Married or common law | 533 (96.0%) | 100 (84.7%) | 622 (94.8%) | 11 (64.7%) | ||
| Missing | 1 (0.2%) | 1 (0.8%) | 1 (0.2%) | 1 (5.9%) | ||
| Household Income (CAN $) | ||||||
| <$30,000 | 18 (3.2%) | 14 (11.9%) | <0.01** | 28 (4.3%) | 4 (23.5%) | 0.0026** |
| $30,000-59,999 | 57 (10.3%) | 24 (20.3%) | 78 (11.9%) | 3 (17.6%) | ||
| $60,000-99,999 | 155 (27.9%) | 31 (26.3%) | 182 (27.7%) | 4 (23.5%) | ||
| $100,000+ | 280 (50.5%) | 36 (30.5%) | 313 (47.7%) | 3 (17.6%) | ||
| Missing | 45 (8.1%) | 13 (11.0%) | 55 (8.4%) | 3 (17.6%) | ||
| Education Level | ||||||
| High school or below | 26 (4.7%) | 19 (16.1%) | <0.01** | 41 (6.3%) | 4 (23.5%) | 0.0068** |
| Some college or university | 70 (12.6%) | 27 (22.9%) | 92 (14.0%) | 5 (29.4%) | ||
| Completed college or university | 320 (57.7%) | 49 (41.5%) | 364 (55.5%) | 5 (29.4%) | ||
| Masters degree or PhD | 116 (20.9%) | 19 (16.1%) | 133 (20.3%) | 2 (11.8%) | ||
| Missing | 23 (4.1%) | 4 (3.4%) | 26 (4.0%) | 1 (5.9%) | ||
| Self-reported depression | ||||||
| Currently | 16 (2.9%) | 16 (13.6%) | <0.01** | 31 (4.7%) | 1 (5.9%) | 0.044* |
| In the past | 93 (16.8%) | 40 (33.9%) | 126 (19.2%) | 7 (41.2%) | ||
| Never | 446 (80.4%) | 61 (51.7%) | 499 (76.1%) | 8 (47.1%) | ||
| Missing | 0 (0%) | 1 (0.8%) | 0 (0%) | 1 (5.9%) | ||
| Depression medication use | ||||||
| No | 537 (96.8%) | 109 (92.4%) | 0.061† | 630 (96.0%) | 16 (94.1%) | 1 |
| Yes | 17 (3.1%) | 8 (6.8%) | 25 (3.8%) | 0 (0%) | ||
| Missing | 1 (0.2%) | 1 (0.8%) | 1 (0.2%) | 1 (5.9%) | ||
| Prenatal smoking status | ||||||
| Daily or occasionally | 15 (2.7%) | 10 (8.5%) | 0.0057** | 23 (3.5%) | 2 (11.8%) | 0.11 |
| Not at all | 519 (93.5%) | 103 (87.3%) | 609 (92.8%) | 13 (76.5%) | ||
| Missing | 21 (3.8%) | 5 (4.2%) | 24 (3.7%) | 2 (11.8%) | ||
| Average annual ambient NO2 (ppb) | ||||||
| Mean ± SD | 14.0 ± 4.7 | 13.5 ± 5.1 | 0.21 | 13.9 ± 4.74 | 14.6 ± 5.50 | 0.78 |
| Median [Min, Max] | 14.5 [3.6, 30.2] | 13.1 [3.9, 32.0] | 14.2 [3.60, 32.0] | 14.1 [6.10, 29.5] | ||
| Missing | 44 (7.9%) | 6 (5.1%) | 49 (7.5%) | 1 (5.9%) | ||
| Average annual 8-hour ambient O3 (ppb) | ||||||
| Mean ± SD | 31.3 ± 4.8 | 32.2 ± 4.9 | 0.18 | 31.4 ± 4.85 | 32.2 ± 3.87 | 0.85 |
| Median [Min, Max] | 32.1 [18.3, 45.8] | 32.2 [20.4, 52.0] | 32.2 [18.3, 52.0] | 31.7 [21.8, 37.6] | ||
| Missing | 44 (7.9%) | 6 (5.1%) | 49 (7.5%) | 1 (5.9%) | ||
| Average annual ambient PM2.5 (ppb) | ||||||
| Mean ± SD | 7.31 ± 1.8 | 7.61 ± 1.8 | 0.15 | 7.36 ± 1.78 | 7.45 ± 1.53 | 0.66 |
| Median [Min, Max] | 7.30 [3.7, 15.1] | 7.40 [4.5, 15.2] | 7.30 [3.70, 15.2] | 7.75 [5.30, 10.0] | ||
| Missing | 54 (9.7%) | 15 (12.7%) | 68 (10.4%) | 1 (5.9%) | ||
| Season of Dust Collection | ||||||
| Fall | 131 (23.6%) | 34 (28.8%) | 0.50 | 159 (24.2%) | 6 (35.3%) | 0.77 |
| Spring | 146 (26.3%) | 29 (24.6%) | 171 (26.1%) | 4 (23.5%) | ||
| Summer | 142 (25.6%) | 24 (20.3%) | 163 (24.8%) | 3 (17.6%) | ||
| Winter | 133 (24.0%) | 30 (25.4%) | 159 (24.2%) | 4 (23.5%) | ||
| Missing | 3 (0.5%) | 1 (0.8%) | 4 (0.6%) | 0 (0%) | ||
| Total OPEs (ng/g) | ||||||
| Mean ± SD | 90,000 ± 40,900 | 99,100 ± 58,000 | 0.27 | 91,100 ± 43,900 | 111,000 ± 59,400 | 0.17 |
| Median [Min, Max] | 79,800 [14,500, 342,000] | 83,000 [17,700, 356,000] | 80,100 [14,500, 356,000] | 93,200 [43,100, 251,000] | ||
| ΣOPE Z-Scores | ||||||
| Mean ± SD | −0.233 ± 5.46 | 0.708 ± 7.63 | 0.25 | −0.0676 ± 5.95 | −0.0857 ± 3.71 | 0.44 |
| Median [Min, Max] | −1.43 [−8.71, 29.9] | −0.730 [−8.11, 42.9] | −1.38 [−8.71, 42.9] | −0.456 [−5.17, 10.5] |
p≤0.10,
p≤0.05,
p≤0.01
P-values for distribution difference by clinically relevant CES-D or high PSS score calculated with Fisher’s Exact Test for categorical variables and Wilcoxon Rank-Sum Test for numeric variables. When more than two leading zeroes to the right of the decimal place, we used the “<0.01” placeholder.
CES-D and PSS scores were assessed at 18- and 36 weeks gestation and 6 months, 1 year, and 5 years postpartum. Because the 5-year timepoint was farthest from dust collection (3-4 months postpartum) and missing data were greater than at other timepoints (>20% missingness for most variables), we chose to exclude this timepoint from our analysis. Only participants with OPE data and CES-D and PSS data available at one or more of the four timepoints were included in our analyses.
2.4. Covariates
We chose to take an a priori variable selection approach, where potential covariates were considered based on their known contributions to OPE exposure and mental health outcomes.25,41,45,49,68,69 We also examined the collinearity between variables to finalize which would be included in our adjusted models. Our final adjusted models included: Study Center (Edmonton, Toronto, Vancouver, Winnipeg/Morten-Winkler), maternal age (years), ethnicity (White, Asian, Mixed or Other), marital status (Married or common law marriage; Single, divorced, separated, or widowed), annual household income in Canadian dollars (<$30,000, $30,000-59,999, 60,000-99,999, $100,000+), self-reported depression medication use (Yes, No), prenatal smoking status (“Daily or occasionally”, “Not at all”), average annual ambient NO2 (ppb), average annual 8-hour ambient O3 (ppb), average annual ambient PM2.5 (ppb), and season of dust collection (Winter, Spring, Summer, Fall). Data collected on ethnicity included non-exclusive self-report options for First Nations, Southeast Asian, East Asian, South Asian, Black, Middle Eastern, Hispanic, Caucasian White, Other, and Unknown. However, small counts necessitated collapsing this information into broader categories: “White”, “Asian”, and “Mixed or Other.” While these aggregated categories were not ideal, we chose to include ethnicity as a covariate to evaluate any unmeasured consequences of racism on OPE exposures and maternal mental health. We also considered self-reported depression status (“Currently”, “In the past”, “Never”) and maternal education level (High school or below, Some college or university, Completed college or university, Masters degree or PhD). However, we did not include it in our final models due to high collinearity with other variables. We additionally considered mode of delivery (Vaginal, Caesarean) and parity (Parous, Nulliparous) but did not include them as covariates in final models as they were less important in the literature and were not significantly associated with our outcomes of interest (see Table 1).
We included ambient pollution measures to account for potential unmeasured confounding related to the communal built environment. Ambient pollutant variables were acquired from the Canadian Urban Environmental Health Research Consortium based on postal code mappings of participant residences. PM2.5 was available as an annual average at 3-months postpartum. We collapsed NO2 and O3 from monthly averages into annual averages using data between 6 months prenatal and 6 months postpartum, centering as closely to the 3-month dust collection as possible. Monthly averages of the highest rolling 8-hour daily average were used to calculate the annual average for O3, because the available overall monthly and annual averages showed high missingness in comparison (>40%).
2.5. Missing Data
Overall, 57.1% of participants had complete data across all four timepoints. At baseline (18 weeks gestation), 77.4% of the 718 included participants had complete data. Later timepoints had 67.8% (36 weeks gestation), 63.6% (6 months postpartum), and 70.2% (1 year postpartum) of participants with complete data. Over these consecutive timepoints, 93.4%, 94.2%, 82.7%, and 86.1% had outcome data available. Missing data were imputed for all included covariates using multivariate imputation by chained equations (mice package in R).70 We followed recommended protocols in the literature for this imputation method.71–73 OPEs were converted to Z-scores prior to imputation. CES-D scores were natural log-transformed prior to imputation for the CES-D models as described in the next section. All variables considered for modeling inclusion (all OPE Z-scores, CES-D score, PSS score, Study Center, age, ethnicity, marital status, maternal education, annual household income, depression status, depression medication use, prenatal smoking status, average annual O3, average annual NO2, and average annual PM2.5, season of dust collection, as well as mode of delivery [Vaginal, Caesarean] and parity [Parous, Nulliparous]), were used in the multiple imputation process to minimize bias and maximize plausibility of the Missing at Random assumption.73 Plausibility of imputations were checked by comparing plot densities between the observed and the imputed values of all variables. We also conducted sensitivity analyses using a complete non-imputed dataset for the overall mixed models.
2.6. Statistical Methods
We conducted analyses in R Statistical Software.70 Descriptive statistics were calculated for all variables. To evaluate differences in covariate distributions by CES-D (“clinically relevant” versus “not clinically relevant”) and PSS (“high stress” versus “low to moderate stress”), we used the Fisher’s Exact test for categorical variables and the Wilcoxon Rank-Sum test for numeric variables. We also calculated intraclass correlation coefficients (ICCs) to assess intra-individual reliability over time for CES-D and PSS. We examined Spearman rank correlations between individual OPEs. We used an α threshold of 0.05 for significance tests.
We used linear mixed modeling with random intercepts, random slopes, and an unstructured covariance matrix (nlme package) to assess the association between continuous PSS score and ΣOPE and continuous CES-D and ΣOPE.70,74 Using raw CES-D scores led to linear mixed models results that did not meet the assumptions of linear regression. Therefore, we natural log-transformed these scores, which improved model diagnostics. Random intercepts were maternal ID, and random slopes were time of assessment (18 weeks gestation, 36 weeks gestation, 6 months postpartum, and 1 year postpartum). Five imputation iterations were included in our mixed models when pooling model estimates according to Rubin’s rules.73 We used Akaike information criterion (AIC) scores to select the best imputed model. Finally, we constructed equivalent mixed models for each individual OPE compound Z-score instead of the summative Z-score. We also ran multiple regression models for each timepoint (18 weeks, 36 weeks, 6 months, 1 year). All models included covariates that were selected a priori as described above and utilized the Z-score approach for the OPE exposure. Logistic mixed modeling techniques with random intercepts for participants were used for the supplemental models.
For our sensitivity analysis using non-imputed data, we included participants with complete data only (n=591). In another sensitivity analysis, we considered effect modification between the ΣOPE Z-score and the categorical timepoint variable on CES-D and PSS scores. We also conducted separate sensitivity analyses where we removed participants who reported smoking at the 18 weeks gestation timepoint, participants who reported depression medication at any timepoint, participants who reported moving to a new residence at any point between pregnancy and 1 year postpartum, and participants who were outliers for ΣOPEs. As a conservative measure, participants missing data for these specific variables were removed, as well. We conducted these sensitivity analyses because these factors could potentially bias the relationship between maternal outcomes and OPE exposures.
2.7. Institutional Review Board
This analysis study was approved by Oregon State University’s Institutional Review Board (IRB-2021-1250). Ethics approvals for CHILD were obtained from research ethics boards at each health center and approval for analyses was obtained from the University of Toronto Health Sciences Research Ethics Board (No. 36169).
3. Results
A description of selected maternal characteristics at baseline (n=673) are presented in Table 1, although the total number of mothers observed over the time series was 718. Variable distributions were similar between observed and imputed datasets (Figure S1). Mean age at the time of the child’s birth was 32.1 ± 4.6 years. Most women were recruited in Winnipeg and Morten-Winkler (29.5%) with others were recruited in Toronto (27.3%), Vancouver (23.8%), and Edmonton (19.4%). The majority of women identified as “Caucasian White” (74.4%), while others identified with Asian subgroups (13.9%) and mixed or other ethnicities (11.1%). This sample had a relatively high socioeconomic status with 47% of the women reporting an annual household income of $100,000 or more at baseline. Only 4.8% had income at baseline <$30,000. At 1 year postpartum, the percentage of participants reporting the highest income bracket decreased to 43.4%. Most participants were married or had a common law marriage at baseline (94.1%) and this proportion increased to 95.8% at 1 year postpartum. Categories and associations with binary outcome variables are shown in Table 1.
The prevalence of depression changed over time. At baseline, 4.8% of the women reported depression, while 2.9% reported depression during pregnancy, and 8.9% reported depression at 1 year postpartum. Among those with current or past depression, 15.7% used depression medication at baseline and 19.0% used depression medication “during pregnancy.” At 1 year postpartum, 67.2% of those with depression used medication. For a summary of depression and depression medication use over time in this study, see Table S4. The mean CES-D scores ranged from 8.3 ± 7.9 (6 months postpartum) to 9.5 ± 7.2 (36 weeks gestation) (Figure S2). The ICC for continuous CES-D was 0.60. Stress (PSS) scores had approximately normal distributions over time with mean scores ranging from 12.0 ± 6.1 (6 months postpartum) to 13.2 ± 6.1 (18 weeks gestation) (Figure S2). The ICC for PSS was 0.55. There were significant differences in both PSS and CES-D scores between timepoints (Kruskal-Wallis Rank Sum Test: p-valueCES-D=<0.001; p-valuePSS=0.005). For a summary of the outcome variables over time in this study, see Table S5.
Mean concentrations of the 14 OPEs in house dust are shown in Table 2. Geometric means were highly variable by compound, ranging from 80.8 ng/g ± 592 for Bis(4-tert-butylphenyl) phenyl phosphate (B4TBPPP) to 48,600 ng/g ± 36,600 for TBOEP. Total OPEs (summed concentrations) had a geometric mean of 84,500 ± 45,500 ng/g. The compounds used in the same commercial formulations were highly correlated (σSpearman > 0.50) (Figure 1 and Table S6). For instance, isopropylated and butylated phenyl phosphates are components of Firemaster 550 and 600, respectively.75
Table 2.
Descriptive statistics of organophosphate flame retardants (ng/g) measured in house dust at 3 months postpartum in the CHILD cohort (n=718) in order of descending geometric mean concentration. The ΣOPE is a summation of all compounds measured in a participant’s house dust sample. See Table S2 for a key to full compound names and Table S3 for the limit of detection for each compound.
| Abbreviation | CAS Number | Geometric mean | Arithmetic mean | Standard Deviation | Median | Minimum | Maximum | Percent Below LOD |
|---|---|---|---|---|---|---|---|---|
| Total OPEs | - | 84500 | 92600 | 45500 | 81000 | 14500 | 356000 | - |
| TBOEP | 78-51-3 | 48600 | 55700 | 36600 | 45500 | 11400 | 301000 | 1.5 |
| TCiPP | 13674-84-5 | 6080 | 9320 | 10600 | 6000 | 385 | 83100 | 2.4 |
| TCEP | 115-96-8 | 5150 | 7430 | 7630 | 5120 | 375 | 81200 | 1.4 |
| TPHP | 115-86-6 | 4540 | 6790 | 7620 | 4420 | 306 | 66900 | 0.7 |
| TCPP2 | 76025-08-6 | 3650 | 5460 | 5930 | 3910 | 242 | 49800 | 19.4 |
| EHDPP | 1241-94-7 | 1570 | 2150 | 2480 | 1620 | 157 | 26300 | 0.6 |
| 2iPPDPP | 64532-94-1 | 1100 | 2010 | 3600 | 1060 | 52.5 | 32500 | 8.5 |
| 4IPPDPP | 55864-04-5 | 461 | 901 | 1870 | 464 | 19.7 | 20400 | 7.0 |
| 4TBPDPP | 981-40-8 | 424 | 713 | 1180 | 432 | 23.4 | 13100 | 8.4 |
| B2IPPPP | 69500-29-4 | 368 | 653 | 1180 | 393 | 17.7 | 12800 | 15.6 |
| 24DIPPDP | 96107-55-0 | 157 | 495 | 1360 | 191 | 1.9 | 15100 | 34.8 |
| TmCP | 563-04-2 | 144 | 563 | 981 | 142 | 0.6 | 7430 | 25.1 |
| TNBP | 126-73-8 | 84.7 | 212 | 511 | 88.6 | 1.6 | 7680 | 19.8 |
| B4TBPPP | 115-87-7 | 80.8 | 233 | 592 | 88.2 | 1 | 7910 | 39.0 |
Figure 1.
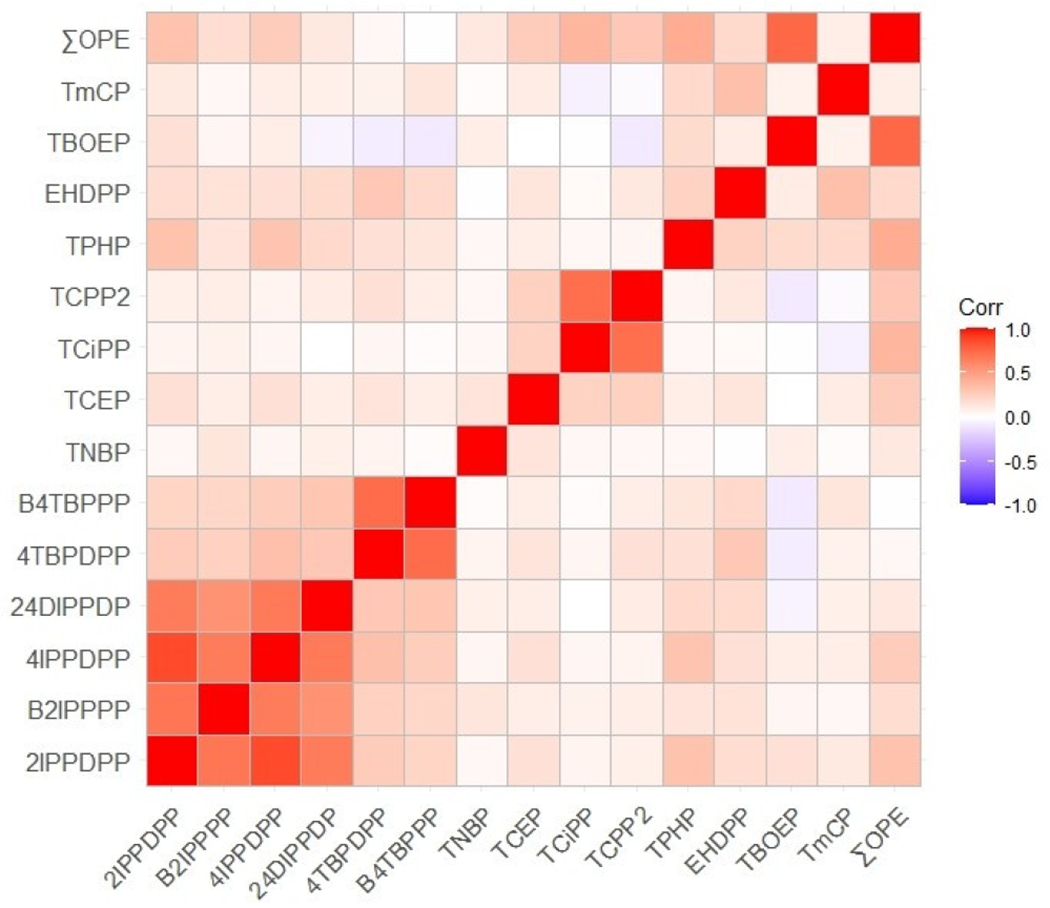
Spearman correlation coefficients heat map describing the relationship between individual organophosphate esters compounds (OPEs). See Table 2 and Table S2 for key to compound acronyms and full names, respectively.
The unadjusted and adjusted associations between the ΣOPE index and continuous PSS and CES-D scores were evaluated in linear mixed effect models (Table 3). Note that because we used a Z-score index, these model estimates correspond to a standard deviation increase in ΣOPE. We observed a small yet statistically significant association between ΣOPE and maternal PSS score. A one standard deviation increase in ΣOPE was associated with a 0.07-point (95% CI: 0.01, 0.13, p=0.02) increase in PSS score, after adjusting for covariates. The association between ΣOPE and maternal CES-D score was positive but not statistically significant (β: 0.63%, 95% CI: −0.18%, 1.46%, p=0.13). Since CES-D scores were natural log-transformed, coefficient estimates should be interpreted as a percent change in the outcome. Reported coefficients in this study have already been converted by exponentiating the raw model coefficient, subtracting one, and multiplying by 100. Linear mixed model diagnostic plots are shown in Figure S3. Results without using multiple imputation were slightly stronger than results with imputation (Table S7). For instance, estimates from the non-imputed adjusted PSS model were as follows: β=0.08, 95% CI: 0.02, 0.15, p=0.02.
Table 3.
Mixed model linear regression coefficient estimates and 95% confidence intervals for Perceived Stress Scale score and Centre for Epidemiologic Studies for Depression Scale score given organophosphate ester flame retardant and plasticizers compound summed Z-scores in household dust at about 3 months postpartum. Crude and adjusted model results provided. Random intercepts are maternal ID and random slopes were time of assessment (n=718). CES-D scores were natural log-transformed, so coefficient estimates for CES-D models should be interpreted as a percent change in the outcome.
| Compound | PSS Crude βa |
PSS Adjusted βa,b |
Ln(CES-D) Crude βa |
Ln(CES-D) Adjusted βa,b |
|---|---|---|---|---|
|
| ||||
| 2IPPDPP | 0.42 (0.04, 0.79)* | 0.40 (0.04, 0.76)* | 3.99 (−0.96, 9.19) | 4.21 (−0.60, 9.26)† |
| B2IPPPP | 0.35 (−0.03, 0.72)† | 0.26 (−0.10, 0.63) | 2.90 (−2.04, 8.09) | 2.11 (−2.66, 7.12) |
| 4IPPDPP | 0.38 (0.00, 0.75)* | 0.34 (−0.02, 0.70)† | 3.34 (−1.60, 8.53) | 3.25 (−1.54, 8.27) |
| 24DIPPDP | 0.42 (0.04, 0.79)* | 0.34 (−0.02, 0.70)† | 4.45 (−0.54, 9.69) | 3.96 (−0.88, 9.04) |
| 4TBPDPP | 0.01 (−0.37, 0.38) | 0.06 (−0.30, 0.42) | −3.60 (−8.12, 1.15) | −3.02 (−7.43, 1.60) |
| B4TBPPP | 0.11 (−0.27, 0.48) | 0.15 (−0.20, 0.51) | −2.62 (−7.19, 2.18) | −1.99 (−6.44, 2.68) |
| TNBP | −0.04 (−0.41, 0.34) | −0.11 (−0.49, 0.25) | 4.03 (−0.86, 9.16) | 1.79 (−2.97, 6.78) |
| TCEP | 0.03 (−0.35, 0.41) | 0.11 (−0.26, 0.48) | 2.25 (−2.59, 7.33) | 2.68 (−2.08, 7.68)c |
| TCiPP | 0.12 (−0.26, 0.50) | 0.11 (−0.27, 0.48) | 2.44 (−2.46, 7.59) | 1.54 (−3.25, 6.55) |
| TCPP2 | 0.15 (−0.23, 0.53) | 0.15 (−0.22, 0.52) | 0.07 (−4.72, 5.11) | −0.61 (−5.29, 4.31) |
| TPHP | 0.31 (−0.07, 0.69) | 0.28 (−0.09, 0.65) | 5.12 (0.08, 10.41)* | 4.56 (−0.33, 9.68)† |
| EHDPP | −0.01 (−0.39, 0.37) | 0.06 (−0.31, 0.42) | 0.55 (−4.24, 5.58) | 1.09 (−3.57, 5.97) |
| TBOEP | 0.37 (0.00, 0.75)† | 0.24 (−0.13, 0.61) | 5.10 (0.09, 10.36)* | 3.23 (−1.62, 8.31) |
| TmCP | −0.01 (−0.39, 0.37) | 0.06 (−0.31, 0.42) | −0.82 (−5.50, 4.08) | −0.22 (−4.81, 4.59) |
| ΣOPEs | 0.08 (0.01, 0.14)* | 0.07 (0.01, 0.13)* | 0.77 (−0.07, 1.61)† | 0.63 (−0.18, 1.46) |
p≤0.10,
p≤0.05
adjusted for timepoint
adjusted for Study Center, maternal age, annual household income, ethnicity, marital status, prenatal smoking, depression medication use, season of dust collection, annual average PM2.5, annual average NO2, and annual 8-hour averaged O3 (ppb).
ambient pollutant variables (PM2.5, NO2, and O3) removed from covariate list to allow convergence
We also modeled timepoint-specific effects (Table 4). The impact of ΣOPEs on PSS score in our adjusted models was strongest at 36 weeks gestation, exerting a 0.09-point (95% CI: 0.01, 0.17, p=0.032) increase. The association between ΣOPE and PSS score was weakest and non-significant at 1 year postpartum (β: 0.04, 95% CI: −0.05, 0.13, p=0.37). Associations between ΣOPE and CES-D across timepoints showed similar trends, with the strongest associations at 18 and 36 weeks gestation and attenuation following in the postpartum period. Figure 2 shows the modeled linear trends for ΣOPE and PSS score by timepoint. Logistic mixed effect model results are presented in the supplemental materials (Table S8). Forest plots of the adjusted odds ratios (Figures S4 and S5), model diagnostic plots (Figures S6 and S7), results without multiple imputation (Table S9), and logistic timepoint-specific effects (Table S10) are available, as well.
Table 4.
Mixed model linear regression coefficient estimates and 95% confidence intervals for Perceived Stress Scale score and Centre for Epidemiologic Studies for Depression Scale score given organophosphate ester flame retardant and plasticizers compound summed Z-scores in household dust at about 3 months postpartum. Adjusted model results provided at individual timepoints and in the full mixed model. Random intercepts are maternal ID and random slopes were time of assessment in the mixed models. CES-D scores were natural log-transformed. CES-D scores were natural log-transformed, so coefficient estimates for CES-D models should be interpreted as a percent change in the outcome.
| 18 weeks gestation (Model 1) n=673 | 36 weeks gestation (Model 2) n=676 | 6 mths postpartum (Model 3) n=594 | 1 year postpartum (Model 4) n=618 | Mixed Effects Model (Primary Model)b n=718 | |
|---|---|---|---|---|---|
|
| |||||
| PSSa | |||||
|
| |||||
| 2IPPDPP | 0.35 (−0.09, 0.79) | 0.58 (0.10, 1.05)* | 0.30 (−0.16, 0.75) | 0.22 (−0.28, 0.73) | 0.40 (0.04, 0.76)* |
| B2IPPPP | 0.16 (−0.28, 0.61) | 0.32 (−0.19, 0.84) | 0.29 (−0.16, 0.74) | 0.09 (−0.41, 0.59) | 0.26 (−0.10, 0.63) |
| 4IPPDPP | 0.27 (−0.17, 0.70) | 0.40 (−0.10, 0.89) | 0.38 (−0.06, 0.83)† | 0.18 (−0.31, 0.68) | 0.34 (−0.02, 0.70)† |
| 24DIPPDP | 0.26 (−0.18, 0.70) | 0.32 (−0.18, 0.82) | 0.37 (−0.08, 0.81) | 0.35 (−0.16, 0.86) | 0.34 (−0.02, 0.70)† |
| 4TBPDPP | 0.06 (−0.37, 0.51) | 0.06 (−0.38, 0.50) | 0.04 (−0.41, 0.50) | −0.22 (−0.71, 0.29) | 0.06 (−0.30, 0.42) |
| B4TBPPP | 0.18 (−0.26, 0.61) | 0.10 (−0.34, 0.54) | 0.18 (−0.27, 0.63) | −0.04 (−0.53, 0.45) | 0.15 (−0.20, 0.51) |
| TNBP | −0.29 (−0.76, 0.17) | −0.03 (−0.48, 0.43) | 0.02 (−0.43, 0.48) | −0.20 (−0.86, 0.47) | −0.11 (−0.49, 0.25) |
| TCEP | 0.06 (−0.39, 0.51) | 0.19 (−0.28, 0.65) | 0.00 (−0.52, 0.52) | 0.11 (−0.41, 0.63) | 0.11 (−0.26, 0.48) |
| TCPP | 0.15 (−0.33, 0.63) | 0.06 (−0.41, 0.52) | −0.09 (−0.60, 0.42) | 0.31 (−0.22, 0.84) | 0.11 (−0.27, 0.48) |
| TCPP2 | 0.04 (−0.43, 0.51) | 0.07 (−0.41, 0.55) | 0.14 (−0.35, 0.64) | 0.42 (−0.11, 0.94) | 0.15 (−0.22, 0.52) |
| TPHP | 0.34 (−0.12, 0.79) | 0.45 (−0.03, 0.93)† | 0.32 (−0.15, 0.78) | −0.25 (−0.82, 0.33) | 0.28 (−0.09, 0.65) |
| EHDPP | 0.11 (−0.33, 0.55) | −0.02 (−0.49, 0.45) | −0.07 (−0.61, 0.46) | 0.36 (−0.17, 0.90) | 0.06 (−0.31, 0.42) |
| TBOEP | 0.21 (−0.26, 0.68) | 0.32 (−0.16, 0.80) | 0.38 (−0.09, 0.85) | 0.04 (−0.50, 0.57) | 0.24 (−0.13, 0.61) |
| TmCP | 0.15 (−0.30, 0.60) | 0.23 (−0.22, 0.67) | −0.21 (−0.70, 0.28) | −0.11 (−0.63, 0.40) | 0.06 (−0.31, 0.42) |
| ΣOPEs | 0.06 (−0.02, 0.14) | 0.09 (0.01, 0.17)* | 0.06 (−0.02, 0.14) | 0.04 (−0.05, 0.13) | 0.07 (0.01, 0.13)* |
|
| |||||
| Ln(CES-D)a | |||||
|
| |||||
| 2IPPDPP | 4.70 (−0.96, 10.68) | 4.19 (−1.38, 10.08) | 1.71 (−4.90, 8.78) | 3.39 (−3.62, 10.90) | 4.21 (−0.60, 9.26)† |
| B2IPPPP | 2.16 (−3.41, 8.04) | 2.32 (−3.53, 8.51) | −0.32 (−6.67, 6.47) | 3.31 (−3.65, 10.77) | 2.11 (−2.66, 7.12) |
| 4IPPDPP | 3.85 (−1.74, 9.76) | 2.80 (−2.90, 8.83) | 2.26 (−4.26, 9.22) | 2.68 (−4.21, 10.06) | 3.25 (−1.54, 8.27) |
| 24DIPPDP | 5.31 (−0.37, 11.33)† | 3.76 (−2.04, 9.91) | 1.20 (−5.23, 8.06) | 3.36 (−3.76, 11.02) | 3.96 (−0.88, 9.04) |
| 4TBPDPP | −0.17 (−5.57, 5.54) | −4.54 (−9.23, 0.39)† | −5.41 (−11.50, 1.11)† | −5.75 (−12.10, 1.05)† | −3.02 (−7.43, 1.60) |
| B4TBPPP | 0.12 (−5.28, 5.83) | −3.60 (−8.33, 1.38) | −1.89 (−8.22, 4.87) | −4.79 (−11.07, 1.93) | −1.99 (−6.44, 2.68) |
| TNBP | 0.91 (−4.87, 7.05) | 1.92 (−3.24, 7.37) | 2.43 (−4.17, 9.48) | 7.04 (−2.32, 17.29) | 1.79 (−2.97, 6.78) |
| TCEP | 2.02 (−3.63, 8.00) | 3.17 (−2.15, 8.78) | −3.34 (−10.43, 4.31) | 0.63 (−6.40, 8.19) | 2.68 (−2.08, 7.68)c |
| TCPP | −1.12 (−6.95, 5.06) | 4.53 (−0.91, 10.26)† | −0.86 (−7.99, 6.83) | −3.45 (−10.26, 3.88) | 1.54 (−3.25, 6.55) |
| TCPP2 | −2.93 (−8.53, 3.03) | 0.13 (−5.22, 5.78) | −0.52 (−7.41, 6.90) | −1.14 (−8.11, 6.35) | −0.61 (−5.29, 4.31) |
| TPHP | 6.61 (0.65, 12.93)* | 5.90 (0.27, 11.86)* | −0.50 (−7.07, 6.54) | −4.40 (−11.78, 3.60) | 4.56 (−0.33, 9.68)† |
| EHDPP | 0.56 (−4.89, 6.32) | 1.06 (−4.26, 6.67) | −1.85 (−9.29, 6.20) | 6.67 (−0.95, 14.87)† | 1.09 (−3.57, 5.97) |
| TBOEP | 3.35 (−2.62, 9.69) | 3.42 (−2.18, 9.33) | 3.83 (−3.10, 11.26) | 0.52 (−6.69, 8.29) | 3.23 (−1.62, 8.31) |
| TmCP | −1.04 (−6.55, 4.79) | 0.03 (−4.95, 5.28) | 0.61 (−6.40, 8.14) | 1.74 (−5.29, 9.30) | −0.22 (−4.81, 4.59) |
| ΣOPEs | 0.71 (−0.26, 1.69) | 0.69 (−0.27, 1.66) | −0.05 (−1.22, 1.13) | 0.19 (−1.05, 1.44) | 0.63 (−0.18, 1.46) |
p≤0.10,
p≤0.05
adjusted for Study Center, maternal age, annual household income, race, marital status, prenatal smoking, depression medication use, season of dust collection, annual average PM2.5, annual average NO2, and annual 8-hour averaged O3 (ppb).
additionally adjusted for timepoint
ambient pollutant variables (PM2.5, NO2, and O3) removed from covariate list to allow convergence
Figure 2.
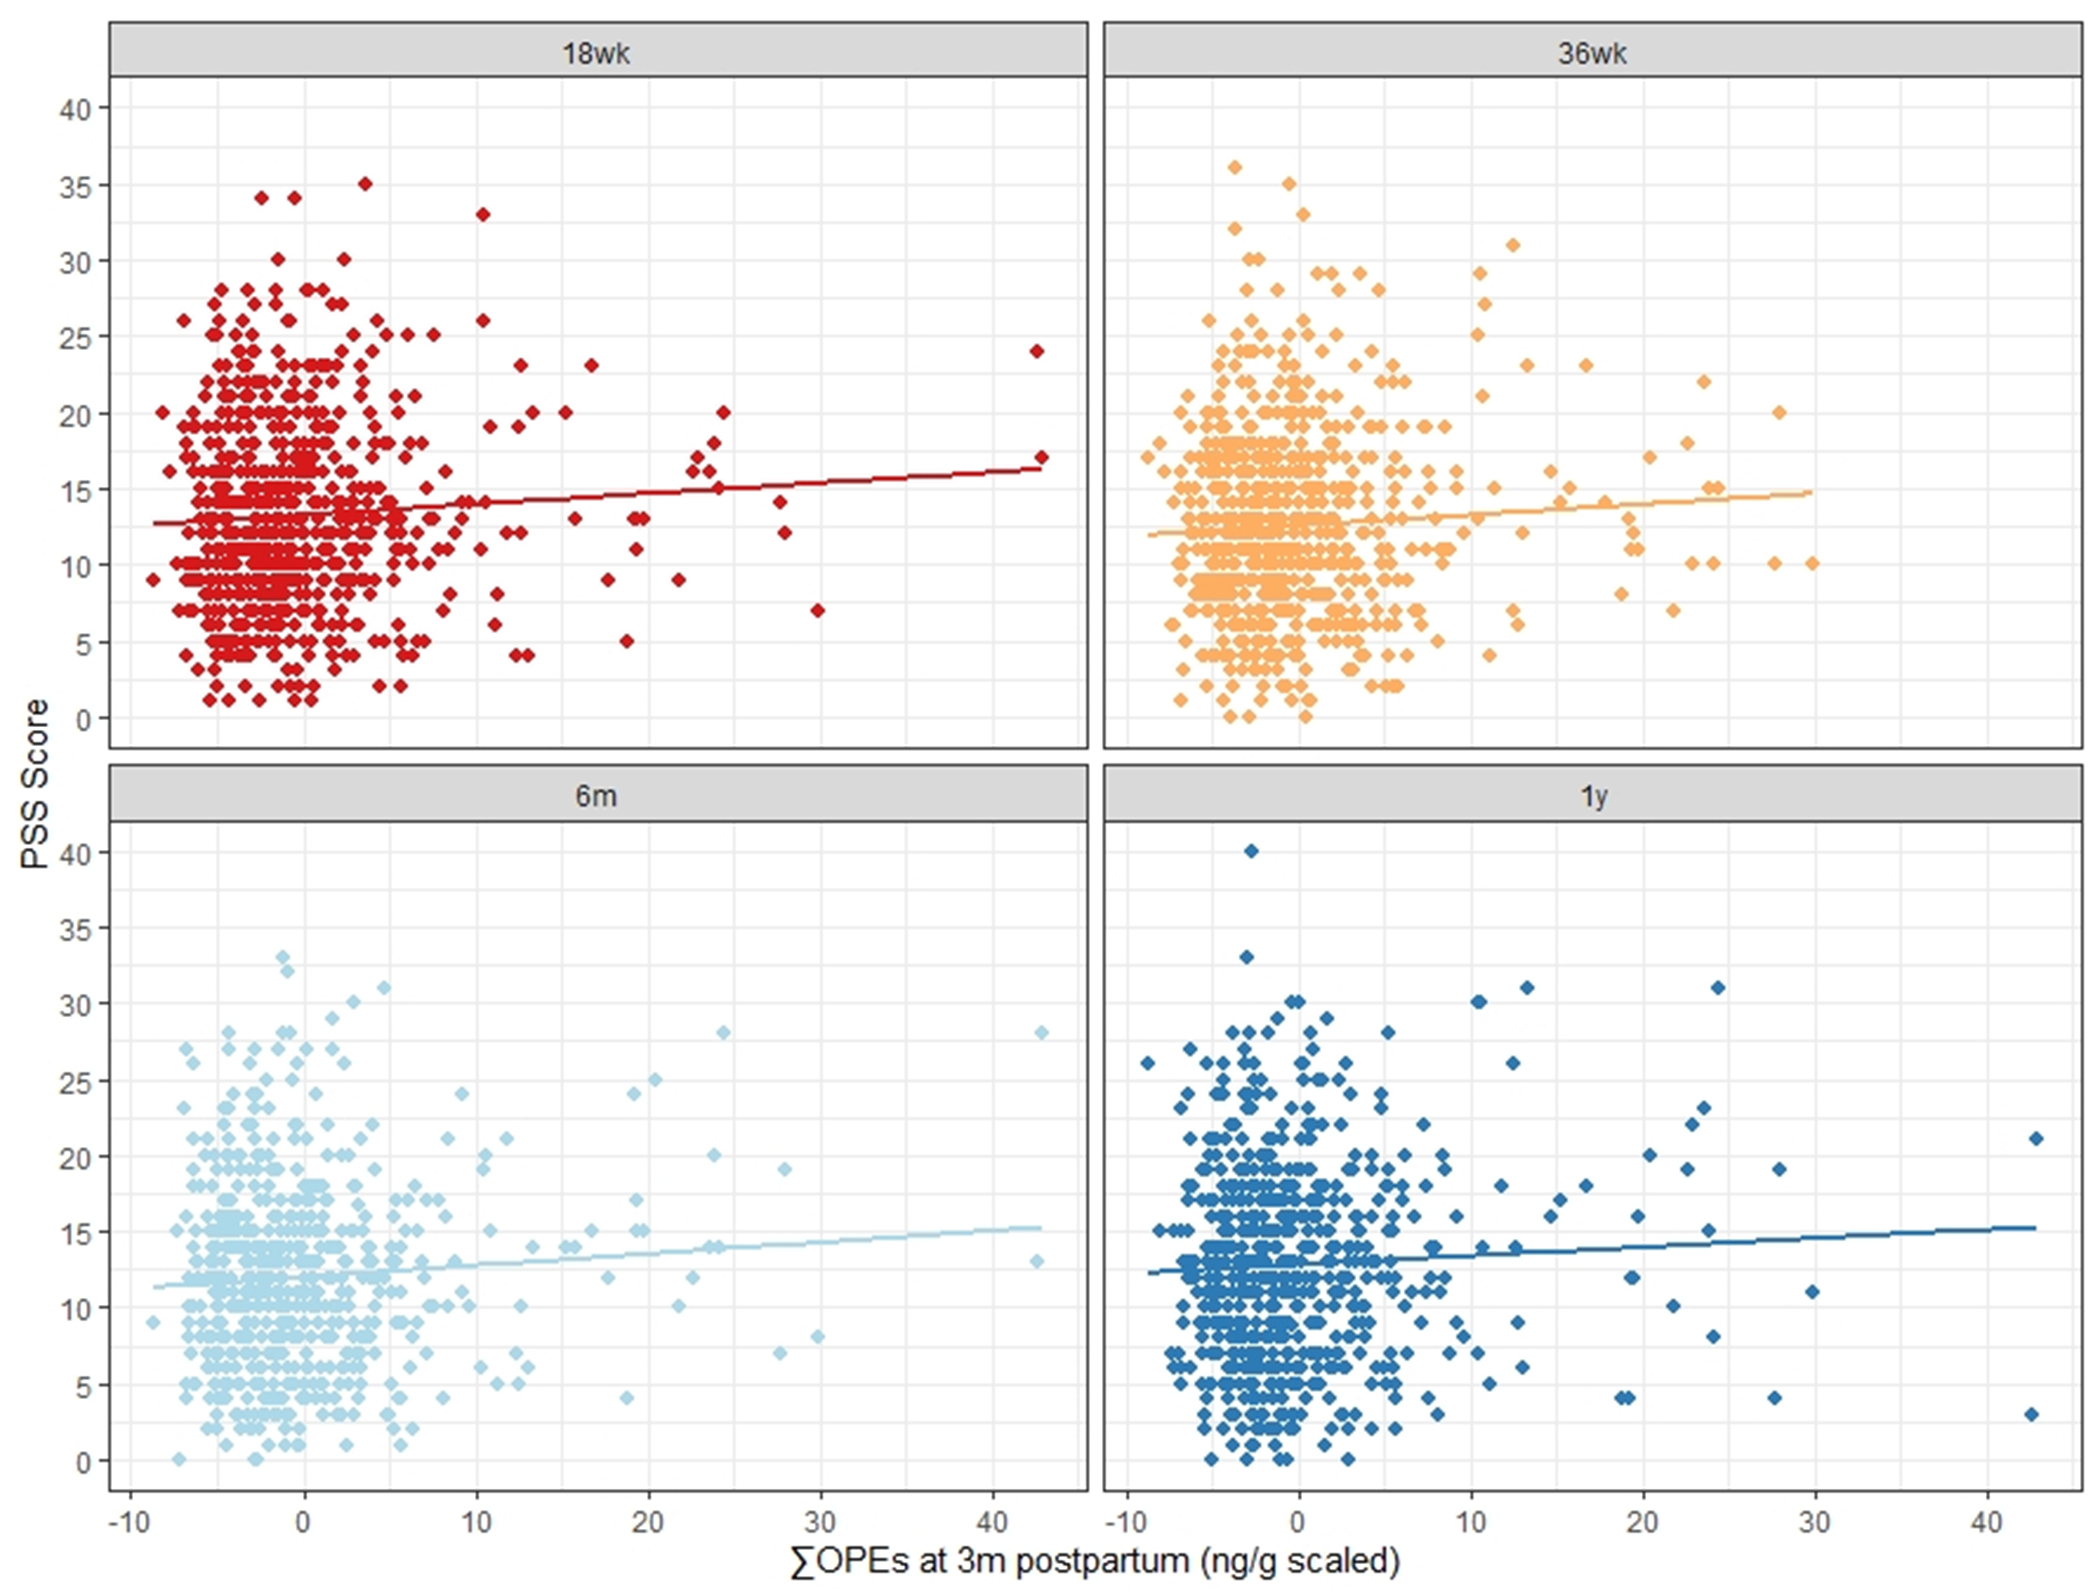
Modeled linear associations between summed organophosphate ester compound (OPE) Z-scores measured in house dust at 3 months postpartum and maternal Perceived Stress Scale scores at four timepoints, including two observed during pregnancy (18 and 36 weeks gestation) and two in the postpartum period (6 month and 1 year). Slopes adjusted for study center, maternal age, annual household income, ethnicity, marital status, prenatal smoking, depression medication use, season of dust collection, annual average PM2.5, annual average NO2, and annual 8-hour averaged O3 (ppb).
In addition, we examined associations between individual OPE compounds, PSS, and CES-D (Table 4). 2-Isopropylphenyl diphenyl phosphate (2IPPDPP) was significantly associated with PSS in a linear mixed effect model, after adjusting for covariates (β=0.40, 95% CI: 0.04, 0.76, p=0.03). Two of the other four isopropylated compounds, 4-Isopropylphenyl diphenyl phosphate (4IPPDPP) and 2,4-Diisopropylphenyl diphenyl phosphate (24DIPPDP), had similar effect sizes to 2IPPDPP and were statistically significant in the crude mixed models (β4IPPDPP =0.38, 95% CI: 0.00, 0.75, p=0.05; (βDIPPDP =0.42, 95% CI: 0.04, 0.79, p=0.03), but results attenuated after adjustment. TPHP and TBOEP were significantly associated with CES-D in crude models (βTPHP=5.12%, 95% CI: 0.08%, 10.41%, p=0.05; (βTBOEP=5.10%, 95% CI: 0.09%, 10.36%, p=0.05), but again, results attenuated after adjustment. No OPE compounds were significantly associated with CES-D in linear mixed models after adjusting for covariates. 2IPPDPP, 4IPPDPP, 24DIPPDP, and TPHP are all compounds used in the commercial mixture Firemaster 550.75
Timepoint-specific adjusted analyses are also shown in Table 4 (see Table S10 for logistic model timepoint-specific results). 2IPPDPP was significantly associated with both continuous PSS and high stress at 36 weeks gestation (β=0.58, 95% CI: 0.10, 1.05, p=0.02; OR=1.46, 95% CI: 1.03, 2.07, p= 0.04) and in the adjusted linear mixed model as described above. TBOEP, 4IPPDPP, TCEP, 4-tert-Butylphenyl diphenyl phosphate [4TBPDPP], B4TBPPP, and Bis(2-chloro-1-methylethyl) (2-cholorpropyl) phosphate [TCPP2] were all associated with a high stress score at varying timepoints (Table S10), but not with continuous PSS. 4TBPDPP and B4TBPPP are both compounds used in Firemaster 600.75 TPHP, which is a compound in Firemaster 600 as well as Firemaster 550,75 was significantly associated with continuous CES-D at 18 and 36 weeks gestation (β18weeks=6.61, 95% CI: 0.65, 12.93, p=0.03; β36weeks=5.90, 95% CI: 0.27, 11.86, p=0.04). It was also significantly associated with binary CES-D at 18 weeks gestation. We did not detect any other significant relationships between specific OPEs and PSS or CES-D at the four timepoints. These differences could support compound-specific toxicity, but as noted above, some isomers (e.g., isopropylated and butylated triphenyl phosphates) were highly correlated and are used in the same formulations (Table S6), making it difficult to assess their independent effects. The above-described compounds also tended to have stronger correlations with ΣOPE than other compounds (ρSpearman=0.27-0.75).
Sensitivity analyses results are available in Table S11. Incorporating an interaction term between ΣOPE and categorical timepoint into the models strengthened estimates for CES-D. Results for PSS were very similar to the primary model. However, the interaction term was non-significant in all considered mixed models (continuous PSS, continuous CES-D, binary PSS, binary CES-D). Removing those who reported smoking at 18 weeks gestation or who were missing for this variable (n=63) slightly strengthened results compared to the primary models. Removing depression medication users or those missing for this variable (n=155) also slightly strengthened results for the PSS model but attenuated results for the CES-D model. Removing those who moved residences sometime between pregnancy and 1 year postpartum or who were missing for this variable (n=252) slightly attenuated results compared to the primary models, but this may have been due to reduced power since 35% of the sample was excluded. Lastly, removing two individuals with the highest ΣOPE levels (30% higher than next highest individual) slightly attenuated the crude primary model results for continuous PSS and CES-D and the adjusted CES-D model, but had negligible impacts on the PSS adjusted mixed model. Divergence from the primary model results was minor in these sensitivity analyses, so they did not necessitate major changes in the interpretation of our overall findings.
4. Discussion
Our results support the hypothesis that exposure to organophosphate ester flame retardants and plasticizers in house dust was associated with a small increase in maternal stress during the prenatal and postpartum periods. This effect appeared to be strongest immediately preceding birth (36 weeks gestation) and attenuated in the postpartum period. While associations between OPEs and depression were not statistically significant, the trends in our models suggest that higher OPE exposure may be related to a small increase in depression score, although it is possible this was due to chance.
It is biologically plausible that OPEs can influence the central nervous system and mental health given their structural similarity to neurotoxic organophosphate pesticides.28 Epidemiological studies show that acute high-intensity and low-level chronic exposures to organophosphate pesticides among agricultural workers are related to greater odds of depression and other psychiatric disorders like anxiety and suicide risk.76–80 The literature on OPEs is less developed but growing. As previously discussed, animal models demonstrate compounds like TDCPP and TPHP can dampen dopamine and serotonin levels and initiate inflammation in the brain.32,34,36,38 Deficiencies in these neurotransmitters are associated with anxiety and depression in humans.39 There is mounting evidence of OPE effects on children’s neurocognitive health,41–46 yet the effects of OPEs on maternal mental health have been overlooked. Two in 10 mothers suffer from postpartum depression or anxiety,49,50 potentially crippling conditions with long-term impacts on mother and child.55,56 Little is known about the etiology of these conditions. Known predictors of maternal depression and anxiety include stressful life circumstances, a history of psychiatric disorder(s), and hormonal imbalance.49,81,82 We propose that some OPE compounds may act as chemical stressors on maternal mental health during this vulnerable life stage when body and brain undergo unprecedented changes. The effect of ΣOPE in our models was generally strongest at 36 weeks gestation and 6 months postpartum. While this may be a byproduct of proximity to the measurement of OPEs in house dust, which occurred at 3-4 months postpartum, it is possible that women are more vulnerable to OPEs in the peripartum period. Recent studies show that higher blood levels of polybrominated diphenyl ethers (PBDEs), another class of flame retardants, during pregnancy are associated with greater odds of postpartum depression.83,84 Another found that prenatal exposures to PBDEs were prospectively associated with anxiety symptoms in the adolescent years.85 While OPEs and PBDEs are structurally different and may have different mechanisms of action, human exposure sources are similar (i.e. furniture, electronics). Because postpartum depression and postpartum anxiety are highly prevalent and can have acute and chronic negative effects on mother and child, identifying modifiable factors to decrease their incidence and severity is important for maternal and child health outcomes.
We opted to examine the association between maternal mental health outcomes and this mixture of OPE flame retardants using a Z-score approach. This approach minimizes concerns about multiple comparisons and makes the different OPE chemicals directly comparable given that they were present at very different concentrations in house dust. We acknowledge that a Z-score approach has implications for interpretation of our findings. Namely, it assumes that the mental health effect of a one standard deviation increase in exposure is equivalent for each flame retardant compound. However, this may not be true given that each chemical may have different toxicities. Thus, we further investigated the effects of individual compounds and potential timepoints of greater vulnerability. We found that 2IPPDPP was associated with continuous PSS overall, and that TPHP was associated with depression at two timepoints (Table 4). Other compounds were associated with the binary outcomes at varying timepoints (Table S10). It is unknown whether compounds were independently responsible for observed effects or whether they have an additive or multiplicative effect, especially since some were highly correlated and are known to be used together in commercial formulations like Firemaster 550 and 600.75 For instance, 4TBPDPP and B4TBPPP appeared to exert a similar effect on high PSS at 1 year postpartum ([4TBPDPP] OR: 1.33, 95% CI: 1.00, 1.76, p= 0.05; [B4TBPPP] OR: 1.36, 95% CI: 1.06, 1.74, p= 0.02), but they were highly correlated (ρSpearman = 0.73, Table S6) and both members of the tert-butylated triphenyl phosphates group. For these secondary models, we recognize the need to consider multiple comparisons. However, using the summary index of OPEs minimizes the need to analyze each compound separately. Since toxicological studies indicate that OPEs have endocrine disruption and neurotoxic capabilities, further research is warranted to determine if OPEs increase the risk for depressive and anxiety symptoms during the peripartum period. This future research should examine the neurocognitive toxicity of these compounds individually and as a mixture, especially since some research suggests chlorinated OPEs like TDCPP are more neurotoxic than other compounds.29,41
It is important to note that mean concentrations of OPEs in homes from this sample were 2-10x higher than in other measured Canadian homes.60 This sample of OPEs in house dust from Canada shows some of the highest concentrations measured in house dust worldwide, expect for Japan. TBOEP constitutes about 60% of the mean for summed OPEs in this sample from Canada, and studies in Japan also show TBOEP to be the most abundant compound.11 Yet concentrations collected in Japan are much greater than what was observed in our Canadian sample. For example, 148 home floor dust samples from Japan showed a median ΣOPE concentration of 577,000 ng/g compared to 81,000 ng/g in our sample.86 The primary driver for TBOEP in Japan and likely Canada is floor polish use. TBOEP is a common additive to paints, textiles, and coatings for papers and other materials like PVC-based products.11,24 Studies of house dust in Sweden also exhibited high OPE concentrations compared to the rest of the world.87 Overall, OPE concentrations from studies in Canada, the United States, and Sweden are similar, but concentrations from developing countries like Pakistan and the Philippines are magnitudes lower (medians of 530 and 970 ng/g, respectively).87
It was suggested previously that higher OPE concentrations in this cohort may partly be due to sample composition.60 Half of the sample came from the child’s crib mattress or mattress cover and the other half came from adjacent flooring. Mattresses containing polyurethane foam are recognized sources of TPHP, TDCPP, TCiPP, and TCEP.4,88,89 TDCPP was not analyzed in this study, but TCiPP, TCEP, and TPHP represent the second through fourth highest geometric mean concentrations in this sample following TBOEP (Table 2). Overall, the mean concentrations of these compounds were higher in this sample than in other indoor house dust samples in Canada, Japan, Sweden, and the United States.24,87 Navaranjan et al. 2021 performed a follow-up analysis using this dataset to determine whether samples from the bedroom and main living room of the same home were different (n=4).60 They found that ΣOPE levels in the bedroom were higher in the sleeping area compared to the living area, although these findings were not statistically significant. It is possible that the inclusion of the sleeping area in our dust collection protocol for this dataset contributed to overall higher OPE levels compared to other high-income nations.
Variability in dust OPE patterns observed by country and microenvironment may be affected by differences in dust sampling and analytical approaches, as discussed above. However, differing fire safety standards and use of OPEs in the built environment and consumer products may also play a role.87 For example, chlorinated OPE compounds (TCEP, TDCPP, and TCiPP) and TPHP have been used extensively as flame retardants in furniture foam production in high-income countries. Government agencies in Canada, the United States, and Europe have all launched or completed health risk assessments investigating at least one of these chemical compounds due to increasing evidence of their toxicity.90–92 In the European Union, TCEP was ruled out as an flame retardant additive to polyurethane foams.90 In 2020, TCiPP and TDCPP were proposed to be harmful to human health under the Canadian Environmental Protection Act, with consideration of risk management measures to reduce exposures. The Act targeted their uses in polyurethane foam for upholstered furniture, mattresses, mattress toppers, and other foam-based products as probable sources.91 California revised their flammability standard for upholstered furniture regulation (TB117-2013) so that products can meet the requirements without the use of flame retardant chemicals.93 Alternative options are being encouraged, such as the use of low-flammability materials or incorporating barriers between furniture fabric and foam.91,93 Given the shared market between the United States and Canada and the frequent citations of TB117-2013, it is likely that the polyurethane foam-containing products subject to TB117-2013 sold in Canada after 2013 do not contain these and other flame retardants.
Our study has several strengths. CHILD is a prospective and longitudinal multi-city cohort with repeated measurements of stress and depression across the prenatal and postnatal periods. These outcomes were measured using well-characterized clinical scales. We also accounted for potential confounders. House dust is a well-characterized proxy for OPE exposures, and CHILD was able to measure 25 different compounds, 14 of which were detected in at least 60% of participant samples and available for our analysis. CHILD’S dust sampling method may be more representative of chronic OPE exposures because it includes house dust from two rooms in the participant’s home, including the sleeping area, rather than the main living room only.14,94 Since mattresses can be important sources of OPEs, this method might be capturing an exposure source not otherwise represented in a living room sample. Since dust was pulled from the child’s mattress, dust concentrations may be more representative of the child’s exposures than the mother’s. However, parents often share a room with their child for the first three to six months of life, and their mattress would likely also have flame retardants additives. Therefore, it is possible and even likely that exposures would be similar.
A limitation of this study is that house dust may be a weaker indicator for internal OPE dose than hand wipes, wristbands, or urine.14,94 Correlations between urinary metabolites and OPE parent compounds in dust are moderate in some studies (rs= 0.30-0.46),13,24,95 but strength of association depends on the compound and some studies show no association.14,94 House dust measures may underestimate exposures to more volatile OPEs that partition more into the air than settled dust, like TCiPP.1,96,97 Dust samples can have high variability in OPEs even within the same room depending on proximity to sources, flooring type, and dust loading,98 and little is understood about their variability in dust over time or the validity of dust as a proxy for chronic OPE exposures. Previous analyses showed that PBDE levels from dust samples collected twice from the same homes 1 year apart were statistically correlated (R2 =0.57-0.90).99 PBDEs are a class of compounds used as flame retardants, of which the commercial mixture likely to be used in polyurethane foam was phased out of new uses in the early 2000s due to concerns about toxicity, persistence, and bioaccumulation.2 The moderate to strong dust sample correlations over time may be representative of consistent exposures due to the slow turnover time of products in the home containing these chemicals or due to residual PBDE levels that have yet to break down due to high persistence indoors.100 Other exposures matrices, like urine, may be more specific to internal dose, but they do exhibit temporal variability in the case of OPEs.97,101 While OPEs in house dust can act similarly to other semi-volatile organic compounds like PBDEs, some have shorter half-lives and higher vapor pressures1,2 and, therefore, may vary more over time. Furthermore, two of the maternal health assessments were measured at 18 weeks and 36 weeks during pregnancy, which occurred before the dust sample collection at 3 months postpartum. Thus, the health outcomes were measured before the exposure which could introduce temporal confounding if the OPE concentration in the house dust varied during this time period. Future studies should take repeated exposure measures to evaluate the variability of OPE concentrations in house dust.
While the exposure assessment was able to account for multiple OPEs, some OPE compounds were unavailable. For instance, previous toxicological and epidemiological research has shown the chlorinated compound TDCPP may be neurotoxic, but it was unavailable in this dataset due to a methodological limitation in the laboratory. Also, only the most frequently detected OPEs (14 out of 25) were included in this sample. Therefore, some potential OPE exposures are unaccounted for in our models. Few compounds were independently related to stress and depression, but the summative OPE measure was associated with stress. Exposure measurement error may be less of a concern when using a summative measure as opposed to individual compound measures. Furthermore, there are many different statistical approaches for examining the impact of chemical mixtures. While we opted to use a Z-score approach, alternative statistical methods could also have been applied. For example, weighted quantile sum regression, Bayesian kernel machine regression (BKMR), or quantile g-computation may offer a more nuanced understanding of the relationship between exposure to multiple OPE chemicals and these maternal mental health outcomes by accounting for potential variations in the effects of individual flame retardant chemicals and any additive or multiplicative effects on stress or depression. More research is needed to explore this hypothesis. Future research should take mixtures into account for a clearer picture of how exposures in the home contribute to mental health outcomes.
CHILD acknowledged this cohort represents a sample of higher socioeconomic status than the general Canadian population.60 The sample is also predominantly White and married or having a common law partnership. Therefore, our results may not be generalizable to populations of lower socioeconomic status, racial and ethnic minorities, and non-partnered groups. For example, Wan et al. found significantly higher air concentrations of 14 sampled flame retardants including TDCPP in Canadian low-income housing units versus higher-income detached or semi-detached homes.102 OPEs may be more likely to be released during mechanical breakdown of older consumer materials like furniture.103 While we attempted to minimize confounding by adjusting for income in our models, lower-income groups are poorly represented in this cohort. The 2010 median annual household income in Canada was $69,860,60 but our sample had only 17% (n=123) in an income bracket below $60,000-99,999. The effect of OPEs on maternal stress and depression may be less apparent in a higher socioeconomic context due to additional protective factors in place. Investigating effects of OPEs in a lower socioeconomic context is necessary and just. Additionally, the nested case-cohort study design involved augmenting the random cohort sample with children having asthma or recurrent wheeze. This could introduce selection bias since asthma or recurrent wheeze status can be influenced by environmental and lifestyle factors, which may also impact the mental health of mothers during the peripartum period. While we believe the potential for selection bias to be low since the measured characteristics in the parent cohort and this nested sample were similar, it cannot be ruled out. Thus, additional studies are warranted to confirm the validity and generalizability of our findings.
5. Conclusions
Our results indicate that the peripartum period may be a susceptible life-stage for organophosphate ester flame retardant and plasticizer toxicity, and exposures to these compounds may have a negative impact on maternal mental health. Women living in households with higher OPE concentrations in house dust had a small increase in Perceived Stress Scale scores compared to women living in households with lower OPE concentrations after adjusting for multiple covariates. More toxicological and epidemiological research is necessary to elucidate this potential relationship between OPEs and maternal mental health outcomes.
Supplementary Material
Highlights.
Flame retardant exposures from house dust may impact maternal mental health
Pregnancy may be a period of vulnerability to flame retardants
Some flame retardant compounds may affect stress and depression more than others
6. Acknowledgements
This publication was supported by the Oregon Clinical and Translational Research Institute (OCTRI), Grant Award Number (TL1 TR 002371), from the National Center for Advancing Translational Sciences (NCATS) at the National Institutes of Health (NIH). It was also supported by the National Institute of Environmental Health Sciences through Grant Award Number R01 ES029497. The content is solely the responsibility of the authors and does not necessarily represent the official views of the NIH.
We thank the CHILD Cohort Study (CHILD) participant families for their dedication and commitment to advancing health research. CHILD was initially funded by CIHR and AllerGen NCE. Visit CHILD at childstudy.ca. We thank Environment and Climate Change Canada (ECCC) and Sarah Bernstein for their support in the analysis of the dust samples. We also thank the Canadian Urban Environmental Health Research Consortium (CANUE) for providing ambient air pollution data. Lastly, we thank John Geldhof for providing expert advice on the statistical analysis approach.
Footnotes
Publisher's Disclaimer: This is a PDF file of an unedited manuscript that has been accepted for publication. As a service to our customers we are providing this early version of the manuscript. The manuscript will undergo copyediting, typesetting, and review of the resulting proof before it is published in its final form. Please note that during the production process errors may be discovered which could affect the content, and all legal disclaimers that apply to the journal pertain.
Declaration of interests
The authors declare that they have no known competing financial interests or personal relationships that could have appeared to influence the work reported in this paper.
References
- 1.van der Veen I, de Boer J. Phosphorus flame retardants: Properties, production, environmental occurrence, toxicity and analysis. Chemosphere. 2012;88(10):1119–1153. doi: 10.1016/j.chemosphere.2012.03.067 [DOI] [PubMed] [Google Scholar]
- 2.Blum A, Behl M, Birnbaum LS, et al. Organophosphate Ester Flame Retardants: Are They a Regrettable Substitution for Polybrominated Diphenyl Ethers? Environ Scl Technol Lett. 2019;6(11):638–649. doi: 10.1021/acs.estlett.9b00582 [DOI] [PMC free article] [PubMed] [Google Scholar]
- 3.Hoffman K, Butt CM, Chen A, Limkakeng AT, Stapleton HM. High Exposure to Organophosphate Flame Retardants in Infants: Associations with Baby Products. Environ Sci Technol. 2015;49(24): 14554–14559. doi: 10.1021/acs.est.5b03577 [DOI] [PubMed] [Google Scholar]
- 4.Stapleton HM, Klosterhaus S, Keller A, et al. Identification of Flame Retardants in Polyurethane Foam Collected from Baby Products. Environ Sci Technol. 2011;45(12):5323–5331. doi: 10.1021/es2007462 [DOI] [PMC free article] [PubMed] [Google Scholar]
- 5.Stapleton HM, Klosterhaus S, Eagle S, et al. Detection of Organophosphate Flame Retardants in Furniture Foam and U.S. House Dust. Environ Sci Technol. 2009;43(19):7490–7495. doi: 10.1021/es9014019 [DOI] [PMC free article] [PubMed] [Google Scholar]
- 6.Abbasi G, Saini A, Goosey E, Diamond ML. Product screening for sources of halogenated flame retardants in Canadian house and office dust. Sci Total Environ. 2016;545-546:299–307. doi: 10.1016/j.scitotenv.2015.12.028 [DOI] [PubMed] [Google Scholar]
- 7.Mendelsohn E, Hagopian A, Hoffman K, et al. Nail polish as a source of exposure to triphenyl phosphate. Environ Int. 2016;86:45–51. doi: 10.1016/j.envint.2015.10.005 [DOI] [PMC free article] [PubMed] [Google Scholar]
- 8.Bello A, Carignan CC, Xue Y, Stapleton HM, Bello D. Exposure to organophosphate flame retardants in spray polyurethane foam applicators: Role of dermal exposure. Environ Int. 2018;113:55–65. doi: 10.1016/j.envint.2018.01.020 [DOI] [PubMed] [Google Scholar]
- 9.Cequier E, Ionas AC, Covaci A, Marcé RM, Becher G, Thomsen C. Occurrence of a Broad Range of Legacy and Emerging Flame Retardants in Indoor Environments in Norway. Environ Sci Technol. 2014;48(12):6827–6835. doi: 10.1021/es500516u [DOI] [PubMed] [Google Scholar]
- 10.Santos MSF, Alves A, Madeira LM. Chemical and photochemical degradation of polybrominated diphenyl ethers in liquid systems – A review. Water Res. 2016;88:39–59. doi: 10.1016/j.watres.2015.09.044 [DOI] [PubMed] [Google Scholar]
- 11.Wei GL, Li DQ, Zhuo MN, et al. Organophosphorus flame retardants and plasticizers: Sources, occurrence, toxicity and human exposure. Environ Pollut. 2015;196:29–46. doi: 10.1016/j.envpol.2014.09.012 [DOI] [PubMed] [Google Scholar]
- 12.Noyes PD, Haggard DE, Gonnerman GD, Tanguay RL. Advanced Morphological — Behavioral Test Platform Reveals Neurodevelopmental Defects in Embryonic Zebrafish Exposed to Comprehensive Suite of Halogenated and Organophosphate Flame Retardants. Toxicol Sci. 2015;145(1):177–195. doi: 10.1093/toxsci/kfv044 [DOI] [PMC free article] [PubMed] [Google Scholar]
- 13.Meeker JD, Cooper EM, Stapleton HM, Hauser R. Urinary Metabolites of Organophosphate Flame Retardants: Temporal Variability and Correlations with House Dust Concentrations. Environ Health Perspect. 2013;121(5):580–585. doi: 10.1289/ehp.1205907 [DOI] [PMC free article] [PubMed] [Google Scholar]
- 14.Hoffman K, Garantziotis S, Birnbaum LS, Stapleton HM. Monitoring Indoor Exposure to Organophosphate Flame Retardants: Hand Wipes and House Dust. Environ Health Perspect. 2015;123(2):160–165. doi: 10.1289/ehp.1408669 [DOI] [PMC free article] [PubMed] [Google Scholar]
- 15.Carignan CC, McClean MD, Cooper EM, et al. Predictors of tris(1,3-dichloro-2-propyl) phosphate metabolite in the urine of office workers. Environ Int. 2013;55:56–61. doi: 10.1016/j.envint.2013.02.004 [DOI] [PMC free article] [PubMed] [Google Scholar]
- 16.Larsson K, De Wit CA, Sellström U, Sahlström L, Lindh CH, Berglund M. Brominated Flame Retardants and Organophosphate Esters in Preschool Dust and Children’s Hand Wipes. Environ Sci Technol. 2018;52(8):4878–4888. doi: 10.1021/acs.est.8b00184 [DOI] [PubMed] [Google Scholar]
- 17.Doherty BT, Hammel SC, Daniels JL, Stapleton HM, Hoffman K. Organophosphate Esters: Are These Flame Retardants and Plasticizers Affecting Children’s Health? Curr Environ Health Rep. 2019;6(4):201–213. doi: 10.1007/s40572-019-00258-0 [DOI] [PMC free article] [PubMed] [Google Scholar]
- 18.Schreder ED, Uding N, La Guardia MJ. Inhalation a significant exposure route for chlorinated organophosphate flame retardants. Chemosphere. 2016;150:499–504. doi: 10.1016/j.chemosphere.2015.11.084 [DOI] [PubMed] [Google Scholar]
- 19.Phillips AL, Hammel SC, Hoffman K, et al. Children’s residential exposure to organophosphate ester flame retardants and plasticizers: Investigating exposure pathways in the TESIE study. Environ Int. 2018;116:176–185. doi: 10.1016/j.envint.2018.04.013 [DOI] [PMC free article] [PubMed] [Google Scholar]
- 20.Linares V, Bellés M, Domingo JL. Human exposure to PBDE and critical evaluation of health hazards. Arch Toxicol. 2015;89(3):335–356. doi: 10.1007/s00204-015-1457-l [DOI] [PubMed] [Google Scholar]
- 21.Zhang B, Lu S, Huan M, et al. Urinary metabolites of organophosphate flame retardants in 0-5-year-old children: Potential exposure risk for inpatients and home-stay infants. Environ Pollut. 2018;243:318–325. [DOI] [PubMed] [Google Scholar]
- 22.Kim JW, Isobe T, Muto M, et al. Organophosphorus flame retardants (PFRs) in human breast milk from several Asian countries. Chemosphere. 2014;116:91–97. [DOI] [PubMed] [Google Scholar]
- 23.Sundkvist AM, Olofsson U, Haglund P. Organophosphorus flame retardants and plasticizers in marine and fresh water biota and in human milk. J Environ Monit. 2010;12:943–951. [DOI] [PubMed] [Google Scholar]
- 24.Yang C, Harris SA, Jantunen LM, et al. Are cell phones an indicator of personal exposure to organophosphate flame retardants and plasticizers? Environ Int. 2019;122:104–116. doi: 10.1016/j.envint.2018.10.021 [DOI] [PubMed] [Google Scholar]
- 25.Ospina M, Jayatilaka NK, Wong LY, Restrepo P, Calafat AM. Exposure to organophosphate flame retardant chemicals in the U.S. general population: Data from the 2013–2014 National Health and Nutrition Examination Survey. Environ Int. 2018;110:32–41. doi: 10.1016/j.envint.2017.10.001 [DOI] [PMC free article] [PubMed] [Google Scholar]
- 26.Hoffman K, Butt CM, Webster TF, et al. Temporal Trends in Exposure to Organophosphate Flame Retardants in the United States. Environ Sci Technol Lett. 2017;4(3):112–118. doi: 10.1021/acs.estlett.6b00475 [DOI] [PMC free article] [PubMed] [Google Scholar]
- 27.Patisaul HB, Behl M, Birnbaum LS, et al. Beyond Cholinesterase Inhibition: Developmental Neurotoxicity of Organophosphate Ester Flame Retardants and Plasticizers. Environ Health Perspect. 2021;129(10):105001. doi: 10.1289/EHP9285 [DOI] [PMC free article] [PubMed] [Google Scholar]
- 28.Eaton DL, Daroff RB, Autrup H, et al. Review of the Toxicology of Chlorpyrifos With an Emphasis on Human Exposure and Neurodevelopment. Crit Rev Toxicol. 2008;38(sup2):1–125. doi: 10.1080/10408440802272158 [DOI] [PubMed] [Google Scholar]
- 29.Gu Y, Yang Y, Wan B, Li M, Guo LH. Inhibition of O-linked N-acetylglucosamine transferase activity in PC12 cells – A molecular mechanism of organophosphate flame retardants developmental neurotoxicity. Biochem Pharmacol. 2018;152:21–33. doi: 10.1016/j.bcp.2018.03.017 [DOI] [PubMed] [Google Scholar]
- 30.Dishaw LV, Hunter DL, Padnos B, Padilla S, Stapleton HM. Developmental Exposure to Organophosphate Flame Retardants Elicits Overt Toxicity and Alters Behavior in Early Life Stage Zebrafish ( Danio rerio ). Toxicol Sci. 2014;142(2):445–454. doi: 10.1093/toxsci/kful94 [DOI] [PMC free article] [PubMed] [Google Scholar]
- 31.Oliveri AN, Bailey JM, Levin ED. Developmental exposure to organophosphate flame retardants causes behavioral effects in larval and adult zebrafish. Neurotoxicol Teratol. 2015;52:220–227. doi: 10.1016/j.ntt.2015.08.008 [DOI] [PMC free article] [PubMed] [Google Scholar]
- 32.Oliveri AN, Ortiz E, Levin ED. Developmental exposure to an organophosphate flame retardant alters later behavioral responses to dopamine antagonism in zebrafish larvae. Neurotoxicol Teratol. 2018;67:25–30. doi: 10.1016/j.ntt.2018.03.002 [DOI] [PMC free article] [PubMed] [Google Scholar]
- 33.Sun L, Xu W, Peng T, et al. Developmental exposure of zebrafish larvae to organophosphate flame retardants causes neurotoxicity. Neurotoxicol Teratol. 2016;55:16–22. doi: 10.1016/j.ntt.2016.03.003 [DOI] [PubMed] [Google Scholar]
- 34.Wang Q, Lam JCW, Man YC, et al. Bioconcentration, metabolism and neurotoxicity of the organophorous flame retardant 1,3-dichloro 2-propyl phosphate (TDCPP) to zebrafish. Aquat Toxicol. 2015;158:108–115. doi: 10.1016/j.aquatox.2014.11.001 [DOI] [PubMed] [Google Scholar]
- 35.Shi Q, Guo W, Shen Q, et al. In vitro biolayer interferometry analysis of acetylcholinesterase as a potential target of aryl-organophosphorus flame-retardants. J Hazard Mater. 2021;409:124999. doi: 10.1016/j.jhazmat.2020.124999 [DOI] [PubMed] [Google Scholar]
- 36.Zhong X, Wu J, Ke W, et al. Neonatal exposure to organophosphorus flame retardant TDCPP elicits neurotoxicity in mouse hippocampus via microglia-mediated inflammation in vivo and in vitro. Arch Toxicol. 2020;94(2):541–552. doi: 10.1007/s00204-019-02635-y [DOI] [PubMed] [Google Scholar]
- 37.Behl M, Rice JR, Smith MV, et al. Editor’s Highlight: Comparative Toxicity of Organophosphate Flame Retardants and Polybrominated Diphenyl Ethers to Caenorhabditis elegans. Toxicol Sci. 2016;154(2):241–252. doi: 10.1093/toxsci/kfwl62 [DOI] [PMC free article] [PubMed] [Google Scholar]
- 38.Liu X, Zhao X, Wang Y, et al. Triphenyl phosphate permeates the blood brain barrier and induces neurotoxicity in mouse brain. Chemosphere. 2020;252:126470. doi: 10.1016/j.chemosphere.2020.126470 [DOI] [PubMed] [Google Scholar]
- 39.Marieb EN, Hoehn K. Human Anatomy & Physiology. Tenth Edition. Pearson Education, Inc.; 2016. [Google Scholar]
- 40.Yang J, Zhao Y, Li M, Du M, Li X, Li Y. A Review of a Class of Emerging Contaminants: The Classification, Distribution, Intensity of Consumption, Synthesis Routes, Environmental Effects and Expectation of Pollution Abatement to Organophosphate Flame Retardants (OPFRs). Int J Mol Sci. 2019;20(12):2874. doi: 10.3390/ijms20122874 [DOI] [PMC free article] [PubMed] [Google Scholar]
- 41.Liu W, Luo D, Xia W, et al. Prenatal exposure to halogenated, aryl, and alkyl organophosphate esters and child neurodevelopment at two years of age. J Hazard Mater. 2021,’408:124856. doi: 10.1016/j.jhazmat.2020.124856 [DOI] [PubMed] [Google Scholar]
- 42.Castorina R, Bradman A, Stapleton HM, et al. Current-use flame retardants: Maternal exposure and neurodevelopment in children of the CHAMACOS cohort. Chemosphere. 2017;189:574–580. doi: 10.1016/j.chemosphere.2017.09.037 [DOI] [PMC free article] [PubMed] [Google Scholar]
- 43.Doherty BT, Hoffman K, Keil AP, et al. Prenatal exposure to organophosphate esters and behavioral development in young children in the Pregnancy, Infection, and Nutrition Study. NeuroToxicology. 2019;73:150–160. doi: 10.1016/j.neuro.2019.03.007 [DOI] [PMC free article] [PubMed] [Google Scholar]
- 44.Doherty BT, Hoffman K, Keil AP, et al. Prenatal exposure to organophosphate esters and cognitive development in young children in the Pregnancy, Infection, and Nutrition Study. Environ Res. 2019;169:33–40. doi: 10.1016/j.envres.2018.10.033 [DOI] [PMC free article] [PubMed] [Google Scholar]
- 45.Lipscomb ST, McClelland MM, MacDonald M, Cardenas A, Anderson KA, Kile ML. Cross-sectional study of social behaviors in preschool children and exposure to flame retardants. Environ Health. 2017;16(1):23. doi: 10.1186/s12940-017-0224-6 [DOI] [PMC free article] [PubMed] [Google Scholar]
- 46.Choi G, Keil AP, Richardson DB, et al. Pregnancy exposure to organophosphate esters and the risk of attention-deficit hyperactivity disorder in the Norwegian mother, father and child cohort study. Environ Int. 2021;154:106549. doi: 10.1016/j.envint.2021.106549 [DOI] [PMC free article] [PubMed] [Google Scholar]
- 47.Hillerer KM, Jacobs VR, Fischer T, Aigner L. The Maternal Brain: An Organ with Peripartal Plasticity. Neural Plast. 2014;2014:1–20. doi: 10.1155/2014/574159 [DOI] [PMC free article] [PubMed] [Google Scholar]
- 48.Hoekzema E, Barba-Müller E, Pozzobon C, et al. Pregnancy leads to long-lasting changes in human brain structure. Nat Neurosci. 2017;20(2):287–296. doi: 10.1038/nn.4458 [DOI] [PubMed] [Google Scholar]
- 49.Yim IS, Stapleton LRT, Guardino CM, Hahn-Holbrook J, Schetter CD. Biological and Psychosocial Predictors of Postpartum Depression: Systematic Review and Call for Integration. Annu Rev Clin Psychol. Published online 2015:45. [DOI] [PMC free article] [PubMed] [Google Scholar]
- 50.Zappas MP, Becker K, Walton-Moss B. Postpartum Anxiety. J Nurse Pract. 2021;17(1):60–64. doi: 10.1016/j.nurpra.2020.08.017 [DOI] [Google Scholar]
- 51.Stein A, Craske MG, Lehtonen A, et al. Maternal cognitions and mother–infant interaction in postnatal depression and generalized anxiety disorder. J Abnorm Psychol. 2012;121(4):795–809. doi: 10.1037/a0026847 [DOI] [PMC free article] [PubMed] [Google Scholar]
- 52.Dubber S, Reck C, Müller M, Gawlik S. Postpartum bonding: the role of perinatal depression, anxiety and maternal–fetal bonding during pregnancy. Arch Womens Ment Health. 2015;18(2):187–195. doi: 10.1007/s00737-014-0445-4 [DOI] [PubMed] [Google Scholar]
- 53.Tietz A, Zietlow AL, Reck C. Maternal bonding in mothers with postpartum anxiety disorder: the crucial role of subclinical depressive symptoms and maternal avoidance behaviour. Arch Womens Ment Health. 2014;17:433–442. [DOI] [PubMed] [Google Scholar]
- 54.Fallon V, Groves R, Halford JCG, Bennett KM, Harrold JA. Postpartum Anxiety and Infant-Feeding Outcomes: A Systematic Review. J Hum Lact. 2016;32(4):740–758. doi: 10.1177/0890334416662241 [DOI] [PubMed] [Google Scholar]
- 55.Ali NS, Mahmud S, Khan A, Ali BS. Impact of postpartum anxiety and depression on child’s mental development from two peri-urban communities of Karachi, Pakistan: a quasi-experimental study. BMC Psychiatry. 2013;13(1):274. doi: 10.1186/1471-244X-13-274 [DOI] [PMC free article] [PubMed] [Google Scholar]
- 56.Weissman MM, Wickramaratne P, Nomura Y, Warner V, Pilowsky D, Verdeli H. Offspring of Depressed Parents: 20 Years Later. Am J Psychiatry. Published online 2006:8. [DOI] [PubMed] [Google Scholar]
- 57.Moraes TJ, Lefebvre DL, Chooniedass R, et al. The Canadian Healthy Infant Longitudinal Development Birth Cohort Study: Biological Samples and Biobanking: The CHILD study: biological samples. Paediatr Perinat Epidemiol. 2015;29(1):84–92. doi: 10.1111/ppe.12161 [DOI] [PubMed] [Google Scholar]
- 58.Takaro TK, Scott JA, Allen RW, et al. The Canadian Healthy Infant Longitudinal Development (CHILD) birth cohort study: assessment of environmental exposures. J Expo Sci Environ Epidemiol. 2015;25(6):580–592. doi: 10.1038/jes.2015.7 [DOI] [PMC free article] [PubMed] [Google Scholar]
- 59.Navaranjan G, Diamond ML, Harris SA, et al. Early life exposure to phthalates and the development of childhood asthma among Canadian children. Environ Res. 2021;197:110981. doi: 10.1016/j.envres.2021.110981 [DOI] [PubMed] [Google Scholar]
- 60.Navaranjan G, Jantunen LM, Diamond ML, et al. Early Life Exposure to Tris(2-butoxyethyl) Phosphate (TBOEP) Is Related to the Development of Childhood Asthma. Environ Sci Technol Lett. 2021;8(7):531–537. doi: 10.1021/acs.estlett.lc00210 [DOI] [Google Scholar]
- 61.Helsel DR. Nondetects and Data Analysis. Statistics for Censored Environmental Data. Wiley-Interscience; 2005. [Google Scholar]
- 62.Lowery-Gionta EG, Crowley NA, Bukalo O, Silverstein S, Holmes A, Kash TL. Chronic stress dysregulates amygdalar output to the prefrontal cortex. Neuropharmacology. 2018;139:68–75. doi: 10.1016/j.neuropharm.2018.06.032 [DOI] [PMC free article] [PubMed] [Google Scholar]
- 63.Cohen S, Kamarck T, Mermelstein R. A global measure of perceived stress. J Health Soc Behav. 1983;24(4):385–396. [PubMed] [Google Scholar]
- 64.Perceived Stress Scale. Accessed March 24, 2023. https://www.das.nh.gov/wellness/Docs/Percieved%20Stress%20Scale.pdf
- 65.Radloff LS. The CES-D scale: a self-report depression scale for research in the general population. Appl Psychol Meas. 1977;1(3):385–401. [Google Scholar]
- 66.Hann D, Winter K, Jacobsen P. Measurement of depressive symptoms in cancer patients: evaluation of the Center for Epidemiological Studies Depression Scale (CES-D). J Psychosom Res. 1999;46:437–443. [DOI] [PubMed] [Google Scholar]
- 67.Kang LJ, Vu KN, Koleva PT, et al. Maternal psychological distress before birth influences gut immunity in mid-infancy. Clin Exp Allergy. 2020;50(2):178–188. doi: 10.1111/cea.13551 [DOI] [PubMed] [Google Scholar]
- 68.Zota AR, Adamkiewicz G, Morello-Frosch RA. Are PBDEs an environmental equity concern? Exposure disparities by socioeconomic status. Environ Sci Technol. 2010;44(15):5691–5692. doi: 10.1021/esl01723d [DOI] [PubMed] [Google Scholar]
- 69.Zhao X hu, Zhang Z hua. Risk factors for postpartum depression: An evidence-based systematic review of systematic reviews and meta-analyses. Asian J Psychiatry. 2020;53:102353. doi: 10.1016/j.ajp.2020.102353 [DOI] [PubMed] [Google Scholar]
- 70.R Core Team. R: A language and environment for statistical computing. Published online 2020. https://www.R-project.org/
- 71.Sterne JAC, White IR, Carlin JB, et al. Multiple imputation for missing data in epidemiological and clinical research: potential and pitfalls. BMJ. 2009;338(b2393). [DOI] [PMC free article] [PubMed] [Google Scholar]
- 72.Graham JW. Missing Data Analysis: Making It Work in the Real World. Annu Rev Psychol. 2009;60(1):549–576. doi: 10.1146/annurev.psych.58.110405.085530 [DOI] [PubMed] [Google Scholar]
- 73.van Buuren S, Groothuis-Oudshoorn K. mice : Multivariate Imputation by Chained Equations in R. J Stat Softw. 2011;45(3). doi: 10.18637/jss.v045.i03 [DOI] [Google Scholar]
- 74.Pinheiro J, Bates D, DebRoy S, Sarkar D, R Core Team. _nlme: Linear and Nonlinear Mixed Effects Models_. Published online 2022. https://CRAN.R-project.org/package=nlme
- 75.Phillips AL, Hammel SC, Konstantinov A, Stapleton HM. Characterization of Individual Isopropylated and tert -Butylated Triarylphosphate (ITP and TBPP) Isomers in Several Commercial Flame Retardant Mixtures and House Dust Standard Reference Material SRM 2585. Environ Sci Technol. 2017;51(22): 13443–13449. doi: 10.1021/acs.est.7b04179 [DOI] [PMC free article] [PubMed] [Google Scholar]
- 76.Beseler CL, Stallones L, Hoppin JA, et al. Depression and Pesticide Exposures among Private Pesticide Applicators Enrolled in the Agricultural Health Study. Environ Health Perspect. 2008;116(12):1713–1719. doi: 10.1289/ehp.11091 [DOI] [PMC free article] [PubMed] [Google Scholar]
- 77.Harrison V, Mackenzie Ross S. Anxiety and depression following cumulative low-level exposure to organophosphate pesticides. Environ Res. 2016;151:528–536. doi: 10.1016/j.envres.2016.08.020 [DOI] [PubMed] [Google Scholar]
- 78.Weisskopf MG, Moisan F, Tzourio C, Rathouz PJ, Elbaz A. Pesticide Exposure and Depression Among Agricultural Workers in France. Am J Epidemiol. 2013;178(7):1051–1058. doi: 10.1093/aje/kwt089 [DOI] [PubMed] [Google Scholar]
- 79.Freire C, Koifman S. Pesticides, depression and suicide: A systematic review of the epidemiological evidence. Int J Hyg Environ Health. 2013;216(4):445–460. doi: 10.1016/j.ijheh.2012.12.003 [DOI] [PubMed] [Google Scholar]
- 80.Zanchi MM, Marins K, Zamoner A. Could pesticide exposure be implicated in the high incidence rates of depression, anxiety and suicide in farmers? A systematic review. Environ Pollut. 2023;331:121888. doi: 10.1016/j.envpol.2023.121888 [DOI] [PubMed] [Google Scholar]
- 81.Stojanov J, Stanković M, Žikić O, Antonijević J. Postpartum psychiatric disorders: Review of the research history, classification, epidemiological data, etiological factors and clinical presentations. Acta Fac Medicae Naissensis. 2019;36(3):167–176. doi: 10.5937/afmnail903167S [DOI] [Google Scholar]
- 82.Vliegen N, Casalin S, Luyten P. The Course of Postpartum Depression: A Review of Longitudinal Studies. Harv Rev Psychiatry. 2014;22(1):1–22. doi: 10.1097/HRP.0000000000000013 [DOI] [PubMed] [Google Scholar]
- 83.Peltier MR, Fassett MJ, Arita Y, Chiu VY, Takhar HS, Getahun D. Exposure to polybrominated diphenyl ether-47 increases the risk of post-partum depression. J Matern Fetal Neonatal Med. 2022;35(25):8350–8354. doi: 10.1080/14767058.2021.1974386 [DOI] [PubMed] [Google Scholar]
- 84.Vuong AM, Yolton K, Braun JM, et al. Polybrominated diphenyl ether (PBDE) and poly- and perfluoroalkyl substance (PFAS) exposures during pregnancy and maternal depression. Environ Int. 2020; 139:105694. doi: 10.1016/j.envint.2020.105694 [DOI] [PMC free article] [PubMed] [Google Scholar]
- 85.Strawn JR, Xu Y, Cecil KM, et al. Early exposure to flame retardants is prospectively associated with anxiety symptoms in adolescents: A prospective birth cohort study. Depress Anxiety. Published online October 11, 2022:da.23284. doi: 10.1002/da.23284 [DOI] [PMC free article] [PubMed] [Google Scholar]
- 86.Araki A, Saito I, Kanazawa A, et al. Phosphorus flame retardants in indoor dust and their relation to asthma and allergies of inhabitants. Indoor Air. 2014;24(1):3–15. doi: 10.1111/ina.12054 [DOI] [PubMed] [Google Scholar]
- 87.Wei GL, Li DQ, Zhuo MN, et al. Organophosphorus flame retardants and plasticizers: Sources, occurrence, toxicity and human exposure [Supplemental appendix]. Environ Pollut. 2015;196:29–46. doi: 10.1016/j.envpol.2014.09.012 [DOI] [PubMed] [Google Scholar]
- 88.Boor BE, Liang Y, Crain NE, Järnström H, Novoselac A, Xu Y. Identification of Phthalate and Alternative Plasticizers, Flame Retardants, and Unreacted Isocyanates in Infant Crib Mattress Covers and Foam. Environ Sci Technol Lett. 2015;2(4):89–94. doi: 10.1021/acs.estlett.5b00039 [DOI] [Google Scholar]
- 89.U.S. Environmental Protection Agency. Fact Sheet: Assessing risks from flame retardants. EPA. Published October 22, 2022. Accessed May 4, 2023. https://www.epa.gov/assessing-and-managing-chemicals-under-tsca/fact-sheet-assessing-risks-flame-retardants#what [Google Scholar]
- 90.European Chemicals Agency. Screening Report: An Assessment of Whether the Use of TCEP, TCPP, and TDCP in Articles Should Be Restricted; 2018. Accessed May 4, 2023. https://echa.europa.eu/documents/10162/13641/screening_report_tcep_tcpp_td-cp_en.pdf/e0960aa7-f703-499c-24ff-fba627060698
- 91.Environment and Climate Change Canada, Health Canada. Updated Risk Management Scope for TCPP and TDCPP. Government of Canada; 2020. Accessed May 4, 2023. file:///C:/Users/steph/Downloads/Risk-management-scope-tcpp-tdcpp.pdf [Google Scholar]
- 92.U.S. Environmental Protection Agency. Risk evaluation for Tris(2-chloroethyl) phosphate (TCEP). Published December 2019. Accessed May 4, 2023. https://www.epa.gov/assessing-and-managing-chemicals-under-tsca/risk-evaluation-tris2-chloroethyl-phosphate-tcep#:~:text=EPA%20designated%20tris%20%282-chloroethyl%29%20phosphate%20%28TCEP%29%20as%20a,about%20other%20chemicals%20undergoing%20risk%20evaluations%20under%20TSCA.
- 93.Green Science Policy Institute. The New California TB117-2013 Regulation: What Does It Mean?; 2014. Accessed May 4, 2023. https://greensciencepolicy.org/docs/the-new-california-tb117-2013-regulation-what-does-it-mean-2014.pdf
- 94.Hammel SC, Hoffman K, Phillips AL, et al. Comparing the Use of Silicone Wristbands, Hand Wipes, And Dust to Evaluate Children’s Exposure to Flame Retardants and Plasticizers. Environ Sci Technol. 2020;54(7):4484–4494. doi: 10.1021/acs.est.9b07909 [DOI] [PMC free article] [PubMed] [Google Scholar]
- 95.Cequier E, Sakhi AK, Marcé RM, Becher G, Thomsen C. Human exposure pathways to organophosphate triesters — A biomonitoring study of mother–child pairs. Environ Int. 2015;75:159–165. doi: 10.1016/j.envint.2014.11.009 [DOI] [PubMed] [Google Scholar]
- 96.Li HL, Liu LY, Zhang ZF, et al. Semi-volatile organic compounds in infant homes: Levels, influence factors, partitioning, and implications for human exposure. Environ Pollut. 2019;251:609–618. doi: 10.1016/j.envpol.2019.05.048 [DOI] [PubMed] [Google Scholar]
- 97.Xu F, Giovanoulis G, van Waes S, et al. Comprehensive Study of Human External Exposure to Organophosphate Flame Retardants via Air, Dust, and Hand Wipes: The Importance of Sampling and Assessment Strategy. Environ Sci Technol. 2016;50(14):7752–7760. doi: 10.1021/acs.est.6b00246 [DOI] [PubMed] [Google Scholar]
- 98.Jílková S, Melymuk L, Vojta š, Vykoukalová M, Bohlin-Nizzetto P, Klánová J. Small-scale spatial variability of flame retardants in indoor dust and implications for dust sampling. Chemosphere. 2018;206:132–141. doi: 10.1016/j.chemosphere.2018.04.146 [DOI] [PubMed] [Google Scholar]
- 99.Bennett DH, Moran RE, Wu XM, et al. Polybrominated diphenyl ether (PBDE) concentrations and resulting exposure in homes in California: relationships among passive air, surface wipe and dust concentrations, and temporal variability. Indoor Air. 2015;25(2):220–229. doi: 10.1111/ina.12130 [DOI] [PMC free article] [PubMed] [Google Scholar]
- 100.Audy O, Melymuk L, Venier M, et al. PCBs and organochlorine pesticides in indoor environments - A comparison of indoor contamination in Canada and Czech Republic. Chemosphere. 2018;206:622–631. doi: 10.1016/j.chemosphere.2018.05.016 [DOI] [PubMed] [Google Scholar]
- 101.Bastiaensen M, Gys C, Malarvannan G, et al. Short-term temporal variability of urinary biomarkers of organophosphate flame retardants and plasticizers. Environ Int. 2021;146:106147. doi: 10.1016/j.envint.2020.106147 [DOI] [PubMed] [Google Scholar]
- 102.Wan Y, Diamond ML, Siegel JA. Elevated Concentrations of Semivolatile Organic Compounds in Social Housing Multiunit Residential Building Apartments. Environ Sci Technol Lett. 2020;7(3):191–197. doi: 10.1021/acs.estlett.0c00068 [DOI] [Google Scholar]
- 103.Keimowitz AR, Strunsky N, Wovkulich K. Organophosphate flame retardants in household dust before and after introduction of new furniture. Chemosphere. 2016;148:467–472. doi: 10.1016/j.chemosphere.2016.01.048 [DOI] [PubMed] [Google Scholar]
Associated Data
This section collects any data citations, data availability statements, or supplementary materials included in this article.