

Abstract
During cancers and infections, self-renewing stem-like CD8+ T cells mediate the response of immunotherapies and replenish terminally exhausted T cells and effector-like T cells. However, the programs governing the lineage choice in chimeric antigen receptor (CAR) T cells are unclear. Here, by simultaneously profiling single-cell chromatin accessibility and transcriptome in the same CAR T cells, we identified heterogeneous chromatin states within CD8+ T cell subsets that foreshadowed transcriptional changes and were primed for regulation by distinct transcription factors. Transcription factors that controlled each CD8+ T cell subset were regulated by high numbers of enhancers and positioned as hubs of gene networks. FOXP1, a hub in the stem-like network, promoted expansion and stemness of CAR T cells, and limited excessive effector differentiation. In the effector network, KLF2 enhanced effector CD8+ T cell differentiation and prevented terminal exhaustion. Thus, we identified gene networks and hub transcription factors that controlled the differentiation of stem-like CD8+ CAR T cells into effector or exhausted CD8+ CAR T cells.
In cancer and chronic infection, persistent antigen exposure drives T cells into a dysfunctional state, termed exhaustion. Hallmarks of T cell exhaustion include reduced proliferation, impaired effector function and failure to persist. Exhaustion hinders the efficacy of cancer immunotherapies, including chimeric antigen receptor (CAR) T cell therapy. A deeper understanding of the molecular programs that regulate T cell exhaustion is critical for developing more effective immunotherapies for cancer patients.
Exhausted T cells are a heterogeneous population. A stem-like self-renewing TCF1+CD8+ T cell subset constantly replenishes a more terminally exhausted TCF1−CD8+ T cell subset1–14. Stem-like CD8+ T cells drive the immune response induced by PD-1 blockade2,6,7,15,16. Markers of T cell stemness and T cell memory in premanufactured T cells or infusion products correlated with the response to CAR T cell therapy in patients with B cell malignancies 17–19. In addition to terminally exhausted CD8+ T cells, stem-like CD8+ T cells give rise to an effector-like CD8+ T cell subset with greater cytotoxicity20–24. Notably, the effector-like CD8+ T cell subset promotes viral control in chronic infection and positively correlates with the response to chemoimmunotherapy in melanoma patients20,24. Despite recent progress, the molecular checkpoints governing the bifurcation of stem-like CD8+ T cells to effectors or terminally exhausted CD8+ T cells, especially in the context of CAR T cell therapy, are incompletely understood.
In this study, using joint single-cell transcriptomic and epigenomic analyses in single CAR T cells, we showed that CD8+ CAR T cells predominantly differentiated from the stem-like subset to the effector-like subset in B cell acute lymphoblastic leukemia (ALL), whereas melanoma tumors were infiltrated by exhausted CAR T cell subsets with distinct transcriptional signatures. We identified heterogeneous chromatin states in CAR T cell subsets that were primed for regulation by different transcription factors and foreshadowed transcriptional changes. In addition, lineage-defining transcription factors were controlled by exceptionally high numbers of enhancers and positioned in the center of gene regulatory networks. FOXP1, a hub transcription factor in the stem-like CAR T cell network, promoted antitumor response and stemness of CAR T cells and limited transition to the effector-like subset. A hub transcription factor in the effector-like network, KLF2, favored effector differentiation and suppressed exhaustion. Thus, our study identified gene regulatory networks and hub transcription factors that serve as checkpoints that govern the transition from stem-like to effector-like CAR T cells and the fate decision between effector-like and exhausted CAR T cells.
Results
CAR T cells respond differently to B cell ALL and melanoma
To define the differentiation and heterogeneity of CAR T cells in B cell ALL and solid tumor, we inoculated C57BL6 mice with either syngeneic E2A-PBX1 pre-B cell ALL, which is cleared by murine CD19-specific CAR T cells, or B16F10 melanoma lentivirally transduced with murine CD19 (hereafter B16-CD19), which is not fully controlled by CD19 CAR T cells25,26 (Extended Data Fig. 1a). CAR T cells were infused at day 4 post-E2A-PBX1 inoculation or day 10 post-B16-CD19 inoculation and then sorted at day 7 and day 21 post-infusion from the spleen and bone marrow of E2A-PBX1-inoculated mice or from the tumor and spleen of B16-inoculated mice for single-cell RNA-seq (scRNA-seq) (Extended Data Fig. 1a). Unsupervised clustering partitioned a total of 26,698 CD8+ CAR T cells into eleven clusters (Fig. 1a,b). In the uniform manifold approximation and projection (UMAP), B16-CD19-infiltrating CD8+ CAR T cells separated from CD8+ CAR T cells in the spleen or bone marrow (Fig. 1a,b and Extended Data Fig. 1b,c).
Fig. 1. CAR T cells in B cell ALL and melanoma have distinct single-cell transcriptomes.
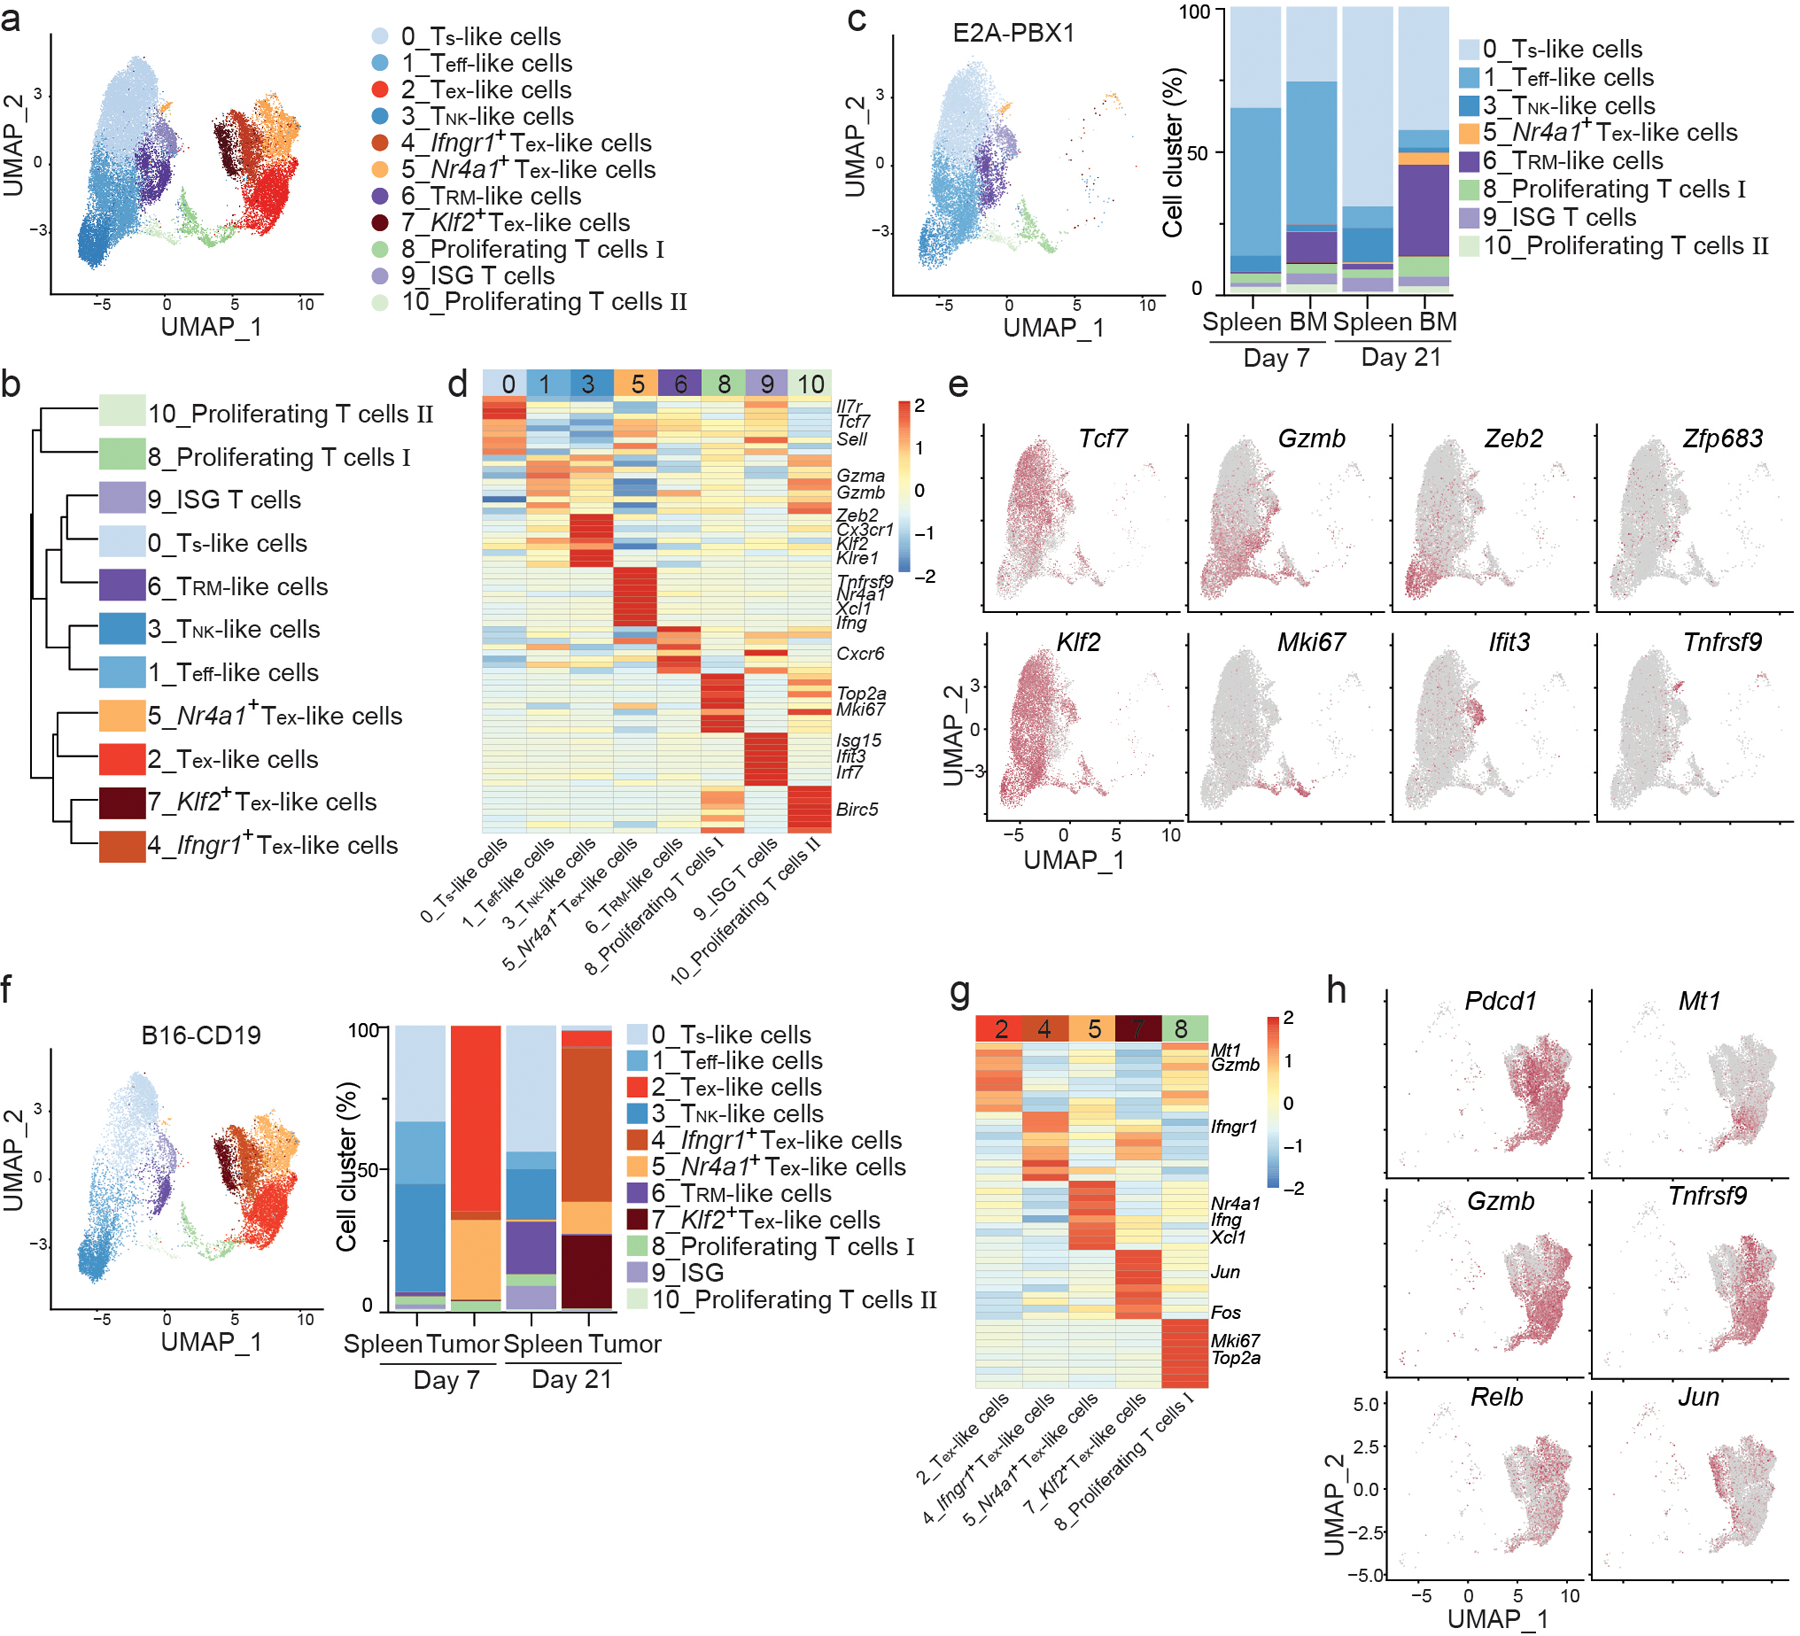
a, UMAP of CD8+ CAR T cells isolated at day 7 and day 21 post-infusion from the spleen and bone marrow (BM) of C57BL6 mice inoculated with E2A-PBX1 B cell ALL and injected with 106 murine CD19 CAR T cells co-expressing a truncated human EGFR (huEGFR) at day 4 post-inoculation or from the spleen and tumors of C57BL6 mice inoculated with B16-CD19 melanoma and injected with 5X10⁶ murine CD19 CAR T cells at day 10 post-inoculation. Each dot represents a cell. b, Hierarchical clustering of CD8+ CAR subsets isolated and defined in as in a. c, UMAP based on scRNA-seq analysis of CD8+ CAR T cells isolated at day 7 and day 21 from mice inoculated with E2A-PBX1 B cell ALL as in a (left) and percentages of clusters in each sample (right). Cells are color-coded based on cluster IDs. d, Heatmap of the top genes expressed in each cluster defined in c. Each column represents a cluster, each row represents a gene. e, scRNA-seq analysis of expression of Tcf7, Gzmb, Zeb2, Zfp683, Klf2, Mki67, Ifit3 and Tnfrsf9 in CD8+ CAR T cells from mice as in c. The mRNA level of each gene is color-coded. f, UMAP based on scRNA-seq analysis of CD8+ CAR T cells isolated at day 7 and day 21 from the spleen and tumors of mice inoculated with B16-CD19 (left) and percentages of clusters in each sample (right). Cells are color-coded based on cluster ID. g, Heatmap of top genes expressed in each cluster defined as in f. Clusters are shown in columns. Genes are shown in rows. h, Expression of Pdcd1, Mt1, Gzmb, Tnfrsf9, Relb and Jun in B16 tumor-infiltrating CD8+ CAR T cells as in g.
The CD8+ CAR T cells responding to B cell ALL contained eight clusters (Fig. 1c). Cluster 0 cells expressed Tcf7 (which encodes TCF1), Il7r, Ccr7 and Sell (CD62L), which are associated with stem-like CD8+ T cells (hereafter Ts-like cells) in patients treated with CAR T cells 17,27 and in chronic viral infection13 (Fig. 1d,e and Extended Data Fig. 1d). CD8+ CAR Ts-like cells were observed in all samples from B cell ALL and were most abundant in spleen at day 21 (Fig. 1c and Extended Data Fig. 1c). Cluster 1 cells were more prevalent at day 7 and upregulated Gzma, Gzmb, Prf1, Bhlhe40 and Cx3cr1, which are signature genes of cytolytic effector-like CD8+ T cells (hereafter Teff-like cells) found in chronic infection20,21 or in cancer patients treated with CAR T cells 17,27 (Fig. 1c–e and Extended Data Fig. 1c,d). A natural killer cell (NK)-like28,29 subset (TNK-like cells, cluster 3), which had high expression of Klre1, Klrg1 and Zeb2, was more abundant in day 21 spleen than in other B cell ALL samples (Fig. 1c–e and Extended Data Fig. 1c,d). A tissue-resident memory (TRM)-like subset (cluster 6), mainly found in the bone marrow, upregulated Zfp683 (Hobit) and downregulated S1pr1 and Klf2 (Fig. 1c–e and Extended Data Fig. 1c,d). Clusters 8 and 10 expressed genes associated with the cell cycle, while cluster 9 expressed the gene signature of interferon stimulation (ISG) (Fig. 1c–e).
CD8+ CAR T cells in the spleen of B16-CD19-bearing mice had a similar scRNA-seq profile as those in the spleen of B cell ALL-bearing mice (Fig. 1a,b and Extended Data Fig. 1b,c). The majority of B16-CD19-infiltrating CD8+ CAR T cells fell into five clusters (Fig. 1f). Clusters 2, 4, 5 and 7 exhibited an exhaustion phenotype (hereafter Tex-like), while cluster 8 cells, which were also found in B cell ALL, expressed the proliferation marker Mki67 (Fig. 1g,h). Cluster 2 Tex-like cells represented the largest subset at day 7, upregulated inhibitory receptors (Pdcd1, Havcr2, Ctla4, Lag3, Tigit), pro-exhaustion molecules (Mt1, Mt2) 30 and cytotoxic proteins (Gzmb, Prf1) and expressed transcriptional Tex cell signature defined in a previous study 31 (Fig. 1f–h and Extended Data Fig. 1e,f). Cluster 5 Nr4a1+ Tex-like cells, which were also present in B cell ALL as a minor subset, constituted the second largest population in day 7 B16-CD19 tumors (Fig. 1c,f), had higher expression of Nr4a1, Ifng and Xcl1 and lower expression of inhibitory receptors (Pdcd1, Havcr2, Ctla4, Lag3, Tigit) compared to Tex-like cells, and may resemble a population of previously described precursor-exhausted T cells (Tpex cells) 31 (Fig. 1g,h and Extended Data Fig. 1e,f). Clusters 4 and 7 were much more abundant at day 21 than at day 7 in B16-CD19 tumors and downregulated genes associated with T cell activation (Tnfrsf4, Tnfrsf9), cytotoxicity (Gzmb, Prf1) and the NF-κB pathway (Relb, Nfkb1) (Fig. 1f,h and Extended Data Fig. 1e). Relative to cluster 4 (Ifngr1+ Tex-like), cluster 7 (Klf2+ Tex-like) cells upregulated the transcription factors Klf2 and AP1 (Fos, Jun) (Fig. 1g,h and Extended Data Fig. 1e). Relative to cluster 2, cluster 4 upregulated genes including Ifngr1 (Extended Data Fig. 1e). Compared to CAR T cells in B cell ALL, CD8+ CAR T cells that infiltrated B16-CD19 tumors showed higher average expression of exhaustion-associated genes including Pdcd1, Ctla4 and Havcr2 and lower average expression of Klf2 and stem-associated gene Tcf7 (Extended Data Fig. 1g). Thus, the majority of CD8+ CAR T cells in B cell ALL differentiated into either CD8+ CAR Ts-like or Teff-like cells, while CD8+ CAR T cells infiltrating B16-CD19 tumors displayed distinct transcriptional signatures, typical of exhausted CD8+ T cells.
Chromatin states foreshadow CD8+ CAR Teff cell differentiation
To understand the epigenetic regulation of CD8+ CAR T cells in B cell ALL, we generated paired single-cell chromatin accessibility and transcriptome profiles in the same CAR T cells in the spleen of mice inoculated with E2A-PBX1 pre-B cell ALL at day 7 post-CAR T cell infusion. 3,773 total scATAC+RNA-seq CD8+ CAR T cell profiles were generated with an average of 1,830 genes and 10,524 peaks (open chromatin regions) detected in each cell. A greater proportion of intronic RNA was detected in scATAC+RNA-seq profiles compared to scRNA-seq (Extended Data Fig. 2a). Based on the transcriptome and the annotation defined above (Fig. 1a), we identified Ts-like, Teff-like, proliferating and ISG subsets of CD8+ CAR T cells (Extended Data Fig. 2b–d).
To determine whether epigenetic and transcriptional changes that occurred during CAR T cell differentiation were synchronous or asynchronous, we generated a UMAP using the scATAC-seq profiles and partitioned CD8+ CAR T cells into subsets based on either their scATAC-seq profiles or scRNA-seq profiles (Fig. 2a). Although the majority of CD8+ CAR T cells showed coordinated epigenetic and transcriptional changes during differentiation, several differentiation states were only identified by scATAC-seq or scRNA-seq (Fig. 2a). scATAC-seq indicated CD8+ CAR Ts-like cells defined by transcriptome contained two epigenetically distinct subsets: B-ALL_ATAC_0 and B-ALL_ATAC_3 (Fig. 2a,b). B-ALL_ATAC_3 had an intermediate chromatin state between B-ALL_ATAC_0 and B-ALL_ATAC_1 (Fig. 2b), suggesting that B-ALL_ATAC_3 likely represented a transitional differentiation state between CD8+ CAR Ts-like cells and CD8+ CAR Teff-like cells. scATAC-seq partitioned transcriptome-based CD8+ CAR Teff-like cells into three clusters: B-ALL_ATAC_1, B-ALL_ATAC_2 and B-ALL_ATAC_4 (Fig. 2a,b). B-ALL_ATAC_1, the largest subset within CD8+ CAR Teff-like cells, exhibited greater chromatin accessibility at genes related to effector differentiation (Cx3cr1, Klrg1, Gzma, Tbx21 and Bhlhe40) compared to the Ts-like cell subset20,21,32 (Fig. 2b). Compared to B-ALL_ATAC_1, B-ALL_ATAC_2 had elevated chromatin accessibility at genes including Id2 (Fig. 2c). Relative to B-ALL_ATAC_1, B-ALL_ATAC_4 showed reduced chromatin accessibility at Tcf7 and Ifng and increased accessibility at Bhlhe40, Klf2 and S1pr5 (Fig. 2d). The ISG subset and proliferating subset were only identified by scRNA-seq but not scATAC-seq (Fig. 2a).
Fig. 2. scATAC+RNA-seq identifies distinct chromatin states in B cell ALL CD8+ CAR T cells.
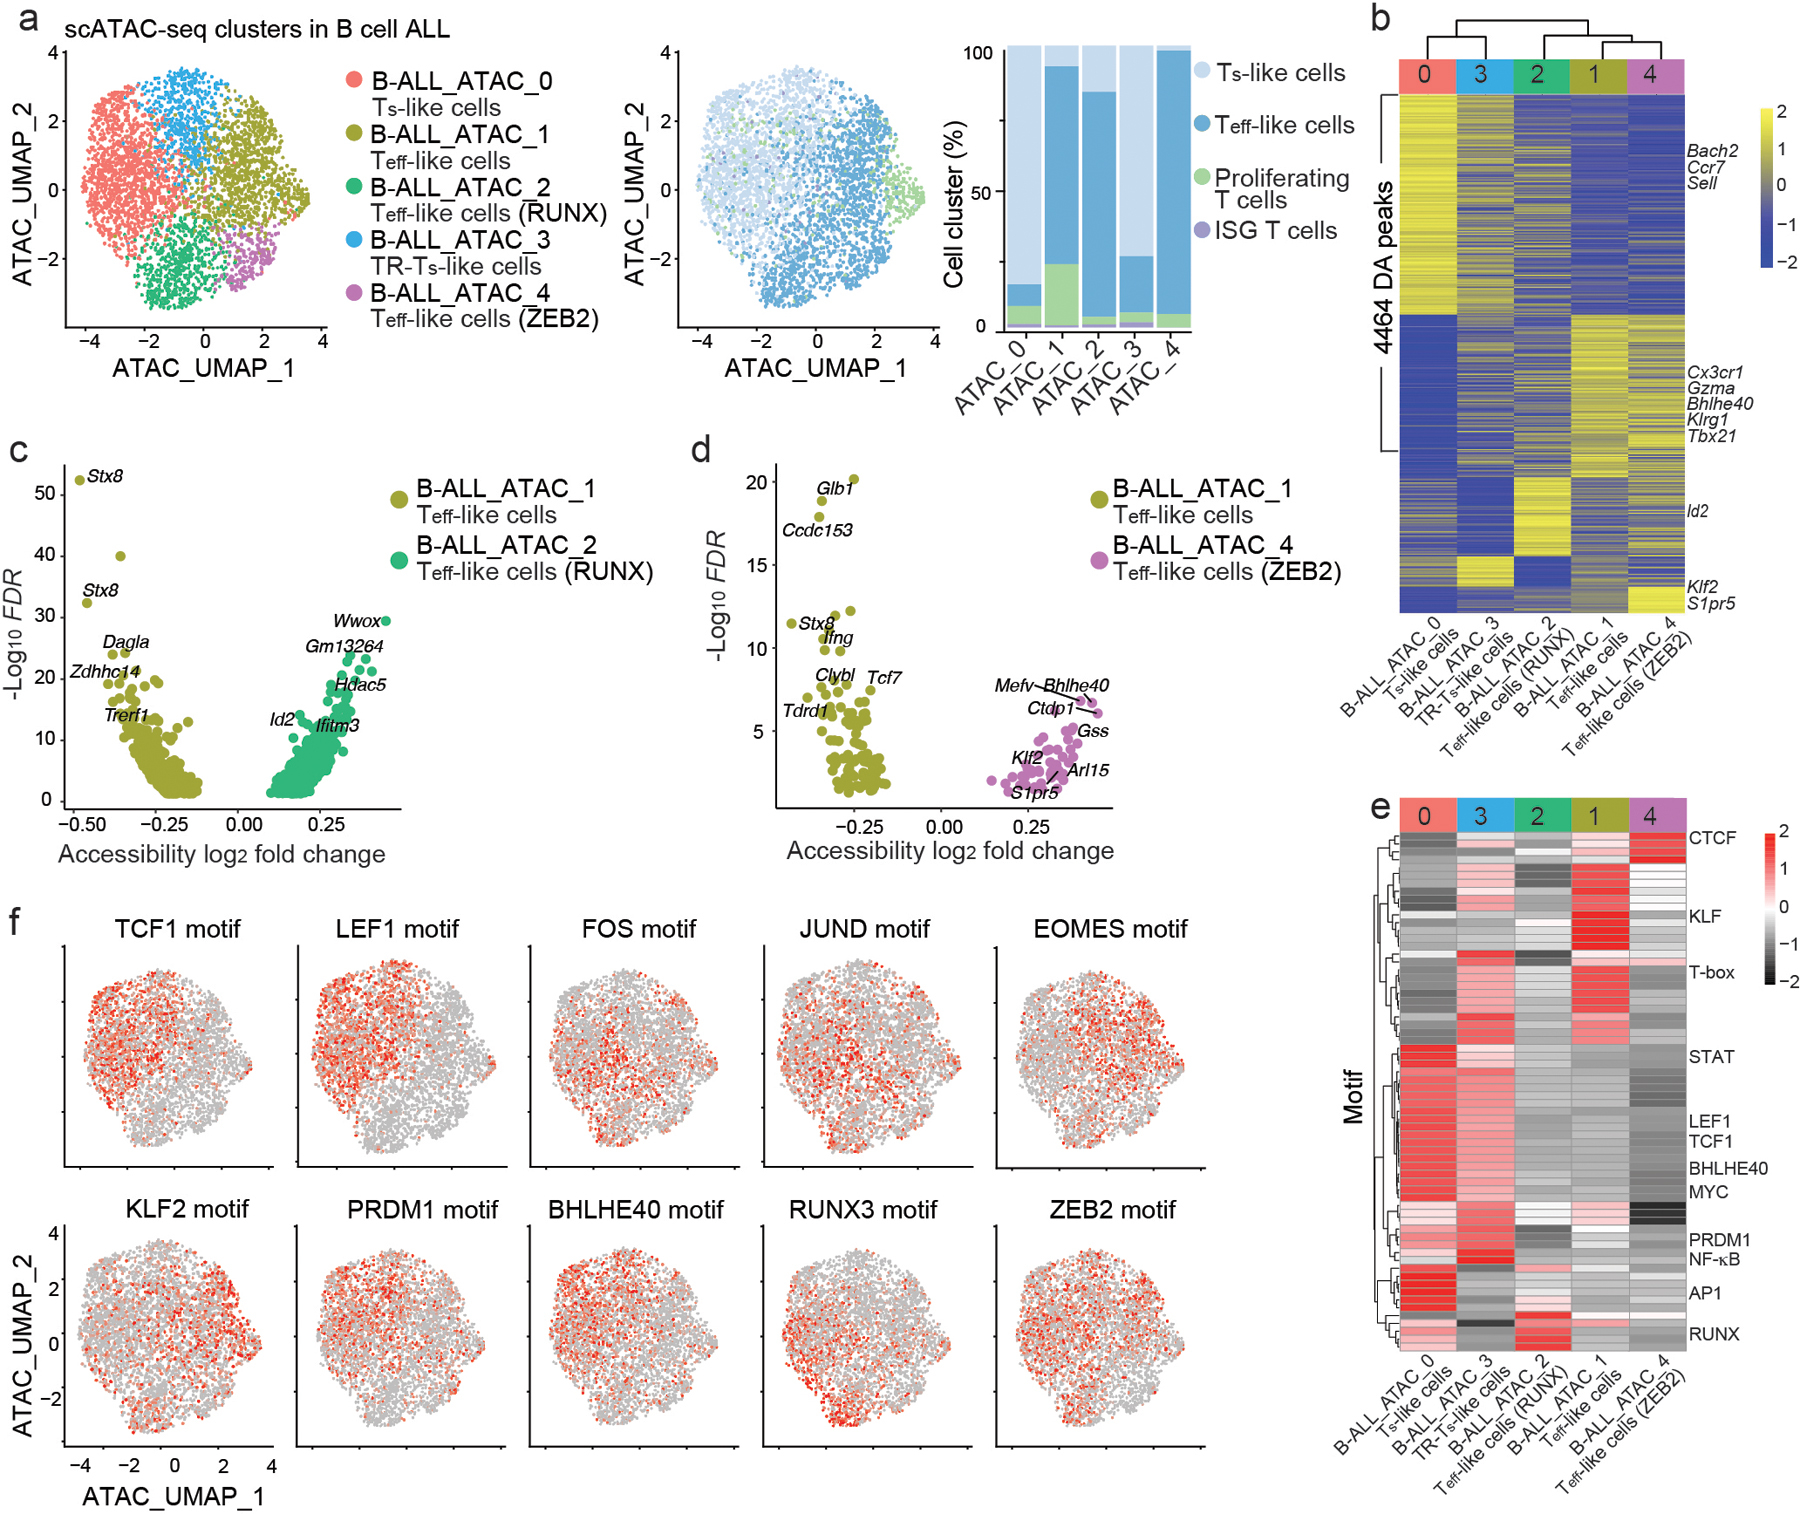
a, UMAP based on the scATAC-seq portion of scATAC+RNA-seq of CD8+ CAR T cells isolated at day 7 post-infusion from C57BL6 mice that were inoculated with E2A-PBX1 and treated with 106 CD19 CAR T cells. Cells are color-coded based on cluster IDs defined by either their chromatin states (left panel) or transcriptomes (middle panel). Percentages of cells from different RNA-defined clusters in each ATAC-defined cluster are shown (right panel). b, Heatmap of differentially accessible (DA) peaks in clusters defined by scATAC-seq as in a. Columns represent clusters and are arranged based on hierarchical clustering. c,d, Volcano plots showing the DA peaks between cluster B-ALL_ATAC_1 and cluster B-ALL_ATAC_2 (c) and between cluster B-ALL_ATAC_1 and cluster B-ALL_ATAC_4 (d). e, Heatmap of transcription factor motif enrichment in each scATAC-seq-based cluster defined as in a. f, Single-cell enrichment of selected transcription factor motifs in CD8+ CAR T cells as in a. UMAPs are generated based on scATAC-seq.
We next evaluated single-cell enrichment of transcription factor binding motifs (Fig. 2e). Both Ts-like B-ALL_ATAC_0 cells and transitional Ts-like (hereafter TR-Ts-like) B-ALL_ATAC_3 cells showed enrichment of TCF1 and LEF1 binding motifs (Fig. 2e,f), but relative to B-ALL_ATAC_0 cells, B-ALL_ATAC_3 cells had reduced chromatin accessibility around AP1 binding sites and increased chromatin accessibility at T-box transcription factors binding sites, including EOMES (Fig. 2e,f). Teff-like B-ALL_ATAC_1 cells showed increased accessibility at binding sites of KLF transcription factors, including KLF2, and reduced accessibility at binding sites for the transcriptional repressors BLIMP1 and BHLHE40 (Fig. 2e,f). Compared to Teff-like B-ALL_ATAC_1 and Teff-like B-ALL_ATAC_4 cells, open chromatin regions in Teff-like B-ALL_ATAC_2 cells exhibited greater enrichment of RUNX bindings motifs (Fig. 2e,f). In addition, chromatin accessibility at the binding site of the transcriptional repressor ZEB2 was reduced in the Teff-like B-ALL_ATAC_4 cells, which upregulated Zeb2 mRNA (Fig. 2f and Extended Data Fig. 2e). Because ZEB2 drives the differentiation of antiviral TNK-like cells29,33–35, this observation suggested that Teff-like B-ALL_ATAC_4 cells might have greater potential to differentiate into TNK-like CD8+ CAR T cells. In summary, scATAC+RNA-seq profiles found chromatin states in CD8+ CAR T cells that foreshadowed transcriptional changes during effector differentiation in response to B cell ALL.
Distinct transcriptional programs control Tex cell chromatin states
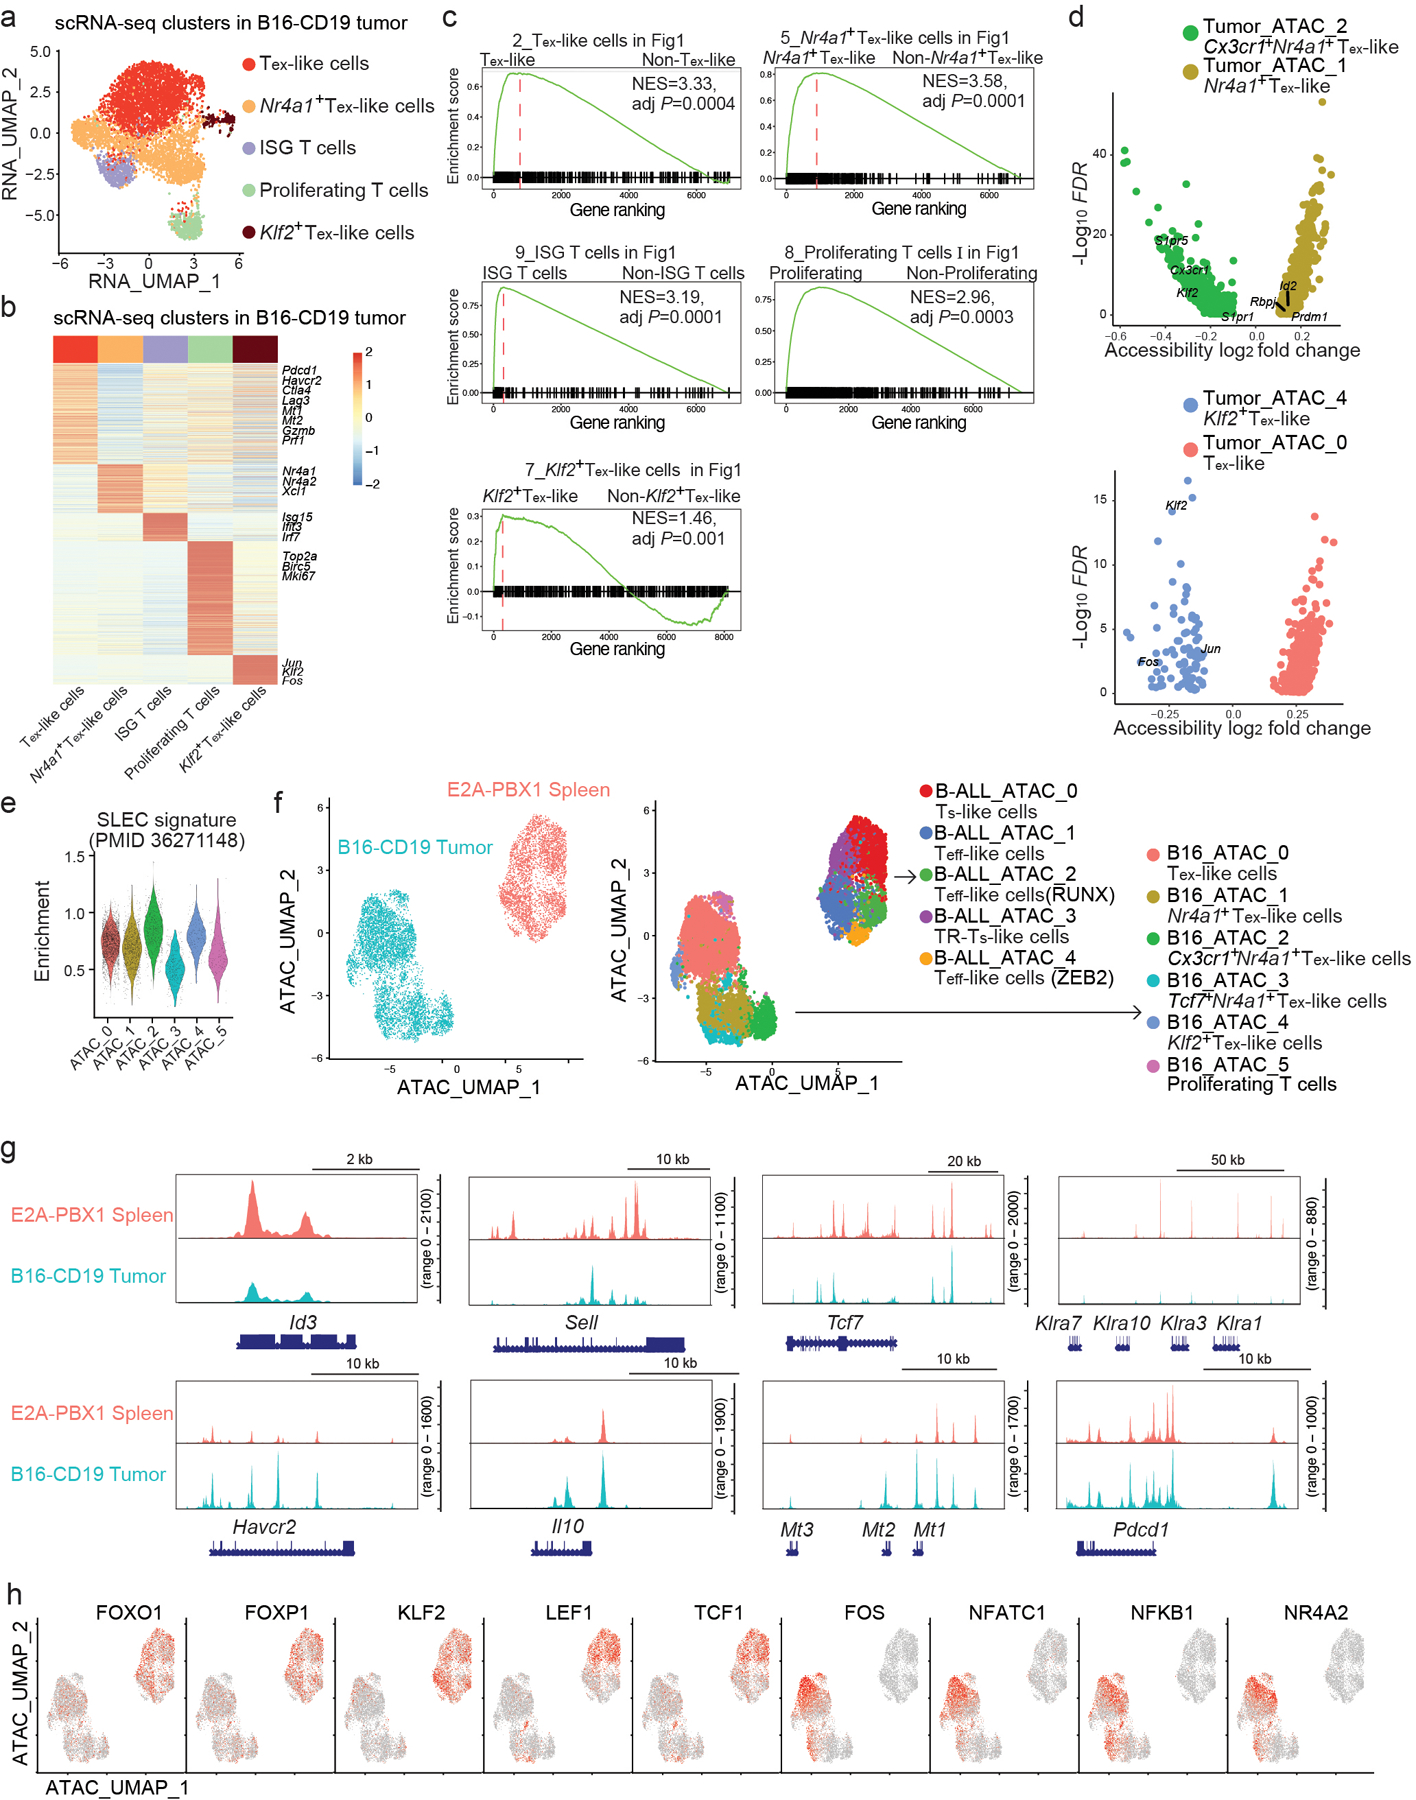
We performed scATAC+RNA-seq in B16-CD19 tumor-infiltrating CD8+ CAR T cells at day 7 post-infusion of CAR T cells. We captured 5,834 CD8+ CAR T cells with an average of 1,953 genes and 11,369 peaks per cell. Using the annotation above (Fig. 1a), we identified five transcriptome-based clusters in CD8+ CAR T cells, which included Tex-like, Nr4a1+ Tex-like, ISG, proliferating and Klf2+ Tex-like cells (Extended Data Fig. 3a–c). We next compared clusters defined by the transcriptome versus those defined by chromatin accessibility (Fig. 3a). scATAC-seq identified three chromatin states within the Nr4a1+ Tex-like cells: B16_ATAC_1, B16_ATAC_2, B16_ATAC_3 (Fig. 3a,b). B16_ATAC_1 and B16_ATAC_3 exhibited greater similarity compared to B16_ATAC_2 (Fig. 3b), but B16_ATAC_3 had higher chromatin accessibility at Ts-like marker genes, including Tcf7, Ccr7 and Bcl6, compared to B16_ATAC_1, and had open chromatin regions enriched with TCF1 and LEF1 motifs (Fig. 3c–e). Relative to B16_ATAC_1 and B16_ATAC_3, B16_ATAC_2 had higher chromatin accessibility at Cx3cr1, S1pr1 and Klf2 and upregulated a gene signature similar to that of short-lived effector CD8+ T cells (SLECs) 29 (Fig. 3c and Extended Data Fig. 3d,e). Open chromatin regions in B16_ATAC_2 cells were enriched with binding motifs of ELK, ETV and ETS transcription factors and were depleted for binding motif of ZEB2 (Fig. 3d,e).
Fig. 3. Chromatin states in B16-CD19 tumor-infiltrating CD8+ CAR T cells are primed for control by different transcription factors.
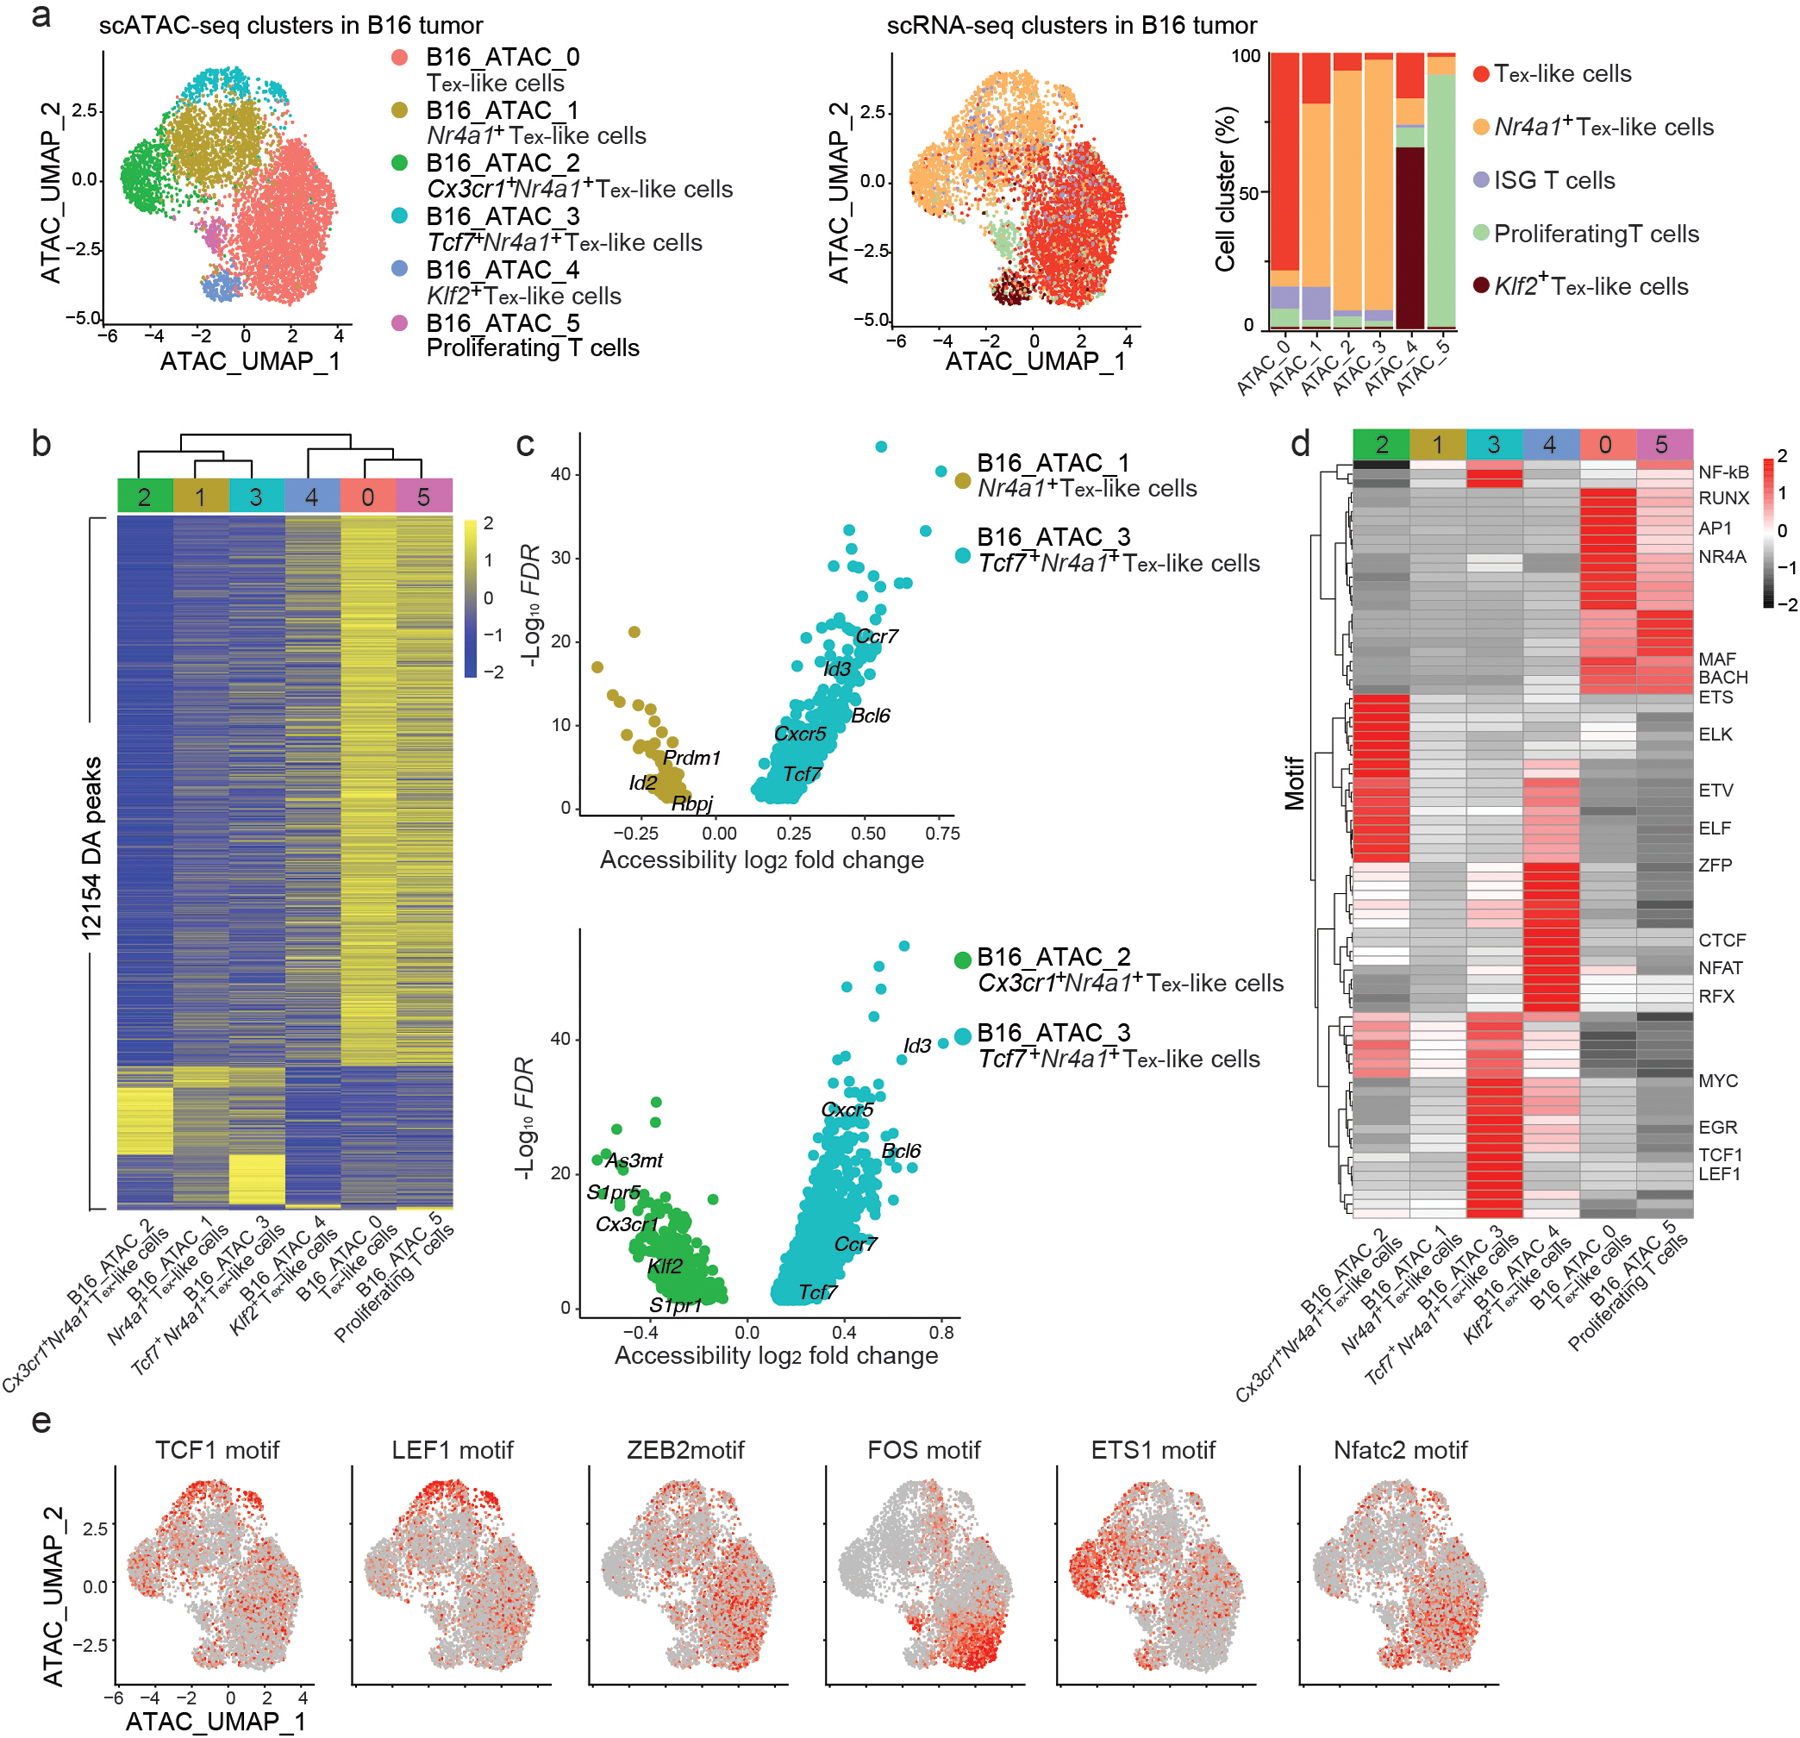
a, UMAP based on the scATAC-seq portion of scATAC+RNA-seq of CD8+ CAR T cells isolated at day 7 post-infusion of 5X10⁶ CD19 CAR T cells from C57BL6 mice inoculated with B16-CD19 melanoma. Cells are color-coded based on cluster IDs defined by chromatin state (left panel) or by the transcriptome (middle panel). Percentages of cells from different RNA-defined clusters in each ATAC-defined cluster are shown (right panel). b, A Heatmap of differentially accessible (DA) peaks in CD8+ CAR T cell clusters defined by scATAC-seq as in a. Columns represent clusters and are arranged based on hierarchical clustering. c, Volcano plots showing the DA peaks between B16_ATAC_3 and B16_ATAC_1 (upper panel) and between B16_ATAC_3 and B16_ATAC_2 (lower panel). d, A Heatmap of transcription factor motif enrichment in each ATAC-defined CD8+ CAR T cell cluster as in a. e, ATAC-based UMAP plots illustrating single-cell enrichment of selected transcription factor motifs in CD8+ CAR T cells as in a.
The ATAC-based clusters B16_ATAC_0, B16_ATAC_4 and B16_ATAC_5, largely superimposed with the RNA-based clusters Tex-like, Klf2+ Tex-like and proliferating, respectively (Fig. 3a). B16_ATAC_0 Tex-like and B16_ATAC_5 proliferating CD8+ CAR T cells were more closely related to each other than to other CAR T cell subsets at the epigenetic level and showed similar increases in accessibility at RUNX, AP1, NR4A, MAF and BACH motifs (Fig. 3b,d,e). B16_ATAC_4 Klf2+ Tex-like CD8+ CAR T cells had open chromatin enriched with NFAT, ZFP and RFX binding sites and greater accessibility at genes including Klf2, Fos and Jun than B16_ATAC_0 Tex-like cells (Fig. 3d,e and Extended Data Fig. 3d). Together, joint scATAC +RNA-seq showed multiple chromatin states in B16-CD19-infiltrating CAR CD8+ T cells primed for regulation by different transcription factors.
We merged and compared the scATAC-seq profiles of B cell ALL CD8+ CAR T cells and B16 CD8+ CAR T cells (Extended Data Fig. 3f). B16 CD8+ CAR T cells showed increased chromatin accessibility at exhaustion-associated genes, including Havcr2, Il10, Mt1 and Pdcd1 and reduced chromatin accessibility at stem-like associated genes (Tcf7, Id3, Sell) and NK-associated genes (Klra1, Klra3, Klra10) (Extended Data Fig. 3g). In addition, binding motifs of FOXO1, FOXP1, KLF2, LEF1 and TCF1 were enriched in B cell ALL CD8+ CAR T cells, whereas binding motifs for AP1 factors, NFATC1, NR4A2 and NFκB were enriched in B16 CD8+ CAR T cells (Extended Data Fig. 3h). Thus, B16-CD19 tumor-infiltrating CD8+ CAR T cells were programmed differently than CD8+ CAR T cells in B cell ALL at the chromatin level.
Regulatory networks govern differentiation of CAR T subsets
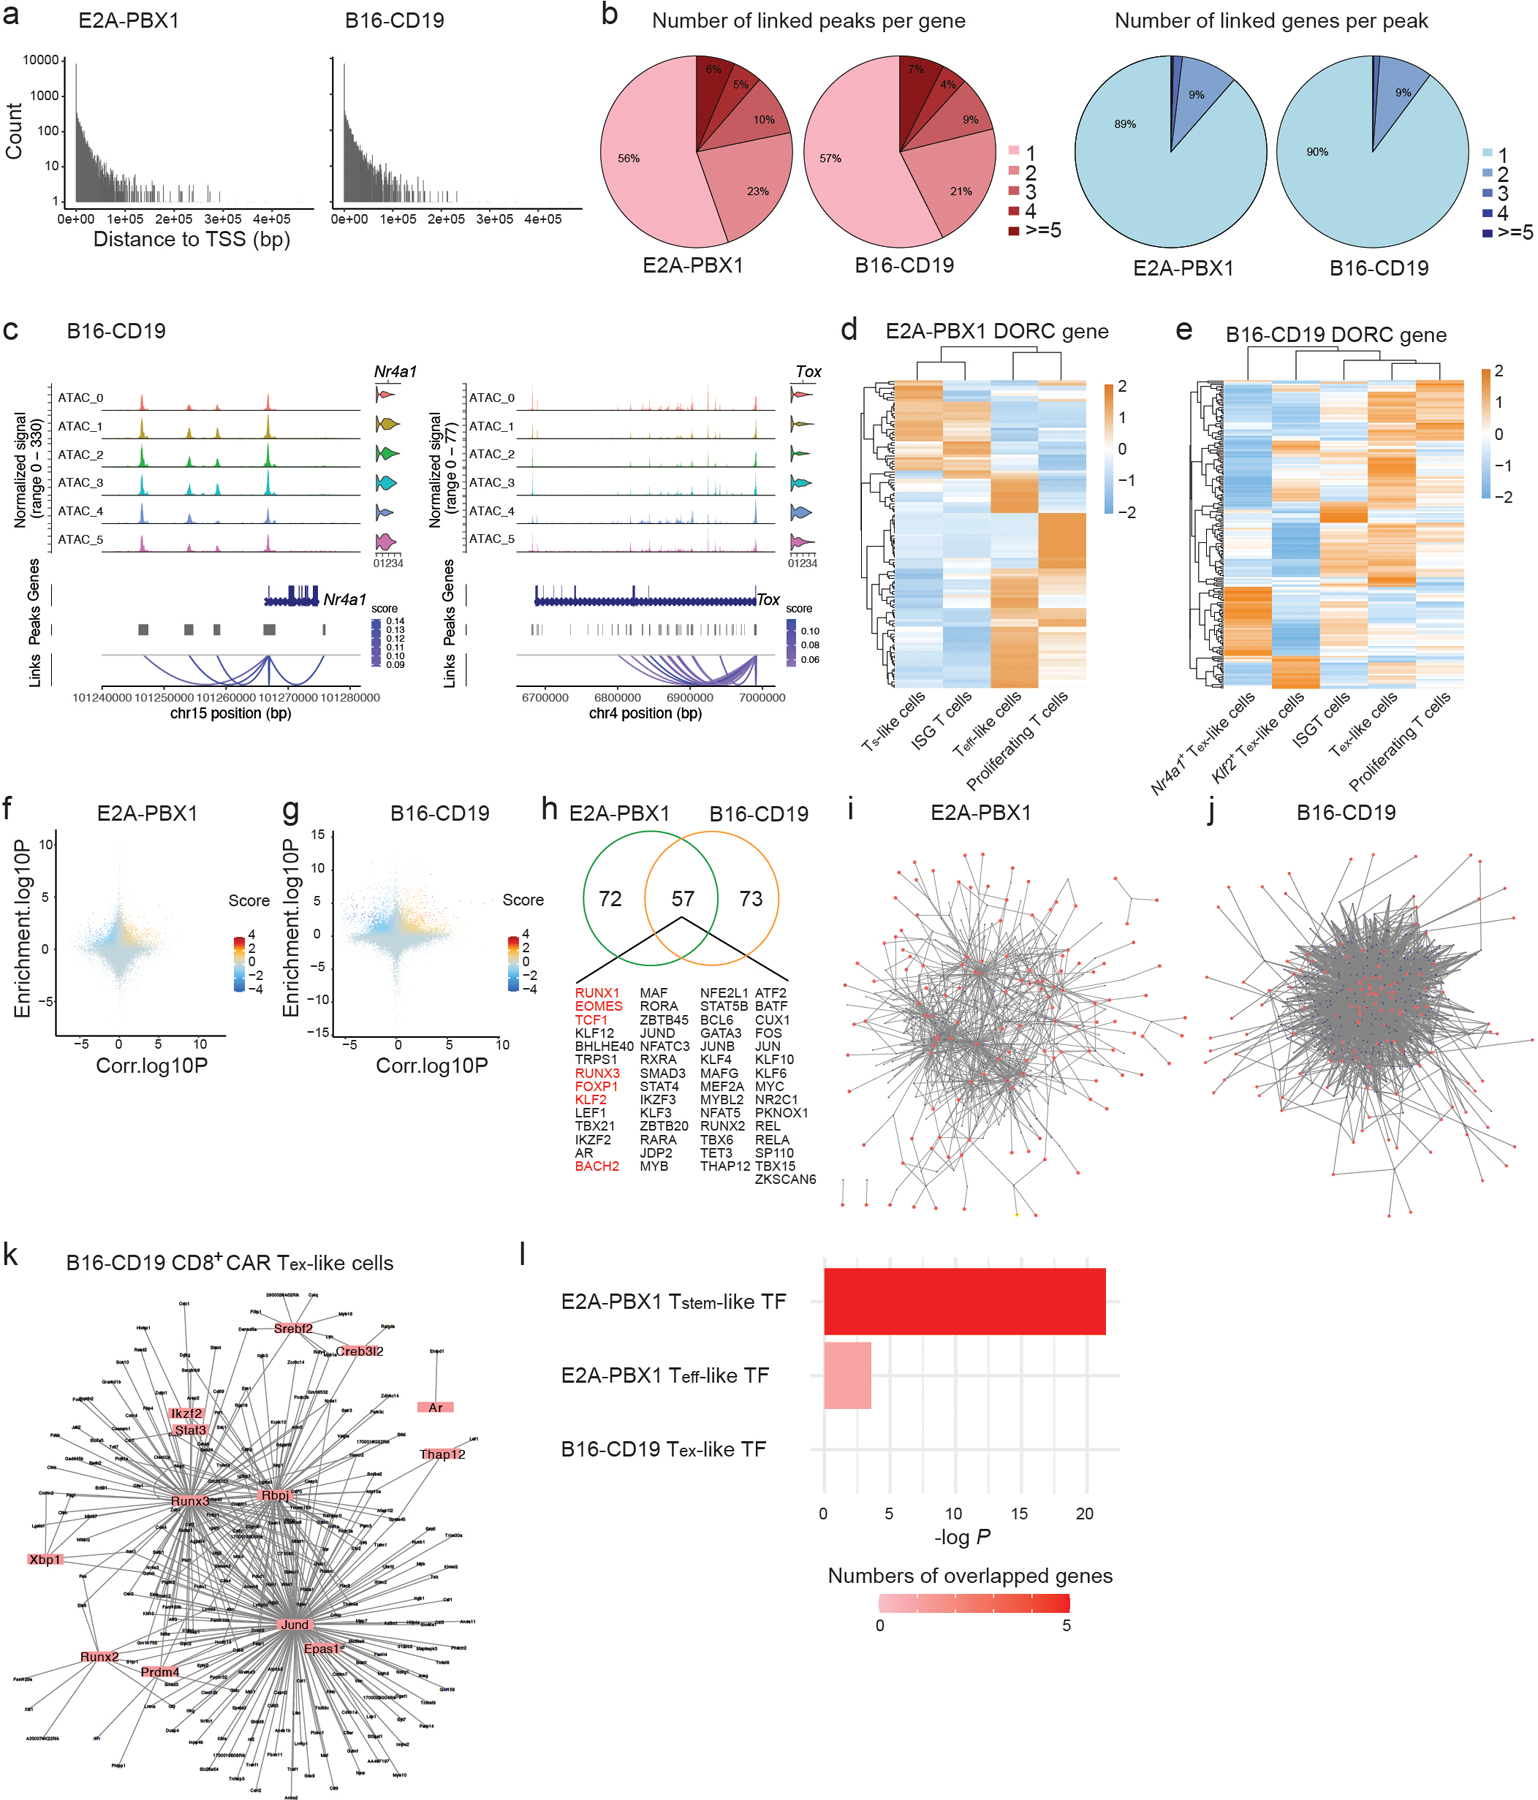
Next, we computed the correlation between gene expression and chromatin accessibility with the scATAC+RNA-seq data, and identified 12,551 and 11,301 peak-gene links in B-cell-ALL CD8+ CAR T cells and B16 CD8+ CAR T cells, respectively. The probability of peak-gene association decayed as the distance to TSS increased (Extended Data Fig. 4a). Whereas >40% of linked genes were associated with two or more peaks, peaks were rarely linked to more than one gene (Extended Data Fig. 4b). Lineage-defining genes often are linked to a large number of peaks and overlap with super-enhancers 36. We identified genes with an exceptionally high number of links, termed as ‘domains of regulatory chromatin’ (DORCs) 36 (Fig. 4a). Many DORCs were in genes encoding transcription factors, including Foxp1, Zeb2, Nr4a1 and Tox (Fig. 4a,b and Extended Data Fig. 4c). Some DORC genes encode transcription factors that regulate T cell stemness (Bach2, Tcf7, Id3), exhaustion (Tox, Eomes, Satb1, Ikzf2, Nr4a1) or effector differentiation (Zeb2, Rbpj, Runx3, Bhlhe40) 13,14,29,32–35,37–46 (Fig. 4a,b and Extended Data Fig. 4c). The expression of many DORC genes were restricted to specific CAR T cell subsets (Extended Data Fig. 4d,e).
Fig. 4. Lineage-defining transcription factors and gene regulatory networks control differentiation of CAR T cells.
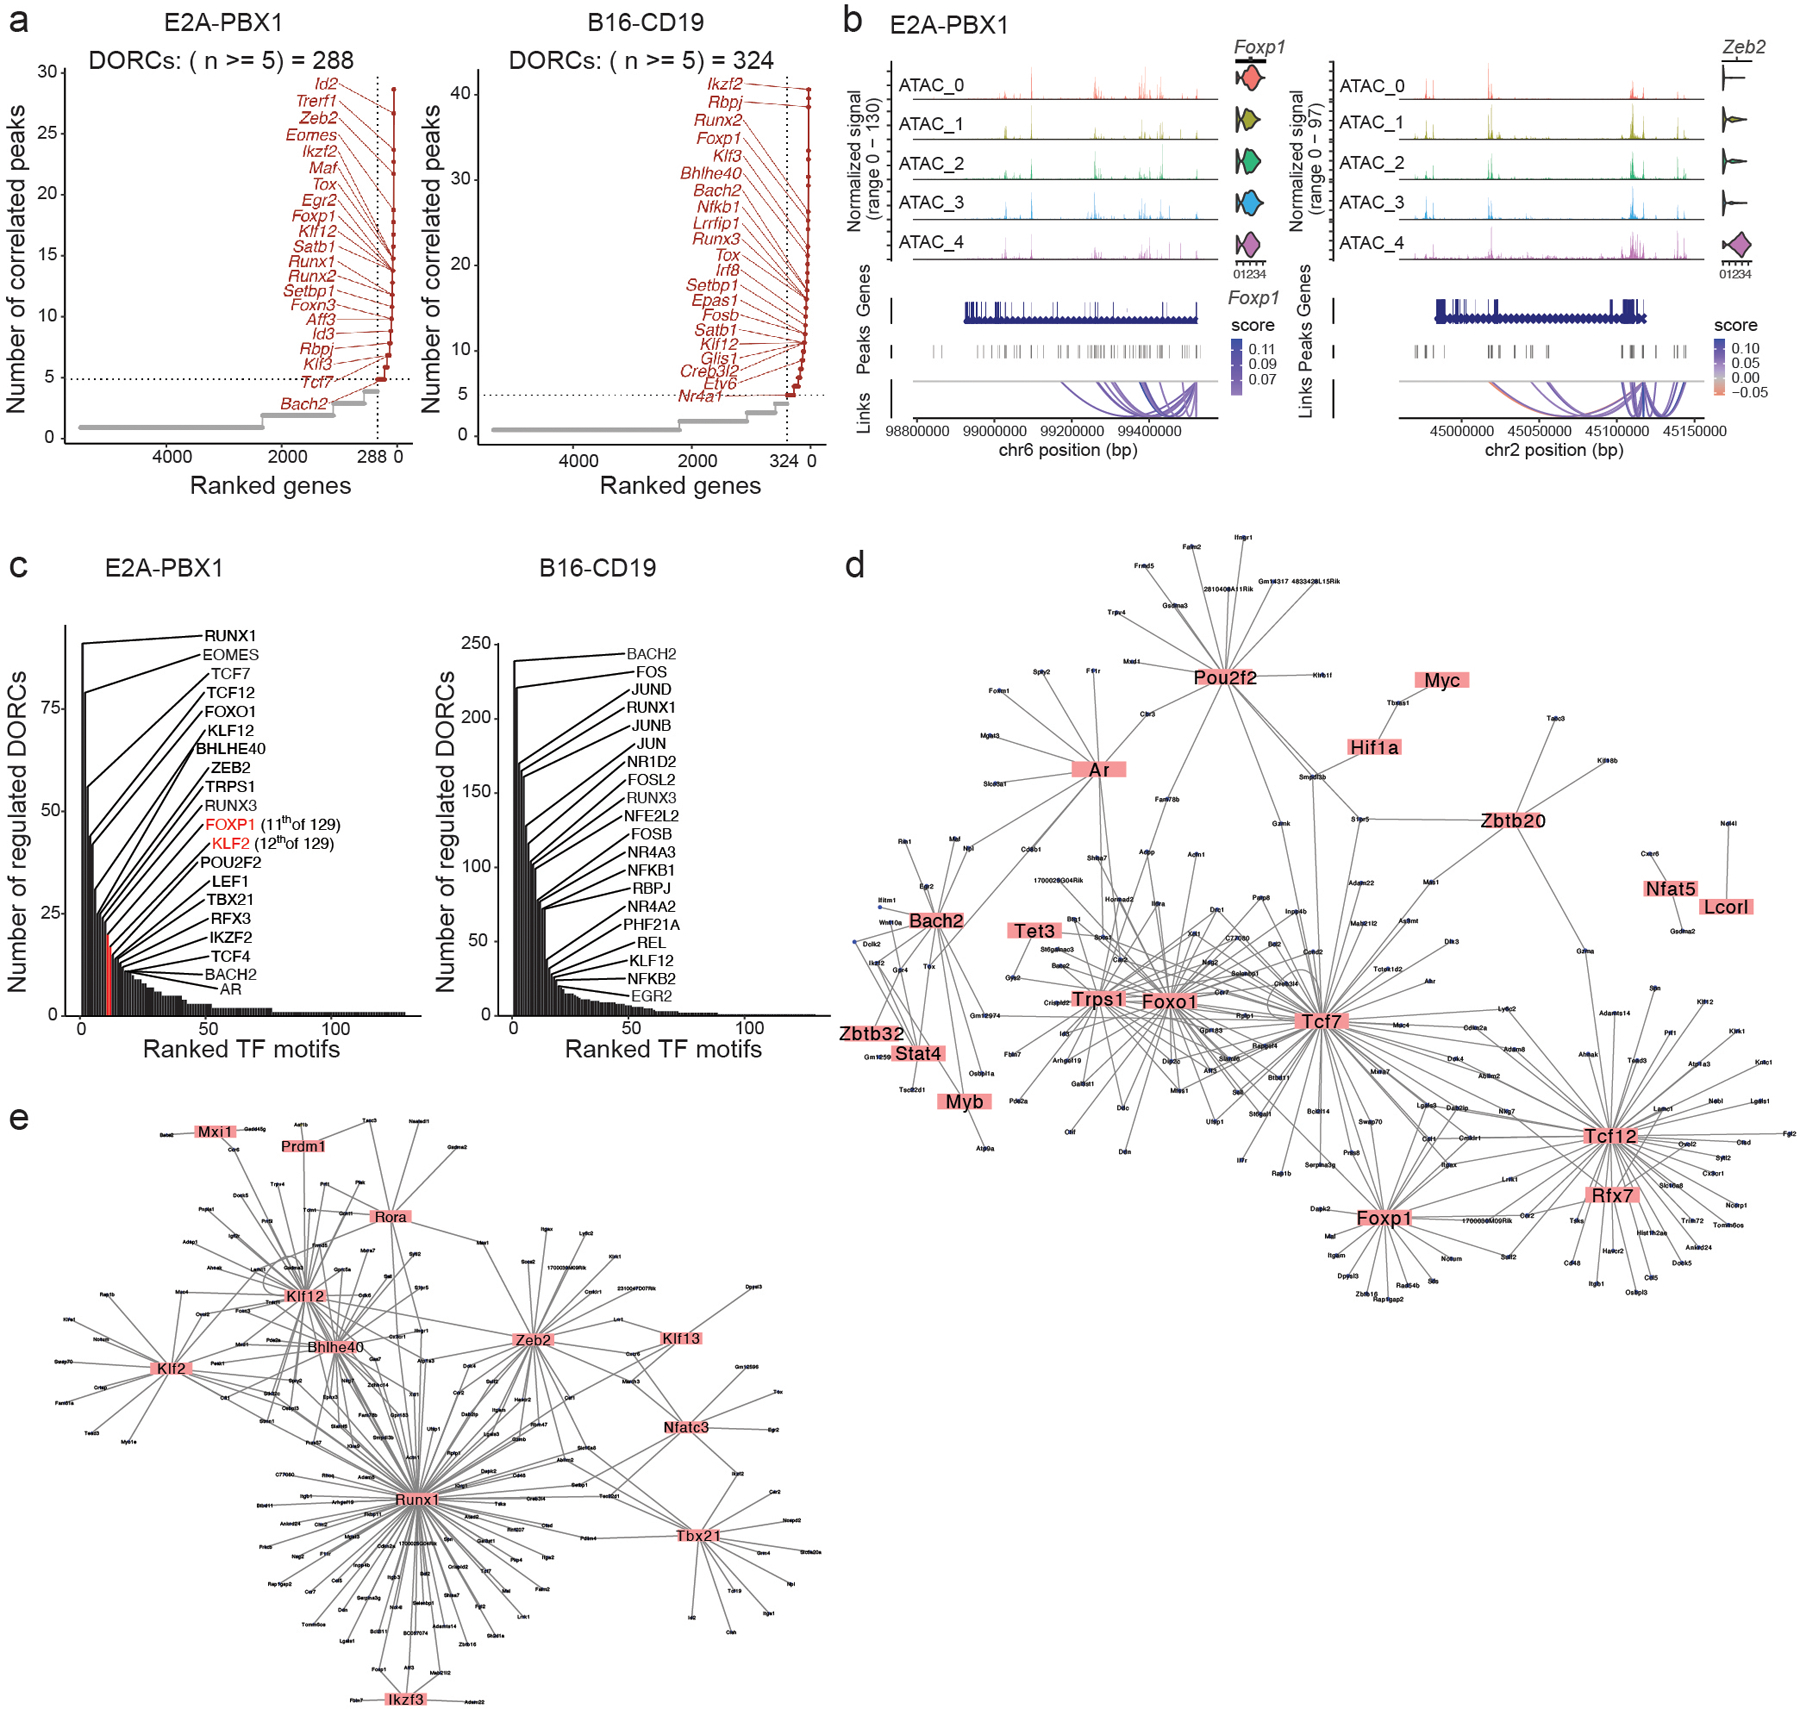
a, Genes in CD8+ CAR T cells isolated from the spleen in mice inoculated with E2A-PBX1 (left) or tumor-infiltrating CD8+ CAR T cells from B16-CD19-bearing mice (right) ranked by the number of correlated scATAC-seq peaks in the scATAC+RNA-seq data as in Fig. 2 and Fig. 3. DORCs were defined as gene loci with ≥5 peak-gene links. b, Genomic loci of Foxp1 (left) and Zeb2 (right) in CD8+ CAR T cells isolated from the spleen in mice inoculated with E2A-PBX1 as in a. Chromatin accessibility and mRNA level (violin plots) of the indicated genes in each CAR T cell subset defined by scATAC-seq as in Fig. 2a are shown. Loops represent correlation between the chromatin accessibility of linked peaks and mRNA level of the linked gene. c, Ranking of transcription factors expressed in CD8+ CAR T cells isolated from the spleen in mice inoculated with E2A-PBX1 (left) or the tumor of mice inoculated with B16-CD19 (right) based on the number of DORC-associated genes regulated by these transcription factors. d,e, Gene regulatory networks in CD8+ CAR Ts-like cells (d) or CD8+ CAR Teff-like cells (e) isolated from the spleen in mice inoculated with E2A-PBX1. Transcription factors are highlighted. Each line connects a transcription factor to a DORC-associated gene regulated by this transcription factor.
Next, we linked the transcription factors and their target genes by correlating the mRNA level of transcription factors with the accessibility at DORC-associated peaks enriched with the binding motifs of these transcription factors (Extended Data Fig. 4f,g). By ranking the number of DORC genes linked to each transcription factor, we identified key transcription factors in B cell ALL CD8+ CAR T cells (TCF1, ZEB2, FOXP1, KLF2, T-BET) or B16 CD8+ CAR T cells (AP1) (Fig. 4c). Transcription factors such as FOXP1, KLF2, BACH2, TCF1, EOMES and RUNX3 were shared between B16 and B cell ALL CD8+ CAR T cells (Extended Data Fig. 4h). Linking the transcription factors and their target DORC genes, we constructed gene regulatory networks (Extended Data Fig. 4i,j) that indicated that TCF1, FOXP1, BACH2 and FOXO1 were among the hub transcription factors in CD8+ CAR Ts-like cells, whereas KLF2, BHLHE40, ZEB2, RUNX1 and T-BET were among the hub transcription factors in CD8+ CAR Teff-like cells (Fig. 4d,e). Hub transcription factors in B16-infiltrating Tex-like CD8+ CAR T cells included RUNX transcription factors, JUND and RBPJ (Extended Data Fig. 4k). A TCF7 regulon that was associated with long persistence of CAR T cells in B cell ALL patients 17 showed enrichment of hub transcription factors from the Ts-like network (Extended Data Fig. 4l). In summary, lineage-defining transcription factors of CD8+ CAR Ts-like, Teff-like and Tex-like cells are controlled by high numbers of enhancers and positioned as hubs in regulatory networks.
FOXP1 limits Ts to Teff differentiation of CAR T cells
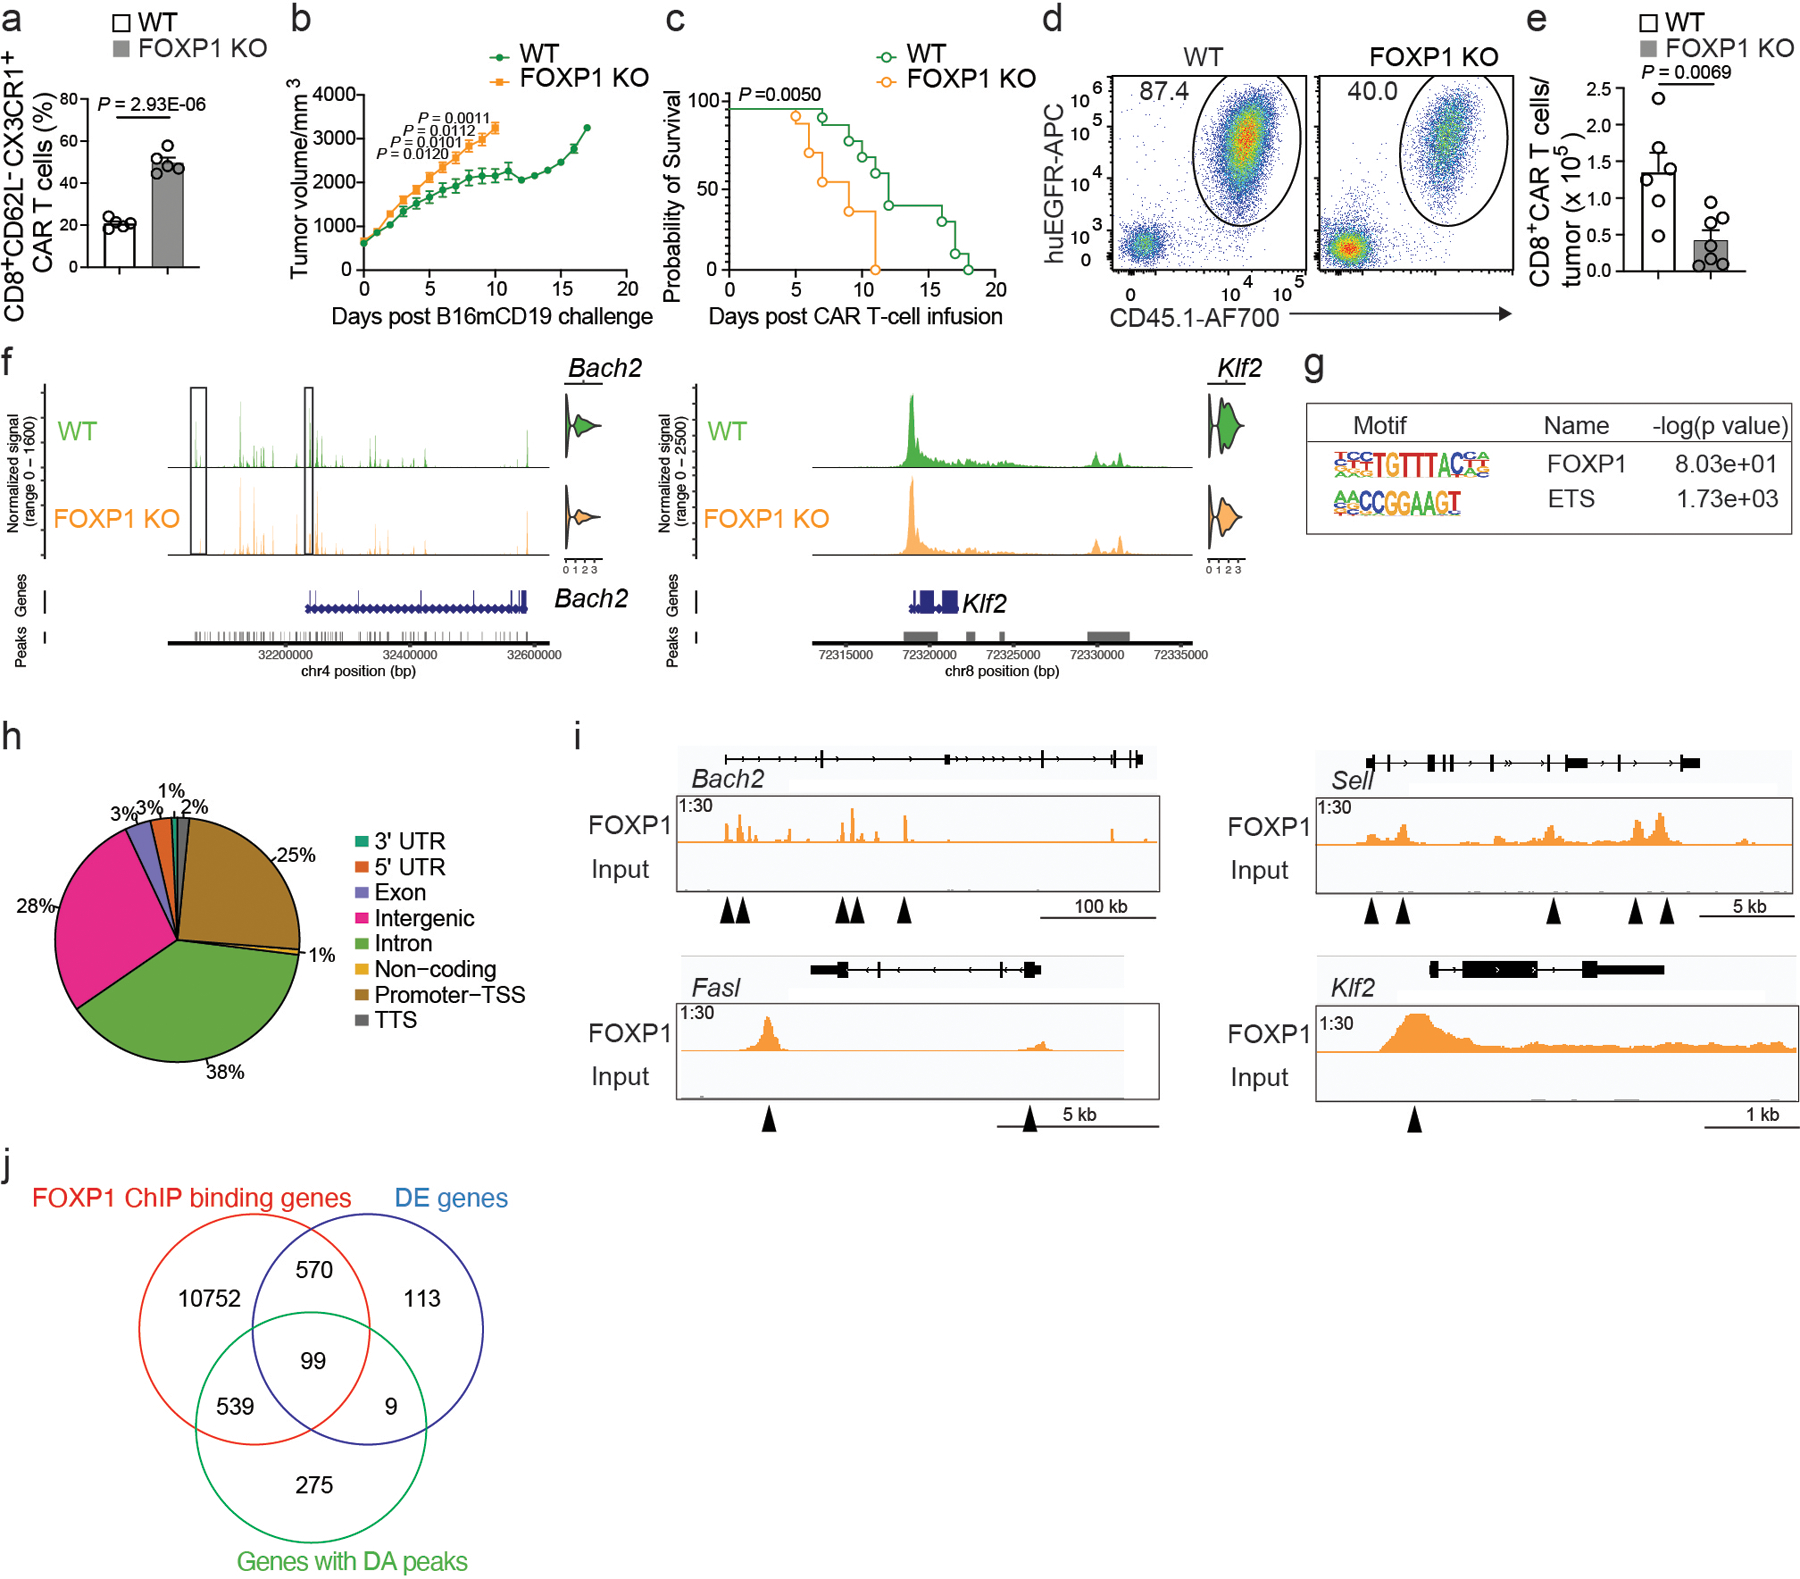
To determine the role of FOXP1 in the immune response of CAR T cells, we retrovirally transduced Foxp1 gRNA in Cas9+CD8+ CAR T cells to delete FOXP1 (hereafter FOXP1 KO). At day 7 post-infusion of CD8+ CAR T cells into mice inoculated with E2A-PBX1 B cell ALL, the number of FOXP1 KO CD8+ CAR T cells was two folds lower than wild-type CD8+ CAR T cells (Fig. 5a). FOXP1 KO CD8+ CAR T cells showed two-fold reduction in the frequency of CD62L+CX3CR1− CD8+ CAR Ts-like cells and decreased average expression of CD62L than wild-type CD8+ CAR T cells (Fig. 5b,c). Correspondingly, FOXP1 KO CD8+ CAR T cells exhibited higher frequencies of CX3CR1+KLRG1− Teff-like cells and CX3CR1+KLRG1+ TNK-like cells and upregulated CX3CR1 and KLRG1 (Fig. 5d,e and Extended Data Fig. 5a). In addition, FOXP1 KO CD8+ CAR T cells had lower frequency of TCF1+GzmB− CD8+ CAR T cells, decreased expression of TCF1, and increased expression of GzmB than wild-type CD8+ CAR T cells (Fig. 5f,g). B16-CD19 mice that received FOXP1 KO CD8+ CAR T cells showed impaired tumor control and shortened survival compared to mice that received wild-type CD8+ CAR T cells (Extended Data Fig. 5b,c). Less FOXP1 KO CD8+ CAR T cells infiltrated the B16 tumors at day 8 post-infusion (Extended Data Fig. 5d,e).
Figure 5. FOXP1 promotes the stemness and antitumor immunity of CAR T cells.
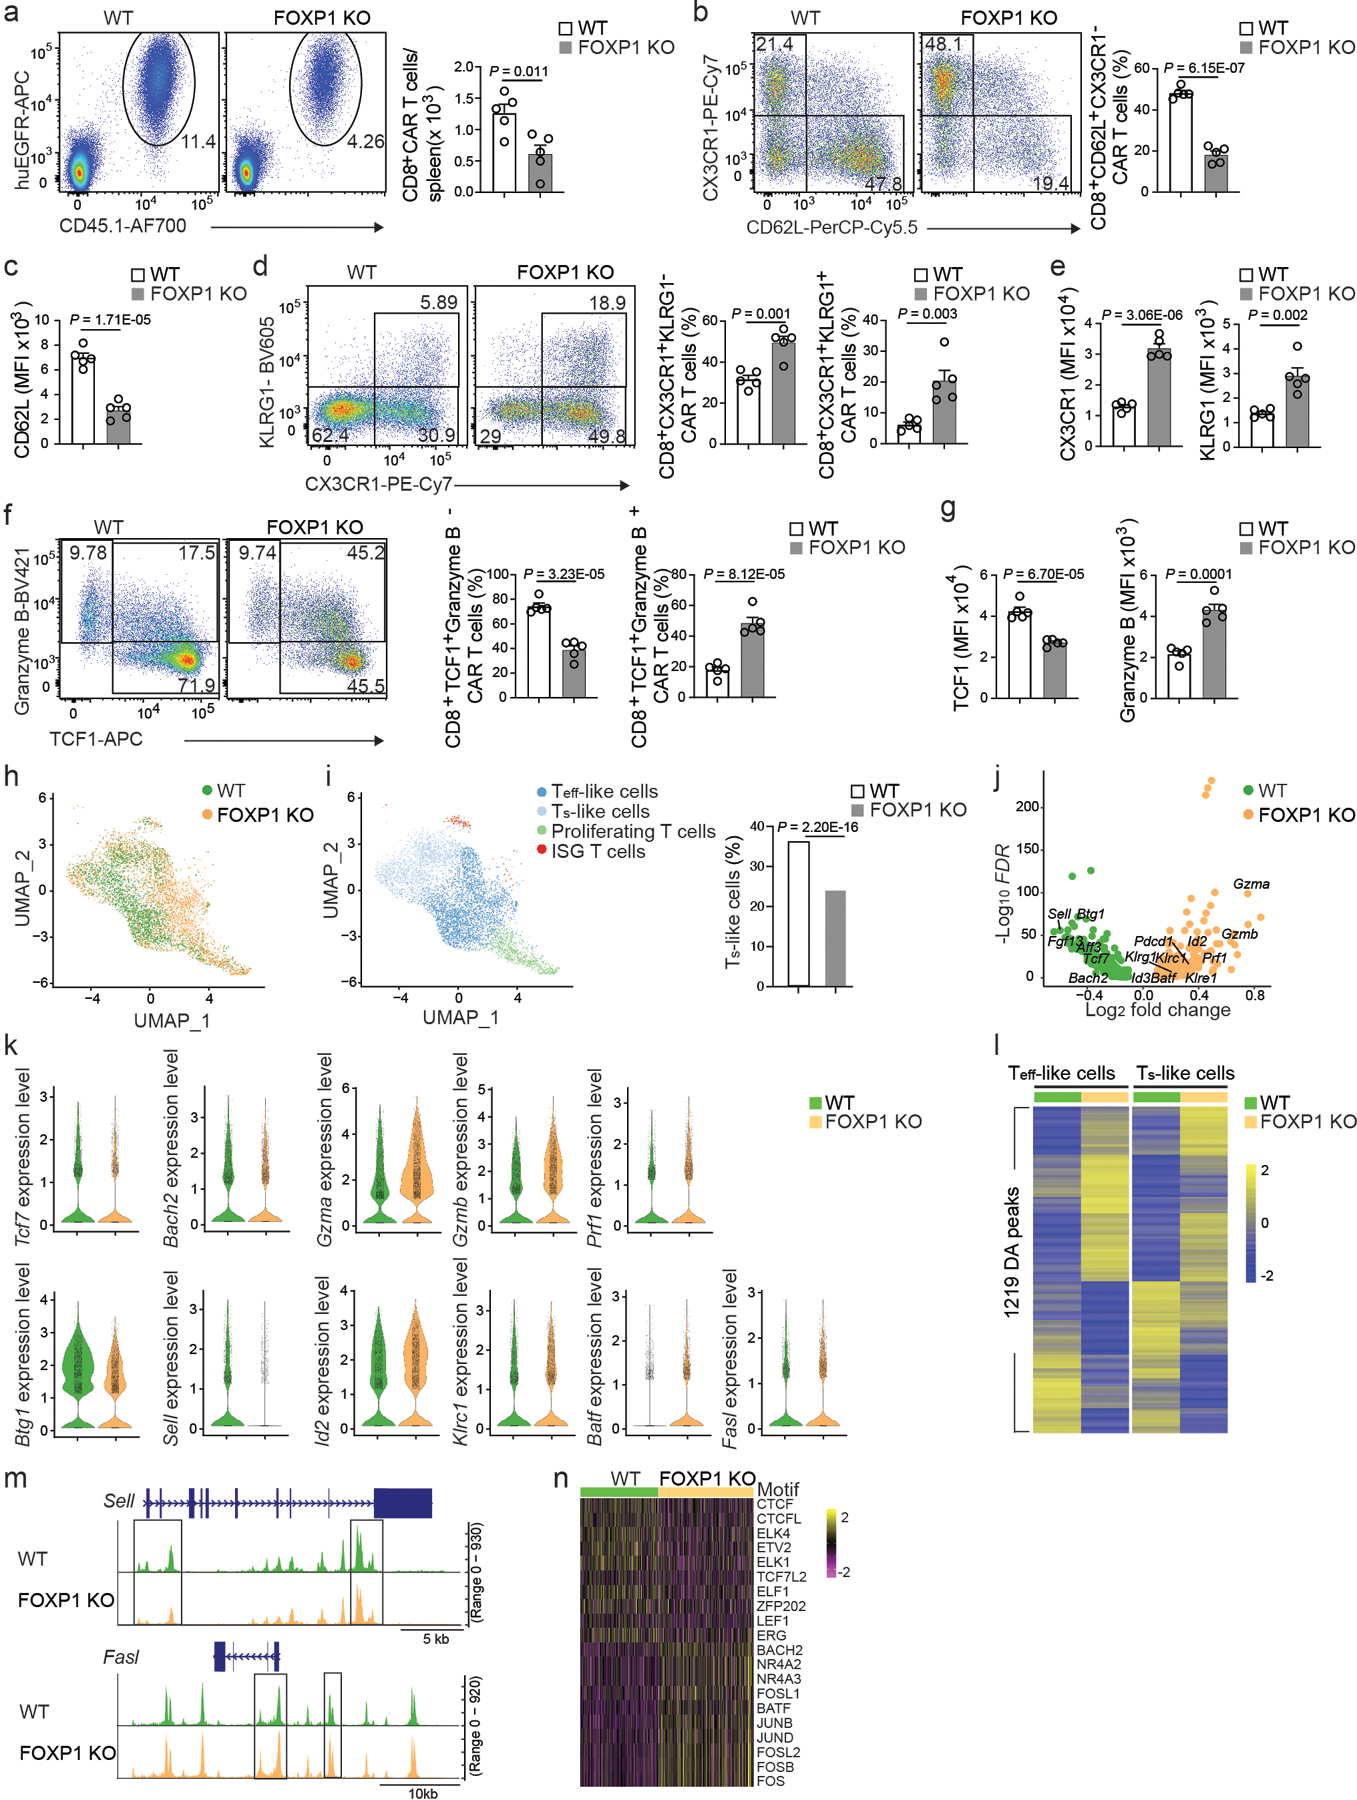
a, Representative flow cytometry plots (left, gated on live splenocytes) and the number (right) of splenic CD8+CD45.1+huEGFR+CD8+ CAR T cells at day 7 post-infusion in C57BL6 mice inoculated with E2A-PBX1 B cell ALL and injected with 106 Cas9+CD45.1+CD8+ T cells co-transduced with murine CD19 CAR co-expressing a truncated human EGFR (huEGFR) and control (WT) or Foxp1 gRNA (FOXP1 KO) construct (n=5 mice per group). b, Frequency of CD62L+CX3CR1−CD8+ CAR T cells in WT and FOXP1 KO CD8+ CAR T cells (n=5 mice per group) as in a. c, CD62L expression in WT and FOXP1 KO CD8+ CAR T cells (n=5 mice per group) as in a. d, The frequencies of the CX3CR1+KLRG1− Teff-like subset and CX3CR1+KLRG1+ TNK-like subset in WT and FOXP1 KO CD8+ CAR T cells (n=5 mice per group) as in a. e, Expression of CX3CR1 (left) and KLRG1 (right) in WT and FOXP1 KO CD8+ CAR T cells (n=5 mice per group) as in a. f, The frequencies of TCF1+granzyme B− and TCF1+granzyme B+ CD8+ CAR T cells in WT and FOXP1 KO CD8+ CAR T cells (n=5 mice per group) as in a. g, Expression of TCF1 (left) and granzyme B (right) in WT and FOXP1 KO CD8+ CAR T cells (n=5 mice per group) as in a. h, UMAP plot of scRNA-seq portion of the scATAC+RNA-seq data combined from WT and FOXP1 KO CD8+ CAR T cells at day 7 post-infusion as in a. Cells are color-coded based on the sample ID. i, UMAP plot of scRNA-seq portion of the scATAC+RNA-seq data from WT and FOXP1 KO CD8+ CAR T cells as in h (left) and the percentage of Ts-like cells among WT (n=3,071 cells) or FOXP1 KO (n=3,741 cells) CD8+ CAR T cells (right). Color codes are based on cluster IDs. j, Volcano plot showing the differentially expressed genes between WT and FOXP1 KO CD8+ CAR T cells as in h. k, Violin plots of expression of selected differentially expressed genes. l, Differentially accessible (DA) chromatin regions (peak) between WT and FOXP1 KO CD8+ CAR Teff-like (left) or Ts-like (right) cells based on the scATAC-seq portion of the scATAC+RNA-seq data in h. m, Chromatin accessibility at Sell and Fasl loci in WT and FOXP1 KO CD8+ CAR T cells as in l. Boxes highlight DA peaks. n, Heatmap of transcription factor motif enrichment in open chromatin profiles of WT and FOXP1 KO CD8+ CAR T cells as in l. (a-g) Data are representative of two independent experiments. Bar graphs represent the Mean ± SEM (a-g) or percentage (i). (a-g) Circles represent individual mice. Statistical significance is calculated with a two-sided Student’s t-test (a-g) or one-sided Chi-squared test (i).
Next, we performed scATAC+RNA-seq with wild-type and FOXP1 KO CD8+ CAR T cells isolated from mice with B cell ALL. FOXP1 KO CD8+ CAR T cells showed a marked shift in the single-cell transcriptional signature compared to wild-type CD8+ CAR T cells (Fig. 5h). FOXP1 KO CD8+ CAR T cells had reduced frequency of CD8+ CAR Ts-like cells, downregulated Ts-like signature genes, including Tcf7, Bach2, Sell and Btg129 and increased the expression of genes associated with cytotoxicity (Gzma, Gzmb and Prf1), TNK-like cells (Klrc1, Klre1 and Klrg1) 29 and effector differentiation (Id2 and Batf) 47–50 (Fig. 5i–k). FOXP1 KO CD8+ CAR T cells also showed an altered epigenetic program and altered chromatin accessibility in 1,219 loci (Fig. 5l). FOXP1 KO CD8+ CAR T cells showed decreased chromatin accessibility at Ts-like signature genes, such as Sell and Bach2, and greater chromatin accessibility at Teff-like signature gene Fasl (Fig. 5m and Extended Data Fig. 5f). FOXP1 KO CD8+ CAR T cells had increased enrichment of AP1, NR4A and BACH2 motifs at open chromatin loci, and decreased enrichment of LEF1, CTCF, ELK, ETV and ELF motifs (Fig. 5n). Chromatin immunoprecipitation (ChIP) of FOXP1 indicated that the majority of FOXP1 binding sites were in intronic (38%) or intergenic (28%) regions, whereas 25% of FOXP1 binding sites were in promoters (Extended Data Fig. 5g–i). 99 FOXP1-bound genes showed changes in chromatin accessibility and transcription in FOXP1 KO CD8+ CAR T cells (Extended Data Fig. 5j). The Ts-like signature genes Bach2 and Sell were bound by FOXP1 in CD8+ T cells and showed reduced transcription and chromatin accessibility in FOXP1 KO CD8+ CAR T cells, whereas the Teff-like associated gene Fasl was bound by FOXP1 in CD8+ T cells, but showed increased transcription and chromatin accessibility in FOXP1 KO CD8+ CAR T cells (Fig. 5k,m and Extended Data Fig. 5f,i). Thus, FOXP1 protected stemness and limited the transition from the CD8+ CAR Ts-like subset to Teff-like subset through transcriptional and epigenetic programming.
KLF2 favors differentiation to CAR Teff over CAR Tex cells
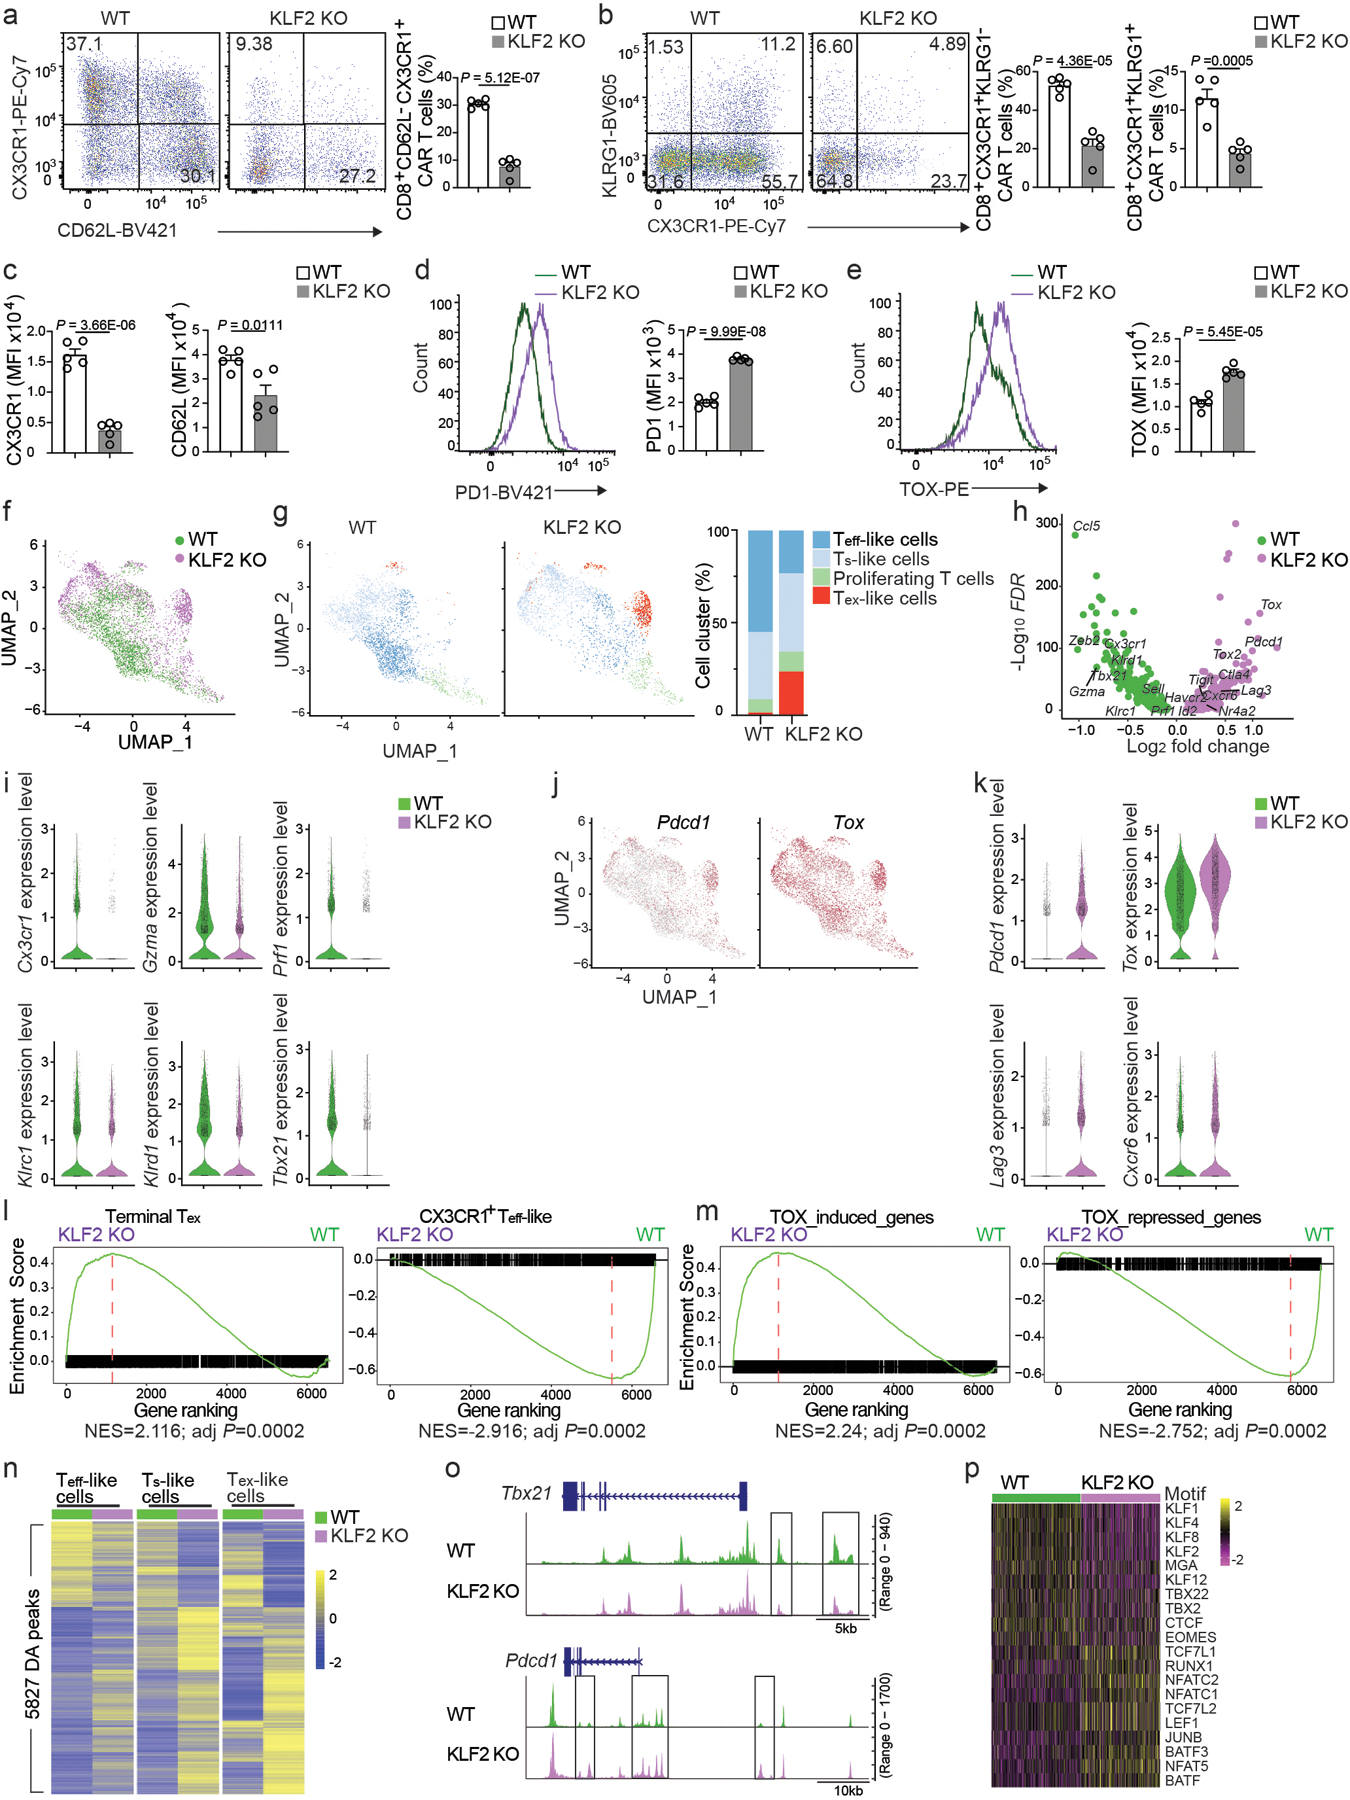
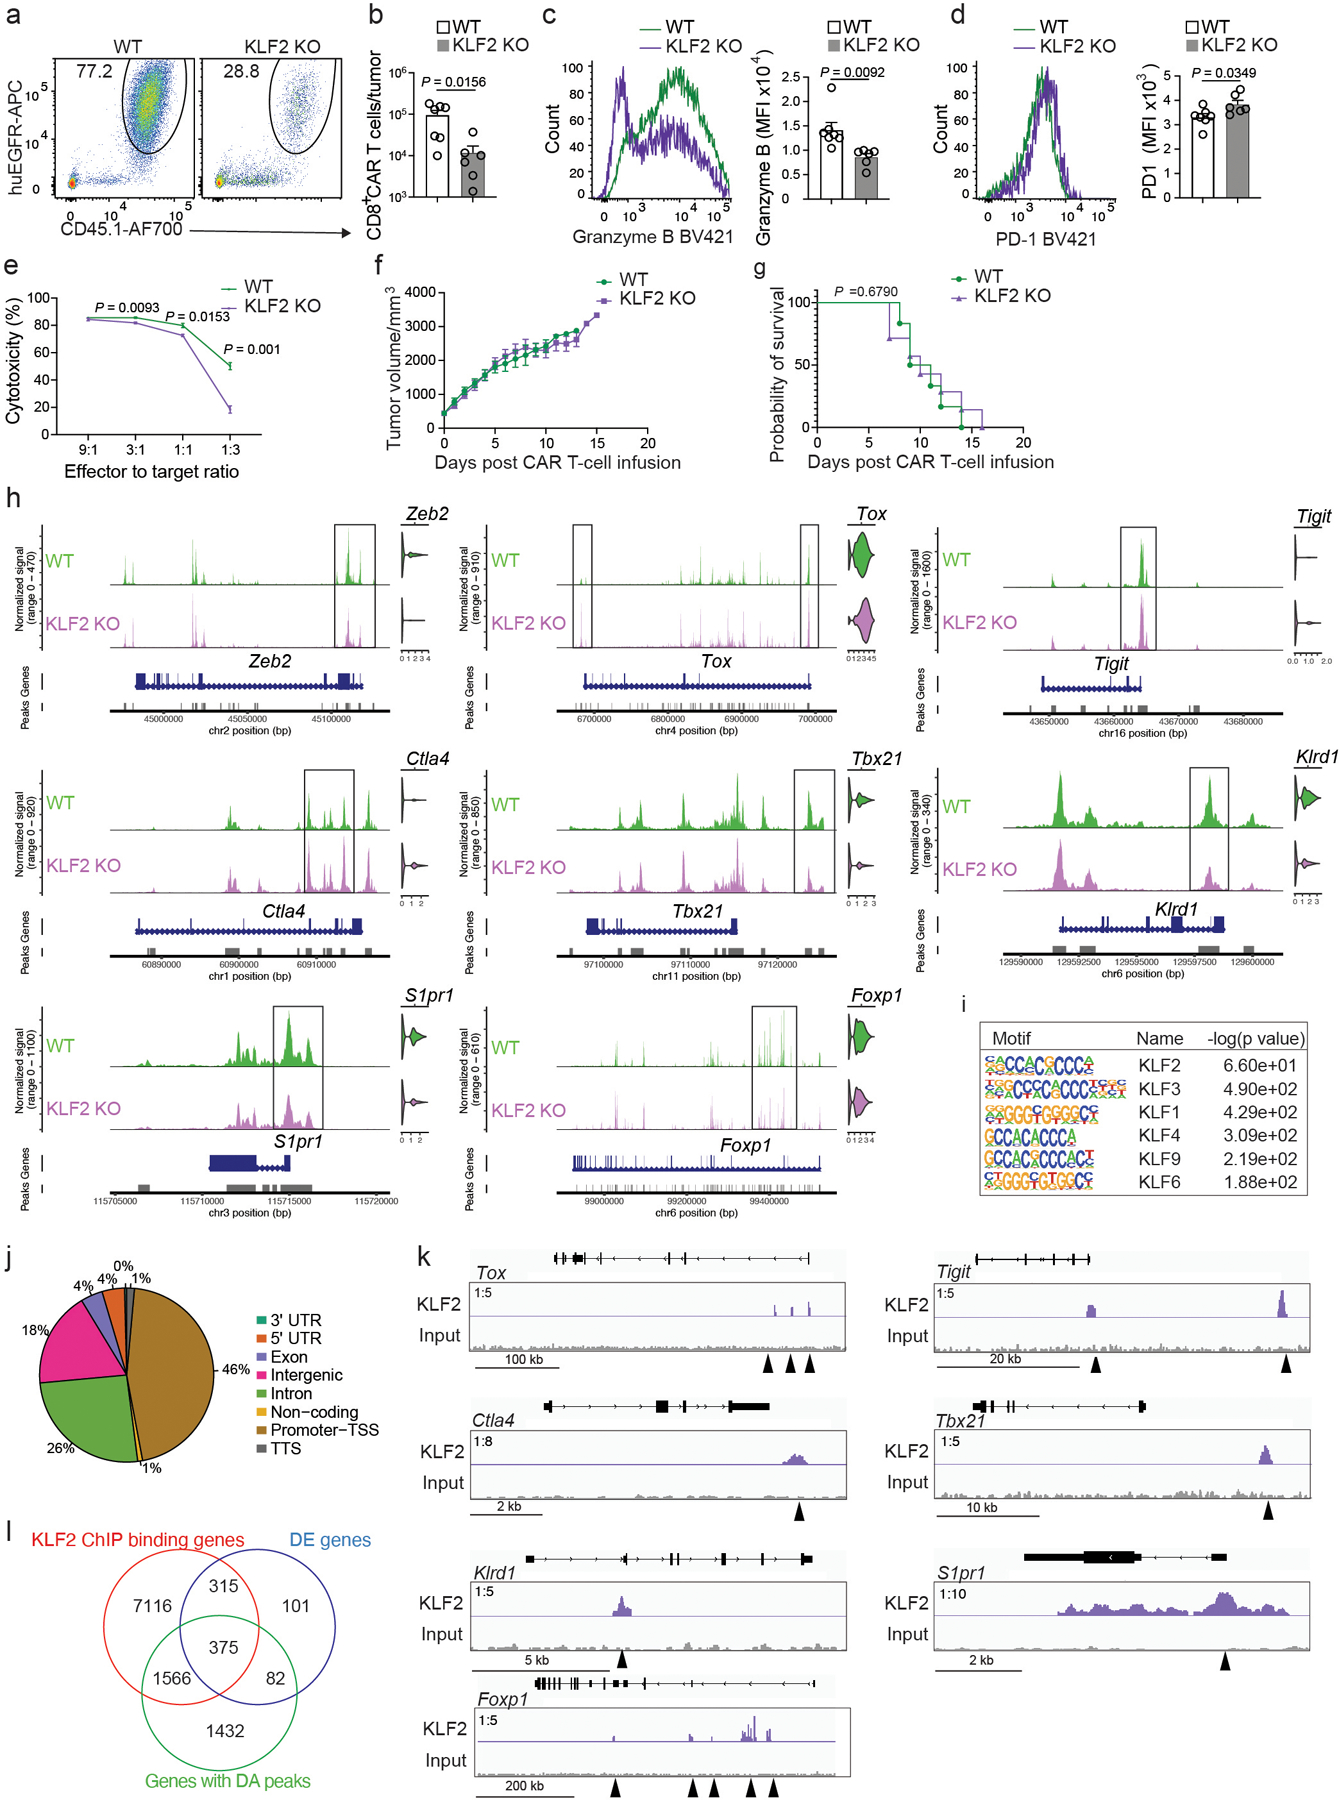
We did retroviral transduction of Klf2 gRNA in Cas9+ CD8+ CD19 CAR T cells (hereafter KLF2 KO). At day 7 post-infusion into mice with B cell ALL, there was more than twofold decrease in the frequencies of CX3CR1+KLRG1− Teff-like and CX3CR1+KLRG1+ TNK -like subsets and marked downregulation of CX3CR1 in KLF2 KO CD8+ CAR T cells compared to wild-type CD8+ CAR T cells (Fig. 6a–c). CD62L was downregulated, and the inhibitory receptor PD1 and the pro-exhaustion transcription factor TOX were upregulated in KLF2 KO CD8+ CAR T cells (Fig. 6c–e). At day 7 post-infusion in B16-CD19 mice, KLF2 KO CD8+ CAR T cells showed reduced tumor infiltration, downregulation of granzyme B and upregulation of PD1 (Extended Data Fig. 6a–d). In vitro, KLF2 KO CD8+ CAR T cells co-cultured with B16-CD19 cells had impaired killing capacity compared to wild-type CD8+ CAR T cells (Extended Data Fig. 6e). However, tumor sizes were similar in B16-CD19 mice that received KLF2 KO CD8+ CAR T cells or wild-type CD8+ CAR T cells (Extended Data Fig. 6f,g).
Figure 6. KLF2 promotes effector differentiation and suppresses exhaustion in CAR T cells.
a, Frequency of CD62L−CX3CR1+CD8+ CAR T cells in total CD8+ CAR T cells isolated at day 7 post-infusion from C57BL6 mice that were inoculated with E2A-PBX1 B cell ALL and injected with 106 Cas9+CD45.1+CD8+ T cells co-transduced with murine CD19 CAR co-expressing a truncated human EGFR (huEGFR) and control (WT) or Klf2 gRNA (KLF2 KO) construct (n=5 mice per group). b, The frequencies of CX3CR1+KLRG1− Teff-like and CX3CR1+KLRG1+ TNK-like WT and KLF2 KO CD8+ CAR T cells (n=5 mice per group) as in a. c-e, Expression of CX3CR1 (c left), CD62L (c right), PD1 (d) and TOX (e) in WT and KLF2 KO CD8+ CAR T cells (n=5 mice per group) as in a. f, scRNA-seq UMAP plot of scATAC+RNA-seq data from WT and KLF2 KO CD8+ CAR T cells at day 7 post-infusion as in a. Cells are color-coded based on the sample ID. g, Separate scRNA-seq UMAP plots of WT and KLF2 KO CD8+ CAR T cells described in f (left), and the percentage of Ts-like, Teff-like, Tex-like and proliferating cells in WT or KLF2 KO CD8+ CAR T cells described in f (right). Color-coded is based on cluster IDs. h, Volcano plot showing the differentially expressed genes between WT and KLF2 KO CD8+ CAR T cells as in f. i, Expression of selected genes downregulated in KLF2 KO CD8+ CAR T cells as in f. j, Feature plots of Pdcd1 and Tox expression in combined WT and KLF2 KO CD8+ CAR T cells as in f. k, Expression of selected genes upregulated in KLF2 KO CD8+ CAR T cells compared to WT CD8+ CAR T cells as in f. l,m, Comparison of the enrichment of “Terminal Tex” or “CX3CR1+ Teff-like” gene set (l) or “TOX-induced genes” or “TOX-repressed genes” gene set (m) by GSEA in WT CD8+ CAR T cells versus KLF2 KO CD8+ CAR T cells as in f. n, Differentially accessible (DA) chromatin regions (peak) between WT and KLF2 KO CD8+ CAR Teff-like, Ts-like or Tex-like cells identified by the scATAC-seq portion of the scATAC+RNA-seq data in f. o, Chromatin accessibility at Tbx21 and Pdcd1 loci in WT and KLF2 KO CD8+ CAR T cells. Boxes highlight DA peaks. p, Heatmap of transcription factor motif enrichment in open chromatin profiles of WT and KLF2 KO CD8+ CAR T cells as in n. (a-e) Data are representative of two independent experiments. Bar graphs represent the Mean ± SEM (a-e) or percentage (g). (a-e) Circles represent individual mice. Statistical significance in a-e is calculated with a two-sided Student’s t-test. Benjamini-Hochberg is used to calculate adjusted P values in l,m.
We simultaneously profiled the transcriptome and chromatin accessibility in single wild-type or KLF2 KO CD8+ CAR T cells. There was little overlap in the UMAP between wild-type and KLF2 KO CD8+ CAR T cells (Fig. 6f). KLF2 KO CD8+ CAR T cells showed reduced abundance of CD8+ CAR Teff-like cells and downregulated Teff-like or TNK-like signature genes, including Cx3cr1, Gzma, Prf1, Klrc1 (NKG2A), Klrd1 (CD94), Tbx21 (T-bet) and Zeb2 (Fig. 6g–i). A significant portion of KLF2 KO CD8+ CAR T cells, but not wild-type CD8+ CAR T cells, appeared in an area of the UMAP with greater expression Pdcd1 and Tox (Fig. 6j). KLF2 KO CD8+ CAR T cells also upregulated inhibitory receptors (Ctla4, Havcr2, Lag3 and Tigit), pro-exhaustion transcription factors (Nr4a2 and Tox2) and Cxcr6, a gene associated with terminally exhausted T cells23 (Fig. 6h,k). A gene-set enrichment analysis (GSEA) of our scRNA-seq data with published gene sets of Teff-like and terminal Tex CD8+ T cells35 indicated that KLF2 KO CD8+ CAR T cells enriched a terminal Tex signature and downregulated the Teff-like signature compared to wild-type CD8+ CAR T cells (Fig. 6l). KLF2 KO CD8+ CAR T cells enriched a gene signature upregulated by TOX and downregulated a gene signature repressed by TOX (Fig. 6m). KLF2 KO CD8+ CAR T cells showed a marked shift in the epigenome and changed chromatin accessibility in 5,827 loci (Fig. 6n). KLF2 KO CD8+ CAR T cells had reduced accessibility in genes encoding pro-effector transcription factors, such as Tbx21 and Zeb2 and increased chromatin accessibility of Pdcd1 and Tox (Fig. 6o and Extended Data Fig. 6h). KLF2 KO CD8+ CAR T cells had reduced chromatin accessibility at binding sites of KLF and TBX, and increased accessibility at binding sites for NFAT and AP1 transcription factors (Fig. 6p). ChIP-seq (Extended Data Fig. 6i–k) indicated that 46%, 18% and 26% of KLF2 binding sites were in promoters, intergenic or intronic regions, respectively (Extended Data Fig. 6j). 375 KLF2-bound genes were altered at both the transcriptional and epigenetic level in KLF2 KO CD8+ CAR T cells compared to wild-type CD8+ CAR T cells (Extended Data Fig. 6l). Pro-exhaustion genes including Tox, Tigit and Ctla4 were among the KLF2-bound genes that showed increased transcription and chromatin accessibility in KLF2 KO CD8+ CAR T cells, while Tbx21, S1pr1, Klrd1 and Foxp1 were among the KLF2-bound genes that had reduced transcription and chromatin accessibility in KLF2 KO CD8+ CAR T cells (Extended Data Fig. 6h,k). Thus, KLF2 controlled the transcriptional and epigenetic programs of CD8+ CAR T cells to promote their differentiation to the Teff-like subset and suppressed T cell exhaustion.
Discussion
In this study, by simultaneously profiling the transcriptome and epigenome in the same CAR T cells, we identified chromatin states, lineage-defining transcription factors and gene regulatory networks controlling the differentiation of CD8+ CAR T cells. FOXP1 was a hub transcription factor in the Ts-like network and promoted the antitumor response of CD8+ CAR T cells and limited differentiation from the Ts-like subset to the Teff-like subset. In contrast, KLF2, a hub transcription factor in the Teff-like network, drove a Teff-like program and suppressed a Tex-like program.
Our scATAC+RNA-seq profiling in CD8+ CAR T cells elucidated distinct epigenetic states with similar transcriptional profiles. For instance, CD8+ CAR TR-Ts-like cells defined by their scATAC-seq profiles showed greater accessibility at binding sites for T-box transcription factors, including EOMES, suggesting CD8+ CAR TR-Ts-like cells were epigenetically primed for the transcriptional program induced by T-box factors. In chronic viral infection, stem or progenitor-like CD8+ T cells increase the expression of Eomes when transitioning from early to late timepoint of infection29. The chromatin state associated with human Teff-like TILs shows greater accessibility at CX3CR1 51, similar to our observations. Comparison of the chromatin state in CD8+ CAR T cells in B16 melanoma and B cell ALL indicated that B16-infiltrating CAR T cells exhibited greater enrichment of NF-κB and NR4A motifs. Notably, prominent enrichment of NF-κB and NR4A motifs was also observed in the Tex subset of human TILs 51.
FOXP1 is known to maintain the quiescence of naive T cells 52. A study using Cd4-Cre to delete FOXP1 during T cell development and prior to activation showed that FOXP1 is required for the suppression of an antitumor T cell response by TGF-β41. We used retroviral CRISPR-Cas9 to delete FOXP1 after T cell activation and found that FOXP1 promoted the antitumor response of CD8+ CAR T cells, preserved their stemness, and limited differentiation to the Teff-like subset. Thus, FOXP1 may have different impacts on the antitumor T cell response before and after T cell activation. KLF2 is known to regulate the migration of T cells53. We found that KLF2 was a key determinant of the bifurcation of CD8+ CAR Ts-like cells into the Teff-like subset versus the Tex subset. Loss of KLF2 impaired effector differentiation, enhanced the exhaustion program, and upregulated Tox. KLF2 bound the Tox promoter and enhancer. These results indicated that KLF2 was a negative regulator of TOX expression in CD8+ CAR T cells. It is possible that KLF2 favored Ts-like to Teff-like differentiation by repressing TOX. As a negative regulator of TOX, KLF2 may represent a target to control the antitumor immunity of therapeutic T cells through modulating the decision between Teff and Tex differentiation. KLF2 KO CD8+ CAR T cells downregulated TNK-like markers and Zeb2, which is required for the development of TNK-like antiviral CD8+ T cells in chronic infection29. It is possible that sequential action by KLF2 and ZEB2 drives a Ts-like to Teff-like to TNK-like differentiation trajectory.
In summary, simultaneous profiling of single-cell chromatin accessibility and gene expression in single CAR T cells uncovered transcriptional and epigenetic programs controlled by hub transcription factors that functioned as molecular checkpoints of the Ts-like to Teff-like transition in CD8+ CAR T cells. Targeting key transcriptional regulators identified in this study may provide new avenues for controlling the differentiation and antitumor immunity of CD8+ CAR T cells.
Methods
Mice
C57BL6 (B6), B6.CD45.1, and Cas9 knock-in (B6J.129(Cg)-Gt(ROSA) 26Sortm1.1(CAG-cas9*,-EGFP)Fezh) mice were acquired from the Jackson Laboratory. Mice were age and sex matched in all experiments described in this study. All mice were maintained in a C57BL6 background and kept in Specific Pathogen Free (SPF) facilities. Mice were maintained on a 12-hour light/dark cycle. Room temperature range is 20-25°C. Humidity is at 30–70%. Mice are euthanized if the tumor diameter exceeds 2cm. The maximal tumor size was not exceeded in this study. All procedures involving animals were approved by the Institutional Animal Care and Use Committee at the UT Southwestern Medical Center (UTSW, protocol#103162 and 103111) and the University of Colorado Anschutz Medical Campus (CU, protocol#00900).
Tumor inoculation
The E2A-PBX1 and B16-CD19 cell lines were described in previous studies26,54. To generate B-cell-ALL-bearing mice, 1×10⁶ E2A-PBX1 cells were intravenously injected into each mouse as in a previous study25. To generate melanoma-bearing mice, 1×10⁶ B16-CD19 cells were subcutaneously injected into each mouse.
Retroviral transduction
To generate retroviruses, HEK293T cells were co-transduced with a retroviral plasmid and a pCL-Eco plasmid with TransIT-293 Transfection Reagent (Mirus Bio). Culture supernatants containing retroviruses were collected 2 days after transfection. The anti-murine CD19 CAR construct which contains a single-chain variable fragment derived from monoclonal antibody 1D3, a portion of the murine CD28 sequence, and the cytoplasmic region of murine CD3ζ was generated in a previous study55. Anti-murine CD19 CAR and a truncated human EGFR (huEGFR) were separated by a P2A linker and cloned into a MSCV retroviral plasmid. Mouse T cells were activated with plate-bound anti-CD3 and anti-CD28 and subsequently transduced twice with a mixture of retroviruses and polybrene at days 1 and 2 after activation. To delete FOXP1 or KLF2 in CAR T cells, activated CD8+ T cells from Cas9 knock-in mice were co-transduced with a mixture of retroviruses containing anti-CD19 CAR and retroviruses containing SL21 VEX plasmid expressing a Foxp1 gRNA (ATGCGGGTTCATGATTAGGG) or a Klf2 gRNA (GCCTTCACTAGCCGCCCGGG).
Treatment with CAR T cells
As previously described25, E2A-PBX1-bearing mice were administrated with a sublethal dose of irradiation (500cGy) at day 3 after inoculation of E2A-PBX1. One day after irradiation, mice were adoptively transferred with 1×10⁶ anti-CD19 CAR T cells. For treatment of B16-CD19-bearing mice, tumor-bearing mice were administrated with 500cGy irradiation at day 9 after tumor inoculation and received 5×10⁶ anti-CD19 CAR T cells one day after irradiation.
Flow cytometry and cell sorting
The antibodies and dyes as well as the dilutions used for flow cytometry and/or cell sorting in this study were as follows: anti-mouse CD45.1 FITC (A20, 1:200), anti-mouse CD45.1 Alexa Fluor700 (A20, 1:200), anti-mouse CD4 FITC (RM4-5, 1:200), anti-CD62L BV421 (MEL-14, 1:400), anti-mouse CD8a APC (53–6.7, 1:200), anti-mouse CD8a BV605 (53–6.7, 1:200), anti-mouse CD8a BV785 (53–6.7, 1:200), anti-human EGFR APC (AY13, 1:200), anti-human EGFR PE/Cy7 (AY13, 1:200), anti-mouse PD1 BV421 (RMP1-30, 1:200), anti-mouse KLRG1 BV605 (2F1, 1:200), anti-mouse CX3CR1 PE/Cy7 (SA011F11, 1:800) from BioLegend; anti-mouse B220 APC-eFluor780 (RA3-6B2, 1:200), anti-mouse Ly6G APC-eFluor780 (1A8, 1:200), anti-mouse NK1.1 APC-eFluor780 (PK136, 1:200), anti-mouse CD4 PerCP/Cy5.5 (RM4-5, 1:200), anti-mouse TIM3 APC (RMT3-23, 1:100), anti-mouse CD62L PerCP/Cy5.5 (MEL-14, 1:200), anti-TOX PE (TXRX10, 1:100), Goat anti-Rabbit IgG (H+L) APC (1:500), Live/dead Fixable Aqua Dead Cell Staining Kit (1:250) from Thermo Fisher; anti-mouse granzyme B BV421 (GB11, 1:200) from BD Biosciences; anti-TCF1 (C63D9, 1:200) from Cell Signaling Technology. Flow cytometry analysis and cell sorting were performed with a BD LSRFortessa™, a Cytek Aurora, and a BD FACSAria II using BD FACSDIVA (v9.0.1) or SpectroFlo (v3.0.3). Analysis was performed with FlowJo 10.8.0.
Sample preparation for single-cell RNA sequencing
We used Chromium Next GEM Single Cell 5’ Kit (10x Genomics) to generate scRNA-seq libraries according to the manufacturer’s protocol. Briefly, FACS-sorted cells from three or four biological replicates were labeled with TotalSeq™ Hashtag Antibody (Biolegend), mixed, and washed with PBS. Cells were loaded onto a Chromium Single Cell Chip G to generate barcoded DNA. Amplified cDNA was used to generate Gene expression libraries. Amplified DNA from Hashtag Antibodies (<200bp) was used to generate cell surface protein libraries. Libraries were sequenced on an Illumina NovaSeq 6000.
Sample preparation for single-cell ATAC+RNA sequencing
We used Chromium Next GEM Single Cell Multiome ATAC + Gene Expression Reagent Kits (10x Genomics) to generate scRNA-seq and scATAC-seq libraries according to the manufacturer’s protocol. Briefly, nuclei were isolated from lysed FACS-sorted cells according to the protocol of the manufacturer. Transposed nuclei were loaded onto the 10X Genomics Chromium Single Cell Controller. Gene expression libraries and ATAC libraries were generated and subsequently sequenced on an Illumina NovaSeq 6000.
Sample preparation for ChIP-seq
Chromatin crosslinking, nuclei isolation and chromatin fragmentation were performed with truChIP Chromatin Shearing Kit (Covaris). Anti-FOXP1 antibody (Cell Signaling Technologies, catalog#4402, clone#D35D10, 1:100) and anti-KLF2 antibody (Millipore Sigma, catalog#09-820, polyclonal Antibody, 1:100) were used to pull down sheared chromatin from CD8+ T cells. ChIP-seq libraries were constructed based on a published protocol56.
Data analysis for scRNA-seq
Fastq files of gene expression were aligned to mm10 using cellranger count (Cell Ranger v6.0.0), which performs filtering, barcode counting, and UMI counting at the same time. R (v4.1.3) and Seurat (v4.1.0) were used for downstream analysis. Different samples were merged with merge function (Seurat). Cells with 1,000 −3,500 detected genes, 2,000 – 15,000 detected RNA molecules and a percentage of mitochondrial genes below 5% were included. Cell cycle phase was determined using the CellCycleScoring function. The data were normalized and scaled with NormalizeData and ScaleData functions separately. The effect of cell cycle, number of detected molecules and the percentage of mitochondrial genes were regressed out during scaling (vars.to.regress = c(“CC.Difference”,”nCount_RNA”,”percent.mt”)). The top 2,000 variable genes were identified using FindVariableFeatures. TCR (^Tr.v) genes and Ig (^g.v) genes were excluded from the variable gene list for PCA analysis using function RunPCA. UMAP and neighbors were determined with the top 20 PCAs using RunUMAP function and FindNeighbors function, respectively. Myeloid cell contamination (which accounts for less than 2% of total cells) was removed after initial clustering. Clustering was calculated using FindClusters function. Marker genes were identified using function FindAllMarkers or FindMarkers for pairwise comparisons (min.pct = 0.1, logfc.threshold = 0.1). Demultiplexing of Hashtag antibodies was performed with HTODemux function. ScRNA-seq data was projected into reference mouse TIL single-cell atlas using ProjecTILs31.
Data analysis for scATAC+RNA-seq
Cell versus gene matrix of UMI counts for gene expression assay and cell versus fragment matrix for ATAC assay were generated from fastq files aligned to mm10 using cellranger-arc (v 2.0.0). Downstream analysis was performed using R (v4.1.3), Seurat (v4.1.0), Signac (v1.6.0), and FigR (v0.1.0). Cells were filtered based on the following criteria: percent.mt < 8, 2,000< nCount_RNA < 10,000, 1,000 < nCount_Feature < 3,000, 15,000 < nCount_ATAC < 50,000, pct_reads_in_peaks > 50, nucleosome_signal <2, TSS.enrichment >2. ScRNA-seq data were analyzed as described in the scRNA-seq analysis section to generate UMAPs and clusters.
Peaks were called using MACS2. Peaks in nonstandard chromosomes and mm10 genomic blacklist were removed using keepStandardChromosomes and subsetByOverlaps functions, respectively. Counts in each peak were quantified using FeatureMatrix function. The newly generated assay using the MACS2 peak set was used for downstream analysis. Data were normalized using RunTFIDF function. After top variable features were identified by FindTopFeatures (min.cutoff = 5), Latent Semantic Indexing (LSI) was performed with RunSVD. Non-linear dimension reduction and graph-based clustering were performed with 2:30 LSI using RunUMAP, FindNeighbors, and FindClusters. AverageExpression function was used to calculate average peak accessibility in each cluster. Differentially accessible peaks were determined using function FindAllMarkers or FindMarkers for pairwise comparisons (logfc.threshold = 0.1, min.pct = 0.05, test.use = ‘LR’, latent.vars = ‘nCount_peaks’). Motif information was added using AddMotifs function (genome = BSgenome.Mmusculus.UCSC.mm10). cisBP_mouse_pfms_2021.rds from FigR package was used as pfm. Per-cell motif activity score was calculated with chromVAR function. Differentiational motif activity score was calculated using FindAllMarkers or FindMarkers function. Heatmaps were generated with pheatmap (v1.0.12 ) or DoHeatmap function. LinkPeaks function was used to calculate correlation between gene expression and peak accessibility. The correlation result was used as peak-gene correlation for FigR. DORC genes were determined using dorcJPlot (cutoff=5). Regulations cores between DORC genes and transcription factors were calculated with runFigRGRN. CoveragePlot function was used to generate genome coverage tracks. Gene regulatory networks containing DORC genes and transcription factors were generated using Cytoscape (v3.7.2). Violin plots were generated using VlnPlot function. GSEA was calculated with ClusterProfiler v.3.14.0
Analysis of ChIP-seq data
Reads were mapped to the mouse genome (mm10) with Bowtie 1.1.1. Calling of transcription factor binding peaks was performed with MACS (v 1.4.2; default P-value threshold of 1E-5). Only peaks shared between two biological replicates were used for further analysis. Peak annotation and transcription factor motif enrichment were performed with Hypergeometric Optimization of Motif EnRichment program (HOMER) version 4.9. Transcription factor binding profiles were visualized with Integrative Genomics Viewer (IGV).
Statistics & Reproducibility
Statistical analysis was performed with Prism (GraphPad, v9.2.0) and R (v4.1.3). The sample sizes and statistical tests including two-tailed unpaired Student’s t-test, one-sided Chi-squared test, Benjamini–Hochberg, Fisher’s exact test, and log-rank test were described in the figure legends. Data distribution was assumed to be normal, but this was not formally tested. Differences were considered statistically significant when P < 0.05. No statistical method was used to predetermine sample size. Sample sizes were determined based on previously published studies on similar topics2,29. Results in this study were reproduced in at least two independent experiments unless otherwise noted. Specifically, scRNA-Seq and scATAC+RNA-Seq experiments were performed once with multiplexed or pooled samples from more than three mice per condition. ChIP-Seq experiments were performed using two biological replicates. No data were excluded from the analyses. All experiments were done with mice or cells derived from mice. Mice were randomly assigned to each group. No other randomization was performed. The Investigators were not blinded to allocation during experiments and outcome assessment.
Data availability
All data generated to support this study are available within the paper. The scRNA-seq, scATAC+RNA-seq and ChIP-seq data have been deposited at Gene Expression Omnibus (GSE202543).
Code availability
Custom code used for scRNA-seq, scATAC+RNA-seq and ChIP-seq data analyses are available from the corresponding author upon request.
Extended Data
Extended Data Fig. 1. CAR T cells in B cell ALL and melanoma show different single-cell transcriptomes.
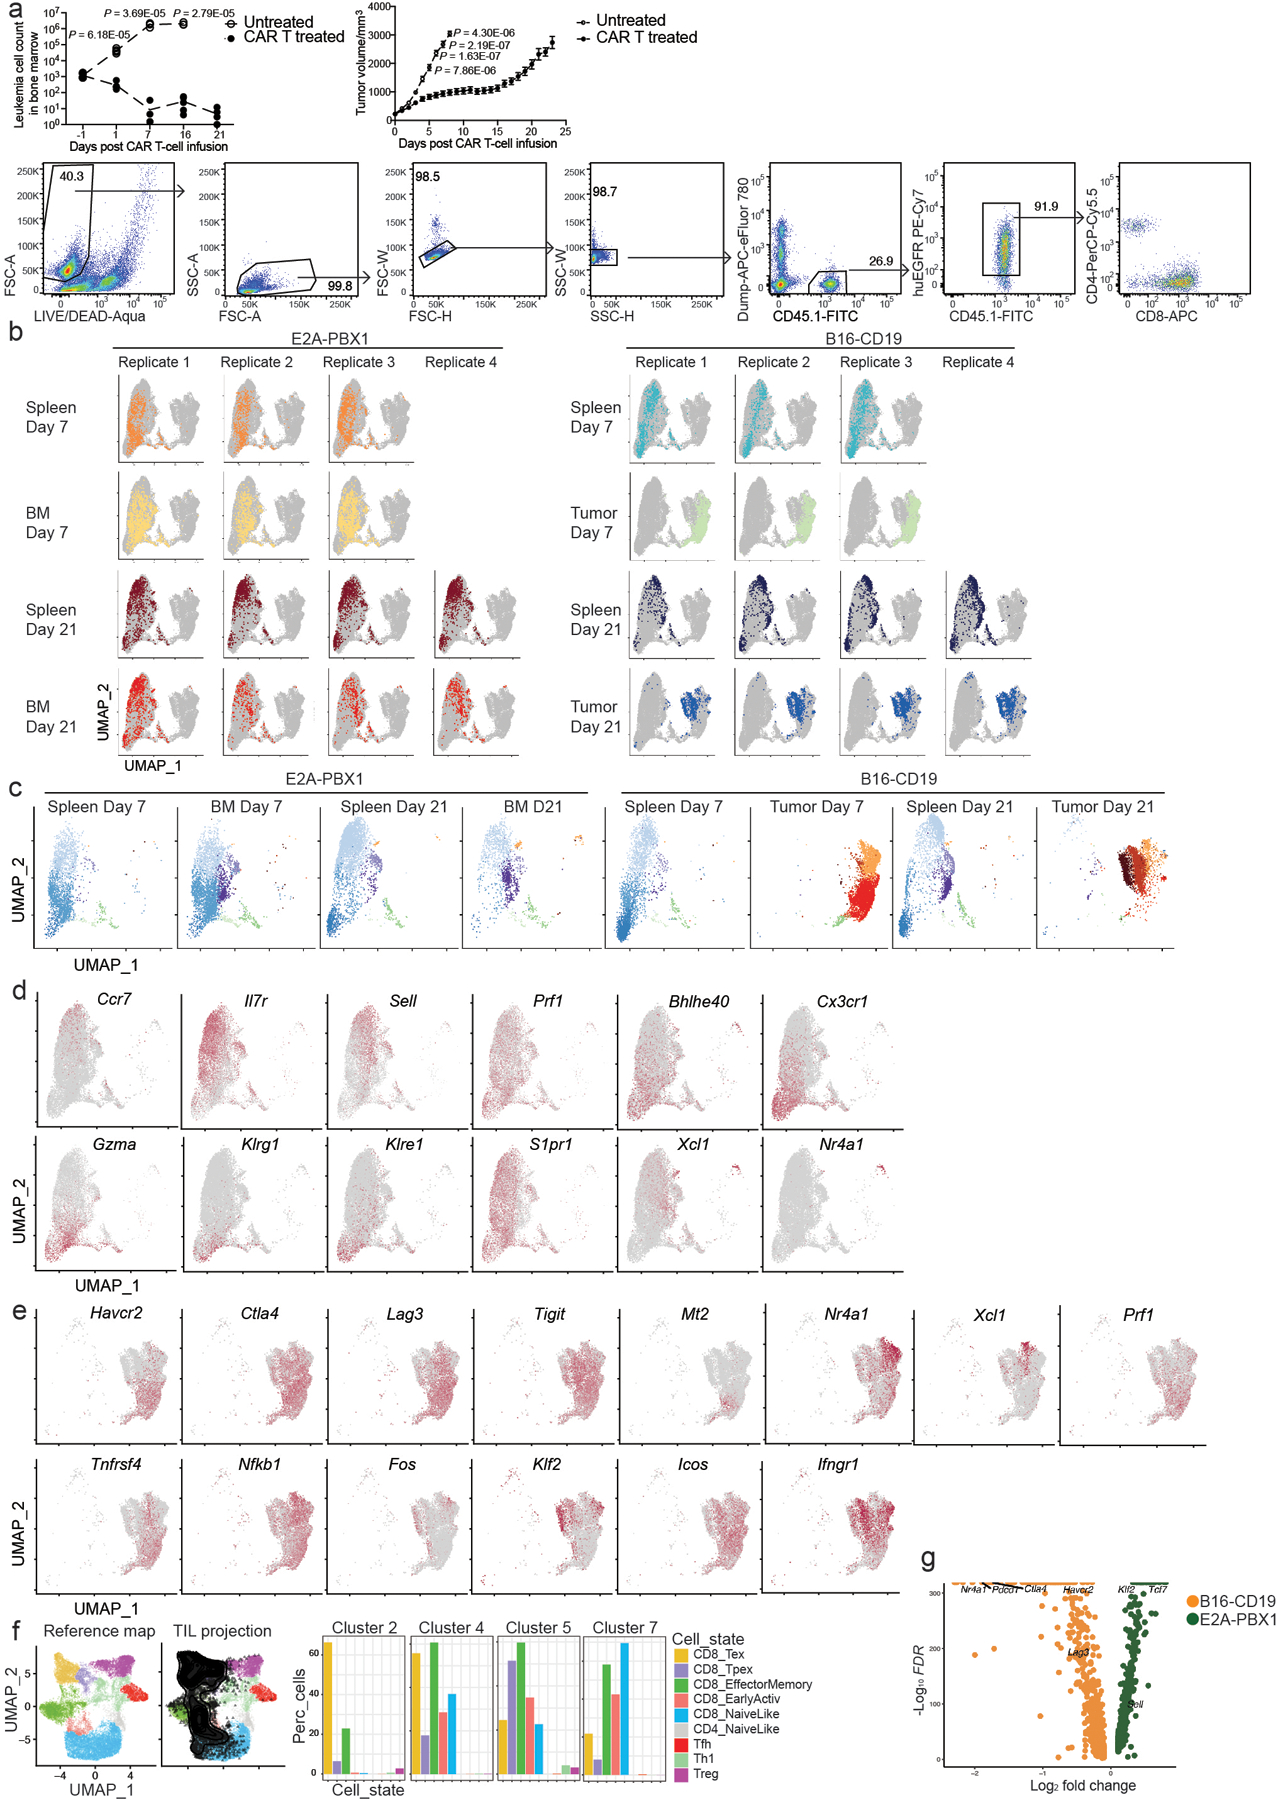
a, Upper left: Leukemia burden in E2A-PBX1-bearing mice that were untreated or treated with 106 CD19 CAR T cells (n = 5 mice per group). Upper right: Tumor burden in B16-CD19-bearing mice that were untreated (n = 5 mice) or treated (n = 10 mice) with 5 × 10⁶ CD19 CAR T cells. Lower panel: Gating strategy for sorting CAR T cells (huEGFR+CD45.1+) from treated mice as in Fig. 1a. b, scRNA-seq profiles from different individual mice (replicates) in the same group are shown in separate UMAP plots. scRNA-seq is described in Fig. 1a. c, scRNA-seq profiles from different individual mice (replicates) in the same group are combined in the same UMAP plot. Cells are color-coded by the cluster defined in Fig. 1a. d, Single-cell expression of selected genes in CD8+ CAR T cells from mice with E2A-PBX1 as described in Fig. 1e is shown in UMAP plots. The mRNA level is color-coded. e, Single-cell expression of selected genes in CD8+ CAR T cells infiltrating B16-CD19 as described in Fig. 1h is shown in UMAP plots. The mRNA level is color-coded. f, Projection of cells in clusters 2, 4, 5 and 7 (black) in Fig. 1a to the reference map of ProjecTILs. Color codes of T cell subsets are based on the original ProjecTILs paper. g, A volcano plot comparing the transcriptome between CD8+ CAR T cells responding to E2A-PBX1 and those responding to B16-CD19. Statistical significance in a is determined by a two-sided Student’s t-test. Data in a are representative of two independent experiments. Circles in a left panel represent individual mice. Data in a right panel represent Mean ± SEM.
Extended Data Fig. 2. scATAC+RNA-seq identifies heterogeneous chromatin states in CD8+ CAR T cells in B cell ALL.
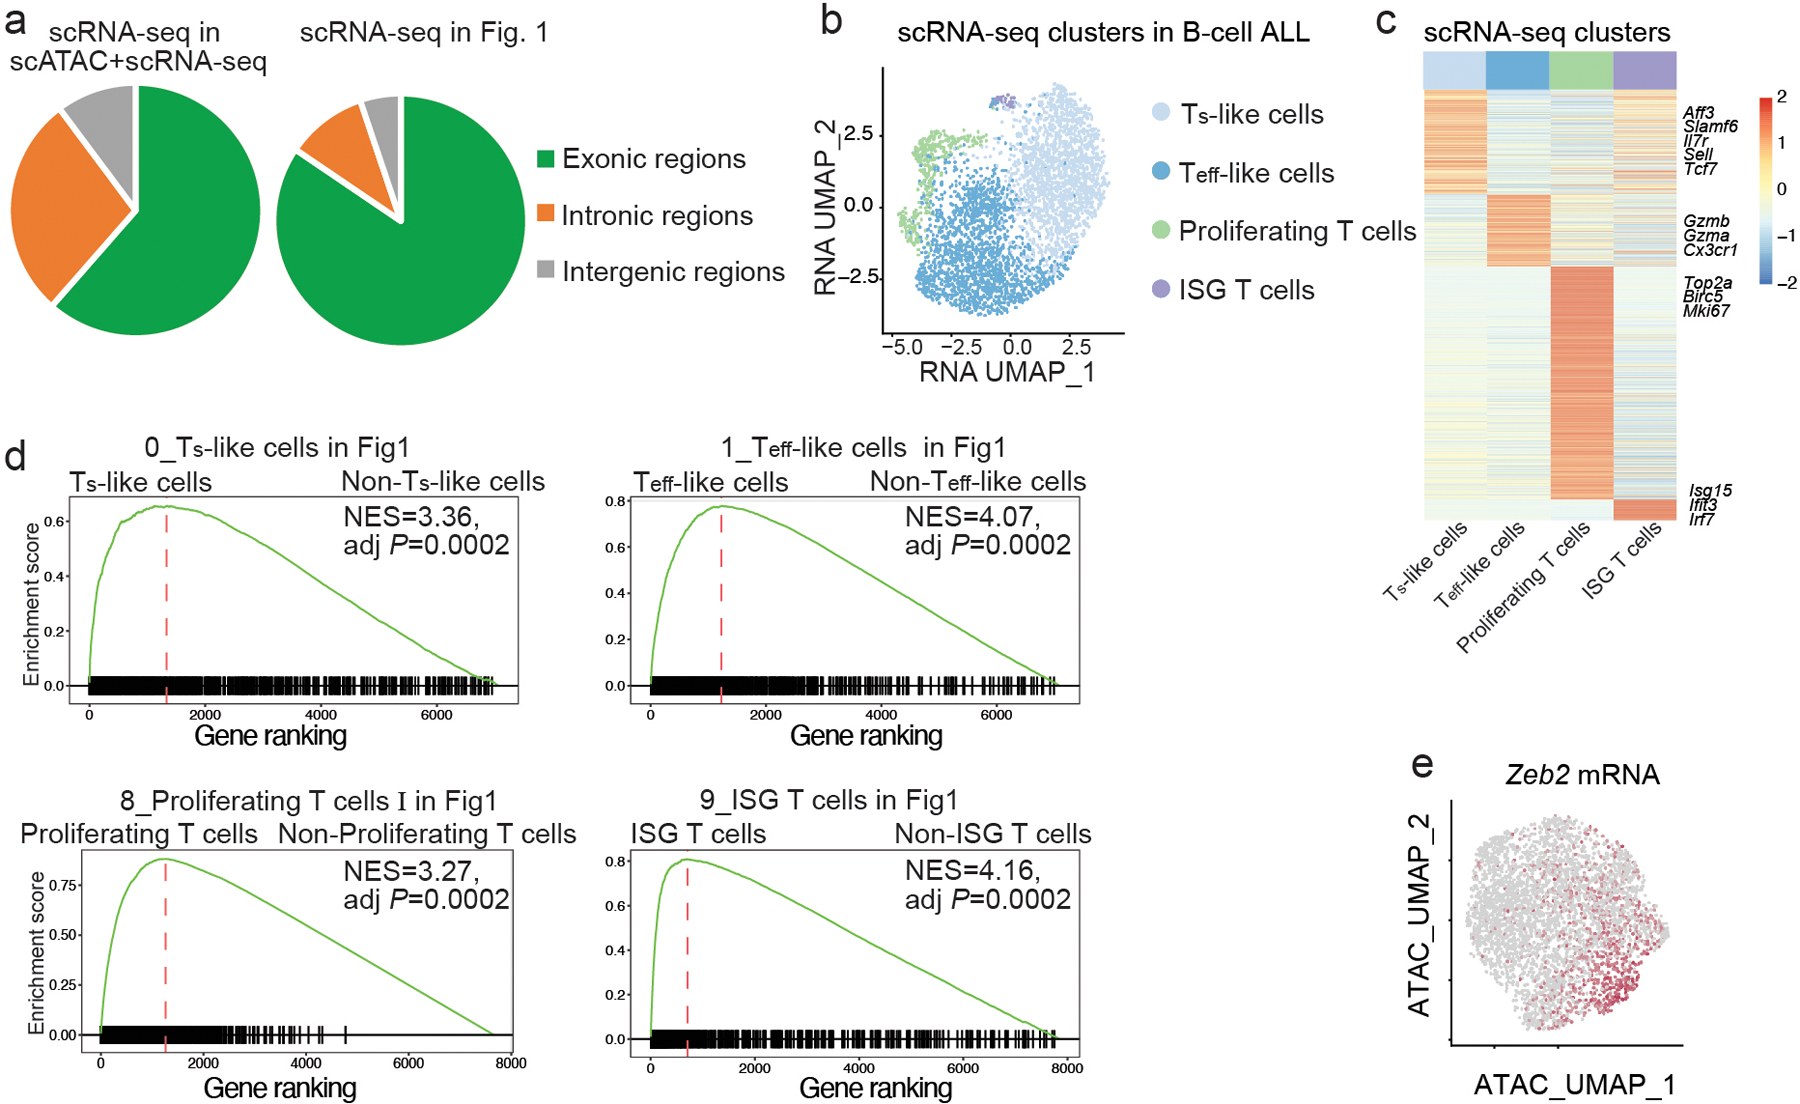
a, Percentages of mRNA reads from the scATAC+RNA-seq experiment (Fig. 2) or scRNA-seq experiment (Fig. 1) in the exonic, intronic or intergenic regions. b, A UMAP plot of CD8+ CAR T cells based on the RNA portion of scATAC+RNA-seq as in Fig. 2. Cells are color-coded based on cluster IDs defined by the transcriptome. c, A heatmap of differentially expressed genes in the Ts-like, Teff-like, ISG, and proliferating subsets defined in b. d, Gene-set enrichment analysis confirms the enrichment of Ts-like, Teff-like, proliferating or ISG signature defined in Fig. 1 in the corresponding clusters defined in Fig. 2a. The normalized enrichment score (NES) and adjusted P-value (adj P) are shown. Benjamini–Hochberg is used to calculate adjusted Pvalues. e, Single-cell expression of ZEB2 shown in a UMAP generated from the ATAC portion of scATAC+RNA-seq described in Fig. 2.
Extended Data Fig. 3. scATAC+RNA-seq reveals transcriptional programs controlling melanoma-infiltrating CAR T cells.
a, A UMAP plot of tumor-infiltrating CD8+ CAR T cells based on the RNA-portion of the scATAC+RNA-seq data as in Fig. 3. Cells are color-coded by the cluster defined by the transcriptome. b, A heatmap of differentially expressed genes in each cluster defined in a. c, Gene-set enrichment analysis confirms the enrichment of Tex-like, Nr4a1+ Tex-like, ISG, proliferating or Klf2+ Tex-like signature defined in Fig. 1 in the corresponding clusters defined in Fig. 3a. The normalized enrichment score (NES) and adjusted P-value (adj P) are shown. Benjamini–Hochberg is used to calculate adjusted P values. d, Upper panel: A volcano plot showing DA peaks between B16_ATAC_2 and B16_ATAC_1 defined in Fig. 3a. Lower panel: A volcano plot showing DA peaks between B16_ATAC_4 and B16_ATAC_0 defined in Fig. 3a. e, Violin plots show the single-cell enrichment of short-lived effector cell signature (SLEC) in ATAC-based clusters defined in Fig. 3a. f, Merged scATAC-seq profiles of CD8+ CAR T cells in E2A-PBX1 (Fig. 2) and B16-CD19 (Fig. 3) shown by sample types (left) or cluster IDs (right). g, Chromatin accessibility profiles at selected genes in CD8+ CAR T cells in E2A-PBX1 (red) and B16-CD19 (blue) as in f. h, Motif enrichment of selected transcription factors in merged scATAC-seq profiles of CD8+ CAR T cells in E2A-PBX1 and B16-CD19 as in f.
Extended Data Fig. 4. scATAC+RNA-seq identifies DORCs and gene regulatory networks in CAR T cells.
a, Peak-gene links are identified with scATAC+RNA-seq data in Figs. 2 and 3. The number of peak-gene links plotted against the distance to linked gene TSS in CD8+ CAR T cells from mice inoculated with E2A-PBX1 (left) or B16-CD19 (right). b, The distribution of the number of peaks linked to each gene (left) or the number of genes linked to each peak (right) as in a. c, Genomic loci of two representative DORCs, Nr4a1 and Tox, in CD8+ CAR T cells against B16-CD19. Chromatin accessibility and mRNA level (violin plots) of indicated genes in each CAR T cell subset defined by scATAC-seq as in Fig. 3a are shown. d,e, Heatmaps illustrating the expression of DORC-associated genes in each subset identified in CD8+ CAR T cells against E2A-PBX1 (d) as in Extended Data Fig. 2b or B16-CD19 (e) as in Extended Data Fig. 3a. f, g, Scatter plots showing all association between transcription factors and DORC-associated genes in CD8+ CAR T cells against E2A-PBX1 (f) or B16-CD19 (g) defined in Fig. 4a. For each transcription factor-DORC pair, transcription factor motif enrichment in the DORC is plotted against the correlation between the mRNA level of the enriched transcription factor and the chromatin accessibility of the DORC. h, Transcription factors with regulation score >1 in CD8+CAR T cells from mice inoculated with E2A-PBX1 or B16-CD19. i,j, Gene regulatory networks in CD8+ CAR T cells from mice inoculated with E2A-PBX1 (i) or B16-CD19 (j) are constructed using transcription factor to DORC-containing gene associations. k, Gene regulatory network in the Tex-like subset from B16-CD19. l, Enrichment of hub transcription factors from the Ts-like subset, Teff-like subset or Tex-like subset in the TCF7 regulon in B cell ALL patients treated with CD19 CAR T cells23. One-sided Fisher’s exact test was used to calculate the P Value.
Extended Data Fig. 5. FOXP1 KO CD8+ CAR T cells show a defective antitumor immune response and altered molecular program.
a, The experiment was set up as Fig. 5. Frequencies of CD62L−CX3CR1+ WT and FOXP1 KO CD8+ CAR T cells are shown in bar graphs (n = 5 mice per group). b,c, Tumor growth (b) and survival (c) of C57BL6 mice that were inoculated with B16-CD19 tumor and treated with 106WT (n = 10 mice) or FOXP1 KO (n = 11 mice) CD8+ CAR T cells at day 10 post-inoculation. d,e, Representative flow cytometry plots (d) and numbers (e) of WT (n = 6 mice) and FOXP1 KO (n = 7 mice) CD8+ CAR T cells in B16-CD19 tumors at day 8 after CAR T cell infusion as in b. f, The scATAC+RNA-seq data was generated as described in Fig. 5. Chromatin accessibility and expression of Bach2 and Klf2 in WT and FOXP1 KO CD8+ CAR T cells are shown. g, Motif enrichment of FOXP1 ChIP-seq peaks in CD8+ T cells. h, Distribution of FOXP1 ChIP-seq peaks in genomic features. i, FOXP1 binding sites at selected genes. j, A Venn diagram of FOXP1−bound genes in g, differentially expressed (DE) genes in Fig. 5j and genes with differentially accessible (DA) peaks in Fig. 5l. Statistical significance in a,b,e is determined by a two-sided Student’s t-test. Statistical significance in c is determined by log rank test. Data in a–e are representative of two independent experiments. Circles in a,e represent individual mice. Data in a,b,e represent the Mean ± SEM.
Extended Data Fig. 6. KLF2 is required for the differentiation of Teff-like CD8+ CAR T cells.
a,b, Representative flow cytometry plots (a) and numbers (b) of CD8+ CAR T cells in B16-CD19 tumors from C57BL6 mice that were inoculated with B16-CD19, treated with 106 WT (n = 7 mice) or KLF2 KO (n = 6 mice) CD8+ CAR T cells at day 10 post-inoculation and analyzed at day 7 after CAR T cell infusion. c,d, Expression of granzyme B (c) and PD1 (d) in B16-CD19-infiltrating WT (n = 7 mice) and KLF2 KO (n = 6 mice) CD8+ CAR T cells as in a. e, Killing of B16-CD19 cells that were co-cultured with WT or KLF2 KO (n = 3 independent cultures per group) CD8+ CAR T cells at different effector-to-target ratios. f,g, Tumor growth (f) and survival (g) of B16-CD19-bearing mice treated with WT or KLF2 KO (n = 7 mice per group) CD8+ CAR T cells as in a. h, The scATAC+RNA-seq data was generated as described in Fig. 6. Chromatin accessibility and expression of selected genes in WT and KLF2 KO CD8+ CAR T cells are shown. Boxes highlight DA peaks. i, Transcription factor motif enrichment at KLF2 ChIP-seq peaks. j, Distribution of KLF2 ChIP-seq peaks in genomic features. k, KLF2 binding at selected genes. l, A Venn diagram of KLF2-bound genes in i, differentially expressed (DE) genes in Fig. 6h and genes with differentially accessible (DA) peaks in Fig. 6n. Statistical significance in b-f is determined by a two-sided Student’s t-test. Statistical significance in g is determined by log rank test. Data in a–g are representative of two independent experiments. Circles in b-drepresent individual mice. Data in b-f represent the Mean ± SEM.
Supplementary Material
Acknowledgements
We thank A. Mobley (UTSW), A. Guzman (UTSW), P. Raj (UTSW), G. Hedlund (CU), T. Kupfer (CU), D. Diener (CU) and O. Cho (CU) for their outstanding technical support. MSCV-mCD19-CD28-Z-tEGFR plasmid and E2A-PBX1 cell line were generated by T. Fry and K. Degolier (CU). B16-CD19 cell line was a gift from C. June (UPenn). This research was supported in part by grants from NIH (AI158294, AG083398, AG056524), a CRI CLIP, a V Scholar Award, and an AFAR Grant for Junior Faculty to T. Wu; a grant from NIH (AI154450), a grant from CPRIT (RR210035), and a grant from DoD (HT94252310801) to C. Yao. The funders had no role in study design, data collection and analysis, decision to publish or preparation of the manuscript.
Footnotes
Competing interests
Dr. Tao Wang is a co-founder of NightStar Biotechnologies, Inc. The other authors declare no competing interests.
References
- 1.Wu T et al. The TCF1-Bcl6 axis counteracts type I interferon to repress exhaustion and maintain T cell stemness. Sci Immunol 1 (2016) 10.1126/sciimmunol.aai8593. [DOI] [PMC free article] [PubMed] [Google Scholar]
- 2.Im SJ et al. Defining CD8+ T cells that provide the proliferative burst after PD-1 therapy. Nature 537, 417–421 (2016) 10.1038/nature19330. [DOI] [PMC free article] [PubMed] [Google Scholar]
- 3.He R et al. Follicular CXCR5- expressing CD8(+) T cells curtail chronic viral infection. Nature 537, 412–428 (2016) 10.1038/nature19317. [DOI] [PubMed] [Google Scholar]
- 4.Utzschneider DT et al. T Cell Factor 1-Expressing Memory-like CD8(+) T Cells Sustain the Immune Response to Chronic Viral Infections. Immunity 45, 415–427 (2016) 10.1016/j.immuni.2016.07.021. [DOI] [PubMed] [Google Scholar]
- 5.Leong YA et al. CXCR5(+) follicular cytotoxic T cells control viral infection in B cell follicles. Nat Immunol 17, 1187–1196 (2016) 10.1038/ni.3543. [DOI] [PubMed] [Google Scholar]
- 6.Siddiqui I et al. Intratumoral Tcf1(+)PD-1(+)CD8(+) T Cells with Stem-like Properties Promote Tumor Control in Response to Vaccination and Checkpoint Blockade Immunotherapy. Immunity 50, 195–211 e110 (2019) 10.1016/j.immuni.2018.12.021. [DOI] [PubMed] [Google Scholar]
- 7.Kurtulus S et al. Checkpoint Blockade Immunotherapy Induces Dynamic Changes in PD-1(−)CD8(+) Tumor-Infiltrating T Cells. Immunity 50, 181–194 e186 (2019) 10.1016/j.immuni.2018.11.014. [DOI] [PMC free article] [PubMed] [Google Scholar]
- 8.Brummelman J et al. High-dimensional single cell analysis identifies stem-like cytotoxic CD8(+) T cells infiltrating human tumors. J Exp Med 215, 2520–2535 (2018) 10.1084/jem.20180684. [DOI] [PMC free article] [PubMed] [Google Scholar]
- 9.Burger ML et al. Antigen dominance hierarchies shape TCF1(+) progenitor CD8 T cell phenotypes in tumors. Cell 184, 4996–5014 e4926 (2021) 10.1016/j.cell.2021.08.020. [DOI] [PMC free article] [PubMed] [Google Scholar]
- 10.Connolly KA et al. A reservoir of stem-like CD8(+) T cells in the tumor-draining lymph node preserves the ongoing antitumor immune response. Sci Immunol 6, eabg7836 (2021) 10.1126/sciimmunol.abg7836. [DOI] [PMC free article] [PubMed] [Google Scholar]
- 11.Schenkel JM et al. Conventional type I dendritic cells maintain a reservoir of proliferative tumor-antigen specific TCF-1(+) CD8(+) T cells in tumor-draining lymph nodes. Immunity 54, 2338–2353 e2336 (2021) 10.1016/j.immuni.2021.08.026. [DOI] [PMC free article] [PubMed] [Google Scholar]
- 12.Eberhardt CS et al. Functional HPV-specific PD-1(+) stem-like CD8 T cells in head and neck cancer. Nature 597, 279–284 (2021) 10.1038/s41586-021-03862-z. [DOI] [PMC free article] [PubMed] [Google Scholar]
- 13.Yao C et al. Single-cell RNA-seq reveals TOX as a key regulator of CD8(+) T cell persistence in chronic infection. Nat Immunol 20, 890–901 (2019) 10.1038/s41590-019-0403-4. [DOI] [PMC free article] [PubMed] [Google Scholar]
- 14.Yao C et al. BACH2 enforces the transcriptional and epigenetic programs of stem-like CD8(+) T cells. Nat Immunol (2021) 10.1038/s41590-021-00868-7. [DOI] [PMC free article] [PubMed]
- 15.Sade-Feldman M et al. Defining T Cell States Associated with Response to Checkpoint Immunotherapy in Melanoma. Cell 175, 998–1013 e1020 (2018) 10.1016/j.cell.2018.10.038. [DOI] [PMC free article] [PubMed] [Google Scholar]
- 16.Miller BC et al. Subsets of exhausted CD8(+) T cells differentially mediate tumor control and respond to checkpoint blockade. Nat Immunol 20, 326–336 (2019) 10.1038/s41590-019-0312-6. [DOI] [PMC free article] [PubMed] [Google Scholar]
- 17.Chen GM et al. Integrative Bulk and Single-Cell Profiling of Premanufacture T-cell Populations Reveals Factors Mediating Long-Term Persistence of CAR T-cell Therapy. Cancer Discov 11, 2186–2199 (2021) 10.1158/2159-8290.CD-20-1677. [DOI] [PMC free article] [PubMed] [Google Scholar]
- 18.Fraietta JA et al. Determinants of response and resistance to CD19 chimeric antigen receptor (CAR) T cell therapy of chronic lymphocytic leukemia. Nat Med 24, 563–571 (2018) 10.1038/s41591-018-0010-1. [DOI] [PMC free article] [PubMed] [Google Scholar]
- 19.Deng Q et al. Characteristics of anti-CD19 CAR T cell infusion products associated with efficacy and toxicity in patients with large B cell lymphomas. Nat Med 26, 1878–1887 (2020) 10.1038/s41591-020-1061-7. [DOI] [PMC free article] [PubMed] [Google Scholar]
- 20.Zander R et al. CD4(+) T Cell Help Is Required for the Formation of a Cytolytic CD8(+) T Cell Subset that Protects against Chronic Infection and Cancer. Immunity 51, 1028–1042 e1024 (2019) 10.1016/j.immuni.2019.10.009. [DOI] [PMC free article] [PubMed] [Google Scholar]
- 21.Hudson WH et al. Proliferating Transitory T Cells with an Effector-like Transcriptional Signature Emerge from PD-1(+) Stem-like CD8(+) T Cells during Chronic Infection. Immunity 51, 1043–1058 e1044 (2019) 10.1016/j.immuni.2019.11.002. [DOI] [PMC free article] [PubMed] [Google Scholar]
- 22.Beltra JC et al. Developmental Relationships of Four Exhausted CD8(+) T Cell Subsets Reveals Underlying Transcriptional and Epigenetic Landscape Control Mechanisms. Immunity 52, 825–841 e828 (2020) 10.1016/j.immuni.2020.04.014. [DOI] [PMC free article] [PubMed] [Google Scholar]
- 23.Sandu I et al. Landscape of Exhausted Virus-Specific CD8 T Cells in Chronic LCMV Infection. Cell Rep 32, 108078 (2020) 10.1016/j.celrep.2020.108078. [DOI] [PubMed] [Google Scholar]
- 24.Yan Y et al. CX3CR1 identifies PD-1 therapy-responsive CD8+ T cells that withstand chemotherapy during cancer chemoimmunotherapy. JCI Insight 3 (2018) 10.1172/jci.insight.97828. [DOI] [PMC free article] [PubMed] [Google Scholar]
- 25.Yang Y et al. TCR engagement negatively affects CD8 but not CD4 CAR T cell expansion and leukemic clearance. Sci Transl Med 9 (2017) 10.1126/scitranslmed.aag1209. [DOI] [PMC free article] [PubMed] [Google Scholar]
- 26.Hu B et al. Augmentation of Antitumor Immunity by Human and Mouse CAR T Cells Secreting IL-18. Cell Rep 20, 3025–3033 (2017) 10.1016/j.celrep.2017.09.002. [DOI] [PMC free article] [PubMed] [Google Scholar]
- 27.Wilson TL et al. Common Trajectories of Highly Effective CD19-Specific CAR T Cells Identified by Endogenous T-cell Receptor Lineages. Cancer Discov 12, 2098–2119 (2022) 10.1158/2159-8290.CD-21-1508. [DOI] [PMC free article] [PubMed] [Google Scholar]
- 28.Good CR et al. An NK-like CAR T cell transition in CAR T cell dysfunction. Cell 184, 6081–6100 e6026 (2021) 10.1016/j.cell.2021.11.016. [DOI] [PMC free article] [PubMed] [Google Scholar]
- 29.Giles JR et al. Shared and distinct biological circuits in effector, memory and exhausted CD8(+) T cells revealed by temporal single-cell transcriptomics and epigenetics. Nat Immunol 23, 1600–1613 (2022) 10.1038/s41590-022-01338-4. [DOI] [PMC free article] [PubMed] [Google Scholar]
- 30.Singer M et al. A Distinct Gene Module for Dysfunction Uncoupled from Activation in Tumor-Infiltrating T Cells. Cell 166, 1500–1511 e1509 (2016) 10.1016/j.cell.2016.08.052. [DOI] [PMC free article] [PubMed] [Google Scholar]
- 31.Andreatta M, Corria-Osorio J, Muller S, Cubas R, Coukos G & Carmona SJ Interpretation of T cell states from single-cell transcriptomics data using reference atlases. Nat Commun 12, 2965 (2021) 10.1038/s41467-021-23324-4. [DOI] [PMC free article] [PubMed] [Google Scholar]
- 32.Salmon AJ et al. BHLHE40 Regulates the T-Cell Effector Function Required for Tumor Microenvironment Remodeling and Immune Checkpoint-Therapy Efficacy. Cancer Immunol Res (2022) 10.1158/2326-6066.CIR-21-0129. [DOI] [PMC free article] [PubMed]
- 33.Dominguez CX et al. The transcription factors ZEB2 and T-bet cooperate to program cytotoxic T cell terminal differentiation in response to LCMV viral infection. J Exp Med 212, 2041–2056 (2015) 10.1084/jem.20150186. [DOI] [PMC free article] [PubMed] [Google Scholar]
- 34.Omilusik KD et al. Transcriptional repressor ZEB2 promotes terminal differentiation of CD8+ effector and memory T cell populations during infection. J Exp Med 212, 2027–2039 (2015) 10.1084/jem.20150194. [DOI] [PMC free article] [PubMed] [Google Scholar]
- 35.Kasmani MY et al. Clonal lineage tracing reveals mechanisms skewing CD8+ T cell fate decisions in chronic infection. J Exp Med 220 (2023) 10.1084/jem.20220679. [DOI] [PMC free article] [PubMed] [Google Scholar]
- 36.Ma S et al. Chromatin Potential Identified by Shared Single-Cell Profiling of RNA and Chromatin. Cell 183, 1103–1116 e1120 (2020) 10.1016/j.cell.2020.09.056. [DOI] [PMC free article] [PubMed] [Google Scholar]
- 37.Alfei F et al. TOX reinforces the phenotype and longevity of exhausted T cells in chronic viral infection. Nature 571, 265–269 (2019) 10.1038/s41586-019-1326-9. [DOI] [PubMed] [Google Scholar]
- 38.Khan O et al. TOX transcriptionally and epigenetically programs CD8(+) T cell exhaustion. Nature 571, 211–218 (2019) 10.1038/s41586-019-1325-x. [DOI] [PMC free article] [PubMed] [Google Scholar]
- 39.Scott AC et al. TOX is a critical regulator of tumour-specific T cell differentiation. Nature 571, 270–274 (2019) 10.1038/s41586-019-1324-y. [DOI] [PMC free article] [PubMed] [Google Scholar]
- 40.Stephen TL et al. SATB1 Expression Governs Epigenetic Repression of PD-1 in Tumor-Reactive T Cells. Immunity 46, 51–64 (2017) 10.1016/j.immuni.2016.12.015. [DOI] [PMC free article] [PubMed] [Google Scholar]
- 41.Stephen TL et al. Transforming growth factor beta-mediated suppression of antitumor T cells requires FoxP1 transcription factor expression. Immunity 41, 427–439 (2014) 10.1016/j.immuni.2014.08.012. [DOI] [PMC free article] [PubMed] [Google Scholar]
- 42.Paley MA et al. Progenitor and terminal subsets of CD8+ T cells cooperate to contain chronic viral infection. Science 338, 1220–1225 (2012) 10.1126/science.1229620. [DOI] [PMC free article] [PubMed] [Google Scholar]
- 43.Backer RA et al. A central role for Notch in effector CD8(+) T cell differentiation. Nat Immunol 15, 1143–1151 (2014) 10.1038/ni.3027. [DOI] [PMC free article] [PubMed] [Google Scholar]
- 44.Wang D et al. The Transcription Factor Runx3 Establishes Chromatin Accessibility of cis-Regulatory Landscapes that Drive Memory Cytotoxic T Lymphocyte Formation. Immunity 48, 659–674 e656 (2018) 10.1016/j.immuni.2018.03.028. [DOI] [PMC free article] [PubMed] [Google Scholar]
- 45.Shan Q et al. The transcription factor Runx3 guards cytotoxic CD8(+) effector T cells against deviation towards follicular helper T cell lineage. Nat Immunol 18, 931–939 (2017) 10.1038/ni.3773. [DOI] [PMC free article] [PubMed] [Google Scholar]
- 46.Milner JJ et al. Runx3 programs CD8(+) T cell residency in non-lymphoid tissues and tumours. Nature 552, 253–257 (2017) 10.1038/nature24993. [DOI] [PMC free article] [PubMed] [Google Scholar]
- 47.Omilusik KD, Nadjsombati MS, Shaw LA, Yu B, Milner JJ & Goldrath AW Sustained Id2 regulation of E proteins is required for terminal differentiation of effector CD8(+) T cells. J Exp Med 215, 773–783 (2018) 10.1084/jem.20171584. [DOI] [PMC free article] [PubMed] [Google Scholar]
- 48.Kurachi M et al. The transcription factor BATF operates as an essential differentiation checkpoint in early effector CD8+ T cells. Nat Immunol 15, 373–383 (2014) 10.1038/ni.2834. [DOI] [PMC free article] [PubMed] [Google Scholar]
- 49.Chen Y et al. BATF regulates progenitor to cytolytic effector CD8(+) T cell transition during chronic viral infection. Nat Immunol 22, 996–1007 (2021) 10.1038/s41590-021-00965-7. [DOI] [PMC free article] [PubMed] [Google Scholar]
- 50.Seo H et al. BATF and IRF4 cooperate to counter exhaustion in tumor-infiltrating CAR T cells. Nat Immunol 22, 983–995 (2021) 10.1038/s41590-021-00964-8. [DOI] [PMC free article] [PubMed] [Google Scholar]
- 51.Riegel D et al. Integrated single-cell profiling dissects cell-state-specific enhancer landscapes of human tumor-infiltrating CD8(+) T cells. Mol Cell 83, 622–636 e610 (2023) 10.1016/j.molcel.2022.12.029. [DOI] [PubMed] [Google Scholar]
- 52.Feng X, Wang H, Takata H, Day TJ, Willen J & Hu H Transcription factor Foxp1 exerts essential cell-intrinsic regulation of the quiescence of naive T cells. Nat Immunol 12, 544–550 (2011) 10.1038/ni.2034. [DOI] [PMC free article] [PubMed] [Google Scholar]
- 53.Carlson CM et al. Kruppel-like factor 2 regulates thymocyte and T-cell migration. Nature 442, 299–302 (2006) 10.1038/nature04882. [DOI] [PubMed] [Google Scholar]
- 54.Jacoby E et al. CD19 CAR immune pressure induces B-precursor acute lymphoblastic leukaemia lineage switch exposing inherent leukaemic plasticity. Nat Commun 7, 12320 (2016) 10.1038/ncomms12320. [DOI] [PMC free article] [PubMed] [Google Scholar]
- 55.Kochenderfer JN, Yu Z, Frasheri D, Restifo NP & Rosenberg SA Adoptive transfer of syngeneic T cells transduced with a chimeric antigen receptor that recognizes murine CD19 can eradicate lymphoma and normal B cells. Blood 116, 3875–3886 (2010) 10.1182/blood-2010-01-265041. [DOI] [PMC free article] [PubMed] [Google Scholar]
- 56.Schmidl C, Rendeiro AF, Sheffield NC & Bock C ChIPmentation: fast, robust, low-input ChIP-seq for histones and transcription factors. Nat Methods 12, 963–965 (2015) 10.1038/nmeth.3542. [DOI] [PMC free article] [PubMed] [Google Scholar]
Associated Data
This section collects any data citations, data availability statements, or supplementary materials included in this article.
Supplementary Materials
Data Availability Statement
All data generated to support this study are available within the paper. The scRNA-seq, scATAC+RNA-seq and ChIP-seq data have been deposited at Gene Expression Omnibus (GSE202543).