Abstract
Extracellular vesicles (EVs) are cell derived, naturally produced, membrane-bound, nanoscale particles that are linked to cell-cell communication and propagation of diseases. Here, we report the design and testing of in-plane nanofluidic devices for resistive pulse measurements of EVs derived from bovine milk and human breast cancer cells. The devices were fabricated in plane with three nanopores in series to determine particle volume and diameter, two pore-to-pore regions to measure the electrophoretic mobility and zeta potential, and an in-line filter to prevent cellular debris and aggregates from entering the nanopore region. Devices were tested with and without the channels coated with a short-chain PEG-silane to minimize electroosmotic flow and permit an accurate measurement of the electrophoretic mobility and zeta potential of the EVs. To enhance throughput of EVs, vacuum was applied to the waste reservoir to increase particle frequencies up to 1000 min−1. The nanopores had cross sections of 200 nm wide and 200 nm deep and easily resolved EV diameters from 60 to 160 nm. EVs from bovine milk and human breast cancer cells had similar particle size distributions, but their zeta potentials differed by 2-fold, −8 ± 1 and −4 ± 1 mV, respectively.
Keywords: nanofluidics, resistive-pulse sensing, in-plane devices, extracellular vesicles, zeta potential
Graphical Abstract
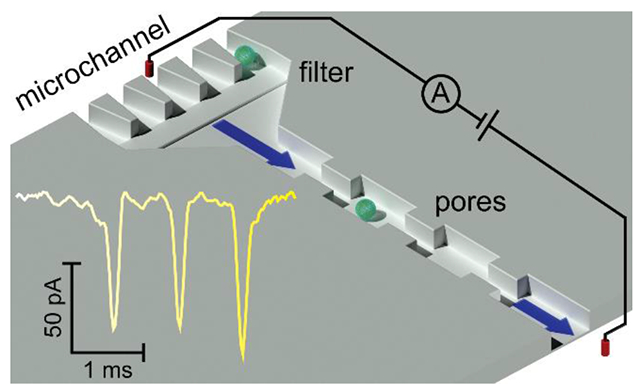
Since the early 2000s, research with extracellular vesicles (EVs) has increased at a rapid rate.1 This interest in EVs is largely due to discoveries that EVs not only contain waste from a cell,2 but also contain genetic material and other cellular components3–5 and are linked to cell-cell communication.6 Because EVs result from direct budding of the cellular membrane, the cargo carried by EVs mimics that of the parent cells from which they are derived. With this insight, EVs present opportunities in drug discovery and understanding disease propagation.7
Extracellular vesicles are classified in three subtypes: exosomes (30–150 nm in diameter), microvesicles (100–2000 nm in diameter), and apoptotic bodies (500–2000 nm in diameter).8 The two subtypes of EVs receiving the most attention are exosomes and microvesicles. The biogenesis of these EVs vary in origin.9 Exosomes originate from multivesicular endosome (MVE) fusion with the plasma membrane, whereas microvesicles evolve from the direct budding of the plasma membrane and are released via acto-myosin-driven fission into the extracellular space.10 Studies report that EVs derived from a cell will interact and fuse with other cells.11–13 Because EVs contain genetic cargo, such as miRNA, mRNA, and even fragments of viral RNA,14 EVs may propagate multiple diseases, including obesity, type 2 diabetes, cancer, and cardiovascular disease.7 EVs also show distinct glycan and glycoprotein profiles that differ by sample type (e.g., cancer patients vs. healthy patients).10,15 The proteomes of EV lysates derived from human breast cancer cells are distinct from healthy human breast cells, which would go unnoticed in a whole cell lysate.16 Whether EVs show differences in their size and surface charge based on their point of origin is of general interest.17–20 However, methods to isolate and categorize EVs and their subtypes are limited.21
Resistive-pulse sensing22–25 is a convenient method for characterizing the size, shape, and charge of single particles and has been used to characterize EV size and shape.17,20,26–27 One approach to fabricate resistive-pulse devices is to pattern the micro- and nanofluidic channels in the plane of the substrate.28–29 These in-plane nanochannels and nanopores are typically a set of interconnected nanoscale trenches fabricated directly by FIB milling into glass substrates29–31 or replication of nanoscale features into polymers,32 which, in turn, are sealed with a cover plate. With the in-plane architecture, multiple pores in series,28,33 along with other fluidic elements, e.g., filters and reactors, are easily coupled in a single device without the need to align components after fabrication.
Here, the resistive-pulse devices are designed with three pores in series to determine particle volume and diameter, two pore-to-pore regions to determine electrophoretic mobility and zeta (ζ) potential, and an in-line filter to prevent cellular debris and aggregates from entering the nanopore region. Measurement of each particle returns three current pulses and two pore-to-pore times. Multiple measurements minimize false-positive events and are averaged to improve measurement precision. Three pores in series are the minimum configuration that provides at least two measurements of the pore-to-pore time, which is the transit time of the particle between pores. We use polystyrene spheres to calibrate the devices and EVs from bovine milk to dial in the size and zeta potential measurements. The fully characterized devices are then used to evaluate EVs derived from human breast cancer cells. Interestingly, the volumes and diameters of the EVs from milk and cancer cells are markedly similar, but the EVs from milk have a 2-fold higher zeta potential than EVs from the cancer cells.
Experimental Section
Materials.
The following materials and chemicals were used: D263 glass substrates from Precision Glass & Optics; Microposit S1813 G2 positive-tone photoresist and MF-319 developer from MicroChem Corp.; No. 1.5 coverslips from VWR, Inc.; chromium etchant 1020 and 8002-A and buffered oxide etchant (BOE) from Transene Co., Inc.; sodium chloride from Mallinckrodt; ammonium hydroxide from J.T Baker; EDTA disodium salt dihydrate from Amresco; 353NDT Epoxy from Epoxy Technology, Inc.; 2-[methoxypoly(ethylenoxy)(6-9)propyl]dimethylmethoxysilane (PEG-silane) from Gelest; Nanosphere Size Standards (3070A, 3100, 3100A, and 3125) from Thermo Fisher Scientific; MDA-MB-468 cells from American Type Culture Collection (ATCC), and bovine skim milk from The Kroger Co. All other chemicals were purchased from Sigma-Aldrich Co.
Tissue Culture and EV Collection.
MDA-MB-468 cells were maintained in Dulbecco’s Modified Eagle Medium (DMEM; Gibco) with addition of 10% fetal bovine serum and 1% penicillin/streptomycin at 37 °C with 5% CO2. Cells were serum-starved overnight to remove interference of exosomes from serum. After cultures reached 80% confluence, media was removed, and cells were washed in phosphate-buffered saline (PBS) to remove serum and non-adherent (dead) cells. PBS was removed and replaced with media without fetal bovine serum, followed by incubation for 24 h at 37 °C with 5% CO2. Conditioned media was then collected, and EVs were isolated as described below.
Isolation of EVs from Samples.
For all samples, sequential ultracentrifugation at 4 °C was used to isolate EVs from pasteurized bovine skim milk and MDA-MB-468 human breast cancer cells. For EVs from milk, a spin speed of 10000 g was employed to pellet cells and cellular debris after 30 min of centrifugation. The supernatant containing the analyte of interest was collected and combined with 0.25 M EDTA in a 1:1 volume ratio to precipitate milk casein. For EVs from MDA-MB-468, pelleting of cells and cellular debris was achieved after 30 min of centrifugation at a spin speed of 2000 g. For both sample types, subsequent steps included spin speeds of 13200, 25000, 40000 and 120000 g. The 13200 g spin was conducted for 30 min to remove vesicles larger (>200 nm) than the size range of interest (<200 nm). For all samples, the 25000 g spin for 90 min and 40000 and 120000 g spins for 120 min each were used to fractionate extracellular vesicles from other cellular components and remove excess debris. Because ultracentrifugation is used as the isolation method,34 we do not differentiate among subtypes of EVs and refer to the particles as EVs.
Fabrication of Nanofluidic Devices.
The D263 glass substrates were coated with a 40 nm thick layer of chromium by thermal evaporation (Auto 306 Vacuum Coating System, BOC Edwards). A 3 μm thick layer of S1813 photoresist was then applied on top of the Cr layer by spin-coating. To fabricate the microchannels (Figure 1a), photolithography and wet chemical etching techniques were used as previously described.35 Microchannels were etched to depths of 10 μm, which were measured with a stylus-based profiler (KLA Tencor T-7).
Figure 1.
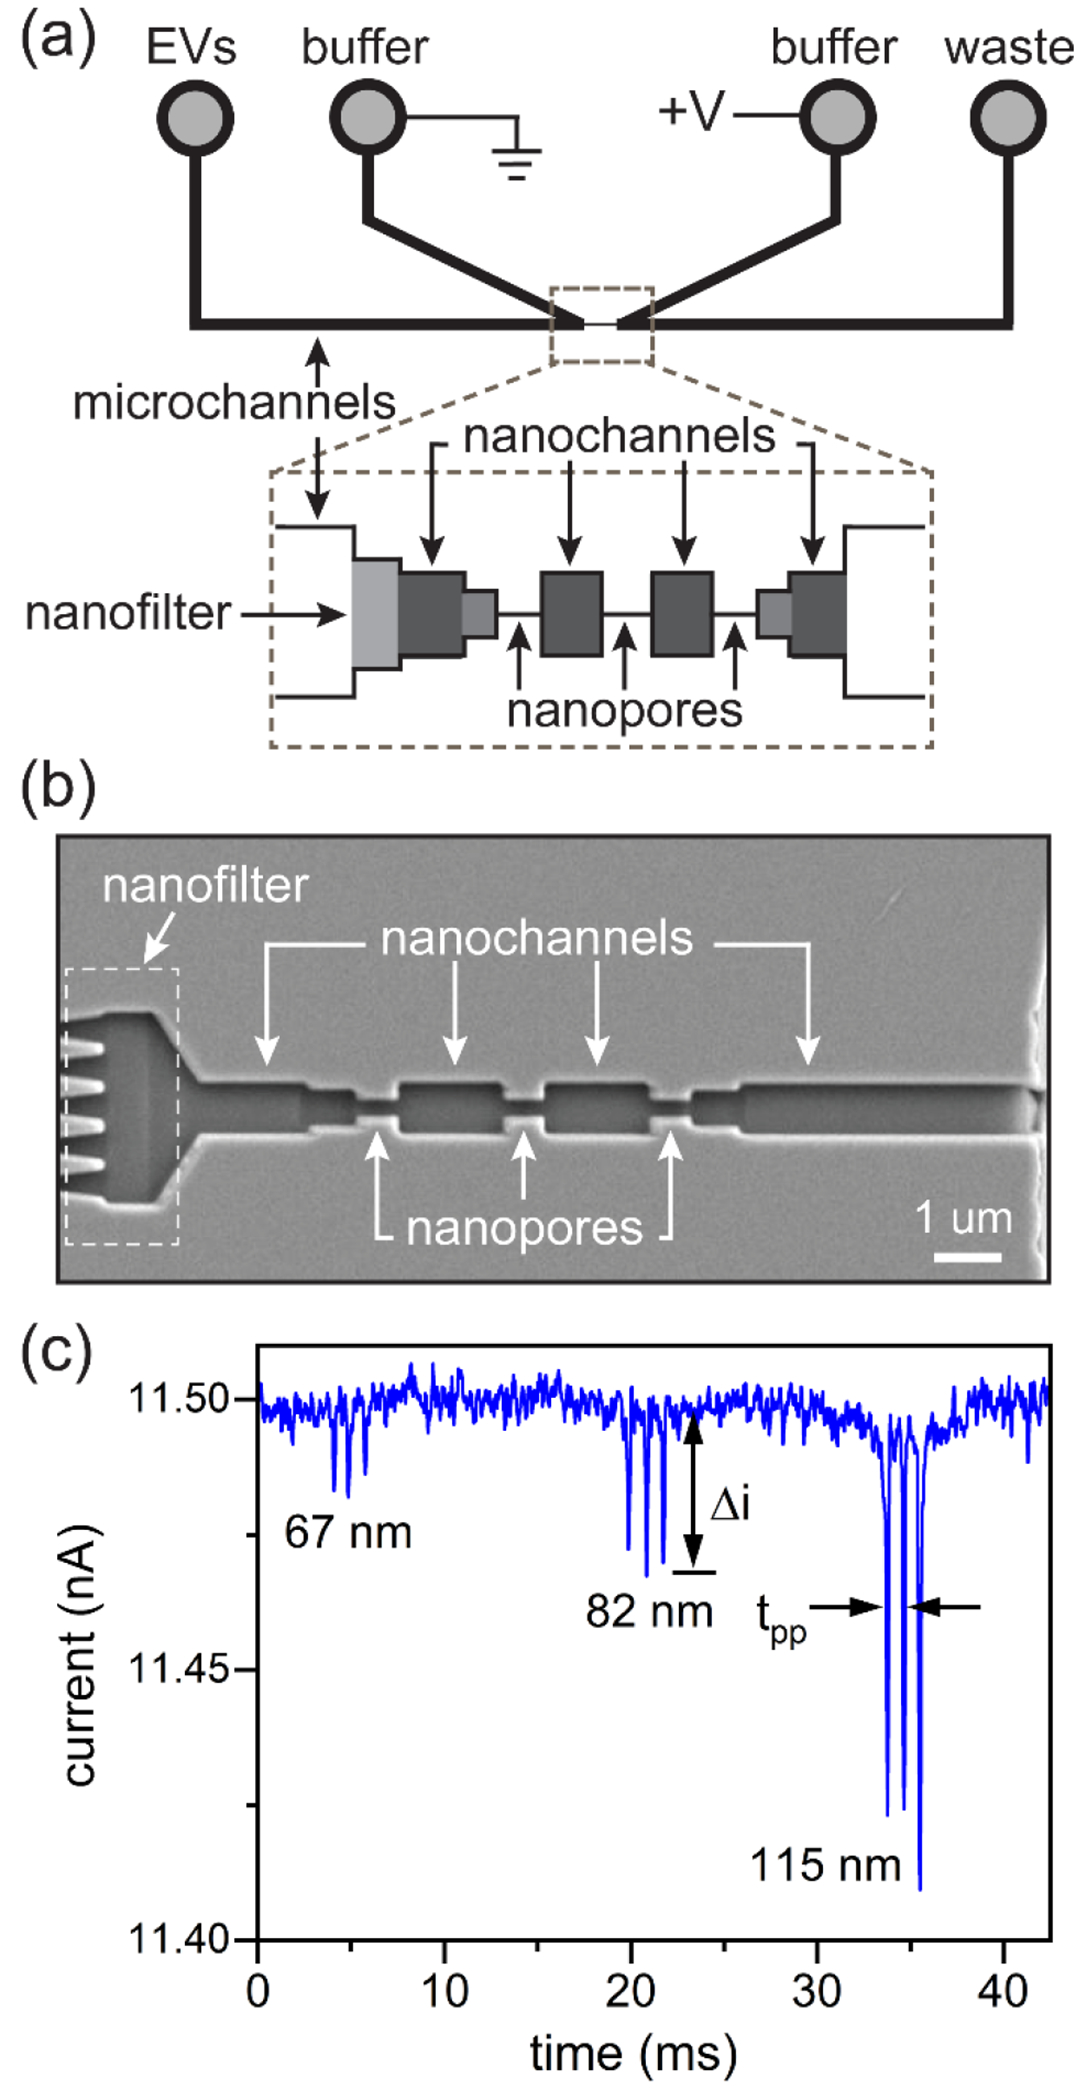
(a) Schematic of the nanofluidic device with three nanopores in series and a nanofilter for resistive-pulse sensing of extracellular vesicles (EVs). EVs were loaded into the EV reservoir and on the same side as the filter. Potentials were applied between buffer reservoirs, and if needed, vacuum was applied to the waste reservoir. (b) SEM image of the nanopores, nanochannels, and nanofilter that bridge the microchannels. The three nanopores in series for sensing were 200 nm deep, 200 nm wide, and 600 nm long. The five nanopores in parallel for the filter were 200 nm deep, 200 nm wide, and 600 nm long. (c) Current trace of three extracellular vesicles (EVs) derived from human breast cancer cells (MDA-MB-468) translocating through three pores in series. Each EV generated three current pulses, which corresponded to the three pores in series, and the EVs were 67, 82, and 115 nm in diameter. The pulse amplitude (Δi) and pore-to-pore time (tpp) are labeled in panel (c).
The nanochannels, nanopores, and nanofilter were milled with a focused ion beam (FIB) instrument (Auriga 60, Carl Zeiss, GmbH) controlled through the Nano-Patterning and Visualization Engine (NPVE; Fibics, Inc.). The nanoscale features, as shown in Figure 1b, were milled with a 30 kV beam with beam current of 50 pA. The connecting nanochannels and pore-to-pore nanochannels were milled with a dose of 1.58 nC/μm2 to 750 nm wide, 320 nm deep, and 1500 nm long. The nanochannels prior to the first pore and after the third pore were milled with a dose of 1.33 nC/μm2 to 550 nm wide, 260 nm deep, and 600 nm long. The three nanopores in series for sensing and five nanopores in parallel for the nanofilter were milled with a dose of 1.08 nC/μm2 to 200 nm wide, 200 nm deep, and 600 nm long. After milling, the chromium layer was removed with chromium etchant 1020, and nanoscale dimensions were measured with an atomic force microscope (AFM; MFP-3D, Asylum Research, Inc.).
Prior to bonding, access holes were sandblasted through the substrates at the ends of the microchannels (Air Eraser, Paasche Airbrush Co.). To bond the substrates with cover plates, the substrates were cleaned in 0.1 M NaOH for 10 min, and No. 1.5 coverslips were cleaned in 1 M NaOH at 85 °C for 10 min. Substrates and coverslips were sonicated in ultrapure water for 10 min and then brought into contact with each other while wet. Devices were dried at 90 °C for at least 4 h and then annealed at 545 °C for 12 h. Glass reservoirs were attached over the access holes with epoxy (353NDT, Epotek, Inc.).
Where noted, channel and pore surfaces in some devices were coated with a short-chain PEG-silane to minimize electroosmotic flow and sample adsorption.36 The channels and pores were sequentially rinsed with water, 0.1 M NaOH, water, water and methanol (50:50 (v/v)), methanol, methanol and anhydrous toluene (50:50 (v/v)), and anhydrous toluene by applying vacuum to the EVs and waste reservoirs (Figure 1a) for 10 min with each solution. All solutions were filtered through a 200 nm syringe filter. Following these rinsing steps, a solution of 10 μL of PEG-silane and 2 μL concentrated HCl in 2 mL anhydrous toluene was drawn into the channels with vacuum for 3 min and left in the channels to react for 4 h. After the reaction, the channels were sequentially rinsed in reverse order from anhydrous toluene to water, as noted above. For devices with channels and pores not coated with PEG-silane, the channels were sequentially rinsed with H2O, 0.1 M NaOH, and H2O for 10 min with each solution.
Resistive-Pulse Sensing.
For the resistive-pulse measurements, 1x PBS buffer was drawn into the micro- and nanochannels by applying vacuum to the waste and EV reservoirs for 10 min. Samples were then placed into the EVs reservoir and drawn into the channels with vacuum. Resistive-pulse measurements were conducted inside a stainless-steel Faraday cage covered with wedge foam. An Axopatch 200B current amplifier (Molecular Devices, Inc.) applied the potential between the buffer reservoirs through Ag/AgCl electrodes and measured the resulting current. For all experiments, 1.0 V potential was applied, unless otherwise noted, and vacuum was applied to the waste reservoir as noted in some experiments. All data were collected with a sampling frequency of 40 or 100 kHz, a gain of α = 2, a head stage amplification of β = 0.1, and a low-pass filter frequency of 10 kHz.
Data Analysis.
Current vs. time data were imported into MatLab R2020b (Mathworks, Inc.), and current pulse amplitude (Δi), pulse width (w), and baseline current (i) (Figure 1c) were extracted from the raw data with a modified version of Open Nanopore 1.4.37 A separate baseline current was calculated for each three-pulse sequence by averaging 200 points prior to the first pulse of each sequence. The pulse amplitude, pulse width, and baseline current were exported to Excel, where three-pulse events indicating a single particle were identified and averaged. Likewise, the time between adjacent pulses, i.e., pore-to-pore time (tpp), was determined and averaged. Uncorrelated events, e.g., random pulses or series of current pulses produced by more than one particle in the pores simultaneously, were not analyzed further and excluded from the amplitude and pore-to-pore time distributions. The averaged pulse amplitude from each set of pulses was divided by the average baseline current to calculate the relative pulse amplitude (Δi/i). Each analyzed particle had an associated i, Δi, and tpp, from which histograms of the relative pulse amplitude and pore-to-pore times and two-dimensional plots of the relative pulse amplitude and pore-to-pore time were generated and plotted.
Results and Discussion
Design of Nanofluidic Devices.
To measure the size and zeta potential of EVs, we designed the nanofluidic devices with three pores in series to determine particle volume and diameter and two pore-to-pore regions to determine the electrophoretic mobility and, subsequently, the zeta potential. Figure 1 shows a schematic of the nanofluidic device, an SEM image of the filter, nanochannels, and nanopores on the device, and a current trace of three EVs translocating through the three nanopores in series. Each EV generates a three-pulse sequence, which corresponds to the three pores in series. For the size measurements, we use the relative pulse amplitude (Δi/i) where Δi is the pulse amplitude and i is the baseline current (Figure 1c). From the relative pulse amplitude, we obtain the particle volume and particle diameter. From the pore-to-pore time (Figure 1c), we calculate the electrophoretic mobility and zeta potential.
The filter element (Figure 1b) prevented cellular debris and aggregates from entering the nanopore region and clogging the device. The filter is composed of five pores in parallel, each with the same lateral dimensions as the sensing pores (200 nm wide and 200 nm deep). Thus, each pore in the filter had a cross-sectional area of 40000 nm2 for a total cross-sectional area of 200000 nm2. Periodically, debris accumulated at the filter and caused the baseline current to drop by ~10% to 20%, equivalent to one of the five parallel pores being obstructed. To return the baseline current to the expected value, the polarity of the applied potential and direction of applied pressure were reversed to remove the debris from the filter.
To calibrate the nanofluidic device, we measured the relative pulse amplitudes and pore-to-pore times of polystyrene spheres with nominal diameters of 70, 100, and 120 nm. Prior to running the resistive pulse measurements, we characterized the sphere diameters with a scanning electron microscope (SEM). Figure S1 shows the histograms of the sphere diameters, which had average diameters of 70, 104, and 122 nm. Following SEM characterization, we conducted resistive-pulse measurements of the spheres individually (Figure S2) and as a mixture (Figure 2b) in 1x PBS with Tween 20 (0.1% (v/v)). Tween 20 was added to PBS to minimize aggregation and adsorption of the polystyrene spheres. As seen in the histograms, distributions of the polystyrene spheres were well resolved, and the devices are easily calibrated when these spheres are used as standards.
Figure 2.
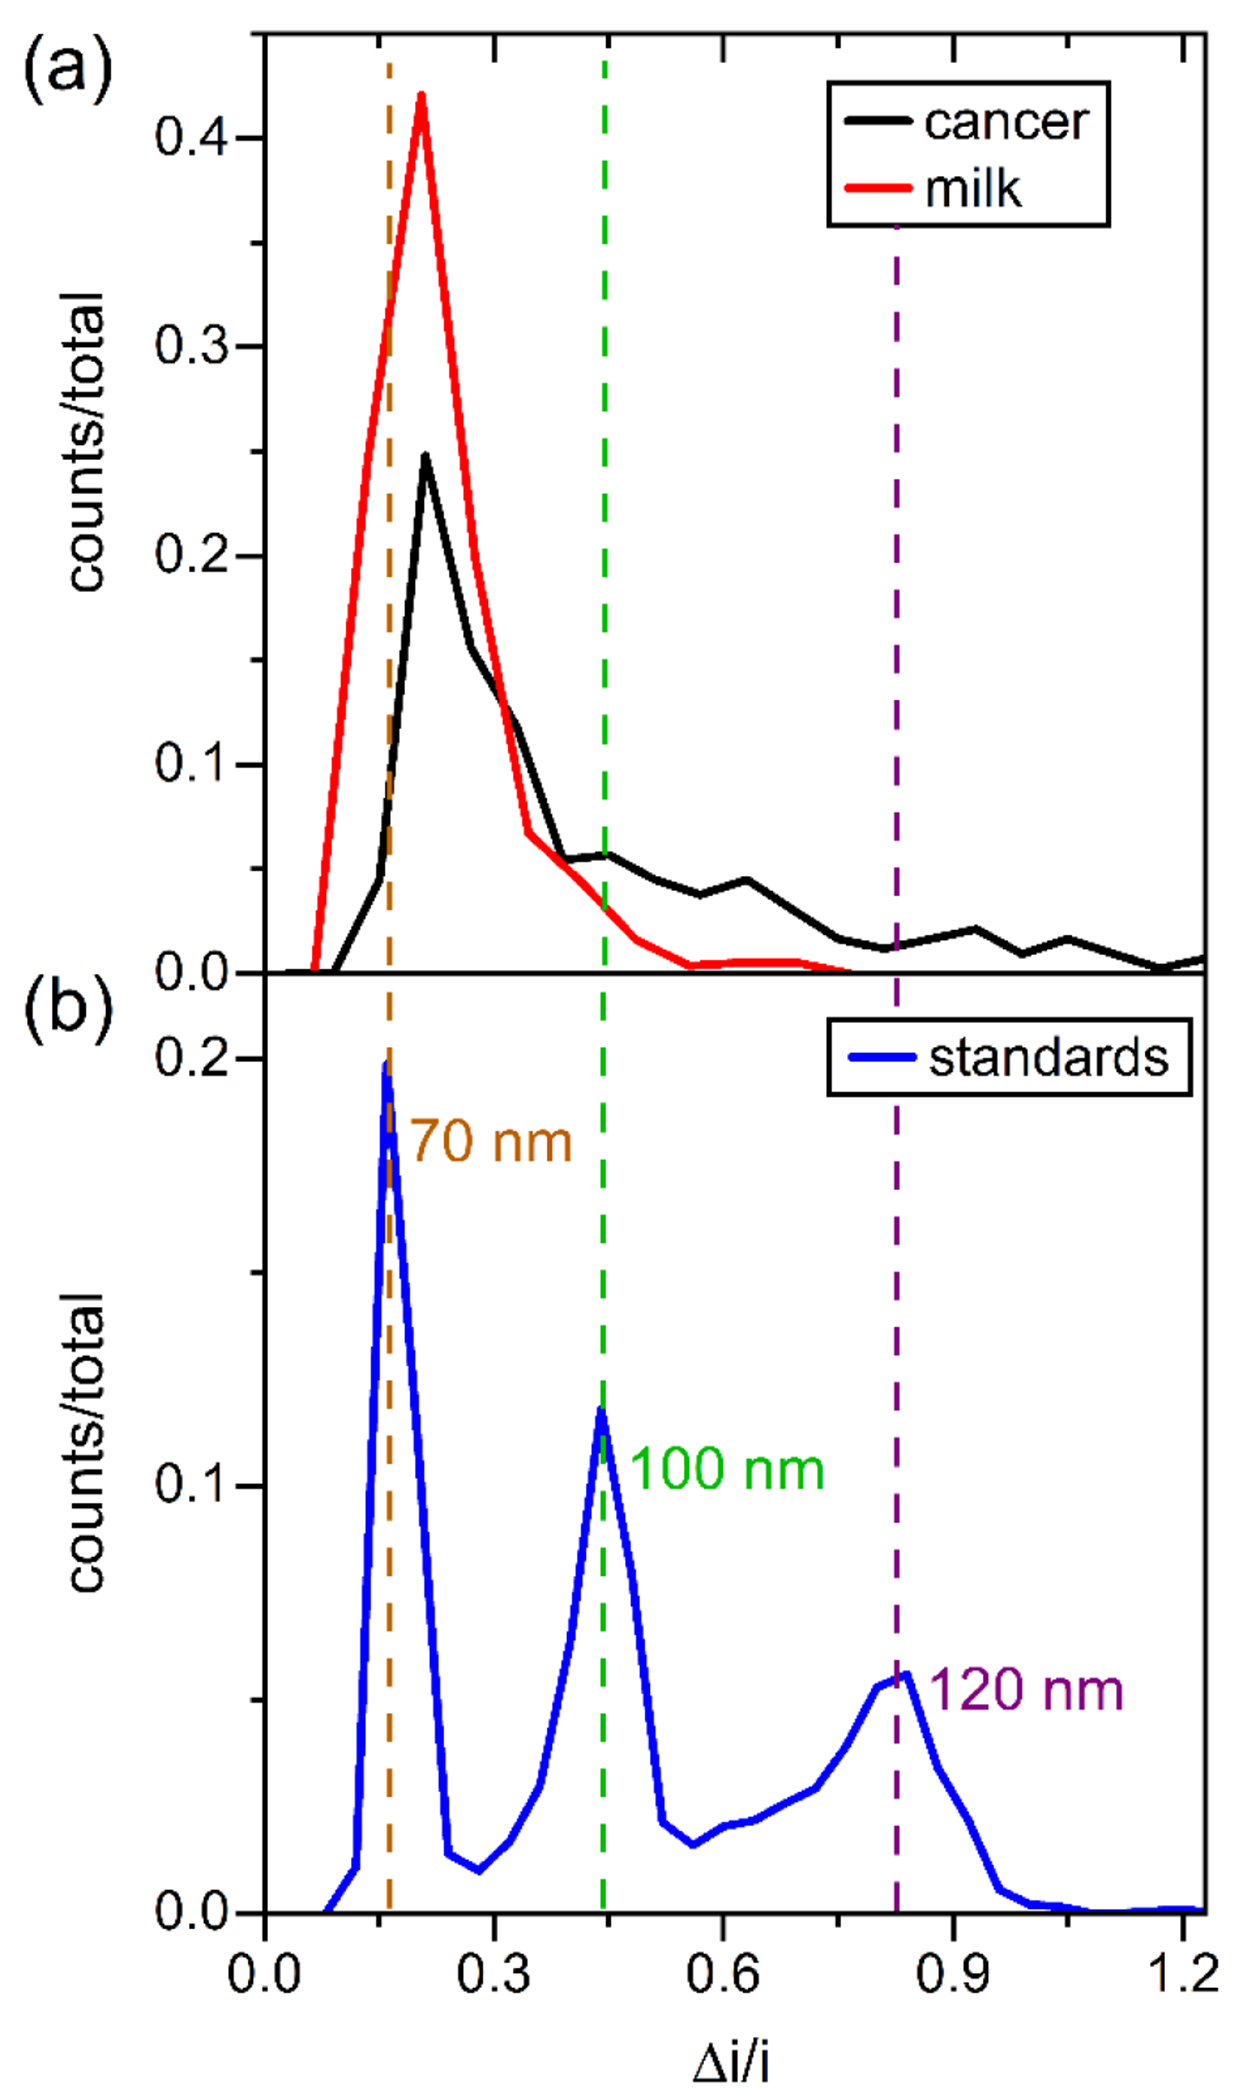
Histograms of the relative current pulse amplitude (Δi/i) for resistive-pulse measurements of (a) extracellular vesicles (EVs) from bovine milk and human breast cancer cells (MDA-MB-468) and (b) polystyrene nanospheres with nominal diameters of 70, 100, and 120 nm. In panel (a), the EVs were purified by ultracentrifugation with a final spin at 40000 g for bovine milk and 120000 g for the 468 cells. Measurements were made on one device in 1x PBS with 1.0 V applied and 0 bar applied. Tween 20 (0.1% (v/v)) was added to the 1x PBS for results in panel (b). Particle counts were 556, 423, and 2023 for the milk, cancer, and standard samples, respectively.
Figure 2 compares the relative pulse amplitudes of the polystyrene standards with EVs derived from milk and breast cancer cells. For these measurements, the nanofluidic device had nanopore dimensions of 200 nm wide, 200 nm deep, and 600 nm long and was able to measure particles with a Δi/i from 0.1 to 1.9, which corresponds to EV diameters of 60 to 160 nm. The majority of EVs measured had a Δi/i of 0.1 to 0.8, which corresponds to EV diameters of 60 to 120 nm. Smaller particles can be analyzed by reducing the cross section of the nanopores, whereas larger particles can be measured by enlarging the cross section of the nanopores. The devices reported here have nanopores with uniform cross sections; consequently, particle volumes and diameters of EVs can be accurately measured across this Δi/i range. EVs derived from bovine milk were characterized as proof-of-concept and to optimize device parameters because milk is easily sourced and has high concentrations of EVs. Results described in the following sections pertain to milk-derived EVs unless stated otherwise.
Impact of Electroosmotic Flow on EV Measurements.
To minimize electroosmotic flow and accurately measure the electrophoretic mobilities and zeta potentials of the EVs, the micro- and nanochannels were coated with a short-chain poly(ethylene glycol) (PEG)-silane. A monomethoxy silane was used, instead of a trimethoxy silane, to form a monolayer of PEG-silane on the channel surfaces, which would not substantially impact the dimensions of the nanopores. This coating procedure demonstrated a ~25-fold reduction of the electroosmotic flow in nanochannels with comparable dimensions (unpublished data). Figure 3 shows particle size measurements (Δi/i) and average pore-to-pore times (tpp) for EVs from milk. Devices with PEG-coated channels (+) showed shorter pore-to-pore times of EVs relative to devices that had native glass surfaces and were not coated (−). Because the EVs are negatively charged and migrate opposite the electroosmotic flow, minimization of the electroosmotic flow results in faster pore-to-pore times for the EVs. The average pore-to-pore times decreased from 1.0 ± 0.1 ms to 0.6 ± 0.1 ms. Figure S3 shows the variation in EV velocity with applied pressure for measurements made on devices with and without the electroosmotic flow suppressed. The shift to higher velocities is due to the minimization of the electroosmotic flow because the vacuum was applied in the opposite direction of the electroosmotic flow. Having an accurate measure of the electrophoretic mobility allows subsequent calculation of the zeta (ζ) potential.
Figure 3.
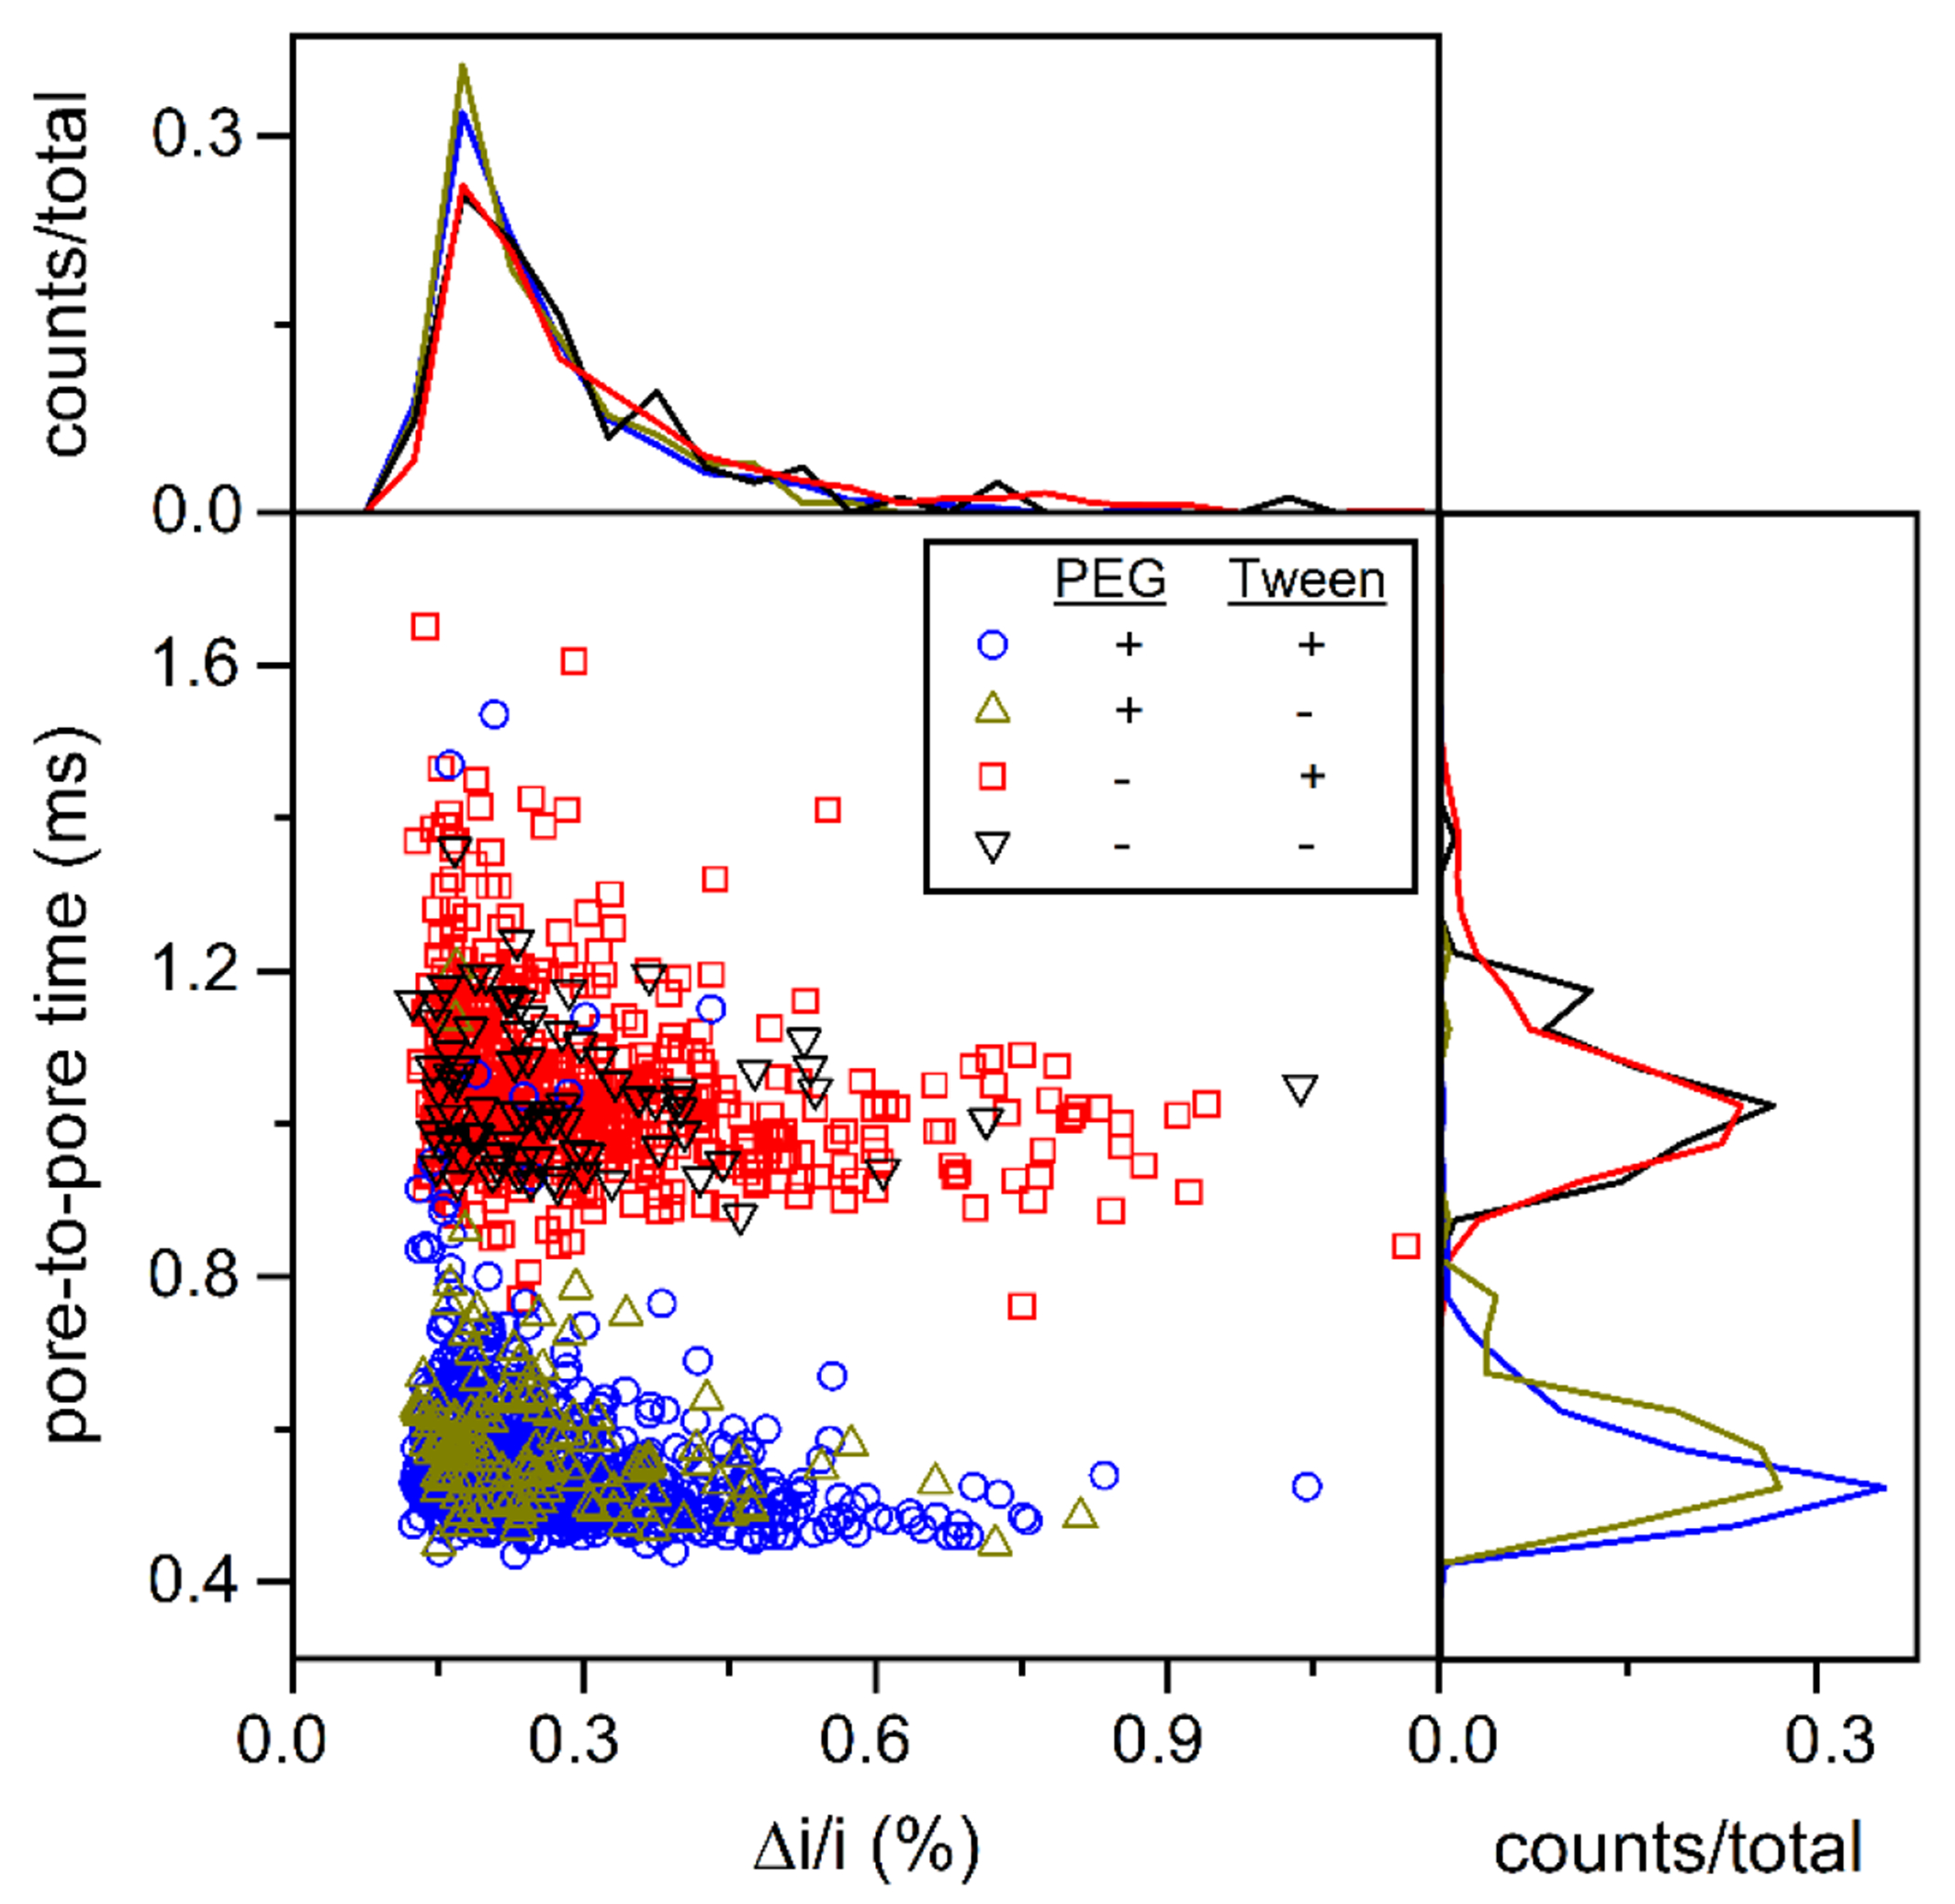
Variation of pore-to-pore time (tpp) with relative pulse amplitude (Δi/i) for EVs from bovine milk. Histograms of each measurement are projected onto the axes. Measurements were made on two devices with (+) and without (−) the channels coated with a short-chain PEG-silane and with (+) and without (−) Tween 20 (0.1% (v/v)) added to the 1x PBS buffer. The surfactant had no impact on measurements of relative pulse amplitude (Δi/i) and pore-to-pore times. Particle counts were 700 (+ PEG/+ Tween), 133 (+/−), 513 (−/+), and 83 (−/−).
Calculation of ζ-Potential.
From the pore-to-pore times, we can determine the electrophoretic velocity and electrophoretic mobility of the EVs, from which the zeta potential can be calculated (Equation 1).
| 1) |
| (2) |
where νE is the electrophoretic velocity, μE is the electrophoretic mobility, E is the electric field strength, ε is permittivity of the medium, ζ is zeta potential, η is viscosity, and f(κa) is Henry’s function where κ is the Debye-Hückel parameter, and a is the particle radius. Henry’s function accounts for the transition between κa << 1 (Hückel) and κa >> 1 (Schmolukowski).38 Equation 2 is an approximation of Henry’s function.39 For the zeta potential calculations, we used κ−1 = 0.8 nm for 150 mM PBS and a = 40 nm for EVs. The pore-to-pore times in Figure 3 do not change substantially with particle size, which indicates the surface charge density is constant. The calculated zeta potentials were −7.5, −7.4, −7.3, and −7.3 mV for a equal to 30, 40, 70, and 90 nm, respectively.
Impact of Surfactant on Resistive-Pulse Measurements.
Resistive pulse measurements of EVs were conducted with (+) and without (−) the surfactant Tween 20 (0.1% (v/v)) added to 1x PBS. As seen in Figure 3, no noticeable shifts in the pore-to-pore time and Δi/i were observed. However, the count frequency increased 10- to 20-fold with Tween 20 present. The increase in count frequency is most likely due to Tween 20 preventing aggregation of EVs, which, in turn, allowed the EVs to pass through the filter and be counted. These experiments were conducted with a Tween 20 concentration slightly above the critical micelle concentration, which is 0.06% to 0.07% in water. As a control experiment, we ran resistive pulse experiments with 1x PBS and Tween 20 with no EVs, and no three-pulse events were observed because the micelles of Tween 20, if present, were below the limit of detection for these nanopore dimensions.
Higher EV Throughput with Applied Pressure.
To increase throughput of EVs through the nanofluidic devices, we applied vacuum to the waste reservoir (Figure 1a). With vacuum applied, the count frequencies increased from 50–100 min−1 to 500–1000 min−1. Importantly, measurements of the relative pulse amplitudes (Δi/i) did not change with an applied pressure (ΔP) of 0.0 to 0.4 bar. Moreover, the average baseline current was 13.0 ± 0.1 nA with 0 to 0.4 bar applied, which suggested a measurable streaming current was not present. However, to calculate the zeta potential accurately, the pressure driven transport of the EVs must be properly accounted for. To test resistive pulse measurements with pressure applied, we used EVs from milk collected from the final spin at 40000 g and made resistive-pulse measurements in 1x PBS without Tween 20 on devices with the channels coated with PEG-silane. Figure 4a shows the pore-to-pore times with 0.1 to 0.4 bar applied, and Figure 4b shows the average velocity with applied pressure. With a linear fit to the velocity data, the EV velocity can be extrapolated to zero pressure applied, which corresponds to the electrophoretic velocity.
Figure 4.
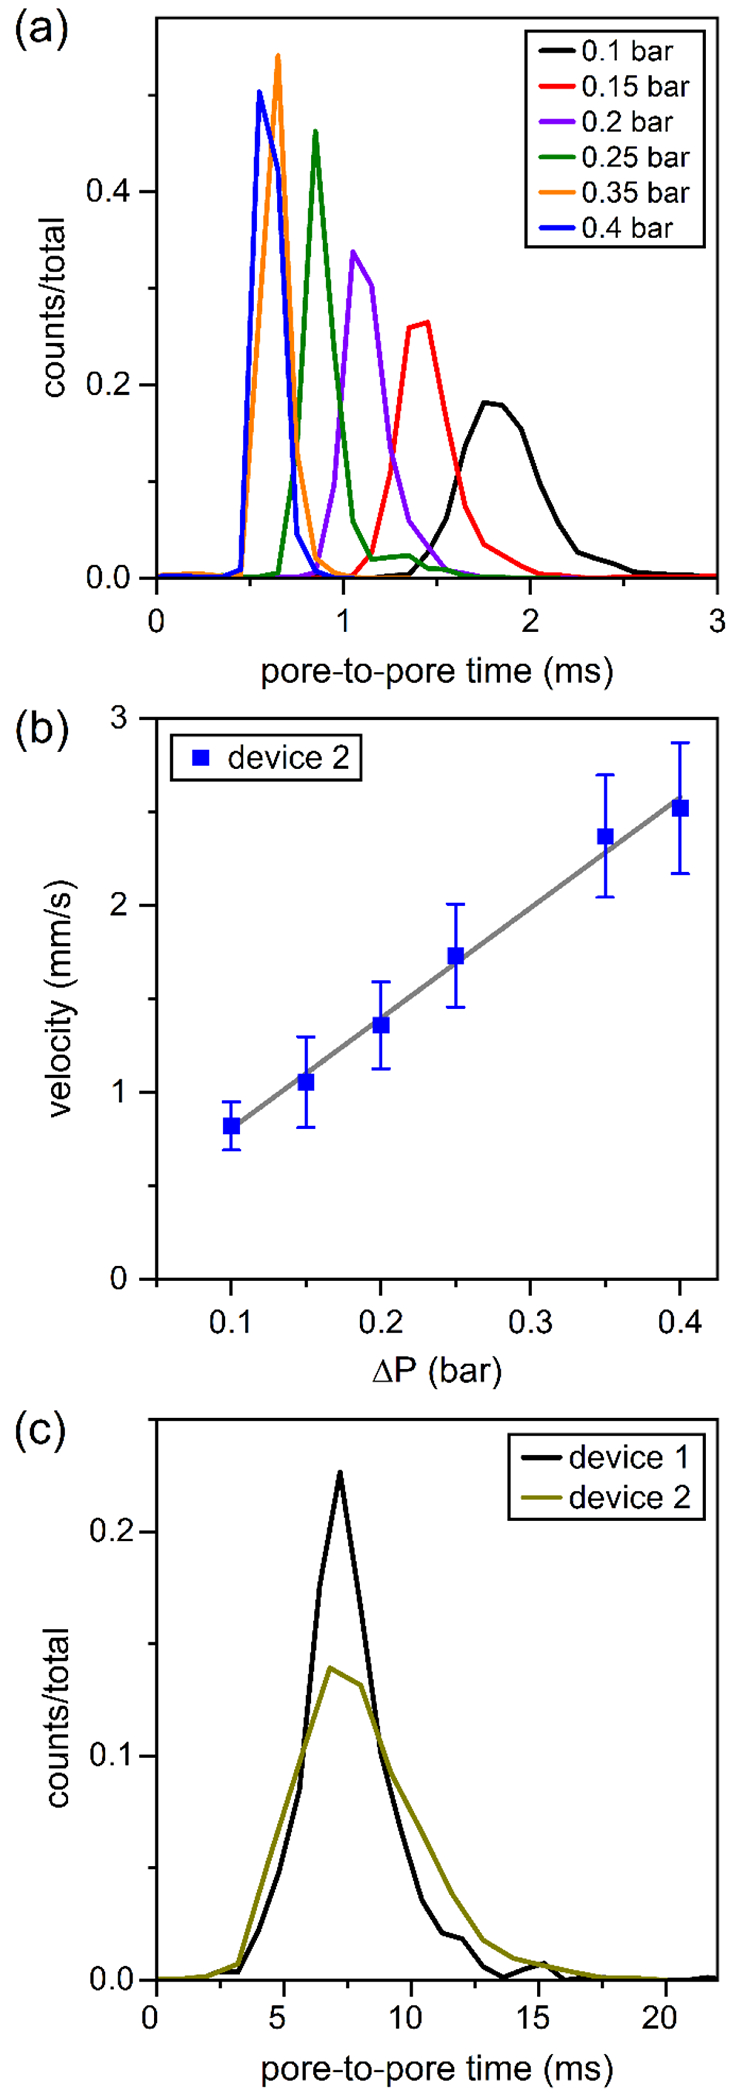
(a) Histograms of pore-to-pore times (tpp) for EVs from bovine milk with applied vacuum from 0.1 to 0.4 bar. (b) Variation of EV velocity with applied vacuum. Average velocities were calculated from the pore-to-pore times in panel (a), and the electrophoretic velocity can be calculated from extrapolation of the linear fit (R2 = 0.995) to no vacuum applied. (c) Histograms of pore-to-pore times of EVs from bovine milk with no vacuum applied. Measurements were made on two devices in 1x PBS with 1.0 V applied. Particle counts were 2378, 1758, 1869, 2231, 1931, 3745, and 2804 with 0.0, 0.1, 0.15, 0.2, 0.25, 0.35, and 0.4 bar applied, respectively.
To compare zeta potential measurements with and without vacuum applied, resistive-pulse measurements were conducted on two devices without pressure applied and on five devices with pressure applied. Figure 4c shows the pore-to-pore time distributions for EVs from milk measured without pressure applied, and the zeta potentials were −8 ± 2 and −8 ± 2 mV. On five devices with pressure applied, the pore-to-pore times were extrapolated to zero applied pressure and used to calculate the zeta potentials. The zeta potentials, calculated from the y-intercept at no applied pressure, were −8, −10, −9, −8, and −6 mV, and the average zeta potential across the five devices was −8 ± 1 mV. Zeta potential calculations with and without pressure applied to the device showed no statistical difference.
Measurement of EVs from Human Breast Cancer Cells.
After determining appropriate run conditions for the resistive pulse measurements with EVs from milk, we analyzed EVs derived from human breast cancer cells (MDA-MB-468, referred to as 468 cells). We collected EVs from the 468 cell samples from final spins at 25000 g and 40000 g and measured the size and zeta potential of EVs in 1x PBS with no Tween 20 on four devices that had the channels coated with the PEG-silane. We opted not to include Tween 20 in case the surfactant may compromise the stability of the lipid bilayer of the EVs. Also, pressure was applied to draw the EVs through the sensing region; otherwise, the count frequencies were too low (1 to 10 counts/min) to provide statistically meaningful data in a reasonable time. Figure 5 shows the Δi/i and pore-to-pore distributions of EVs from the 40000 g spin of EVs from cancer cells measured on one device. From the measurements on four devices, the average zeta potentials, calculated from the y-intercept at zero applied pressure, were −4, −5, −4, and −2 mV for each of the devices with an overall zeta potential averaged across those devices of −4 mV ± 1 mV.
Figure 5.
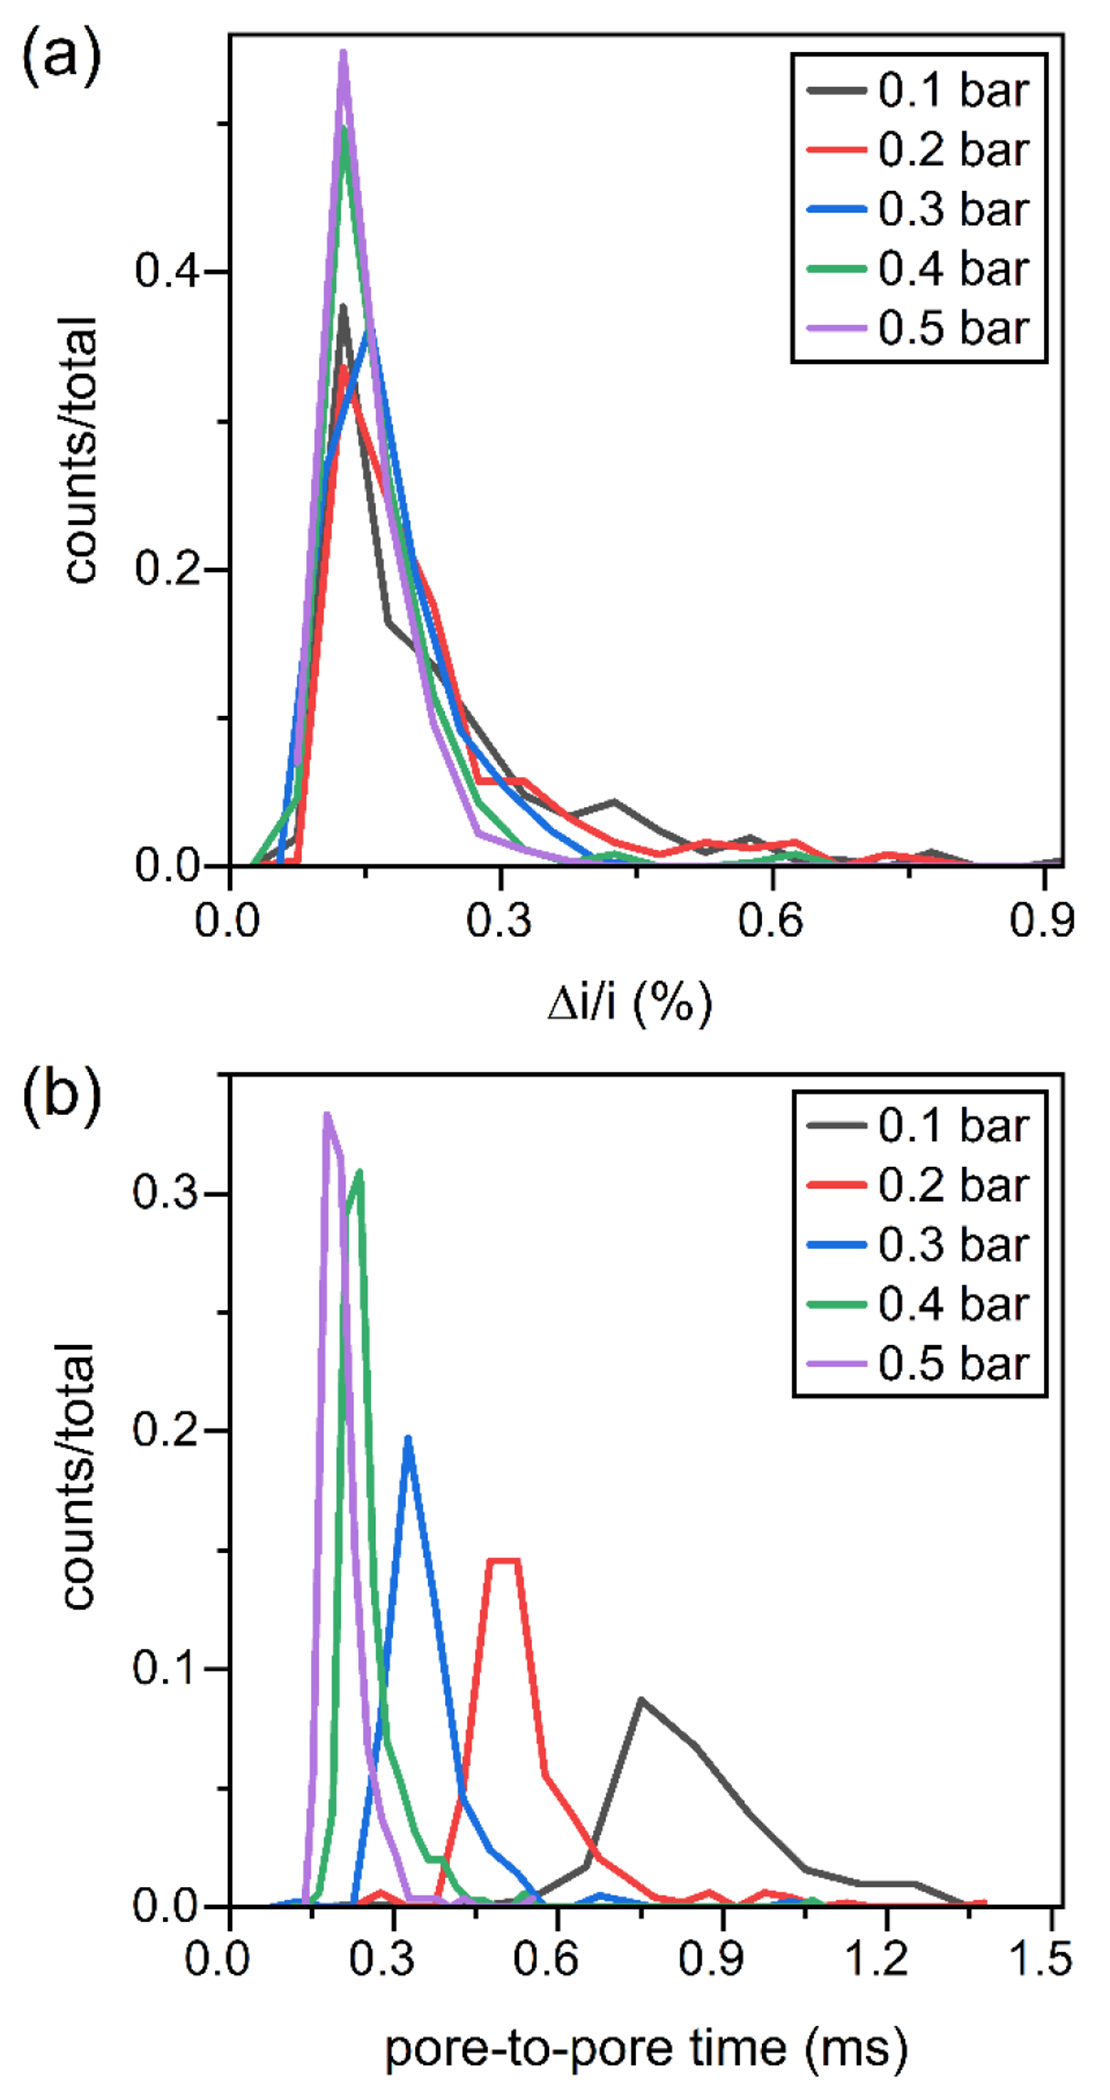
Histograms of (a) relative pulse amplitude (Δi/i) and (b) pore-to-pore times (tpp) for resistive-pulse measurements of EVs from human breast cancer cells (MDA-MB-468). Measurements were made on one device in 1x PBS with 1.0 V and 0.1 to 0.5 bar applied. Particle counts were 207, 244, 208, 346, and 270 for 0.1, 0.2, 0.3, 0.4, and 0.5 bar applied, respectively.
Conclusion
We designed and tested in-plane nanofluidic devices for resistive pulse measurements of EVs derived from milk and human breast cancer cells. Devices were tested with and without the channels coated with a short-chain PEG-silane to minimize electroosmotic flow and permit an accurate measurement of the electrophoretic mobility and zeta potential. To enhance the throughput of EVs, vacuum was applied to the waste reservoir to increase particle frequencies up to 1000 min−1. Although presence of the surfactant Tween 20 in the 1x PBS did not impact either the particle size or zeta potential measurements, we operated without the surfactant because of the possibility of EV membrane disruption. The design and operation of these nanofluidic devices provided promising proof-of-concept results for determining the size and surface charge density of individual EVs derived from bovine milk and cancer cell lines. Accurately characterizing the biophysical properties of EVs derived from clinical samples and differentiating those results from appropriate controls becomes possible.
Supplementary Material
Acknowledgment.
This work was supported in part by NIH R35 GM141922, NIH R01 GM129354, and NSF CHE-0923064. The authors thank the Indiana University Nanoscale Characterization Facility for use of its instruments.
Footnotes
Supporting Information. Histograms of the diameters of polystyrene nanospheres measured with a scanning electron microscope, histograms of the relative pulse amplitude for polystyrene nanospheres measured with resistive-pulse sensing, and variation of the average velocity of EVs from bovine milk with applied pressure. The Supporting Information is available free of charge at https://pubs.acs.org.
Notes. The authors declare no competing financial interest.
References
- (1).Roy S; Hochberg FH; Jones PS Extracellular Vesicles: The Growth as Diagnostics and Therapeutics; a Survey. J. Extracell. Vesicles 2018, 7, 1438720, 10.1080/20013078.2018.1438720. [DOI] [PMC free article] [PubMed] [Google Scholar]
- (2).Johnstone RM; Adam M; Hammond JR; Orr L; Turbide C Vesicle Formation During Reticulocyte Maturation - Association of Plasma-Membrane Activities with Released Vesicles (Exosomes). J. Biol. Chem 1987, 262, 9412–9420, [PubMed] [Google Scholar]
- (3).Somiya M Where Does the Cargo Go?: Solutions to Provide Experimental Support for the “Extracellular Vesicle Cargo Transfer Hypothesis”. J. Cell Commun. Signal 2020, 14, 135–146, 10.1007/s12079-020-00552-9. [DOI] [PMC free article] [PubMed] [Google Scholar]
- (4).Valadi H; Ekstrom K; Bossios A; Sjostrand M; Lee JJ; Lotvall JO Exosome-Mediated Transfer of Mrnas and Micrornas Is a Novel Mechanism of Genetic Exchange between Cells. Nat. Cell Biol 2007, 9, 654–659, 10.1038/ncb1596. [DOI] [PubMed] [Google Scholar]
- (5).Schageman J; Zeringer E; Li M; Barta T; Lea K; Gu J; Magdaleno S; Setterquist R; Vlassov AV The Complete Exosome Workflow Solution: From Isolation to Characterization of Rna Cargo. Biomed Res. Int 2013, 2013, 253957, 10.1155/2013/253957. [DOI] [PMC free article] [PubMed] [Google Scholar]
- (6).Montecalvo A; Larregina AT; Shufesky WJ; Stolz DB; Sullivan MLG; Karlsson JM; Baty CJ; Gibson GA; Erdos G; Wang ZL; Milosevic J; Tkacheva OA; Divito SJ; Jordan R; Lyons-Weiler J; Watkins SC; Morelli AE Mechanism of Transfer of Functional Micrornas between Mouse Dendritic Cells Via Exosomes. Blood 2012, 119, 756–766, 10.1182/blood-2011-02-338004. [DOI] [PMC free article] [PubMed] [Google Scholar]
- (7).Melnik BC; Schmitz G Exosomes of Pasteurized Milk: Potential Pathogens of Western Diseases. J. Transl. Med 2019, 17, 3, 10.1186/s12967-018-1760-8. [DOI] [PMC free article] [PubMed] [Google Scholar]
- (8).Shao HL; Im H; Castro CM; Breakefield X; Weissleder R; Lee HH New Technologies for Analysis of Extracellular Vesicles. Chem. Rev 2018, 118, 1917–1950, 10.1021/acs.chemrev.7b00534. [DOI] [PMC free article] [PubMed] [Google Scholar]
- (9).Colombo M; Raposo G; Thery C Biogenesis, Secretion, and Intercellular Interactions of Exosomes and Other Extracellular Vesicles. In Annu. Rev. Cell Dev.Biol, Schekman R; Lehmann R, Eds. Annual Reviews: Palo Alto, 2014; Vol. 30, pp 255–289. [DOI] [PubMed] [Google Scholar]
- (10).Xu R; Rai A; Chen MS; Suwakulsiri W; Greening DW; Simpson RJ Extracellular Vesicles in Cancer - Implications for Future Improvements in Cancer Care. Nat. Rev. Clin. Oncol 2018, 15, 617–638, 10.1038/s41571-018-0036-9. [DOI] [PubMed] [Google Scholar]
- (11).Zhang L; Zhan SY; Yao J; Lowery FJ; Zhang QL, et al. Microenvironment-Induced Pten Loss by Exosomal Microrna Primes Brain Metastasis Outgrowth. Nature 2015, 527, 100–104, 10.1038/nature15376. [DOI] [PMC free article] [PubMed] [Google Scholar]
- (12).Cocucci E; Racchetti G; Meldolesi J Shedding Microvesicles: Artefacts No More. Trends Cell Biol. 2009, 19, 43–51, 10.1016/j.tcb.2008.11.003. [DOI] [PubMed] [Google Scholar]
- (13).Ratajczak J; Wysoczynski M; Hayek F; Janowska-Wieczorek A; Ratajczak MZ Membrane-Derived Microvesicles: Important and Underappreciated Mediators of Cell-to-Cell Communication. Leukemia 2006, 20, 1487–1495, 10.1038/sj.leu.2404296. [DOI] [PubMed] [Google Scholar]
- (14).Nolte-’t Hoen E; Cremer T; Gallo RC; Margolis LB Extracellular Vesicles and Viruses: Are They Close Relatives? Proc. Natl. Acad. Sci. U. S. A 2016, 113, 9155–9161, 10.1073/pnas.1605146113. [DOI] [PMC free article] [PubMed] [Google Scholar]
- (15).Snyder CM; Alley WR; Campos MI; Svoboda M; Goetz JA; Vasseur JA; Jacobson SC; Novotny MV Complementary Glycomic Analyses of Sera Derived from Colorectal Cancer Patients by Maldi-Tof-Ms and Microchip Electrophoresis. Anal. Chem 2016, 88, 9597–9605, 10.1021/acs.analchem.6b02310. [DOI] [PMC free article] [PubMed] [Google Scholar]
- (16).Rontogianni S; Synadaki E; Li BH; Liefaard MC; Lips EH; Wesseling J; Wu W; Altelaar M Proteomic Profiling of Extracellular Vesicles Allows for Human Breast Cancer Subtyping. Commun. Biol. 2019, 2, 325, 10.1038/s42003-019-0570-8. [DOI] [PMC free article] [PubMed] [Google Scholar]
- (17).Coumans FAW; van der Pol E; Boing AN; Hajji N; Sturk G; van Leeuwen TG; Nieuwland R Reproducible Extracellular Vesicle Size and Concentration Determination with Tunable Resistive Pulse Sensing. J. Extracell. Vesicles 2014, 3, 25922, 10.3402/jev.v3.25922. [DOI] [PMC free article] [PubMed] [Google Scholar]
- (18).Gardiner C; Ferreira YJ; Dragovic RA; Redman CWG; Sargent IL Extracellular Vesicle Sizing and Enumeration by Nanoparticle Tracking Analysis. J. Extracell. Vesicles 2013, 2, 10.3402, 10.3402/jev.v2i0.19671. [DOI] [PMC free article] [PubMed] [Google Scholar]
- (19).Maas SLN; de Vrij J; van der Vlist EJ; Geragousian B; van Bloois L; Mastrobattista E; Schiffelers RM; Wauben MHM; Broekman MLD; Nolte-’t Hoen ENM Possibilities and Limitations of Current Technologies for Quantification of Biological Extracellular Vesicles and Synthetic Mimics. J. Control. Release 2015, 200, 87–96, 10.1016/j.jconrel.2014.12.041. [DOI] [PMC free article] [PubMed] [Google Scholar]
- (20).van der Pol E; Coumans FAW; Grootemaat AE; Gardiner C; Sargent IL; Harrison P; Sturk A; van Leeuwen TG; Nieuwland R Particle Size Distribution of Exosomes and Microvesicles Determined by Transmission Electron Microscopy, Flow Cytometry, Nanoparticle Tracking Analysis, and Resistive Pulse Sensing. J. Thromb. Haemost 2014, 12, 1182–1192, 10.1111/jth.12602. [DOI] [PubMed] [Google Scholar]
- (21).Gardiner C; Di Vizio D; Sahoo S; Thery C; Witwer KW; Wauben M; Hill AF Techniques Used for the Isolation and Characterization of Extracellular Vesicles: Results of a Worldwide Survey. J. Extracell. Vesicles 2016, 5, 32945, 10.3402/jev.v5.32945. [DOI] [PMC free article] [PubMed] [Google Scholar]
- (22).Dekker C Solid-State Nanopores. Nat. Nanotechnol 2007, 2, 209–215, 10.1038/nnano.2007.27. [DOI] [PubMed] [Google Scholar]
- (23).Wanunu M Nanopores: A Journey Towards DNA Sequencing. Phys. Life Rev 2012, 9, 125–158, 10.1016/j.plrev.2012.05.010. [DOI] [PMC free article] [PubMed] [Google Scholar]
- (24).Xue L; Yamazaki H; Ren R; Wanunu M; Ivanov AP; Edel JB Solid-State Nanopore Sensors. Nat. Rev. Mater 2020, 5, 931–951, 10.1038/s41578-020-0229-6. [DOI] [Google Scholar]
- (25).Kozak D; Anderson W; Vogel R; Trau M Advances in Resistive Pulse Sensors: Devices Bridging the Void between Molecular and Microscopic Detection. Nano Today 2011, 6, 531–545, 10.1016/j.nantod.2011.08.012. [DOI] [PMC free article] [PubMed] [Google Scholar]
- (26).Ryuzaki S; Yasui T; Tsutsui M; Yokota K; Komoto Y; Paisrisarn P; Kaji N; Ito D; Tamada K; Ochiya T; Taniguchi M; Baba Y; Kawai T Rapid Discrimination of Extracellular Vesicles by Shape Distribution Analysis. Anal. Chem 2021, 93, 7037–7044, 10.1021/acs.analchem.1c00258. [DOI] [PubMed] [Google Scholar]
- (27).Vaidyanathan S; Wijerathne H; Gamage SST; Shiri F; Zhao Z; Choi J; Park S; Witek MA; McKinney C; Verber M; Hall AR; Childers K; McNickle T; Mog S; Yeh E; Godwin AK; Soper SA High Sensitivity Extended Nano-Coulter Counter for Detection of Viral Particles and Extracellular Vesicles. Anal. Chem 2023, 95, 9892–9900, 10.1021/acs.analchem.3c00855. [DOI] [PMC free article] [PubMed] [Google Scholar]
- (28).Harms ZD; Mogensen KB; Nunes PS; Zhou K; Hildenbrand BW; Mitra I; Tan Z; Zlotnick A; Kutter JP; Jacobson SC Nanofluidic Devices with Two Pores in Series for Resistive-Pulse Sensing of Single Virus Capsids. Anal. Chem 2011, 83, 9573–9578, 10.1021/ac202358t. [DOI] [PMC free article] [PubMed] [Google Scholar]
- (29).Harms ZD; Haywood DG; Kneller AR; Selzer L; Zlotnick A; Jacobson SC Single-Particle Electrophoresis in Nanochannels. Anal. Chem 2015, 87, 699–705, 10.1021/ac503527d. [DOI] [PMC free article] [PubMed] [Google Scholar]
- (30).Menard LD; Ramsey JM Fabrication of Sub-5 Nm Nanochannels in Insulating Substrates Using Focused Ion Beam Milling. Nano Lett. 2011, 11, 512–517, 10.1021/nl103369g. [DOI] [PMC free article] [PubMed] [Google Scholar]
- (31).Harms ZD; Selzer L; Zlotnick A; Jacobson SC Monitoring Assembly of Virus Capsids with Nanofluidic Devices. ACS Nano 2015, 9, 9087–9096, 10.1021/acsnano.5b03231. [DOI] [PMC free article] [PubMed] [Google Scholar]
- (32).Angeli E; Volpe A; Fanzio P; Repetto L; Firpo G; Guida P; Lo Savio R; Wanunu M; Valbusa U Simultaneous Electro-Optical Tracking for Nanoparticle Recognition and Counting. Nano Lett. 2015, 15, 5696–5701, 10.1021/acs.nanolett.5b01243. [DOI] [PMC free article] [PubMed] [Google Scholar]
- (33).Kondylis P; Zhou JS; Harms ZD; Kneller AR; Lee LS; Zlotnick A; Jacobson SC Nanofluidic Devices with 8 Pores in Series for Real-Time, Resistive-Pulse Analysis of Hepatitis B Virus Capsid Assembly. Anal. Chem 2017, 89, 4855–4862, 10.1021/acs.analchem.6b04491. [DOI] [PMC free article] [PubMed] [Google Scholar]
- (34).Thery C; Witwer KW; Aikawa E; Alcaraz MJ; Anderson JD, et al. Minimal Information for Studies of Extracellular Vesicles 2018 (Misev2018): A Position Statement of the International Society for Extracellular Vesicles and Update of the Misev2014 Guidelines. J. Extracell. Vesicles 2018, 7, 1535750, 10.1080/20013078.2018.1535750. [DOI] [PMC free article] [PubMed] [Google Scholar]
- (35).Zhuang Z; Mitra I; Hussein A; Novotny MV; Mechref Y; Jacobson SC Microchip Electrophoresis of N-Glycans on Serpentine Separation Channels with Asymmetrically Tapered Turns. Electrophoresis 2011, 32, 246–253, 10.1002/elps.201000461. [DOI] [PMC free article] [PubMed] [Google Scholar]
- (36).Meagher RJ; Seong J; Laibinis PE; Barron AE A Very Thin Coating for Capillary Zone Electrophoresis of Proteins Based on a Tri(Ethylene Glycol)-Terminated Alkyltrichlorosilane. Electrophoresis 2004, 25, 405–414, 10.1002/elps.200305714. [DOI] [PubMed] [Google Scholar]
- (37).Raillon C; Granjon P; Graf M; Steinbock LJ; Radenovic A Fast and Automatic Processing of Multi-Level Events in Nanopore Translocation Experiments. Nanoscale 2012, 4, 4916–4924, 10.1039/c2nr30951c. [DOI] [PubMed] [Google Scholar]
- (38).Hunter RJ, Foundations of Colloid Science. 2nd ed.; Oxford University Press: Oxford, 2001. [Google Scholar]
- (39).Ohshima H A Simple Expression for Henrys Function for the Retardation Effect in Electrophoresis of Spherical Colloidal Particles. J. Colloid Interface Sci 1994, 168, 269–271, 10.1006/jcis.1994.1419. [DOI] [Google Scholar]
Associated Data
This section collects any data citations, data availability statements, or supplementary materials included in this article.


