Abstract
We present a model of the yeast exosome based on the bacterial degradosome component polynucleotide phosphorylase (PNPase). Electron microscopy shows the exosome to resemble PNPase but with key differences likely related to the position of RNA binding domains, and to the location of domains unique to the exosome. We use various techniques to reduce the many possible models of exosome subunits based on PNPase to just one. The model suggests numerous experiments to probe exosome function, particularly with respect to subunits making direct atomic contacts and conserved, possibly functional residues within the predicted central pore of the complex.
INTRODUCTION
A deeper understanding of protein function comes from knowledge of interacting partners, and many experimental approaches aim to discover interactions or complexes. Ultimately, three-dimensional (3D) structures of complexes provide key insights into molecular function, but structure determination is fraught with difficulties in overexpression, crystallization and sometimes just shear size. Homology modeling is also difficult, particularly when homology of the complex components is ambiguous or incomplete, and no standard procedures exist. Nevertheless, it is sometimes possible to model complexes by combining experimental and theoretical methods. Here we apply such an approach to model the yeast exosome.
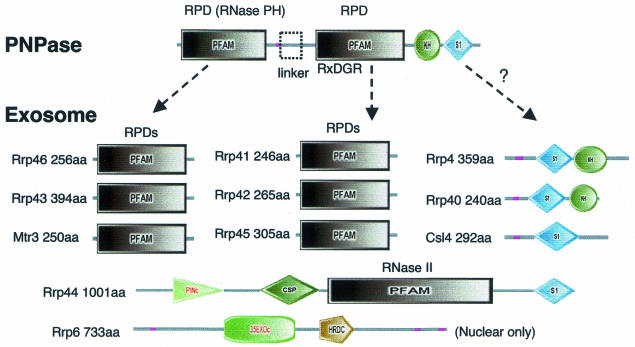
The exosome is a 3′→5′ exonuclease complex involved in RNA processing and degradation (see, for example, Mitchell and Tollervey, 2000 and references therein). The yeast exosome core comprises 10 proteins in the cytoplasm, with another present in the nuclear complex (Allmang et al., 1999) (Figure 1). They contain domains homologous to ribonucleases (e.g. RNase PH and RNase II), and others (e.g. S1, KH, PINc and HRDC) that are predicted to bind RNA. Human equivalents for all of these proteins are known (Chen et al., 2001), and some have been identified in other eukaryotes (see, for example, Brouwer et al., 2001; Estevez et al., 2001; Chekanova et al., 2002) and archea (Koonin et al., 2001). Bacteria appear to lack exosomes, but have degradosomes that also degrade RNA. The crystal structure of the degradosome component polynucleotide phosphorylase (PNPase; Symmons et al., 2000) shows it to contain similar domains to part of the exosome core, suggesting that it could be used as a modeling template. However, constructing a model is difficult as there is no obvious one-to-one domain match between the two complexes (Symmons et al., 2002).
Fig. 1. Domain architectures for the exosome core and PNPase. Domains are taken from SMART (colored shapes) or Pfam (boxes). Regions of low sequence complexity are shown in pink.
Here, we first study the exosome using electron microscopy (EM) and verify PNPase as a possible model. We then use a variety of techniques to place the exosome components in PNPase, and construct a 3D model, which suggests numerous experiments to probe function. The study provides a proof-of-principle for facing a new problem in structural biology: modeling protein complexes by homology.
RESULTS AND DISCUSSION
Domains and species distribution
Our sequence comparison of Saccharomyces cerevisiae exosome subunits confirms domains identified previously (Mitchell et al., 1997; van Hoof and Parker, 1999; Koonin et al., 2001); we also found a CSP (RNA binding) domain in Rrp44 (Figure 1).
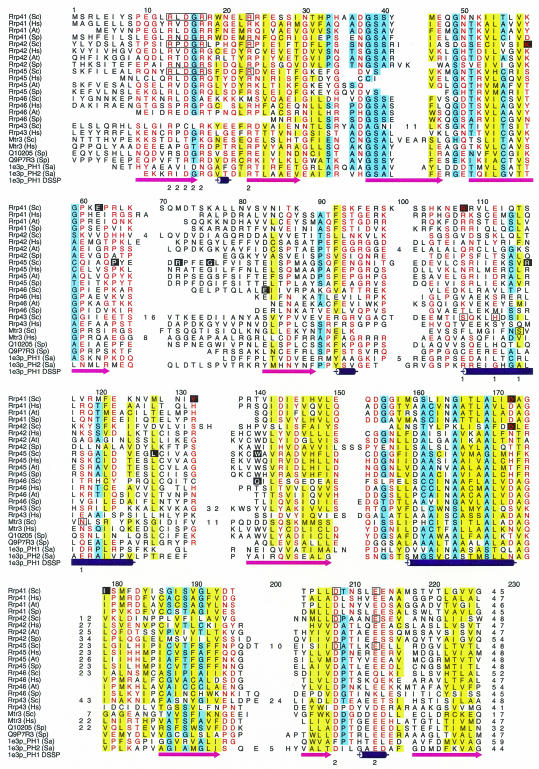
The subunit stoichiometry of the complex is not obviously conserved across different species. There are clear orthologs for all but two core S. cerevisiae subunits in the completely sequenced genomes: Homo sapiens, Arabidopsis thaliana, Caenorhabditis elegans and Schizosaccharomyces pombe. Rrp43 and Mtr3, two core phosphate-dependent ribonuclease (RNase PH) domain (RPD) containing subunits (Figure 2), do not have clear orthologs in any organism. However, there are two additional RPD homologs in S. pombe and H. sapiens with sequences more similar to other yeast core RPDs. The two human proteins were recently found to be in the exosome and were thus matched to Rrp43 and Mtr3 (Chen et al., 2001; Figure 2). Thus, although it is not possible to assign an unambiguous one-to-one match for every yeast core component, we suspect that the overall subunit stoichiometry is preserved in other species.
Fig. 2. Alignment of RPDs. Residues are colored according to property conservation (red, polar; blue, small; yellow, hydrophobic), and numbers denote regions deleted for clarity. Boxes denote predicted functional site residues, and inverse characters those showing conservation across orthologs. Numbers below boxed residues denote FS-1 and FS-2 as shown in Figure 5. Species are abbreviated as follows: Sc, S. cerevisiae; Hs, H. sapiens; At, A. thaliana; Sp, S. pombe; Sa, Strepomyces antibioticus.
PNPase as a model for the exosome
PNPase is a single polypeptide (Figure 1) with two tandem RPDs (linked by a short all α-domain) followed by S1 and KH domains. Three copies form a trimer with a total of six RPDs arranged around a central pore. This number agrees with the estimated yeast exosome stoichiometry: each particle is thought to contain one of each of the six RPD subunits (van Hoof and Parker, 1999). Core subunits Rrp4, 40, 44, 46 and Csl4 also contain KH and/or S1 domains, although the number and order differ from PNPase, and different RNA binding and catalytic domains are found in Rrp6 and 44 that have no PNPase equivalent. These domains may thus differ in location in the exosome.
Electron microscopy (EM)
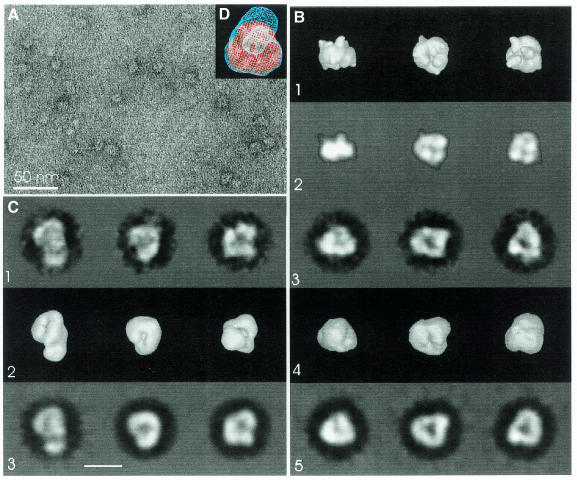
Figure 3A shows a micrograph of negatively stained exosome particles, which we explored by image processing. The proposed PNPase similarity prompted us to use the trimer structure (Figure 3B-1) to generate a first set of references (Figure 3B-2), which we used for initial alignment and to determine relative orientations. After alignment, we classified particle images by similarity (Figure 3B-3) and combined these into a 3D map (Figure 3B-4, surface representation). The projections of this map (Figure 3B-5) matched the corresponding class averages (Figure 3B-3) well, indicating the suitability of the map for describing the observed data. The Fourier-shell correlation of the map dropped to 0.5 at 1/42 Å–1 and cut the three-times noise correlation curve at 1/23 Å–1, suggesting a resolution in the 23–42 Å range.
Fig. 3. EM and image processing of the exosome. (A) Micrograph of exosomes stained with uranyl acetate. (B) Image processing using the PNPase trimer (PDB code 1e3p) as initial reference: (1) different views of a surface representation of PNPase. This 3D map was used to generate the initial references by calculating 2D projections. (2) Projections of PNPase trimer shown in (1). Sixty-six of these projections equally distributed across the asymmetric unit were used as references for the initial alignment of exosome images and as anchor projections to determine spatial orientations of the class averages. (3) Class averages of the exosome images [direction of projection as in (2)]. (4) Surface representation of the 3D exosome map [views as in (1)]. (5) Projections of the map [same direction as in (2) and (3)]. (C) Exosome image processing without using a starting model. (1) Final class averages representing different views of the exosome. (2) Surface representation of the final 3D exosome map. (3) Projections of the map [directions as for (1)]. (D) Superposition of PNPase (solid surface) and the map of the exosome shown in (C) (wire frame). The view is towards the linker region of PNPase.
Although the map of the exosome and PNPase were similar in size and shape, the S1 and KH domains of the PNPase were not reproduced, possibly due to flexibility or different organization. For further investigation, we chose a different image processing approach that did not require a starting reference and resulted in a slightly different map (Figure 3C-2). The projections of this map (Figure 3C-3) also matched the corresponding class-averages (Figure 3C-1), indicating that it too is a possible solution for describing the observed data. The Fourier-shell correlation and three-times noise correlation suggested a slightly better resolution in the 23–32 Å range. The new map (Figure 3C-2, surface representation) was similar to the referenced biased map and to the PNPase, but contained a single lump of extra density, asymmetrically attached to one side of the presumed exosome core. The PNPase trimer fit in the observed density, but could not account for the extra lump, which was near to the side with the S1 and KH domains (Figure 3D).
EM confirms that PNPase is a possible model for the exosome, but shows important differences, particularly with respect to the S1 and KH domains and the presence of additional density that may correspond to subunits in the exosome that do not have analogs in PNPase (i.e. Rrp44 and 6).
Which domain where?
There are 120 (6!/6) ways of placing six RPDs in the PNPase trimer. While this seems at first to be an insurmountably difficult problem, a few pieces of information can reduce this to a handful of alternatives. The N- and C-terminal domains in PNPase are thought to perform different functions (Symmons et al., 2000), and are in different relative orientations within the trimer, alternating as one moves around the central pore. The complex itself is also asymmetric: one side has the S1 and KH domains while the other has the linker. Since we expect the exosome to have a similar asymmetry, we expect the RPDs to fall into two groups: resembling either the N- or C-terminal PNPase domains.
Functional site prediction (Aloy et al., 2001) identifies an RxDGR motif in Rrp41, 42 and 45, which is equivalent to the RIDG motif discussed previously (Symmons et al., 2002), and is found only in the C-terminal PNPase RPD. This site is completely missing from Mtr3 with only a few of the residues being found in Rrp43 and 46 (Figure 2). We thus predict that Rrp41, 42 and 45 will be equivalent to the C-terminal domain of PNPase. This prediction reduces the number of possible models from 120 to 12. Inspection of the alignment suggests that Rrp46 and 42 could be in either group (i.e. A. thaliana Rrp46 has an RxDGR motif, and ‘x’ is a proline, instead of a hydrophobic residue in Rrp42), although this ambiguity is resolved below.
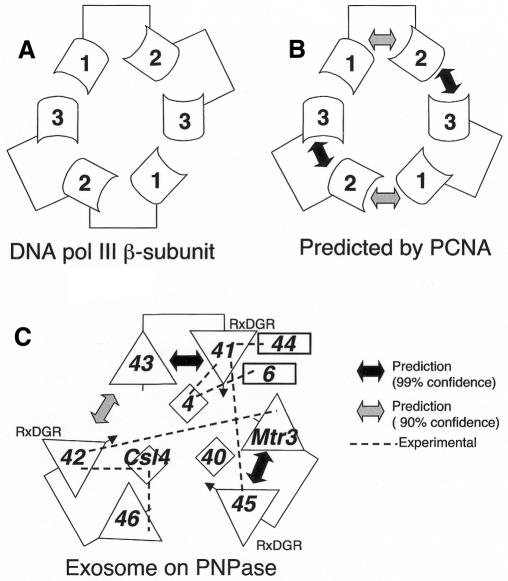
We have developed a method for scoring the fit of homologous sequences on known 3D complex structures, and assessing the significance of these scores relative to random sequences (Aloy and Russell, 2002). As the method was tested mostly with transient interactions, such as FGFs and receptors, we sought examples of known structure similar to the exosome/PNPase case to test its applicability here. The only comparable example we could find was the DNA clamp, a structure with six homologous domains that form a ring around DNA. In Escherichia coli DNA polymerase (pol) III β subunit the clamp is formed by a homodimer, where each subunit has three copies of the domain (Kong et al., 1992) (Figure 4A). In eukaryotic clamps, such as proliferating cell nuclear antigen (PCNA) (Krishna et al., 1994), the ring is formed by a trimer, where each subunit has two domains instead (Figure 4B). We used the two domains in PCNA-like structures to predict interactions between the three domains in DNA pol III β. Considering the intra- and intermolecular interactions in PCNA-like structures, the method predicts only two (out of six) interactions between pol III domains as significant: domains 2–3 (with 99% confidence), and 1–2 (90%), which are sufficient to produce the correct structure for the pol III ring, since the remaining interaction (3–1) can be inferred by symmetry (Figure 4B). These results show that the method can in principle be applied to the exosome/PNPase problem.
Fig. 4. Prediction of subunit arrangements for (A) DNA pol III β-subunit based on (B) PCNA-like structures. (C) Model of the exosome complex.
In PNPase we defined two distinct interfaces between RPDs: intramolecular between those that are covalently linked and intermolecular between the C-terminal domain of one subunit and the N-terminal domain of the next. Of the 60 possible domain pairs, the best scores (99% confidence) are for the intramolecular interactions between Rrp43 and 41 and between Mtr3 and Rrp45. Weaker predictions are also made for an intramolecular interaction between Rrp41 and 46 and Rrp43 and 45. Considering intermolecular interactions the method gives only one score significant at 90% for the intermolecular interaction between Rrp43 and 42. These independently derived results are consistent with the groups above, since they predict Rrp41, 42 and 45 to be in the same group (resolving the Rrp42/46 ambiguity). Considering only the best interactions between subunits reduces the number of models from 12 to one (Figure 3C). For the equivalent human subunits, the method made three significant interaction predictions all with the intermolecular interface. One of these, Rrp41–43, agrees with the model above, and the others are inconsistent with the groups.
Comparison with experimental data
Several experiments have suggested interactions between exosome subunits (Figure 4C). In vitro pull-down assays suggest interactions between A. thaliana subunits Rrp4, 41 and 44 (Chekanova et al., 2000, 2002). In H. sapiens, co-immunoprecipitation suggests an interaction (although possibly not a direct one) between Rrp4 and the nuclear specific Rrp6 (Allmang et al., 1999), and a combination of two-hybrid and GST pull-downs suggests one between Csl4, Rrp42 and 46 (Raijmakers et al., 2002). Only the last interaction can confirm or dismiss any of the predictions, and it supports the one between Rrp42 and 46. In addition, these three results together provide a single possible model for the placement of S1 domain containing proteins (Figure 4C). They also suggest proximity of Rrp4, 6 and 44 (Figure 4), which might account for the additional and asymmetric density seen in the EM reconstruction (Figure 3).
Large-scale yeast two-hybrid studies propose interactions between Mtr3 and Rrp42, and Rrp41 and 45 (Uetz et al., 2000; Ito et al., 2001). The first, found by both studies, is consistent with the groups above but disagrees with the model, and the second disagrees with both. However, it is clear that two hybrids do not always detect direct physical interactions, as there are examples involving intermediate proteins (e.g. cyclin A, CKS and CDK2; see Aloy and Russell, 2002). This is particularly likely when the proteins are themselves from yeast and (like the exosome) in the nucleus, where intermediates are naturally abundant.
To date, exonuclease activity has only been demonstrated for Rrp41, 4, 44 and 6 (van Hoof and Parker, 1999). Of these, only Rrp41 contains an RPD and its activity supports the model since it is matched to the presumed catalytic PNPase C-terminal RPD (Symmons et al., 2000). Rrp44 is less tightly associated with the other exosome core subunits (Mitchell and Tollervey, 2000) and Rrp6 is nucleus specific, thus both might be catalytically active in isolation.
3D model
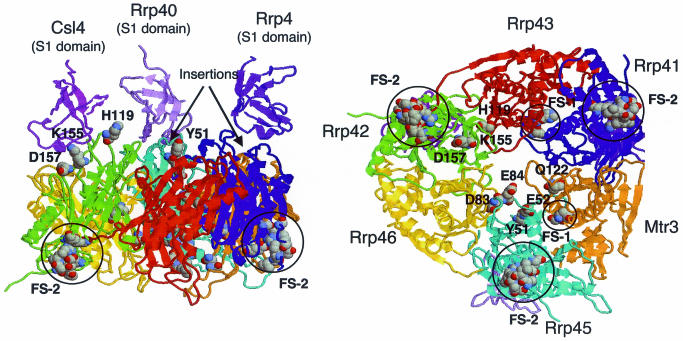
Figure 5 shows a model based on the predicted subunit arrangement (Figure 4C). There are several long insertions in exosome RPDs. Most lie in positions that are unlikely to disrupt the complex, but two in Rrp41 and 45 lie near to the PNPase S1 domains (Figures 2 and 5). This suggests that they may be involved either in binding these domains, or to binding RNA themselves. The latter supports the idea that the S1 and KH domains may interact with the exosome in a different way from PNPase.
Fig. 5. Two views of a 3D model of the exosome core. Polar residues conserved across orthologs are labeled and correspond to inverse characters in Figure 2. Circles denote predicted functional sites (FS); boxed in Figure 2.
Little is known about how RPDs function. There are no invariant residues across the family, which is not surprising since different copies can behave differently in the same molecule (e.g. PNPase). There is a tungstenate site in the C-terminal PNPase RPD, and since this ion is analogous to RNA orthophosphate groups, it was proposed that it might be involved in RNA binding or processing (Symmons et al., 2000). However, the residues involved are seldom seen in other RPDs, making it unlikely to be universal for function.
Considering exosome subunits like the PNPase N-terminal RPD, functional site prediction (Aloy et al., 2001) identifies a site in Rrp43 and Mtr3 in the same location at the intermolecular interface, which could play a role in mediating subunit interaction (Figures 2 and 5). For C-terminal-like RPDs, the method predicts a common site for Rrp41 and 42, which includes the RxDGR motif. This site is near the PNPase tungstenate, and contains several charged residues that might process or bind RNA. Although no site was predicted for Rrp45, inspection shows that some of the residues predicted in Rrp41 and 42 are also present. We also looked for single conserved polar amino acids (i.e. rather than clusters) on the protein surface, several of which line the predicted pore (Figures 2 and 5). We feel that all of these residues would be excellent candidates for mutations designed to disrupt function.
CONCLUSION
The precise quaternary structure of complexes is not always conserved across homologs or different species. Fitting subunits into complexes of homologs is thus likely to become a frequent problem for structural biology. Large-scale protein-interaction and complex discovery (see, for example, Uetz et al., 2000; Gavin et al., 2002) on the one hand and structural genomics of individual proteins on the other will provide incomplete data. Strategies to combine experimental and theoretical approaches like the one described here must be developed to suggest models for complexes where experimental structural biology is likely to prove difficult.
METHODS
Sample preparation. We purified the exosome by the TAP method as discussed in Gavin et al. (2002). When used as purification entry points, exosome components Csl4, Rrp41 (Ski6), Rrp45 and 46 produced similar complexes that agreed with descriptions in the literature. We chose the Csl4 purification for EM. Analysis of the stoichiometry of the purified complex showed roughly equal amounts of all exosome core components (Figure 1) including Rrp6 and only a trace amount (1/100 of the others) of the mRNA degradation component Ski7 (Araki et al., 2001; van Hoof et al., 2002). We are therefore confident that the sample corresponds to the nuclear rather than the cytoplasmic exosome.
EM and image processing. We negatively stained the protein sample with a solution of 2% uranylacetate and imaged it in a Philips CM120 Biotwin at 100 kV. We took micrographs under low dose conditions at a nominal magnification of 52 000, and scanned those suitable for image processing with a Zeiss-Scai scanner (pixels size 21 µm, corresponding to 4 Å at specimen level) for image processing. Individual particle images (4720) were processed with the IMAGIC 5 software package (van Heel et al., 1996) following the procedures outlined in the manual either with the reference free approach of ‘alignment by classification’ or using the PNPase trimer (PDB 1e3p limited to 20 Å resolution) to generate a set of starting references, which were used for alignment and determination of spatial orientations of particle images.
In both approaches we classified aligned particle images by similarity. The spatial orientations were determined for the averaged classes, which were combined into a 3D map using the weighted back projection algorithm. Alignment, determination of particle orientations and calculation of the 3D map were repeated several times, using the last determined 3D map for generating new references.
Sequence analysis. We used Pfam (Bateman et al., 2002), SMART (Letunic et al., 2002) and (PSI-)BLAST (Altschul et al., 1997) to analyze the domain organization of the yeast exosome components (Figure 1). All domains were reported previously, apart from a CSP RNA binding domain in Rrp44. We used BLAST to identify clear orthologs of S. cerevisiae exosome components, which we defined as well-separated sequences that find one another as closest matches in a reciprocal fashion.
We used two RPD alignments as we anticipated errors owing to low sequence similarity. For alignment 1 (Figure 3), we used the Pfam alignment RNase_PH and HMMer (Eddy, 1998) followed by manual editing, paying attention to a structure-based alignment (STAMP; Russell and Barton, 1992) of the PNPase N- and C-terminal RPDs (PDB code 1e3p, residues 3–266 and 336–568). For alignment 2, we added close homologs of PNPase N- and C-terminal RPD domains (BLAST E < 10–20) to the structure-based alignment, and used HMMer to add the exosome RPDs. The two alignments agreed closely over many regions, although with key differences owing to low local sequence identity.
Fitting exosome RPDs into PNPase. We predicted interactions between yeast exosome subunits based on PNPase using our previously described method (Aloy and Russell, 2002). We used both intra- and intermolecular interfaces, and both alignments (above) to score all 60 possible interactions between exosome RPDs. We tested the method on the DNA pol III/PCNA system by constructing alignments of DNA clamp proteins using STAMP, and using both intra- and intermolecular domain interfaces for PCNA-like structures (PDB codes 1axc, 1b77, 1dml, 1ge8 and 1plq) to predict pol III (2pol).
Homology modeling. We used alignment 1 to model exosome RPDs subunits on the appropriate PNPase domain (Mtr3, Rrp43 and 46, N-terminal; Rrp41, 42 and 45, C-terminal) with Modeler (Sali and Blundell, 1993). We made minor changes to avoid insertions/deletions that might disrupt secondary structure elements, and ignored insertions of more than eight residues. We then superimposed models on the PNPase trimer. Note that the sequence identities (9–14%) are such that only broad details, such as approximate residue location, are likely to be reliable. For illustration (Figure 5) we also constructed models for S1 domains in Rrp4, 40 and Csl4 based on PDB code 1csp and oriented them as for the PNPase equivalents.
Additional information. Purification data, alignments, interaction predictions and 3D coordinates are available at www.russell.embl-heidelberg.de/exosome.
Acknowledgments
ACKNOWLEDGEMENTS
We are grateful to Elena Conti (EMBL) for directing us to the exosome and for helpful comments on the manuscript. We thank Luis Serrano (EMBL) for encouragement and support.
REFERENCES
- Allmang C., Petfalski, E., Podtelejnikov, A., Mann, M., Tollervey, D. and Mitchell, P. (1999) The yeast exosome and human PM-Scl are related complexes of 3′→5′ exonucleases. Genes Dev., 13, 2148–2158. [DOI] [PMC free article] [PubMed] [Google Scholar]
- Aloy P. and Russell, R.B. (2002) Interrogating protein interaction networks through structural biology. Proc. Natl Acad. Sci. USA, 99, 5896–5901. [DOI] [PMC free article] [PubMed] [Google Scholar]
- Aloy P., Querol, E., Aviles, F.X. and Sternberg, M.J.E. (2001) Automated structure-based prediction of functional sites in proteins. J. Mol. Biol., 311, 395–408. [DOI] [PubMed] [Google Scholar]
- Altschul S.F., Madden, T.L., Schaffer, A.A., Zhang, J., Zhang, Z., Miller, W. and Lipman, D.J. (1997) Gapped BLAST and PSI-BLAST: a new generation of protein database search programs. Nucleic Acids Res., 25, 3389–3402. [DOI] [PMC free article] [PubMed] [Google Scholar]
- Araki Y., Takahashi, S., Kobayashi, T., Kajiho, H., Hoshino, S. and Katada, T. (2001) Ski7p G protein interacts with the exosome and the Ski complex for 3′-to-5′ mRNA decay in yeast. EMBO J., 20, 4684–4693. [DOI] [PMC free article] [PubMed] [Google Scholar]
- Bateman A. et al. (2002) The Pfam protein families database. Nucleic Acids Res., 30, 276–280. [DOI] [PMC free article] [PubMed] [Google Scholar]
- Brouwer R., Allmang, C., Raijmakers, R., van Aarssen, Y., Egberts, W.V., Petfalski, E., van Venrooij, W.J., Tollervey, D. and Pruijn, G.J. (2001) Three novel components of the human exosome. J. Biol. Chem., 276, 6177–6184. [DOI] [PubMed] [Google Scholar]
- Chekanova J.A., Shaw, R.J., Wills, M.A. and Belostotsky, D.A. (2000) Poly(A) tail-dependent exonuclease AtRrp41p from Arabidopsis thaliana rescues 5.8S rRNA processing and mRNA decay defects of the yeast ski6 mutant and is found in an exosome-sized complex in plant and yeast cells. J. Biol. Chem., 275, 33158–33166. [DOI] [PubMed] [Google Scholar]
- Chekanova J.A., Dutko, J.A., Mian, I.S. and Belostotsky, D.A. (2002) Arabidopsis thaliana exosome subunit AtRrp4p is a hydrolytic 3′→5′ exonuclease containing S1 and KH RNA-binding domains. Nucleic Acids Res., 30, 695–700. [DOI] [PMC free article] [PubMed] [Google Scholar]
- Chen C.Y. et al. (2001) AU binding proteins recruit the exosome to degrade ARE-containing mRNAs. Cell, 107, 451–464. [DOI] [PubMed] [Google Scholar]
- Eddy S.R. (1998) Profile hidden Markov models. Bioinformatics, 14, 755–763. [DOI] [PubMed] [Google Scholar]
- Estevez A.M., Kempf, T. and Clayton, C. (2001) The exosome of Trypanosoma brucei. EMBO J., 20, 3831–3839. [DOI] [PMC free article] [PubMed] [Google Scholar]
- Gavin A.C. et al. (2002) Functional organization of the yeast proteome by systematic analysis of protein complexes. Nature, 415, 141–147. [DOI] [PubMed] [Google Scholar]
- Ito T., Chiba, T., Ozawa, R., Yoshida, M., Hattori, M. and Sakaki, Y. (2001) A comprehensive two-hybrid analysis to explore the yeast protein interactome. Proc. Natl Acad. Sci. USA, 98, 4569–4574. [DOI] [PMC free article] [PubMed] [Google Scholar]
- Kong X.P., Onrust, R., O’Donnell, M. and Kuriyan, J. (1992) Three-dimensional structure of the β subunit of E. coli DNA polymerase III holoenzyme: a sliding DNA clamp. Cell, 69, 425–437. [DOI] [PubMed] [Google Scholar]
- Koonin E.V., Wolf, Y.I. and Aravind, L. (2001) Prediction of the archaeal exosome and its connections with the proteasome and the translation and transcription machineries by a comparative-genomic approach. Genome Res., 11, 240–252. [DOI] [PMC free article] [PubMed] [Google Scholar]
- Krishna T.S., Kong, X.P., Gary, S., Burgers, P.M. and Kuriyan, J. (1994) Crystal structure of the eukaryotic DNA polymerase processivity factor PCNA. Cell, 79, 1233–1243. [DOI] [PubMed] [Google Scholar]
- Letunic I. et al. (2002) Recent improvements to the SMART domain-based sequence annotation resource. Nucleic Acids Res., 30, 242–244. [DOI] [PMC free article] [PubMed] [Google Scholar]
- Mitchell P. and Tollervey, D. (2000) Musing on the structural organization of the exosome complex. Nat. Struct. Biol., 7, 843–846. [DOI] [PubMed] [Google Scholar]
- Mitchell P., Petfalski, E., Shevchenko, A., Mann, M. and Tollervey, D. (1997) The exosome: a conserved eukaryotic RNA processing complex containing multiple 3′→5′ exoribonucleases. Cell, 91, 457–466. [DOI] [PubMed] [Google Scholar]
- Raijmakers R., Noordman, Y.E., van Venrooij, W.J. and Pruijn, G.J. (2002) Protein–protein interactions of hCsl4p with other human exosome subunits. J. Mol. Biol., 315, 809–818. [DOI] [PubMed] [Google Scholar]
- Russell R.B. and Barton, G.J. (1992) Multiple protein sequence alignment from tertiary structure comparison. Proteins, 14, 309–323. [DOI] [PubMed] [Google Scholar]
- Sali A. and Blundell, T.L. (1993) Comparative protein modelling by satisfaction of spatial restraints. J. Mol. Biol., 234, 779–815. [DOI] [PubMed] [Google Scholar]
- Symmons M.F., Jones, G.H. and Luisi, B.F. (2000) A duplicated fold is the structural basis for polynucleotide phosphorylase catalytic activity, processivity, and regulation. Struct. Fold. Des., 8, 1215–1226. [DOI] [PubMed] [Google Scholar]
- Symmons M.F., Williams, M.G., Luisi, B.F., Jones, G.H. and Carpousis, A.J. (2002) Running rings around RNA: a superfamily of phosphate-dependent RNases. Trends Biochem. Sci., 27, 11–18. [DOI] [PubMed] [Google Scholar]
- Uetz P. et al. (2000) A comprehensive analysis of protein–protein interactions in Saccharomyces cerevisiae. Nature, 403, 623–627. [DOI] [PubMed] [Google Scholar]
- van Heel M., Harauz, G., Orlova, E.V., Schmidt, R. and Schatz, M. (1996) A new generation of the IMAGIC image processing system. J. Struct. Biol., 116, 17–24. [DOI] [PubMed] [Google Scholar]
- van Hoof A. and Parker, R. (1999) The exosome: a proteasome for RNA? Cell, 99, 347–350. [DOI] [PubMed] [Google Scholar]
- van Hoof A., Frischmeyer, P.A., Dietz, H.C. and Parker, R. (2002) Exosome-mediated recognition and degradation of mRNAs lacking a termination codon. Science, 295, 2262–2264. [DOI] [PubMed] [Google Scholar]


