

Abstract
The locus coeruleus (LC) is the major source for norepinephrine (NE) in the brain and projects to areas involved in learning and memory, reward, arousal, attention, and autonomic functions related to stress. There are three types of adrenergic receptors that respond to NE: alpha1-, alpha2-, and beta-adrenergic receptors. Previous behavioral studies have shown the alpha1-adrenergic receptor (α1AR) to be present in the LC, however, with conflicting results. For example, it was shown that α1ARs in the LC are involved in some of the motivational effects of stimulation of the medial forebrain bundle, which was reduced by α1AR antagonist terazosin. Another study showed that during novelty-induced behavioral activation, the α1AR antagonist prazosin reduced c-fos expression in brain regions known to contain motoric α1ARs, except for the LC, where c-fos expression was enhanced. Despite new research delineating more specific connectivity of the neurons in the LC, and some roles of the adrenergic receptors, the α1ARs have not been localized at the subcellular level. Therefore, in order to gain a greater understanding of the aforementioned studies, we used immunohistochemistry at the electron microscopic (EM) level to determine which neuronal or glial elements in the LC express the α1AR. We hypothesized, based on previous work in the ventral periaqueductal gray area, that the α1AR would be found mainly presynaptically in axon terminals, and possibly in glial elements. Single labeling immunohistochemistry at the EM revealed that about 40% of labeled elements that contained the α1AR were glial elements, while approximately 50% of the labeled neuronal elements were axon terminals or small unmyelinated axons in the LC. Double labeling immunohistochemistry found the α1AR expressed in GFAP-labeled astrocytes, in both GABAergic and glutamatergic axon terminals, and in a portion of the α1AR dendrites, colocalized with tyrosine hydroxylase (TH, a marker for noradrenergic neurons). This study sheds light on the neuroanatomical framework underlying the effects of NE and pharmaceuticals acting directly or indirectly on α1ARs in the LC.
Keywords: Locus coeruleus, adrenergic receptors, electron microscopy
1. Introduction
1.1. The locus coeruleus (LC)
The LC is the major source for norepinephrine (NE) in the brain. The LC projects NE to areas involved in learning and memory, reward, arousal, attention, and stress (Hendley et al., 1977; Aston-Jones et al., 2000; Weinshenker & Schroeder, 2007). This includes structures such as the cortex, hippocampus, striatum, periaqueductal gray area, cerebellum, and hypothalamus. In relation to afferents to the LC, many structures receiving noradrenergic input have a reciprocal connection back to the LC (Aston-Jones et al., 2000; Breton-Provencher & Sur, 2019; Chandler et al., 2019; Breton-Provencher et al., 2021). This indicates that the LC receives various neurotransmitter inputs, including glutamate and GABA. In addition to neurotransmitters, there is substantial neuropeptide input which includes enkephalin, galanin (both hyperpolarize the LC), and hypocretin (depolarizes the LC) (Pieribone et al., 1995; Aston-Jones et al., 2000, 2004a; Weinshenker & Holmes, 2016; Caramia et al., 2023). Lastly, the LC is coincidentally a site of NE release. Using pharmacological, immunohistochemical, electrophysiological, and microdialysis methods, it has been shown that the LC releases NE to its own neurons via local somatodendritic neurotransmitter release as well as from axon collaterals originating from the LC (Swanson, 1976; Aghajanian et al., 1977; Pudovkina et al., 2001; Fernandez-Pastor et al., 2005).
Traditionally thought to be all noradrenergic neurons, in recent years it has been established that the LC consists of a ‘core’ which contains noradrenergic cell bodies, and a peri-LC or ‘shell’ area in which the dendrites of the noradrenergic cells can be found (Shipley et al., 1996; Poe et al., 2020; Aston-Jones, 2004a). Within this peri-LC region, GABAergic neurons can also be found, which are believed to receive distinct inputs compared to the LC noradrenergic cells (Breton-Provencher & Sur, 2019; Breton-Provencher et al., 2021).
1.2. α1ARs in the LC
While the α2ARs’ subcellular localization has been characterized in the LC, the α1ARs have not. Previous studies examining the distribution and localization of the α1AR in the LC have used autoradiography and pharmacological manipulation of the receptors in rodent models. These studies showed that α1ARs are abundant throughout the central nervous system, including the LC (Young & Kuhar, 1980). Using radiolabeled antagonists for the α1AR depicted similar results, with a large density of α1ARs in the LC, as well as in neighboring regions (Jones et al., 1985). In an exploratory study, the α1AR antagonist, terazosin, was injected into over 20 nuclei of the mouse brain, with the LC producing motor inhibition (Stone et al., 2004).
With the knowledge that the α1AR was present in the LC, it has been shown that α1ARs are involved in some of the motivational effects of stimulation of the medial forebrain bundle, which was reduced by and intra-LC injection of terazosin (Lin et al., 2007). Another study showed that during novelty-induced behavioral activation, the α1AR antagonist, prazosin, reduced c-fos expression in brain regions known to contain ‘motoric’ α1ARs, except for the LC, where c-fos expression was enhanced (Stone et al., 2006).
So, prior studies have shown that α1ARs are present in and around the LC (but cell types and intracellular localizations for the receptor remain unknown), and pharmacological modulation of α1ARs alter LC-related behaviors and markers of neuronal activity (with somewhat conflicting findings). A more in-depth anatomical study of α1ARs in the LC is needed to provide a foundation for the interpretation of both prior and future findings on the LC noradrenergic system.
In the present study, we used immunohistochemistry at the electron microscopic (EM) level to characterize the subcellular localization of the α1AR in the LC and determine what types of neural cells contain the receptor (i.e., adrenergic/dopaminergic, glutamatergic, GABAergic, or glial cells). We hypothesized, based on previous work in the nearby ventral periaqueductal gray area (vPAG) (Porter-Stransky et al., 2019), that the α1AR would be found mainly presynaptically in unmyelinated axons and axon terminals, and possibly glial elements. This neuroanatomical study reveals the framework by which α1ARs could influence endogenous activity of the LC and lends further information on how drugs targeting these receptors may produce their effects.
2. Materials & Methods
2.1. Animal Treatment for Immunohistochemistry.
All procedures for preparing mouse tissue for immunohistochemistry were approved by the Institutional Animal Care and Use Committee of Christopher Newport University, under the guidance of the National Research Council’s Guide for the Care and Use of Laboratory Animals. Nineteen male and female C57BL/6 mice (Charles River Laboratories, Wilmington, MA) aged 8–9 weeks old were used. Mice were deeply anesthetized with a combination of ketamine (100mg/kg) and butorphanol (2mg/kg) prior to being transcardially perfused with 4% paraformaldehyde (Electron Microscopy Sciences (EMS), Hatfield, PA) and 0.1% glutaraldehyde (EMS) in phosphate buffer (PB; 0.1M, pH=7.4). Following perfusion, brains were removed and post-fixed for 72 hours in 4% paraformaldehyde. Brain tissue was then cut coronally into 60μm sections using a vibrating microtome and stored in antifreeze at −20°C until use. To prepare selected brain sections that contained the LC (approximate AP coordinates −5.34mm to −5.60mm from Bregma, Paxinos & Franklin, 2013) for immunohistochemistry, the tissue was exposed to NaBH4 for 20 minutes (ThermoFisher Scientific, Waltham, MA). For electron microscopy processing, tissue was exposed to cryoprotectant, left in a −80°C freezer for 20 minutes, followed by decreasing levels of cryoprotectant prior to procedures listed below to help permeabilize the tissue.
2.2. Primary Antibodies.
Table 1 lists all antibodies used for immunohistochemistry. Specificity of each antibody has been previously analyzed (α1AR: Nakadate et al., 2006, Mitrano et al., 2012; vGluT1 & vGluT2: Montana et al., 2004, Raju & Smith, 2005; GAD67: Fong et al., 2005, Manufacturer routinely checks for specificity using SKNSH cell lysate; TH: Masilamoni et al., 2010, Manufacturer quality control on mouse brain lysates; GFAP: Eng, 1985, Manufacturer quality control on mouse brain lysates). In relation to the α1AR antibody, it was raised against the third intracellular loop of the α1AR, a G-protein couple receptor (GPCR), which is conserved between all α1ARs, allowing it to detect all subtypes of the α1AR, but no other GPCRs (ThermoFisher). Nakadate et al. (2006) performed western blots on rat brain tissue and identified a single band of approximately 70kDa, which was eliminated by preadsorption with a synthetic α1AR peptide. Additionally, Mitrano et al. (2012) performed a preadsorption assay using immunohistochemistry and found that preadsorption of the α1AR antibody with the synthetic α1AR peptide eliminated all labeling.
Table 1:
Primary Antibodies Used to Localize the α1AR and α1AR-Containing Cells.
| Antigen | Immunogen | Manufacturer Data | Dilution Used |
|---|---|---|---|
| Alpha1- adrenergic receptor (α1AR) | Synthetic peptide corresponding to residues K(339) FSREKKAAKT(349) of the third intracellular loop of human alpha-1AR; approximately 60 kDa. | ThermoFisher Scientific, Invitrogen, Rabbit Polyclonal, #PA1–047 | 1:1000 |
| Tyrosine hydroxylase (TH) | Clone LNC1. Recognizes an epitope on the outside of the regulatory N-terminus; approximately 59–61 kDa. Purified from PC12 cells | MilliporeSigma, Mouse Monoclonal, #MAB318 | 1:750 |
| Glutamic acid decarboxylase (GAD67) | Clone 1G10.2. Purified (by Protein A) mouse monoclonal IgG2a; approximately 67kDa. | MilliporeSigma, Mouse, Monoclonal, #MAB5406 | 1:1000 |
| Vesicular glutamate transporter 1 (vGluT1) | Clone N28/9, Produced against fusion protein amino acids 493–560 of the C-terminus; approximately 52 kDa. | UC Davis/NIH NeuroMab Facility, Mouse Monoclonal, #75–066 | 1:1000 |
| Vesicular glutamate transporter 2 (vGluT2) | KLH-conjugated linear peptide corresponding to the C-terminal sequence of rat vGluT2; approximately 56 kDa. | MilliporeSigma, Guinea Pig Polyclonal, #AB2251-I | 1:10,000 |
| Glial fibrillary acidic protein (GFAP) | Clone GA5. Purified GFAP from porcine spinal cord; approximately 51 kDa. | MilliporeSigma, Chemicon, Mouse Monoclonal, #MAB360 | 1:3,000 |
2.3. Single Immunoperoxidase Labeling for Light Microscopy.
To confirm the presence of the α1AR and the various other markers in the LC, as well as to optimize working dilutions, single immunoperoxidase labeling for light microscopy was performed for all antibodies listed in Table 1. Following exposure to NaBH4, tissue containing the LC was incubated in 10% NGS (normal goat serum, Vector Laboratories, Burlingame, CA), 0.3% Triton X-100 (VWR, Radnor, PA), and 1% BSA (bovine serum albumin, Sigma-Aldrich, St. Louis, MO) in PBS (pH=7.4) for 1 hour. All tissue was then exposed to 1% NGS, 1% BSA, 0.3% Triton and each of the primary antibodies overnight at room temperature (RT). The next day, tissue was exposed to secondary biotinylated antibodies (1:200, Vector) raised against IgG of the animal in which the primary antibody was created, followed by the avidin-biotin complex (ABC, 1:100, Vector) and lastly a 3,3’ diaminobenzidine tetrachloride (DAB, 0.025%, Sigma) solution with 0.005% H2O2, and 10mM imidazole in Tris buffer (pH=7.6). Tissue was observed using a light microscope. Initially serial dilutions were used (based on Mitrano et al., 2012, and manufacturer information) to obtain labeling patterns seen previously (data not shown). The final concentrations listed in Table 1 were used for the EM studies below.
2.4. Single Pre-embedding Immunoperoxidase Labeling for Electron Microscopy for the α1AR.
Following exposure to NaBH4 and decreasing concentrations of cryoprotectant, brain sections containing the LC were pre-incubated as described above, with the exception of Triton. Tissue was incubated with the primary antibody for the α1AR for 48 hours at 4°C with 1% NGS, 1% BSA in PBS. After exposure to the biotinylated secondary goat anti-rabbit IgG (1:200, Vector), ABC and DAB, tissue was then processed for EM. This involved osmification (1% OsO4 (EMS) in PB for 20 minutes), dehydration with increasing concentrations of ethanol (while in 70% ethanol, tissue was exposed to 1% uranyl acetate for 35 minutes), and resin embedding as previously described (Mitrano & Smith, 2007). After incubating the tissue on slides with resin at 60°C for 48 hours, blocks of the LC core were removed from the larger sections and put onto resin blocks to obtain 60nm sections using an ultramicrotome. The serial sections were then placed on copper-mesh grids (EMS) to be observed on the EM.
2.5. Analysis of Single Pre-embedding Immunoperoxidase for the α1AR.
Thirty to forty electron micrographs were taken from six animals each (6 blocks) in the LC that contained immunoreactive elements for the α1AR. Micrographs were acquired at 40,000x using a CCD camera controlled by either Digital Micrograph (Gatan, Inc.) or AMT Image Capture (version 5.42.498). On the EM, immunoperoxidase appears as a black, diffuse, amorphous reaction product that fills most or the entire element in which the receptor is found, regardless of whether the receptor is intracellular or bound to the plasma membrane (Bolam, 1992). Elements were classified as dendrites, unmyelinated axons, axon terminals, or glial elements based on characteristics described in Peters et al., 1991. In short, dendrites are either round or elongated (based on the plane in which they were cut on the ultramicrotome), contain mitochondria, microtubules, stacks of endoplasmic reticulum and sometimes have a synapse present. Unmyelinated axons are small, regular, circular elements that are relatively smooth in shape, do not contain much cellular machinery, may contain microtubules (observable on the longitudinal plane), and are often found in clusters. Axon terminals are usually round and are easily identified by the presence of neurotransmitter vesicles and often the presence of mitochondria. They also often make a synaptic connection. Lastly, glial elements are usually thin, have an irregular shape, fill in spaces between the aforementioned elements, often show the presence of fibrils, and often display a tortuous trajectory across the neuropil. Table 2 lists the number of elements counted in each category. The percentage of each of the elements that contained α1AR was then calculated and averaged across the number of animals. Statistical analysis (using a series of one-way ANOVAs and the appropriate post hoc tests) to determine significant differences in the distribution of labeling of the α1AR was done using IBM SPSS Statistics, Version 28.0.0.0 (190). Graphs were created using GraphPad Prism, Version 6.07. Micrographs were edited for contrast and brightness using Adobe Photoshop (version 24.3.0).
Table 2:
Total number of neural elements counted for single pre-embedding immunoperoxidase labeling for the α1AR.
| Animal | Dendrites | Unmyelinated Axons | Axon Terminals | Glial Elements |
|---|---|---|---|---|
| 1 | 18 | 22 | 15 | 45 |
| 2 | 5 | 6 | 8 | 15 |
| 3 | 17 | 6 | 16 | 30 |
| 4 | 1 | 3 | 28 | 10 |
| 5 | 10 | 31 | 23 | 41 |
| 6 | 27 | 26 | 28 | 52 |
| TOTALS | 78 | 94 | 118 | 193 |
2.6. Double Pre-embedding Immunoperoxidase for the α1AR and Immunogold for the Neurochemical Identity of α1AR containing cells (GAD67, TH, vGluT1, vGluT2, and GFAP).
To determine the neurochemical identity of the cells containing the α1AR, five markers were used. GAD67 was used to label GABA-containing axon terminals; TH was used to label noradrenergic/dopaminergic cells; vGluT1 was used for glutamatergic terminals known to originate from neurons in the cortex and hippocampus (Fremeau et al., 2001; Raju & Smith, 2005); vGluT2 was used to label another subset of glutamatergic terminals originating from neurons in the thalamus and other hindbrain and midbrain structures (Fremeau et al., 2001); and GFAP was used as a marker for astrocytes (reviewed in Eng, 1985).
Following exposure to NaBH4 and decreasing concentrations of cryoprotectant, sections containing the LC were pre-incubated for 30 minutes with 5% dry milk in PBS at RT. The sections were then moved to the primary antibody solution containing the antibodies for the α1AR and one of the markers (GAD67, TH, vGluT1, vGluT2, or GFAP) in 1% dry milk and TBS-gelatin buffer (pH=7.6) overnight at RT. The next day sections were rinsed and then transferred to the secondary antibody solution which contained biotinylated goat anti-rabbit IgGs (1:200, Vector) to reveal the α1AR and gold-conjugated secondaries (with 1.4nm gold particles; 1:100, Nanoprobes, Yaphank, NY) that were either goat anti-mouse (for GAD67, TH, vGluT1, and GFAP) or goat anti-guinea pig (for vGluT2). Following incubation with secondary antibodies, sections were rinsed with 2% sodium acetate (pH=7.0) and the gold particles were silver intensified using a HQ kit (Nanoprobes), followed by ABC and DAB as described for single labeling. Immediately following DAB, tissue was then osmified, dehydrated, and embedded in resin overnight and placed on slides the following day, which were then baked for 48 hours at 60°C. This process was identical as that for single labeling, with the exception of keeping the tissue in 0.5% OsO4 for 10 minutes, and in uranyl acetate for 10 minutes instead of 35 minutes. Finally, blocks of tissue were removed from the larger sections that contained the LC core and placed on resin blocks. The tissue was trimmed and sliced at 60nm using an ultramicrotome and serial sections were placed on copper mesh grids for EM observation.
2.7. Analysis of Double Pre-embedding Immunoperoxidase for the α1AR and Immunogold for the Neurochemical Identity of α1AR containing cells (GAD67, TH, vGluT1, vGluT2, and GFAP).
Thirty to forty electron micrographs were taken at 40,000x of tissue stained for the α1AR revealed with immunoperoxidase and one of the five markers revealed with immunogold. Immunogold particles are seen on the EM as black dots, usually in small clusters, relative to the location of the antigen of interest. Micrographs were taken when both immunoperoxidase for the α1AR and immunogold for one of the markers was in the observable field. Pictures were captured using a CCD camera controlled by either Digital Micrograph or with AMT Image Capture. Initially, all elements containing the α1AR were identified, classified and quantified as described for single labeling EM data above. Elements containing immunogold for either GAD67, TH, vGluT1, vGluT2 or GFAP were also classified and quantified. Lastly, the percentage of elements that contained the α1AR colocalized with one of the cell-type markers was determined and then averaged across the number of animals for each grouping. Statistics to determine significant differences in the distribution of labeling of the α1AR with each marker was done using IBM SPSS Statistics. Graphs were created using GraphPad Prism and micrographs were edited for contrast and brightness using Adobe Photoshop.
3. Results
3.1. Distribution of the α1AR in the LC.
In the LC, about 40% of the neural elements containing the α1AR were glial cells, followed closely by axon terminals (~30%), unmyelinated axons (~17%), and dendrites (~15%), as displayed in Figure 1A. Sample micrographs are displayed in Figure 1B and C. A one-way ANOVA was run to detect any significant differences in the distribution of the α1AR. A test of the Homogeneity of Variances was not significant, therefore equal variances were assumed. The ANOVA revealed an effect between groups, F (3,20) =5.33, p<0.01. Tukey’s post hoc test revealed that there were a significantly higher percentage of glial elements containing the α1AR as compared to dendrites and unmyelinated axons (p<0.05 for both).
Figure 1: Subcellular distribution of the α1AR in the LC.
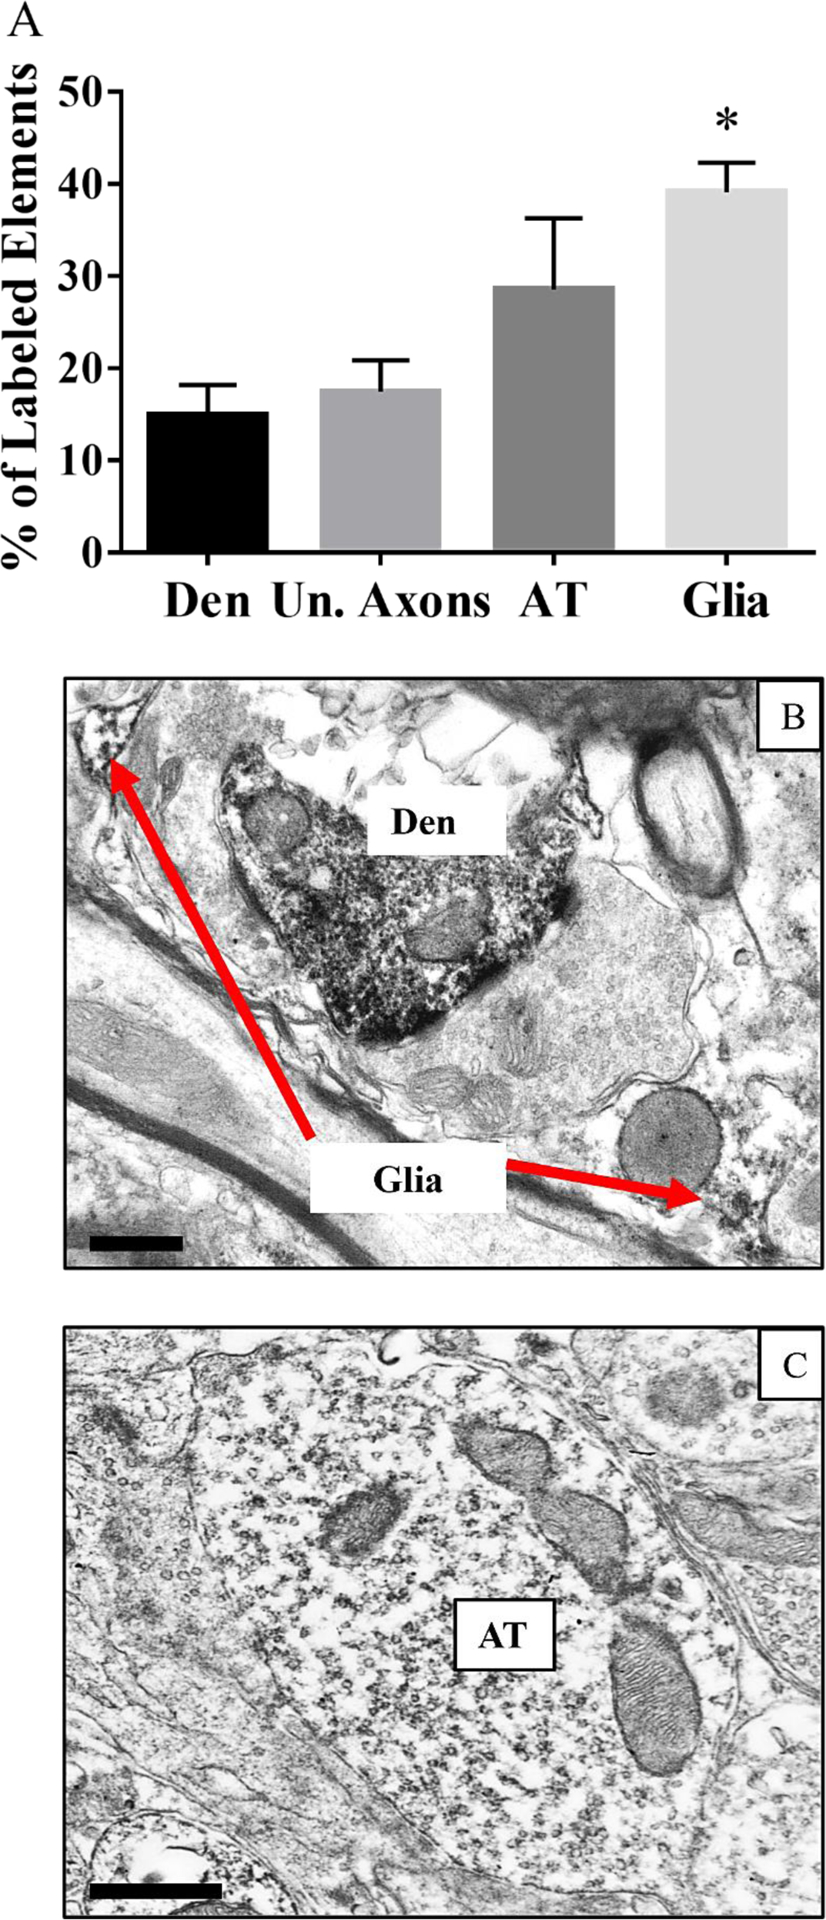
A) Bar graph showing the localization of the α1AR in the LC; * indicates significantly higher percentage of glial elements containing the α1AR compared to dendrites and unmyelinated axons; p<0.05; n=6. Den=dendrite, Un. Axons=unmyelinated axons, AT= axon terminals. B) Electron micrograph of an α1AR containing dendrite (Den) and glial cell. The entire dendrite contains immunoperoxidase labeling representative of the α1AR, while the red arrows point to the labeling in the glial element. C) Electron micrograph of an α1AR containing axon terminal (AT). The entire axon terminal contains immunoperoxidase representative of the α1AR. Scale bars = 0.5μm.
3.2. Neurochemical Identity of α1AR-containing cells.
Using double labeling immunohistochemistry, we next looked at the neurochemical identity of the neural elements that contained the α1AR. Figure 2A displays the results of quantification of α1AR-containing elements that also have labeling for the five different markers. A series of one-way ANOVAs was run for each neural element. In relation to dendrites, unequal variances were detected, therefore the Welch ANOVA test was used and indicated a significant difference in the equality of means (p<0.05). Due to unequal variance, Tamhane’s post hoc test was run and revealed that there were significantly more α1AR dendrites that contained TH compared to GAD67 (p<0.05). In relation to unmyelinated axons, unequal variances were detected, and no significant differences were revealed using the Welch ANOVA (p=0.30). This indicates that there are no statistically significant differences between α1AR labeled unmyelinated axons with each of the markers. When examining axon terminals, it was determined that there were equal variances based on the test for Homogeneity of Variances. The one-way ANOVA determined that there was a significant difference between groups, i.e., the various markers; F (4,19) =5.46, p<0.01. Tukey’s post hoc tests showed that there were significantly more α1AR axon terminals containing GAD67 compared to GFAP (p<0.01). Additionally, there were significantly more α1AR axon terminals containing vGluT2 compared to GFAP (p<0.01). No significant differences were seen amongst α1AR axon terminals that contained vGluT1, vGluT2, and TH compared to GAD67. Lastly, in relation to glial elements, equal variances were detected by Homogeneity of Variance test. The one-way ANOVA revealed a significant difference between groups, F (4,19) = 16.01, p<0.001. Tukey’s post-hoc tests showed that there were significantly more α1AR containing glial elements that were double labeled for GFAP compared to all the other markers (p<0.001).
Figure 2: Double labeling reveals that the α1AR is found on GABAergic and glutamatergic ATs and GFAP astrocytes.

A) Bar graph showing the mean percent of α1AR-labeled elements that contain each of the neurochemical markers. * Indicates significantly more α1AR dendrites that contain TH compared to GAD67, p<0.05; # indicates significantly more α1AR ATs containing GAD67 vs. GFAP, and significantly more α1AR ATs containing vGluT2 vs. GFAP, p<0.01 for both; **indicates significantly more α1AR glial elements contained GFAP compared to all the other markers (p<0.001). n= 5 for all groups except vGluT1, n=4. For B-D, the α1AR is represented by immunoperoxidase labeling, indicated in the vicinity of the red arrowheads, while the various markers are represented by immunogold particles (black arrows). B) Double labeled AT for the α1AR and vGluT1, alongside an α1AR labeled unmyelinated axon. C) Example of a double labeled AT for α1AR and GAD67 synapsing on the same dendrite as a GAD67 labeled AT. D) Example of a double labeled dendrite for α1AR and TH. E) Example of an unlabeled dendrite with two synapses – one an α1AR AT, the other a vGluT2 AT. F) Double labeled astrocyte for GFAP and the α1AR. Den= dendrites, Ul. Den= unlabeled dendrite, Un. Ax.=unmyelinated axons, AT= axon terminal. Scale bars = 0.5μm.
4. Discussion
This is the first study to examine the subcellular localization of the α1AR in the mouse LC. The α1AR, when in neurons, was mainly found in presynaptic elements: axon terminals and unmyelinated axons. Additionally, there was a significant presence of the α1AR in glial elements. Double labeling experiments showed that the α1AR was found on TH-containing dendrites, both GABAergic and glutamatergic terminals, and GFAP-labeled astrocytes. With this information, we can begin to gain a better understanding of how α1ARs can modulate neurotransmitter input and output in the LC, including endogenous NE. More importantly, this information, along with physiological, pharmacological, and behavioral studies can begin to produce an understanding of the neurological processes leading to relapse to drugs of abuse that involve norepinephrine. These findings also reveal potential sites of action where pharmaceuticals designed to target the α1AR could exhibit their effects.
4.1. Comparison to α1ARs in other regions and the α2ARs in the LC
The α1AR has been studied both functionally and anatomically beginning in the periphery, with early studies pointing to the α1AR as causing an excitatory cellular effect (shown later to be a Gq-coupled receptor), causing smooth muscle contraction and vasoconstriction outside of the central nervous system (Berthelsen & Pettinger, 1977). This view led most to think of the α1AR as more of a postsynaptic receptor, rather than being presynaptic in the brain, as can be seen in various models (for example see Poe et al., 2020). However, this has been shown not to be the case in the nucleus accumbens, VTA, prefrontal cortex, and dorsal striatum, where the α1AR was found most highly expressed in presynaptic axon terminals and small unmyelinated axons (Rommelfanger et al., 2009; Mitrano et al., 2012). Most recently, in more caudal structures, such as the ventral periaqueductal gray, and now the LC, the α1AR is seen in abundance in suspected astrocytes, confirmed by the colocalization with GFAP (Porter-Stransky et al., 2019).
In contrast, α2ARs have traditionally been thought to be solely a presynaptic auto-receptor (Berthelsen & Pettinger, 1977; Poe et al., 2020). α2ARs have been localized in the LC of rats using EM. In contrast to the α1AR, over 50% of the α2AAR labeling was found postsynaptically, observed by their colocalization in catecholaminergic (TH-containing) dendrites. They were also found in glial processes (~30%) and to a much lesser extent (~15%), axon terminals (Lee et al., 1998a). α2CARs were found most prominently postsynaptically in catecholaminergic dendrites in the LC that also formed asymmetric synapses, indicating their potential role in modulating excitatory input to the LC (Lee et al., 1998b). This lends to a re-examination of how we view the potential effects of the αARs in general, as their localizations on both sides of the synapse make their effects more complicated to understand.
4.2. NE, GABA, glutamate, α1ARs and LC activity
Noradrenergic neurons fire and release NE to their targets in two ways- tonically and phasically. Tonic firing of noradrenergic neurons, causing a sustained release of NE, is associated with wakefulness, exploratory behavior, goal-directed behavior, and attention (Benarroch, 2009; Breton-Provencher & Sur, 2019). Some refer to the LC as the novelty detector, as phasic release of NE from the LC is usually in response to acute exposure to stressful stimuli and novel situations (Benarroch, 2009; Breton-Provencher & Sur, 2019). Following the phasic or burst firing, the neurons in the LC are inhibited for a period of time; using electrophysiology, it was shown that this suppression in neuronal firing is due to NE being released in the LC (Aghajanian et al., 1977). The LC releases NE to itself through two possible mechanisms- from somatodendritic release and/or axon collaterals returning to the LC (Aghajanian et al., 1977; Pudovkina et al., 2001; Fernandez-Pastor et al., 2005). Further evidence has shown that blocking calcium transmission or application of tetrodotoxin (TTX), resulted in decreases in extracellular NE in the LC, indicating synaptic release of NE in the LC and prefrontal cortex (PFC), believed to be controlled by α2ARs (Pudovkina et al., 2001; Fernandez-Pastor et al., 2005). The role of the α1AR in response to NE in the LC has been less extensively studied. Using microdialysis, an α1AR agonist, cirazoline, was applied to the LC and increased the levels of NE (Pudovkina et al., 2001). A follow-up microdialysis study examining whether or not the α1AR played a role in the tonic activation of the LC was done by implanting probes in the LC and PFC. When the α1AR antagonist prazosin was injected directly into the LC, levels of NE remained at basal levels in the PFC, but were decreased by 50% in the LC, while the α2AR antagonist idazoxan increased LC NE by 400% and in the PFC by 150% (Pudovkina & Westerink, 2005). When both antagonists were injected together, the amount of NE in the LC and cortex were decreased. The authors concluded that the α1ARs are involved in the regulation of LC activity and NE release from the LC and could affect LC-NE neurons (Pudovkina & Westerink, 2005). In light of the results of this study, the fact that about 50% of α1AR dendrites also contained TH, indicate that the receptor is on noradrenergic neurons. Their presence on dendrites could be what is underlying the effects seen in the aforementioned physiological and microdialysis studies, through somatodendritic and/or dendro-dendritic release of NE in the LC, further showing the importance of knowing where the α1AR is found at the subcellular level.
The present study has also shown that α1ARs are abundant in GABAergic and glutamatergic axon terminals in the mouse LC. This is not surprising based on previous anatomical work that characterized various inputs that synapsed on noradrenergic dendrites in the rat LC. Using electron microscopy, it was found that about 90% of the axon terminals contacting noradrenergic dendrites in the LC contained either GABA or glutamate. Further classification showed that about two-thirds of the terminals contained GABA, while the other third contained glutamate (Somogyi & Llewellyn-Smith, 2001).
GABAergic input to the LC comes from numerous sources, including the perifascicular area of the nucleus prepositus hypoglossi (PrH) of the rostral medulla, the striatum, the bed nucleus of the stria terminalis (BNST), and the cerebellum (Ottersen & Storm-Mathisen, 1984; Aston-Jones et al., 1991; Breton-Provencher et al., 2021). Researchers have also identified a population of GABAergic neurons in the peri-LC area; these neurons are possibly serving as interneurons to the dendrites of LC neurons found in this area (Aston-Jones et al., 2004b). This leads to the question, is the α1AR modulating GABA release in the core of the LC? While beyond the scope of this anatomical study, it is feasible that the α1AR has the potential to modulate GABA release on LC neurons. For example, in Stone et al. (2006), mice were exposed to a novel environment (a clean cage) and c-fos expression was examined after exposure to prazosin in various regions of the brain known to contain α1ARs. In areas such as the nucleus accumbens and cingulate cortex, c-fos expression was decreased; however, in the LC, c-fos expression was enhanced (Stone et al., 2006). Since it is now known that the α1AR is on GABAergic terminals, antagonizing the receptor may stop the release of GABA onto the LC neurons, disinhibiting them, and therefore accounting for the increase in c-fos expression. The idea of the peri-LC GABA neurons affecting the LC neurons is also in agreement with a recent study that showed that activating the peri-LC GABA neurons can decrease the tonic firing of the LC, which in turn decreased arousal and exploratory behavior in mouse models (Luskin et al., 2022).
In contrast, glutamatergic inputs to the LC include the nucleus paragigantocellularis (PGi) of the rostral medulla, the periaqueductal gray area, the prefrontal cortex, and amygdala (Ottersen & Storm-Mathisen, 1984; Aston-Jones et al., 1991; Breton-Provencher et al., 2021). Using a combination of tract tracing and electrophysiology, researchers attempted to map the inputs to the noradrenergic neurons in the LC versus the GABAergic LC neurons. Inputs to both types of neurons seem to regulate phasic NE output activity, whereas the prefrontal cortex glutamatergic projection to LC-GABA neurons regulates tonic release of NE from LC-noradrenergic neurons (Breton-Provencher & Sur, 2019). In this study we found that α1AR-containing axon terminals contained vGluT1 as well as vGluT2. Vesicular glutamate transporters serve as excellent markers for glutamatergic input. It has been established in rodent and human that vGluT1 can be found in terminals arising from the prefrontal cortex, hippocampus, lateral amygdala, and cerebellum, while vGluT2 is found in terminals from the thalamus, as well as numerous brainstem nuclei (El Mestikawy et al., 2011; Vigneault et al., 2015). Although not studied as extensively, the α1AR could be modulating glutamate release onto LC neurons, coming from various sources, with increases in glutamate enhancing the activity of the LC.
4.3. α1ARs in astrocytes
This study supports the potential for NE-astrocytic modulation of synapses. For example, in the cortex, either electrical stimulation of the LC or sensory stimulation (via whisker stimulation or air-puff startle), lead to rapid increases in intracellular calcium levels in astrocytes that were blocked by αAR antagonists, including the specific α1AR antagonist, prazosin (Bekar et al., 2008; Ding et al., 2013).
In the rostral vPAG, the α1ARs show a heavy presence on astrocytes; activating the α1AR with NE from the LC, causes the release of gliotransmitters that induce glutamate release, which activates the vPAG dopamine neurons, resulting in increased wakefulness in mouse models (Porter-Stransky et al., 2019). Others have looked at intracellular signaling in astrocytes after the activation of the α1AR. The Gq-coupled α1AR should trigger the release of intracellular calcium in the astrocyte (Wahis & Holt, 2021). Interestingly, astrocytic calcium levels increase during wakefulness, while they decrease during sleep (Ingiosi & Frank, 2022; Tsunematsu et al., 2021). Due to the high presence of the α1AR on astrocytes in the LC, there is a definite possibility that activation of this receptor has implications for wakefulness, furthering evidence of the LC’s role in arousal. Lastly, α1AR activation may cause LC astrocytes to release adenosine triphosphate (ATP) as a gliotransmitter. ATP, once released into the extracellular space, is quickly hydrolyzed to adenosine, one of the neurotransmitters associated with sleep and drowsiness (Dunwiddie & Masino, 2001; Ingiosi & Frank, 2022). Further study would be needed to see how adenosine, NE, and the α1AR all interact within the LC.
GFAP, although one of the most common ways to identify astrocytes, has its caveats. This may be why only ~60% of the α1AR containing glial elements contain GFAP. GFAP is technically a marker for activated astrocytes; when the brain is activated by certain stimuli (usually an insult or injury), GFAP expression is induced in astrocytes, leading to elaboration of the astrocytic processes (Eng, 1985; Eng & Ghirnikar, 1994). Therefore, the remaining α1AR-containing glial elements may be parts of inactivated astrocytes (with low GFAP expression) which would have to be identified using different markers such as, glutamine synthetase (Rose et al., 2013), N-Myc downstream-regulated gene 2 (NDRG2), or S100β, a Ca2+ binding protein (Zhang et al., 2019).
4.4. α1ARs in stress, substance abuse, and relapse
The amount of NE increases proportionally to the demands of any task, including stressful ones, while more mundane activities such as sleeping cause a diminishment of NE (Aston-Jones et al., 2000; Downs & McElligott, 2022). Unsurprisingly, NE increases are also implicated in substance use disorders (SUD) (Downs & McElligott, 2022). During the withdrawal period from a drug, the user usually experiences heightened NE levels, resulting in negative symptoms, like anxiety and insomnia (Koob & Volkow, 2016). The α1ARs are widely known to initiate the essential behaviors governed by NE (Lin et al., 2008). This means that as the withdrawal stage progresses and the user experiences stronger cravings, α1ARs are more likely to be activated by the increased NE in the LC and initiate relapse (Downs & McElligott, 2022). For example, insomnia, the inability to fall asleep or maintain REM sleep is a stressor associated with relapse to many SUDs, particularly alcohol use disorder (AUD) (Koob & Volkow, 2016; Lipinska et al., 2016). Due to increased NE, the α1ARs are activated, and restful sleep is elusive (Aston-Jones et al., 2000). If NE was unable to bind to the α1ARs, the lack of activity in the LC would induce sleep behaviors (Aston-Jones et al., 2000). Thus, utilizing an α1AR antagonistic agent is a good candidate strategy to combat relapse due to increased stress.
Prazosin is an example of an α1AR antagonist that is already in use treat PTSD, a disorder that occurs in response to a traumatic event, in which the body struggles to regulate its reactions to certain stimuli (Lipinska et al., 2016). This results in intrusive thoughts, nighttime disturbances, and anxiety related to an increase in NE brought on by the trigger (Verplaetse et al., 2019). It has been found that symptoms are more effectively modulated by reducing the availability of α1ARs rather than by increasing serotonin levels via serotonin reuptake inhibitors (Petrakis et al., 2015). Prazosin is a likely candidate to improve symptoms of alcohol withdrawal with the same tactics (Verplaetse et al., 2019). Few clinical trials have been conducted to demonstrate the effectiveness of prazosin on treating SUDs; however, the results are promising. In self-administration paradigms with rodents, opioid injection frequency decreased following prazosin delivery (Petrakis et al., 2015). Further, human studies have shown that prazosin decreased alcohol cravings in subjects with AUD (Petrakis et al., 2015). It is worthwhile to note that the comorbidity of PTSD and AUD seems to decrease the effectiveness of prazosin on treating either disorder, though further investigation is needed (Verplaetse et al., 2019).
4.5. Technical limitations
Transmission electron microscopy does have its technical limitations. For example, using the immunoperoxidase technique provides the relative subcellular localization of the α1AR within a neural element. As stated in the Methods, it is a diffuse reaction product that either fills most, or a good portion of the element it is found in, as is seen in Figure 1A. On occasion, it will only label close to where the α1AR is found (Figure 2C). The main caveat with this method is that it does not provide information on whether the receptor is intracellular or on the plasma membrane. While the immunogold technique could provide the relative subsynaptic localization of the α1AR, preliminary work using the immunogold method did not prove compatible with the α1AR antibody.
In relation to double labeling for the α1AR and the various markers, a drawback of doing double pre-embedding immunohistochemistry (immunoperoxidase and immunogold together), is that occasionally the immunoperoxidase will not appear as dark as when immunoperoxidase labeling along is performed. This is due to a number of factors, including a shorter incubation time in a lower concentrated osmium solution, as well as a shorter time in uranyl acetate to help protect the sensitive immunogold labeling. Both osmium and uranyl acetate help stain and enhance the contrast of the tissue, therefore it would be expected to see a less dense/lighter immunoperoxidase reaction product in double labeled tissue. This may cause some labeled elements to be misses.
Lastly, the main area of the LC that was sampled for this study was the LC core, in coronally cut brain sections. This is important to note, as there may have been slightly different results if the LC was cut on the horizontal plane or if samples were taken from both the core and peri-LC area. For example, as you move anterior to posterior, there is an increased number of LC-GABA neurons not only in the peri-LC dendritic region but extending into the core of the LC (Breton-Provencher & Sur, 2019). Additionally, recent evidence has shown that there are differential outputs and inputs to the LC core vs. peri-LC area, and a more heterogenous cell population in the LC than originally thought (Breton-Provencher & Sur, 2019; Luskin et al., 2022).
Conclusion
The subcellular localization of the α1AR on a portion of TH-containing dendrites, on GABAergic and glutamatergic axon terminals, unmyelinated axons, and astrocytes, brings to light the many possibilities the receptor has in modulating neurotransmission in and from the LC.
Highlights:
The alpha1-adrenergic receptor (α1AR) was localized in the mouse locus coeruleus.
α1ARs are found in glial elements & presynaptically in axons & axon terminals.
α1ARs are in GABA & glutamate terminals, as well as in TH-dendrites & astrocytes.
Acknowledgements:
The following individuals are recognized for analyzing electron microcopy data: Olivia Gookin, Lillian Nelson, Dante Ntiganzwa, Matilah Pamie-George, and Amber Shearin. Thanks to James W. Bogenpohl, Ph.D., for technical assistance during perfusion procedures and manuscript editing.
Funding:
This work was supported by the National Institutes of Health, National Institute of Neurological Disorders and Stroke Grant No. R01NS102306 (DAM); and Christopher Newport University Summer Scholar Funds (ZL, AB).
Electron Microscopy was performed at 1) The University of Richmond with the aid of Christie Lacy, JEOL-1010; 2) The VCU Massey Cancer Center Microscopy Core Facility, supported in part with funding from NIH-NCI Cancer Center Support Grant P30 CA016059, JEOL-1400; and 3) Emory National Primate Center, laboratory of Dr. Yoland Smith, with the aid of Jean-Francois Pare, Base grant NIH/ORIP P51OD011132, JEOL-1011.
Footnotes
Publisher's Disclaimer: This is a PDF file of an unedited manuscript that has been accepted for publication. As a service to our customers we are providing this early version of the manuscript. The manuscript will undergo copyediting, typesetting, and review of the resulting proof before it is published in its final form. Please note that during the production process errors may be discovered which could affect the content, and all legal disclaimers that apply to the journal pertain.
Declaration of interests
The authors declare that they have no known competing financial interests or personal relationships that could have appeared to influence the work reported in this paper.
CRediT Author Statement
Zachary N.M. Luyo: Investigation, Writing-Original Draft, Visualization
Abigail B. Lawrence: Investigation, Writing-Original Draft, Validation
Theodore G. Stathopoulos: Investigation, Writing-Original Draft
Darlene A. Mitrano: Conceptualization, Methodology, Formal analysis, Investigation, Writing-Original Draft, Writing-Review & Editing, Visualization, Supervision, Project administration, Funding acquisition.
Ethical Statement
As stated in the manuscript: All procedures for preparing mouse tissue for immunohistochemistry were approved by the Institutional Animal Care and Use Committee of Christopher Newport University, under the guidance of the National Research Council’s Guide for the Care and Use of Laboratory Animals. Nineteen male and female C57BL/6 mice (Charles River Laboratories, Wilmington, MA) aged 8–9 weeks old were used.
Christopher Newport University also maintains PHS (Public Health Service) Assurance with OLAW (Office of Laboratory Animal Welfare).
References
- Aghajanian GK, Cedarbaum JM, & Wang RY, 1977. Evidence for norepinephrine-mediated collateral inhibition of locus coeruleus neurons. Brain Res. 136(3), 570–577. 10.1016/0006-8993(77)90083-x. [DOI] [PubMed] [Google Scholar]
- Aston-Jones G, Rajkowski J, & Cohen J, 2000. Locus coeruleus and regulation of behavioral flexibility and attention. Prog Brain Res. 126, 165–182. 10.1016/S0079-6123(00)26013-56123(00)26013-5. [DOI] [PubMed] [Google Scholar]
- Aston-Jones G, Shipley MT, Chouvet G, Ennis M, van Bockstaele E, Pieribone V, Shiekhattar R, Akaoka H, Drolet G, & Astier B, 1991. Afferent regulation of locus coeruleus neurons: anatomy, physiology and pharmacology. Prog Brain Res. 88, 47–75. 10.1016/s0079-6123(08)63799-1. [DOI] [PubMed] [Google Scholar]
- Aston-Jones G, 2004a. CHAPTER 11 - Locus Coeruleus, A5 and A7 Noradrenergic Cell Groups, in: Paxinos G, (Ed.), The Rat Nervous System (Third Edition). Academic Press, pp.259–294. 10.1016/B978-012547638-6/50012-2. [DOI] [Google Scholar]
- Aston-Jones G, Zhu Y, & Card JP, 2004b. Numerous GABAergic afferents to locus coeruleus in the pericerulear dendritic zone: Possible interneuronal pool. J Neurosci. 24, 2313–2321. 10.1523/jneurosci.5339-03.2004. [DOI] [PMC free article] [PubMed] [Google Scholar]
- Bekar LK, He W, & Nedergaard M, 2008. Locus coeruleus alpha-adrenergic-mediated activation of cortical astrocytes in vivo. Cereb Cortex, 18(12), 2789–2795. 10.1093/cercor/bhn040. [DOI] [PMC free article] [PubMed] [Google Scholar]
- Benarroch EE, 2009. The locus ceruleus norepinephrine system: functional organization and potential clinical significance. Neurology, 73, 1699–1704. 10.1212/WNL.0b013e3181c2937c. [DOI] [PubMed] [Google Scholar]
- Berthelsen S, & Pettinger WA, 1977. A functional basis for classification of alpha-adrenergic receptors. Life Sci. 21, 595–606. 10.1016/0024-3205(77)90066-2. [DOI] [PubMed] [Google Scholar]
- Bolam JP, 1992. Experimental neuroanatomy: A practical approach. Oxford University Press, Oxford. [Google Scholar]
- Breton-Provencher V, & Sur M, 2019. Active control of arousal by a locus coeruleus GABAergic circuit. Nat Neurosci, 22(2), 218–228. 10.1038/s41593-018-0305-z [DOI] [PMC free article] [PubMed] [Google Scholar]
- Breton-Provencher V, Drummond GT, & Sur M, 2021. Locus Coeruleus Norepinephrine in Learned Behavior: Anatomical Modularity and Spatiotemporal Integration in Targets. Front Neural Circuits, 15, 638007. 10.3389/fncir.2021.638007. [DOI] [PMC free article] [PubMed] [Google Scholar]
- Caramia M, Romanov RA, Sideromenos S, Hevesi Z, Zhao M, Krasniakova M, Xu ZD, Harkany T, & Hökfelt TGM, 2023. Neuronal diversity of neuropeptide signaling, including galanin, in the mouse locus coeruleus. Proc Natl Acad Sci USA, 120(31), e2222095120. 10.1073/pnas.2222095120. [DOI] [PMC free article] [PubMed] [Google Scholar]
- Chandler DJ, Jensen P, McCall JG, Pickering AE, Schwarz LA, & Totah NK, 2019. Redefining Noradrenergic Neuromodulation of Behavior: Impacts of a Modular Locus Coeruleus Architecture. J. Neurosci, 39(42), 8239–8249. 10.1523/JNEUROSCI.1164-19.201919.2019. [DOI] [PMC free article] [PubMed] [Google Scholar]
- Ding F, O’Donnell J, Thrane AS, Zeppenfeld D, Kang H, Xie L, Wang F, & Nedergaard M, 2013. α1-Adrenergic receptors mediate coordinated Ca2+ signaling of cortical astrocytes in awake, behaving mice. Cell calcium, 54(6), 387–394. 10.1016/j.ceca.2013.09.001. [DOI] [PMC free article] [PubMed] [Google Scholar]
- Downs AM, & McElligott ZA, 2022. Noradrenergic circuits and signaling in substance use disorders. Neuropharmacology, 208, 108997. 10.1016/j.neuropharm.2022.108997. [DOI] [PMC free article] [PubMed] [Google Scholar]
- Dunwiddie TV, & Masino SA, 2001. The role and regulation of adenosine in the central nervous system. Annu Rev Neurosci. 24, 31–55. 10.1146/annurev.neuro.24.1.31. [DOI] [PubMed] [Google Scholar]
- El Mestikawy S, Wallén-Mackenzie A, Fortin GM, Descarries L, & Trudeau LE, 2011. From glutamate co-release to vesicular synergy: vesicular glutamate transporters. Nat Rev Neurosci. 12(4), 204–216. 10.1038/nrn2969. [DOI] [PubMed] [Google Scholar]
- Eng LF, 1985. Glial fibrillary acidic protein (GFAP): the major protein of glial intermediate filaments in differentiated astrocytes. J Neuroimmunol, 8, 203–214. 10.1016/s0165-5728(85)80063-15728(85)80063-1. [DOI] [PubMed] [Google Scholar]
- Eng LF, & Ghirnikar RS, 1994. GFAP and astrogliosis. Brain Pathol. 4(3), 229–237. 10.1111/j.1750-3639.1994.tb00838.x. [DOI] [PubMed] [Google Scholar]
- Fernández-Pastor B, Mateo Y, Gómez-Urquijo S, & Javier Meana J, 2005. Characterization of noradrenaline release in the locus coeruleus of freely moving awake rats by in vivo microdialysis. Psychopharmacology, 180(3), 570–579. 10.1007/s00213-005-2181-y. [DOI] [PubMed] [Google Scholar]
- Fong AY, Stornetta RL, Foley CM, & Potts JT, 2005. Immunohistochemical localization of GAD67-expressing neurons and processes in the rat brainstem: subregional distribution in the nucleus tractus solitarius. J Comp Neurol. 493, 274–290. 10.1002/cne.20758. [DOI] [PubMed] [Google Scholar]
- Fremeau RT Jr., Troyer MD, Pahner I, Nygaard GO, Tran CH, Reimer RJ, Bellocchio EE, Fortin D, Storm-Mathisen J, Edwards RH, 2001. The expression of vesicular glutamate transporters defines two classes of excitatory synapse. Neuron. 31, 247–260. 10.1016/s0896-6273(01)00344-0. [DOI] [PubMed] [Google Scholar]
- Hendley ED, Burrows GH, Robinson ES, Heidenreich KA, & Bulman CA, 1977. Acute stress and the brain norepinephrine uptake mechanism in the rat. Pharmacol Biochem Behav. 6(2), 197–202. 10.1016/0091-3057(77)90074-0. [DOI] [PubMed] [Google Scholar]
- Ingiosi AM, & Frank MG, 2023. Goodnight, astrocyte: waking up to astroglial mechanisms in sleep. FEBS J. 290(10), 2553–2564. 10.1111/febs.16424. [DOI] [PMC free article] [PubMed] [Google Scholar]
- Jones LS, Gauger LL, & Davis JN, 1985. Anatomy of brain alpha1-adrenergic receptors: In vitro autoradiography with [125I]-heat. J Comp Neurol. 231, 190–208. 10.1002/cne.902310207. [DOI] [PubMed] [Google Scholar]
- Koob GF, & Volkow ND (2016). Neurobiology of addiction: a neurocircuitry analysis. Lancet Psychiatry. 3(8), 760–773. 10.1016/S2215-0366(16)00104-8. [DOI] [PMC free article] [PubMed] [Google Scholar]
- Lee A, Rosin DL, & Van Bockstaele EJ, 1998a. α2A-adrenergic receptors in the rat nucleus locus coeruleus: subcellular localization in catecholaminergic dendrites, astrocytes, and presynaptic axon terminals. Brain Res. 795, 157–169. 10.1016/s0006-8993(98)00266-28993(98)00266-2. [DOI] [PubMed] [Google Scholar]
- Lee A, Rosin DL, & Van Bockstaele EJ, 1998b. Ultrastructural evidence for prominent postsynaptic localization of α2C-adrenergic receptors in catecholaminergic dendrites in the rat locus coeruleus. J Comp Neurol. 394, 218–229. . [DOI] [PubMed] [Google Scholar]
- Lin Y, de Vaca SC, Carr KD, & Stone EA, 2007. Role of α1-adrenoceptors of the locus coeruleus in self-stimulation of the medial forebrain bundle. Neuropsychopharmacology, 32, 835–841. 10.1038/sj.npp.1301145. [DOI] [PubMed] [Google Scholar]
- Lin Y, Quartermain D, Dunn AJ, Weinshenker D, & Stone EA, 2008. Possible dopaminergic stimulation of locus coeruleus alpha1-adrenoceptors involved in behavioral activation. Synapse. 62(7), 516–523. 10.1002/syn.20517. [DOI] [PMC free article] [PubMed] [Google Scholar]
- Lipinska G, Baldwin DS, & Thomas KG, 2016. Pharmacology for sleep disturbance in PTSD. Hum Psychopharmacol. 31(2), 156–163. 10.1002/hup.2522. [DOI] [PubMed] [Google Scholar]
- Luskin AT, Li L, Fu X, Barcomb K, Blackburn T, Li EM, Rana A, Simon RC, Sun L, Murry AD, Golden SA, Stuber GD, Ford CP, Gu L, Bruchas MR, 2022. A diverse network of pericoerulear neurons control arousal states. bioRxiv 2022.06.30.498327; doi: 10.1101/2022.06.30.498327. [DOI] [Google Scholar]
- Masilamoni G, Votaw J, Howell L, Villalba RM, Goodman M, Voll RJ, Stehouwer J, Wichmann T, Smith Y, 2010. (18)F-FECNT: validation as PET dopamine transporter ligand in parkinsonism. Exp Neurol. 226, 265–273. 10.1016/j.expneurol.2010.08.024. [DOI] [PMC free article] [PubMed] [Google Scholar]
- Mitrano DA & Smith Y, 2007. Comparative analysis of the subcellular and subsynaptic localization of mGluR1a and mGluR5 metabotropic glutamate receptors in the shell and core of the nucleus accumbens in rat and monkey. J Comp Neurol. 500, 788–806. 10.1002/cne.21214. [DOI] [PubMed] [Google Scholar]
- Mitrano DA, Schroeder J, Smith Y, Cortright J, Bubula N, Vezina P, Weinshenker D, 2012. Alpha1-adrenergic receptors are localized on presynaptic elements in the nucleus accumbens and regulate mesolimbic dopamine transmission. Neuropsychopharmacology. 37, 2161–2172. 10.1038/npp.2012.68. [DOI] [PMC free article] [PubMed] [Google Scholar]
- Montana V, Ni Y, Sunjara V, Hua X, Papura V, 2004. Vesicular glutamate transporter-dependent glutamate release from astrocytes. J. Neurosci 24, 2633–2642. 10.1523/JNEUROSCI.3770-03.2004. [DOI] [PMC free article] [PubMed] [Google Scholar]
- Nakadate K, Imamura K, Watanabe Y, 2006. Cellular and subcellular localization of alpha-1 adrenoceptors in the rat visual cortex. Neuroscience. 141, 1783–1792. 10.1016/j.neuroscience.2006.05.031. [DOI] [PubMed] [Google Scholar]
- Ottersen OP, & Storm-Mathisen J, 1984. Glutamate- and GABA-containing neurons in the mouse and rat brain, as demonstrated with a new immunocytochemical technique. J Comp Neurol. 229(3), 374–392. 10.1002/cne.902290308. [DOI] [PubMed] [Google Scholar]
- Paxinos G & Franklin K, 2013. The mouse brain in stereotaxic coordinates; 4th edition. London: Elsevier Academic Press. [Google Scholar]
- Peters A, Palay S, Webster HD, 1991. The fine structure of the nervous system: neurons and their supporting cells. New York: Oxford University Press. [Google Scholar]
- Petrakis IL, Desai N, Gueorguieva R, Arias A, O’Brien E, Jane JS, Sevarino K, Southwick S, & Ralevski E, 2016. Prazosin for Veterans with Posttraumatic Stress Disorder and Comorbid Alcohol Dependence: A Clinical Trial. Alcohol Clin Exp Res. 40(1), 178–186. 10.1111/acer.12926. [DOI] [PubMed] [Google Scholar]
- Pieribone VA, Xu ZQ, Zhang X, Grillner S, Bartfai T, & Hökfelt T, 1995. Galanin induces a hyperpolarization of norepinephrine-containing locus coeruleus neurons in the brainstem slice. Neuroscience, 64(4), 861–874. 10.1016/0306-4522(94)00450-j. [DOI] [PubMed] [Google Scholar]
- Poe GR, Foote S, Eschenko O, Johansen JP, Bouret S, Aston-Jones G, Harley CW, Manahan-Vaughan D, Weinshenker D, Valentino R, Berridge C, Chandler DJ, Waterhouse B, & Sara SJ, 2020. Locus coeruleus: a new look at the blue spot. Nat Rev Neurosci., 21, 644–659. 10.1038/s41583-020-0360-9. [DOI] [PMC free article] [PubMed] [Google Scholar]
- Porter-Stransky KA, Centanni SW, Karne SL, Odil LM, Fekir S, Wong JC, Jerome C, Mitchell HA, Escayg A, Pedersen NP, Winder DG, Mitrano DA, & Weinshenker D, 2019. Noradrenergic transmission at alpha1-adrenergic receptors in the ventral periaqueductal gray modulates arousal. Biol Psychiatry. 85, 237–247. 10.1016/j.biopsych.2018.07.027. [DOI] [PMC free article] [PubMed] [Google Scholar]
- Pudovkina OL, Kawahara Y, de Vries J, & Westerink BH, 2001. The release of noradrenaline in the locus coeruleus and prefrontal cortex studied with dual-probe microdialysis. Brain Res. 906(1–2), 38–45. 10.1016/s0006-8993(01)02553-7. [DOI] [PubMed] [Google Scholar]
- Pudovkina OL, & Westerink BH, 2005. Functional role of alpha1-adrenoceptors in the locus coeruleus: a microdialysis study. Brain Res. 1061(1), 50–56. 10.1016/j.brainres.2005.08.049. [DOI] [PubMed] [Google Scholar]
- Raju DV, Smith Y, 2005. Differential localization of vesicular glutamate transporters 1 and 2 in the rat striatum. In: Bolam JP, Ingham CA, Magill PJ, (eds). The basal ganglia VIII. Springer Science: New York, pp 601–610. [Google Scholar]
- Rommelfanger KS, Mitrano DA, Smith Y, & Weinshenker D (2009). Light and electron microscopic localization of alpha-1 adrenergic receptor immunoreactivity in the rat striatum and ventral midbrain. Neuroscience. 158(4), 1530–1540. 10.1016/j.neuroscience.2008.11.019. [DOI] [PMC free article] [PubMed] [Google Scholar]
- Rose CF, Verkhratsky A, & Parpura V, 2013. Astrocyte glutamine synthetase: pivotal in health and disease. Biochem Soc Trans. 41(6), 1518–1524. 10.1042/BST20130237. [DOI] [PubMed] [Google Scholar]
- Shipley MT, Fu L, Ennis M, Liu WL, & Aston-Jones G, 1996. Dendrites of locus coeruleus neurons extend preferentially into two pericoerulear zones. J Comp Neurol. 365, 56–68. . [DOI] [PubMed] [Google Scholar]
- Somogyi J, & Llewellyn-Smith IJ, 2001. Patterns of colocalization of GABA, glutamate and glycine immunoreactivities in terminals that synapse on dendrites of noradrenergic neurons in rat locus coeruleus. Eur J Neurosci. 14, 219–228. 10.1046/j.0953-816x.2001.01638.x. [DOI] [PubMed] [Google Scholar]
- Stone EA, Lin Y, Ahsan R, & Quartermain D, 2004. Gross mapping of alpha1-adrenoceptors that regulate behavioral activation in the mouse brain. Behav Brain Res. 152, 167–175. 10.1016/j.bbr.2003.10.002. [DOI] [PubMed] [Google Scholar]
- Stone EA, Yan L, Ahsan MR, Lehmann ML, Yeretsian J, & Quartermain D, 2006. Role of CNS α1-adrenoceptor activity in central fos responses to novelty. Synapse. 59, 299–307. 10.1002/syn.20243. [DOI] [PubMed] [Google Scholar]
- Swanson LW, 1976. The locus coeruleus: a cytoarchitectonic, Golgi and immunohistochemical study in the albino rat. Brain Res. 110(1), 39–56. 10.1016/0006-8993(76)90207-9. [DOI] [PubMed] [Google Scholar]
- Tsunematsu T, Sakata S, Sanagi T, Tanaka KF, & Matsui K (2021). Region-Specific and State-Dependent Astrocyte Ca2+ Dynamics during the Sleep-Wake Cycle in Mice. J Neurosci. 41(25), 5440–5452. 10.1523/JNEUROSCI.2912-20.2021. [DOI] [PMC free article] [PubMed] [Google Scholar]
- Verplaetse TL, Ralevski E, Roberts W, Gueorguieva R, McKee SA, & Petrakis IL, 2019. Alcohol Abstainer Status and Prazosin Treatment in Association with Changes in Posttraumatic Stress Disorder Symptoms in Veterans with Comorbid Alcohol Use Disorder and Posttraumatic Stress Disorder. Alcohol Clin Exp Res. 43, 741–746. 10.1111/acer.13969. [DOI] [PMC free article] [PubMed] [Google Scholar]
- Vigneault É, Poirel O, Riad M, Prud’homme J, Dumas S, Turecki G, Fasano C, Mechawar N, & El Mestikawy S, 2015. Distribution of vesicular glutamate transporters in the human brain. Front. Neuroanat 9, 23. 10.3389/fnana.2015.00023. [DOI] [PMC free article] [PubMed] [Google Scholar]
- Wahis J, & Holt MG, 2021. Astrocytes, Noradrenaline, α1-Adrenoreceptors, and Neuromodulation: Evidence and Unanswered Questions. Front Cell Neurosci. 15, 645691. 10.3389/fncel.2021.645691. [DOI] [PMC free article] [PubMed] [Google Scholar]
- Weinshenker D, & Holmes PV, 2016. Regulation of neurological and neuropsychiatric phenotypes by locus coeruleus-derived galanin. Brain Res., 1641, 320–337. 10.1016/j.brainres.2015.11.025. [DOI] [PMC free article] [PubMed] [Google Scholar]
- Weinshenker D, & Schroeder JP, 2007. There and back again: a tale of norepinephrine and drug addiction. Neuropsychopharmacology. 32, 1433–1451. 10.1038/sj.npp.1301263. [DOI] [PubMed] [Google Scholar]
- Young WS 3rd, Kuhar MJ, 1980. Noradrenergic alpha1 and alpha2 receptors: Light microscopic autoradiographic localization. Proc Natl Acad Sci USA. 77, 1696–1700. 10.1073/pnas.77.3.1696. [DOI] [PMC free article] [PubMed] [Google Scholar]
- Zhang Z, Ma Z, Zou W, Guo H, Liu M, Ma Y, & Zhang L, 2019. The Appropriate Marker for Astrocytes: Comparing the Distribution and Expression of Three Astrocytic Markers in Different Mouse Cerebral Regions. BioMed Res. Int, 9605265. 10.1155/2019/9605265. [DOI] [PMC free article] [PubMed] [Google Scholar]