

SUMMARY
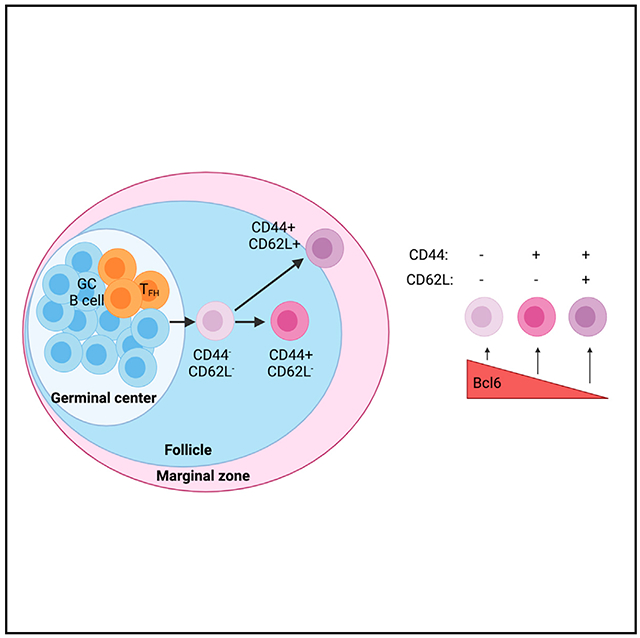
The memory B cell response consists of phenotypically distinct subsets that differ in their ability to respond upon antigen re-encounter. However, the pathways regulating the development and function of memory B cell subsets are poorly understood. Here, we show that CD62L and CD44 are progressively expressed on mouse memory B cells and identify transcriptionally and functionally distinct memory B cell subsets. Bcl6 is important in regulating memory B cell subset differentiation with overexpression of Bcl6 resulting in impaired CD62L+ memory B cell development. Bcl6 regulates memory B cell subset development through control of a network of genes, including Bcl2 and Zeb2. Overexpression of Zeb2 impairs the development of CD62L+ memory B cells. Importantly, CD62L is also differentially expressed on human memory B cells following severe acute respiratory syndrome coronavirus 2 (SARS-CoV-2) vaccination and identifies phenotypically distinct populations. Together, these data indicate that CD62L expression marks functionally distinct memory B cell subsets.
Graphical abstract
In brief
Hanson et al. show that CD62L and CD44 are progressively expressed on mouse memory B cells and identify transcriptionally and functionally distinct memory B cell subsets. Bcl6 regulates memory B cell subset differentiation through control of a network of genes, including Bcl2 and Zeb2.
INTRODUCTION
Following antigen encounter, B cells can migrate to the center of the follicle where they form structures known as germinal centers (GCs).1 Within the GC, B cells compete for a limiting amount of T cell help that is necessary for their continued survival, proliferation, and eventual differentiation into memory B cells (MBCs) or plasma cells.2 The GC is required for the development of affinity-matured MBCs.3 MBCs contribute to protective immunity through their ability to differentiate into antibody-secreting cells or undergo additional affinity maturation upon antigen re-encounter.4–6
The MBC response is composed of phenotypically distinct subsets that have been identified in mice based on their expression of surface markers such as CD80 and PD-L2.4,7–9 A B1-8 knockin transfer system showed that CD80− PD-L2− MBCs develop early in the immune response and tend to differentiate into GC B cells following protein immunization.4 In contrast, CD80+ PD-L2+ MBCs arise later in the immune response and are predisposed to differentiate into antibody-secreting cells.4 However, ex vivo-stimulated MBC subsets identified using CD80 still have the capacity to differentiate into plasmablasts or GC-like cells.9 Similarly, polyclonal T-bet+ immunoglobulin (Ig) M+ CD80+ PD-L2+ MBCs differentiate into either plasmablasts or GC B cells following Ehrlichia muris challenge infection.10
These data suggest that surface marker expression may not be sufficient to predict how polyclonal MBCs will respond upon antigen re-encounter. Additionally, many markers used to identify MBCs subsets, including CD80 and PD-L2, are not highly expressed on human MBCs, complicating efforts to translate basic research findings to the clinical setting.11 Better understanding of the pathways governing the development of functionally distinct MBC subsets is needed to enable the development of new approaches to modulate the MBC response in humans.
We have previously found that Sell (which encodes CD62L) and Cd44 are differentially expressed among transcriptionally distinct subsets of GC-derived MBCs following viral infection.8 CD62L is an adhesion molecule that promotes B cell migration to the lymph node, while CD44 is a surface glycoprotein that is expressed following B cell receptor (BCR) stimulation.12–14 SELL and CD44 are also expressed by MBCs in humans following influenza vaccination.15 In this study, we investigated whether CD62L and CD44 identify functionally distinct subsets of MBCs. We found that CD62L+ MBCs emerge earlier in the GC response and display reduced class switching and somatic hypermutation. CD62L+ MBCs also have increased exposure to the bloodstream and more rapidly differentiate into plasmablasts upon antigen re-encounter. Bcl6 has increased expression on CD62L− MBCs with overexpression of Bcl6 resulting in impaired CD62L+ MBC development. Bcl6 binding peaks are found in the promoter of many transcription factors (TFs) differentially expressed between MBC subsets, including the transcriptional repressor ZEB2. Overexpression of Zeb2 impaired the development of CD62L+ MBCs. CD62L is also differentially expressed on human MBCs following severe acute respiratory syndrome coronavirus 2 (SARS-CoV-2) vaccination and identifies phenotypically distinct populations. Together, these data indicate that CD62L expression identifies functionally distinct MBC subsets in mice and reveals pathways important in MBC subset development.
RESULTS
CD62L and CD44 are progressively expressed on MBCs
S1pr2-ERT2creTdTomato mice were infected with acute lymphocytic choriomeningitis virus strain Armstrong (LCMV Arm) and injected with tamoxifen on days 4 and 6 post infection (p.i.). These mice were then sacrificed on days 8, 11, 15, and 30 p.i. to assess the expression of CD44 and CD62L on splenic GC-derived MBCs (B220+IgDloGL7−CD38+S1pr2-Tomato+ cells) (Figure S1A). We found that the percentage of CD44+CD62L− and CD44+CD62L+ MBCs increased between days 8 and 30 p.i. with a stable MBC subset composition maintained between days 30 and 90 (Figures 1A, 1B, and S1B). GC B cells displayed low expression of CD44 and CD62L (Figure S1C). MBCs present at earlier time points displayed increased BCL6 expression, consistent with these cells only having recently exited the GC state (Figure S1D). However, BCL6− MBCs still displayed a progressive increase in their expression of CD44 and CD62L (Figure S1E). CD44 and CD62L were also expressed on antigen-specific MBCs induced following influenza infection and 4-Hydroxy-3-nitrophenylacetyl-Ovalbumin (NP-OVA) in Alum immunization, with GC-derived MBCs expressing elevated CD44 expression relative to GC-independent MBCs (Figures S1F–S1I). Together, these results indicate that CD44 and CD62L identify MBC subsets induced following immunization and infection.
Figure 1. CD44 and CD62L are progressively expressed on MBCs.
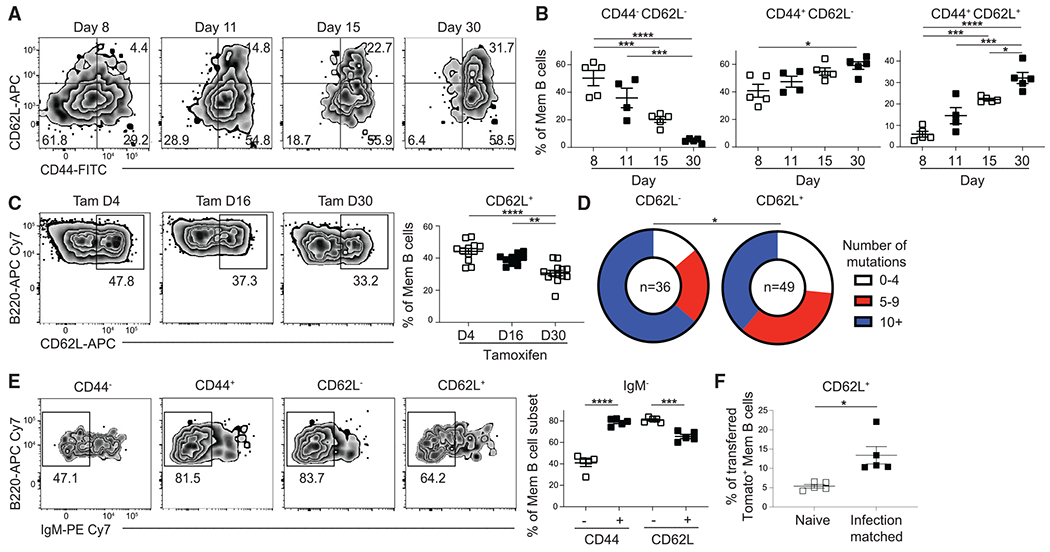
(A) Representative fluorescence-activated cell sorting (FACS) plots of the expression of CD44 and CD62L in splenic GC-derived MBCs (B220+IgDloGL7−CD38+ S1pr2-Tomato+).
(B) Percentage of CD44−CD62L− (left), CD44+CD62L− (middle), and CD44+CD62L+ (right) MBCs at day 8, 11, 15, and 30 post LCMV infection. Mice were injected intraperitoneally (i.p.) with tamoxifen on days 4 and 6 p.i. and then switched to a tamoxifen-containing chow. Data are representative of four independent experiments with at least three mice per group.
(C) Representative FACS plots (left) and percentage (right) of CD62L expression in GC-derived MBCs at day 60 post LCMV infection in S1pr2-ERT2creTdTomato mice treated with tamoxifen beginning at day 4, 16, or 30 p.i. Data are pooled from three independent experiments with at least three mice per group.
(D) Analysis of mismatch error rate frequency in 700 bp of the JH558 intronic sequence in GC-derived MBCs sorted based on CD62L expression at day 30 after LCMV infection. Number of sequences analyzed for each population is listed in the center of each circle. Sequences were pooled from two independent experiments with at least four mice per experiment. Statistical analysis performed by comparing number of mutations in each group.
(E) Representative FACS plots (left) and percentage (right) of IgM− cells in GC-derived MBC subsets at day 30 post LCMV infection. Data are representative of four independent experiments with at least three mice per group.
(F) Percentage of CD62L+ cells in CD45.1− GC-derived MBCs at day 45 post LCMV infection. CD62L− B cells were enriched from CD45.2+ donor mice at day 11 p.i. and transferred into CD45.1/2+ naive or infection-matched mice. Data are representative of two independent experiments with five mice per group. Statistical analyses were performed using the unpaired two-tailed Student’s t test (*p < 0.05, **p < 0.01, ***p < 0.001, ****p < 0.0001). See also Figures S1 and S2.
CD80 and PD-L2 have been used to identify functionally distinct subsets of MBCs.4 Expression of these markers was therefore assessed on CD62L− and CD62L+ GC-derived MBCs at day 30 following LCMV infection in S1pr2-ERT2creTdTomato mice. About 90% of MBCs expressed CD80, with 60% of cells expressing PD-L2 (Figure S1J and S1K). There was no difference in the expression of CD80 and PD-L2 between MBC subsets identified using CD62L (Figures S1J and S1K). These data suggest that CD62L expression marks subsets of MBCs that are distinct from the populations identified using CD80 and PD-L2.
To assess whether CD62L regulates the development of MBCs, we transduced bone marrow from Rosa26-LSL-Cas9f/+ Cg1Cre/+ mice with a single guide RNA (sgRNA)-containing retroviral construct targeting CD62L (expressing Thy1.1) and then transferred these cells to lethally irradiated recipient mice.8 Following reconstitution, mice were infected with LCMV and sacrificed on day 30 p.i. Cg1Cre drives expression of Cas9 with Cas9-expressing cells marked as GFP+.16,17 Although Cg1Cre is expressed from the Cg1 locus, it is active in mediating gene deletion in multiple Ig isotypes in vivo.17 B cells from Cas9-expressing cells transduced with an sgRNA targeting CD62L displayed a reduced percentage of CD62L+ MBCs (Figures S2A and S2B). However, ablation of CD62L did not result in an impairment in MBC development (Figure S2C). These results indicate that CD62L is not required for splenic MBC development.
MBCs that emerge early in the GC response are predisposed to express CD62L
We next evaluated whether MBC subsets identified based on CD62L expression emerge from the GC at different times. S1pr2-ERT2creTdTomato mice were infected with LCMV and then treated with tamoxifen beginning at day 4, 16, or 30 p.i. to temporally label GC-derived cells. All groups were then sacrificed at day 60 p.i. to assess the expression of CD62L on MBCs. We found that there was a progressive decrease in the percentage of CD62L+ cells among the labeled MBCs in mice that were treated with tamoxifen at later time points (Figure 1C). These data indicate that MBCs that emerge earlier in the GC response are predisposed to develop into CD62L+ MBCs.
MBCs that emerge later in the GC response are expected to display increased somatic hypermutation (SHM) and class-switch recombination.18,19 We therefore examined the extent of SHM in DNA from CD62L− and CD62L+ GC-derived MBCs by sequencing of the IgH JH4-intronic enhancer downstream of the rearranged VJ558DJH4 element in DNA isolated from MBC subsets at day 33 post LCMV infection.20,21 The mutation frequency in this intronic region provides a measurement of activation-induced cytidine deaminase (AID) activity.22 CD62L− MBCs displayed an increased number of mutations relative to CD62L+ MBCs (Figure 1D). CD44− and CD62L+ MBCs also had had a reduced percentage of IgM− cells (Figure 1E). Together, these data suggest that CD62L+ MBCs encode antibodies with distinct qualities from their CD62L− counterparts.
We then assessed whether CD62L− MBCs can acquire expression of CD62L following their emergence from the GC. CD62L− B cells were isolated at day 11 post LCMV infection and transferred into congenically distinct naive or infection-matched mice that were sacrificed 30 days later. While CD62L− MBCs largely failed to upregulate CD62L expression when transferred into naive recipients, there was an increased proportion of transferred cells that upregulated CD62L in infection-matched mice (Figure 1F). This suggests that exposure to signals such as antigen or inflammatory cytokines may shape the composition of the MBC response following their emergence from the GC.
CD62L+ MBCs are spatially and functionally distinct
The localization of GC-derived MBC subsets was next assessed using intravascular labeling.23 LCMV-immune S1pr2-ERT2-creTdTomato mice were intravenously (i.v.) injected with anti-mouse CD45.2 antibody and then sacrificed 5 min later. We found that there was an increased percentage of in vivo CD45.2+ cells among the CD62L+ MBC population (Figures 2A and 2B). This indicates that CD62L+ MBCs have increased exposure to the bloodstream. To further assess the localization of the GC-derived MBC subsets, we performed immunofluorescence microscopy on splenic sections from S1pr2-ERT2creTdTomato mice at day 45 post LCMV infection. CD62L+ MBCs tended to localize near the outer follicle or marginal zone with their CD62L− counterparts found closer to the GCs (Figures 2C–2E, and S3A). Together, these results indicate that MBC subsets identified using CD62L are spatially distinct.
Figure 2. CD62L+ MBCs are spatially and functionally distinct.
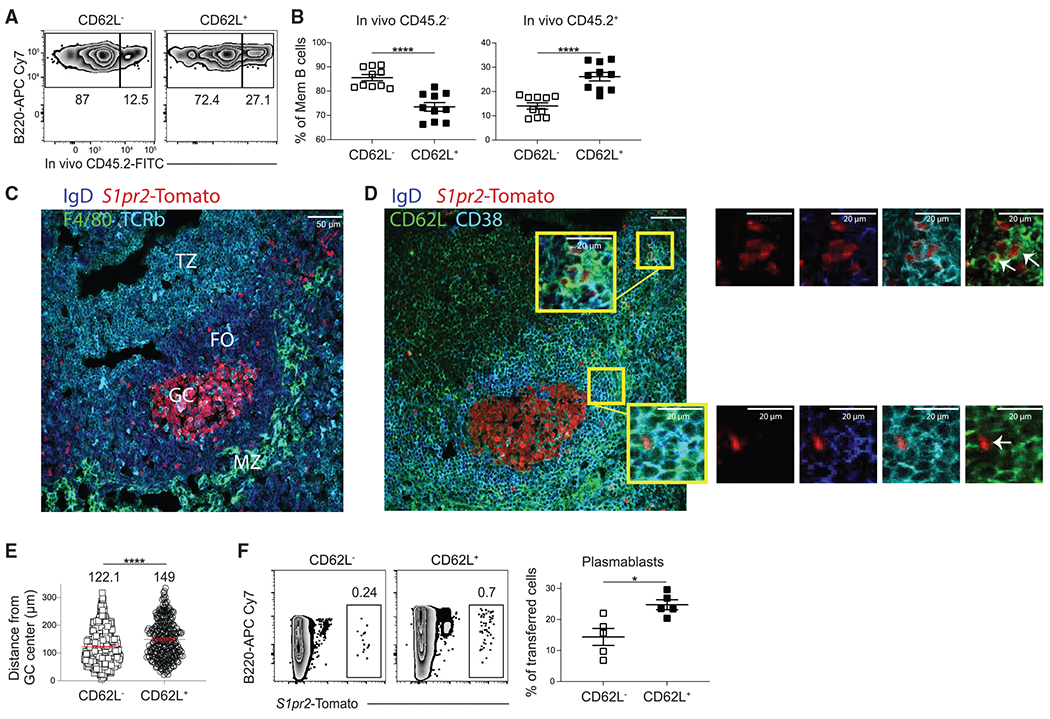
(A) Representative FACS plots of intravenously labeled GC-derived MBCs (B220+IgDloGL7−CD38+ S1pr2-Tomato+) at day 30 post LCMV infection. Mice were intravenously injected with CD45.2 antibody 5 min prior to sacrifice.
(B) Percentage of CD45.2− (left) and CD45.2+ (right) MBCs at day 30 post LCMV infection. Data are pooled from two independent experiments with at least five mice per group.
(C) Representative image showing T cell zone (TZ), follicle (FO), marginal zone (MZ), and GC as defined based on T cell receptor (TCR)β, IgD, F4/80, and S1pr2-Tomato expression in splenic sections at day 45 post LCMV infection.
(D) Representative image showing localization of CD62L− and CD62L+ GC-derived MBCs (IgDlo CD38+ S1pr2-Tomato+) in splenic sections at day 45 post LCMV infection. Images in (C) and (D) are from serial sections. Scale bar indicates 50 μm.
(E) Distance of CD62L− and CD62L+ MBCs from the center of the GC. Distance was quantified using ImageJ software. The mean distance from GC center is listed above each plot. Data are pooled of two independent experiments with at least three mice per group.
(F) Representative FACS plots (left) of percentage of S1pr2-Tomato+ cells among plasmablasts (B220loCD138+Sca1+) at day 6 post sheep red blood cell (SRBC) immunization. CD62L− and CD62L+ S1pr2-Tomato+ B cells were sorted at day 30 post SRBC immunization and transferred into congenically distinct mice such that each recipient mouse received equivalent numbers of S1pr2-Tomato+ MBCs. Percentage of transferred cells that differentiated into plasmablasts (B220loCD138+Sca1+) is shown on right. Data are representative of two independent experiments with at least four mice per group. Statistical analyses were performed using the unpaired two-tailed Student’s t test (*p < 0.05, ****p < 0.0001). See also Figure S3.
We then sought to determine whether GC-derived MBC subsets identified using CD62L are functionally distinct. S1pr2-ERT2creTdTomato mice were immunized with sheep red blood cells (SRBCs) with the CD62L− and CD62L+ S1pr2-Tomato+ B cells sorted at day 45 post immunization. SRBC immunization induces a similar MBC subset composition to LCMV and does not disrupt the splenic architecture following immunization (Figure S3B).24 CD62L− and CD62L+ S1pr2-Tomato+ B cells were transferred into naive congenically distinct mice that were immunized the following day with SRBC. The recipient mice were then sacrificed 6 days later. We found that CD62L+ S1pr2-Tomato+ B cells had an enhanced ability to differentiate into plasmablasts (B220int-loCD138+Sca1+ cells) upon challenge immunization (Figure 2F). These findings are consistent with CD62L+ MBCs having increased exposure to antigen and recently activated CD4+ T cells present in the marginal zone and outer follicle.25
MBC subsets identified using CD44 and CD62L are transcriptionally distinct
RNA sequencing (RNA-seq) analysis was performed on GC-derived MBC subsets identified using CD44 and CD62L at day 15 post LCMV infection. MBCs were defined as B220+IgDlo GL7−CD38+S1pr2-Tomato+ cells, thereby excluding GC B cells, which are GL7+CD38−, and GC-derived plasmablasts, which do not express high levels of B220. We found that MBC subsets are transcriptionally distinct based on principal-component analysis, with 4,599 differentially expressed genes (DEGs) between CD44−CD62L− and CD44+CD62L+ MBCs (Figure 3A). There were 2,287 genes upregulated in CD44−CD62L− MBCs, with 2,312 genes upregulated in CD44+CD62L+ MBCs. DEGs were defined as genes with a adjusted p (padj) < 0.1 and base count >50. CD44−CD62L− MBCs displayed enhanced expression of genes associated with the GC state, including Bcl6, Aicda, and S1pr2, while CD44+CD62L+ MBCs had upregulated expression of genes associated with MBCs, such as Hhex, Tle3, and Bcl2 (Figures 3B and S4A–S4C). CD44+CD62L+ MBCs also had upregulated expression of Gpr183, S1pr1, and S1pr4, which promote migration to the outer follicle and marginal zone (Figure S4B). Genes associated with apoptosis and cell proliferation were also differentially expressed between these subsets (Figures S4C and S4D). The expression of GC-associated genes in CD44−CD62L− MBCs is consistent with these cells only recently emerging from the GC state. Together, these results indicate that CD44 and CD62L identify MBCs that are at distinct developmental states.
Figure 3. CD44 and CD62L identify transcriptionally distinct subsets of MBCs.
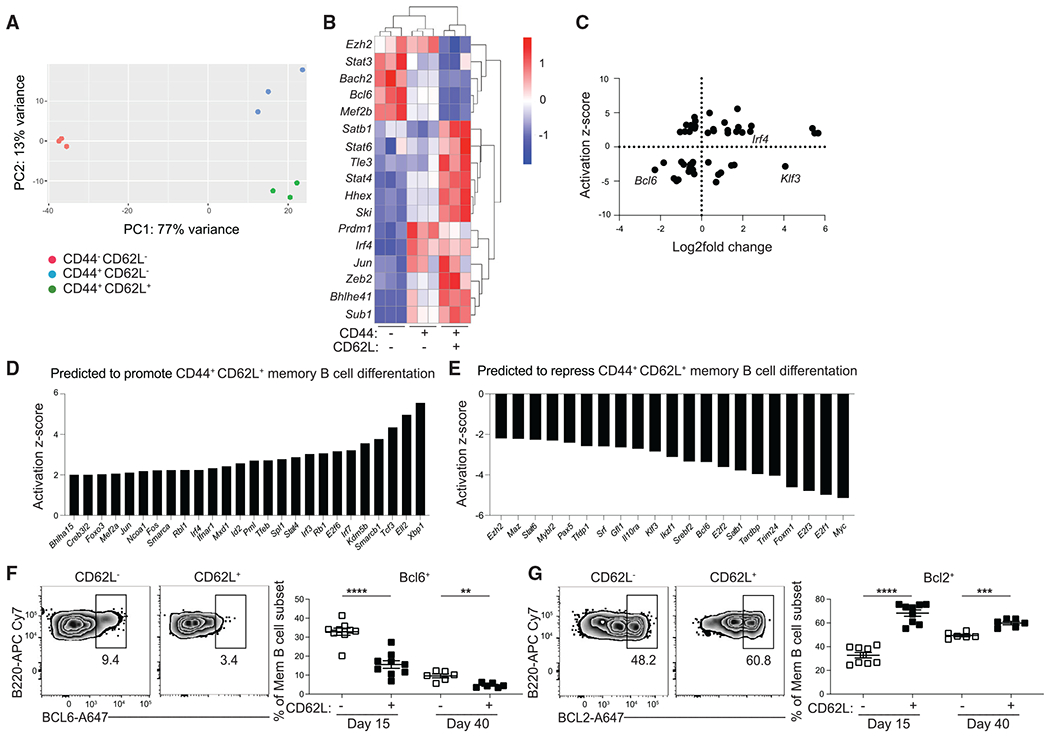
(A) Principal-component analysis of RNA-seq data from CD44− CD62L−, CD44+ CD62L+, and CD44+ CD62L+ splenic GC-derived MBCs (B220+IgDlo GL7−CD38+S1pr2-Tomato+) at day 15 post LCMV infection. Cells were sorted from three independent samples with at least three mice per samples.
(B) Heatmap of select differentially expressed genes (DEGs) among mRNA isolated from the aforementioned populations, presented as expression (log2) normalized by row. Genes with padj <0.1 and a base mean count across all three groups >50 were considered DEGs.
(C) Scatterplot of data analysis obtained from iPA with the y axis representing the activation Z score for potential upstream regulators. Positive score indicates promotion of CD44+ CD62L+ MBC differentiation and negative score indicates repression of CD44+ CD62L+ MBC differentiation. The x axis represents expression levels of differentially expressed TFs represented in log2-fold change. Negative scores indicate expression by CD44− CD62L− population and positive scores indicate expression by CD44+ CD62L+ population.
(D) List of TFs with an activation Z score greater than 2.
(E–G) (E) List of TFs with an activation Z score less than −2. Representative FACS plots (left) and percentage (right) of (F) BCL6 and (G) BCL2 in GC-derived MBCs (live B220+IgDloGL7−CD38+ S1pr2-Tomato+) subsets at day 15 and 40 post LCMV infection. Data are representative of four independent experiments with at least three mice per group. Statistical analyses were performed using the unpaired Student’s t test (**p < 0.01, ***p < 0.001, ****p < 0.0001). See also Figures S4 and S5.
We next sought to identify transcriptional regulators of MBC subset development. There were 388 TFs differentially expressed between CD44−CD62L− and CD44+CD62L+ MBCs (Figure 3B). Ingenuity pathway analysis (IPA) upstream regulator analysis was then performed to identify TFs (TFs) predicted to regulate the genes that were differentially expressed between CD44−CD62L− and CD44+CD62L+. Twenty-six TFs were predicted to promote CD44+CD62L+ MBC development, with 21 TFs predicted to promote CD44−CD62L− MBC development (Figures 3C–3E). Among the TFs that were both differentially expressed and predicted to promote CD44−CD62L− MBC development was Bcl6, a key regulator of GC B cell differentiation.26,27
S1pr2-ERT2creTdTomato mice were infected with LCMV and sacrificed at days 15 and 40 p.i. to validate the RNA-seq results. CD62L+ GC-derived MBCs displayed a reduced percentage of BCL6+ cells and an increased percentage of BCL2+ cells (Figures 3F and 3G). CD62L+ GC-derived MBCs also had a reduction in the percentage of Ki67+ cells and apoptotic cells, as assessed by staining for the caspase inhibitor Z-VAD-FMK (Figures S4E and S4F). The magnitude of these differences was more apparent at day 15 than day 40, indicating that CD62L− MBCs that persist to later time points acquire a more quiescent phenotype that enables their continued survival (Figures 3F, 3G, S4E, and S4F). GC B cells express elevated BCL6, Ki67, and Z-VAD-FMK staining and reduced BCL2 staining relative to bulk MBCs (Figure S4G). RNA-seq analysis was then performed on GC-derived MBC subsets at day 40 post LCMV infection to determine whether differences in the transcriptional signature of these subsets are stably maintained. CD62L+ MBCs were transcriptionally distinct from their CD62L− counterparts with 1,669 DEGs (548 upregulated, 1,122 downregulated) (Figure S5A). Of these DEGs, 829 were also differentially expressed between CD44−CD62L− and CD44+CD62L+ MBCs at day 15, with the overlapping DEGs including genes regulating cell differentiation, positioning, survival, and proliferation (Figures S5B–S5F). Together, these results indicate that MBC subsets identified using CD44 and CD62L display distinct transcriptional, proliferative, and survival properties.
Bcl2 and Bcl6 regulate the development of MBC subsets
We next investigated whether Bcl2 regulates the development of MBC subsets. S1pr2-ERT2creTdTomato mice were crossed to mice expressing a transgene containing Bcl2 selectively in B cells.28 Overexpression of Bcl2 in B cells results in enhanced development of MBCs.29 Mice were infected with LCMV and sacrificed at day 30 p.i. to evaluate the B cell response. Overexpression of Bcl2 resulted in a reduced percentage of GC-derived MBCs that were CD62L+ and CD44+ (Figures 4A and 4B). This reduction is a result of increased acccumulation of CD62L− MBCs rather than a decrease in the percentage of B cells that differentiate into CD62L+ MBCs (Figure 4C). Overexpression of Bcl2 reduced the percentage of CD62L− MBCs that were apoptotic to levels comparable to that of CD62L+ MBCs in the control group (Figure 4D). Together, these data suggest that the progressive increase in proportion of MBCs that are CD62L+ that occurs following infection may be due in part to the reduced survival of CD62L− MBCs.
Figure 4. Bcl6 restricts development of CD62L+ MBCs.
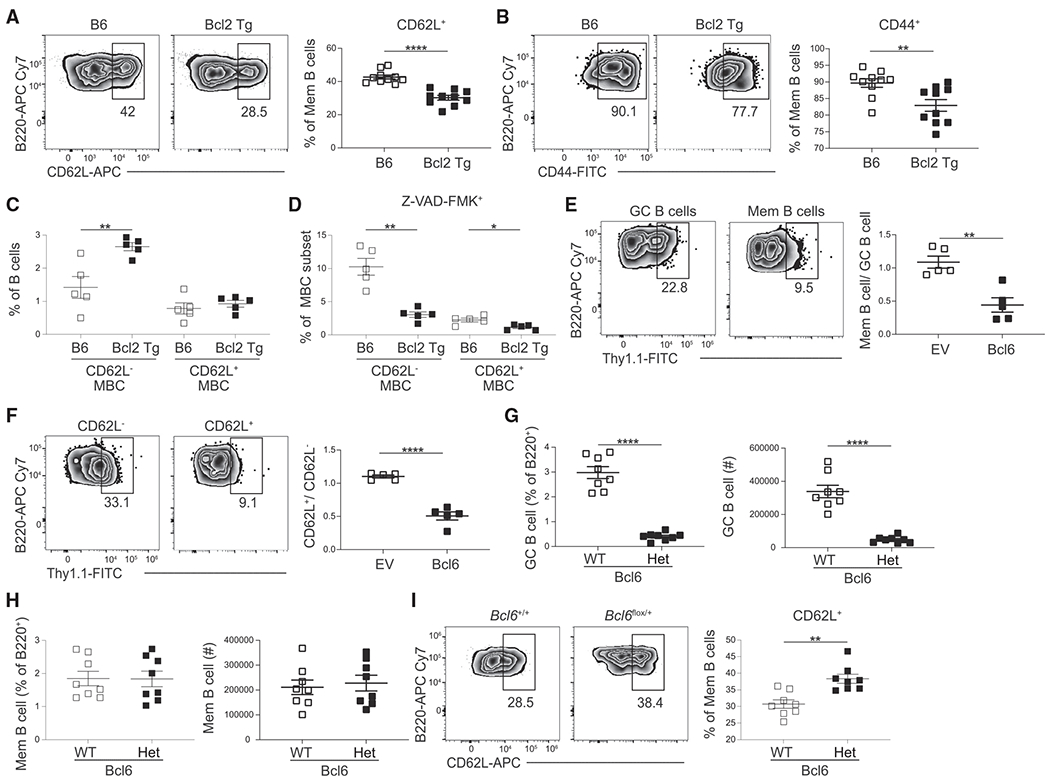
(A and B) Representative FACS plots (left) and percentage (right) of (A) CD62L or (B) CD44 expression in GC-derived MBCs (B220+IgDloGL7−CD38+ S1pr2-Tomato+) from control (B6) and Bcl2 transgenic mice at day 30 post infection. Data are pooled from two independent experiments with at least five mice per group.
(C) Percentage of B cells that are CD62L− or CD62L+ GC-derived MBCs (B220+IgDloGL7−CD38+ S1pr2-Tomato+) in control (B6) and Bcl2 transgenic mice at day 30 post infection.
(D) Percentage of VAD-FMK+ cells among the CD62L− or CD62L+ GC-derived MBC populations in B6 and Bcl2 transgenic mice at day 30 post infection. Data are representative of two independent experiments with at least five mice per group.
(E) Representative FACS plots (left) of the percentage of transduced (Thy1.1+) cells among splenic GC B cells (B220+IgDloGL7+CD95+) and MBCs (B220+IgDloGL7−CD38+CD95+CD73+) at day 30 post LCMV infection in empty vector (EV) and Bcl6-overexpressing cells. Ratio of transduced MBCs relative to GC B cells shown on right.
(F) Representative FACS plots (left) of the percentage of transduced (Thy1.1+) cells among CD62L− and CD62L+ MBCs (B220+IgDloGL7−CD38+CD95+CD73+) at day 30 post LCMV infection in EV and Bcl6-overexpressing cells. Ratio of transduced CD62L+ MBCs relative to CD62L− MBCs cells shown on right. Transduction efficiencies varied between constructs. The MSCV2.2 retroviral vector was used for all transductions. Data are representative of four independent experiments with at least three mice per group.
(G) Percentage (left) and number (right) of GC B cells (B220+IgDloGL7+CD38−Aid-Tomato) in Bcl6+/+ (WT) and Bcl6flox/+ (Het) AidCre Ai14 mice at day 30 post LCMV infection.
(H) Percentage (left) and number (right) of MBCs (right; B220+IgDloGL7−CD38+Aid-Tomato+) in Bcl6 WT and Het mice at day 30 post LCMV infection.
(I) Representative FACS plots (left) and percentage (right) of the CD62L expression on MBCs from Bcl6 WT and Het mice at day 30 post LCMV infection. Data are representative of two independent experiments with at least five mice per group. Statistical analyses were performed using the unpaired two-tailed Student’s t test (*p < 0.05, **p < 0.01, ****p < 0.0001).
Bcl6 regulates the expression of many genes involved in B cell differentiation, including Bcl2.30 We therefore assessed whether retroviral overexpression of Bcl6 results in dysregulated MBC subset development. Bone marrow was transduced with plasmids expressing Bcl6 or a control empty vector and then transferred to lethally irradiated recipient mice. Following reconstitution, mice were infected with LCMV and analyzed on day 30 p.i. The percentage of transduced GC, MBC, and MBC subsets was then determined. We found that overexpression of Bcl6 resulted in impaired MBC development (Figures 4E and S5G). Furthermore, Bcl6 overexpression resulted in impaired development of CD62L+ MBCs (Figures 4F and S5G). To examine how Bcl6 haploinsufficiency affects MBC development, we generated Bcl6flox AidCre mice.31,32 We then infected Bcl6+/+ (wild type [WT]) or Bcl6f/+ (Het) AidCre Ai14 mice with LCMV and analyzed the B cell response 30 days later. Bcl6 haploinsufficiency resulted in impaired GC B cell differentiation with no defect in MBC development (Figures 4G and 4H). However, MBCs from Bcl6 Het mice did display an increased percentage of CD62L+ MBCs (Figure 4I). Together, these data indicate that Bcl6 restricts the differentiation of CD62L+ MBCs.
Bcl6 binds to TFs differentially expressed between MBC subsets
We then examined whether Bcl6 may regulate the expression of TFs differentially expressed between MBC subsets. Publicly available chromatin immunoprecipitation (ChIP) sequencing (ChIP-seq) data of human GC B cells was used to assess binding of Bcl6 and the corepressors Bcor and Smrt to the promoter of differentially expressed TFs.33 The binding motif for Bcl6 is highly conserved between mouse and human, allowing for comparison of datasets between mouse and humans (Jaspar database). Of the 388 TFs that were differentially expressed between CD44−CD62L− and CD44+CD62L+ MBCs at day 15 p.i., 101 were bound by Bcl6 with a peak strength of 2 or greater (Figures 5A and S6). There were 43 TFs, including 22 TFs upregulated in CD44+CD62L+ MBCs, that were also bound by Bcor and Smrt (Figures 5B and 5C). Bcl6-bound genes that are bound by Bcor and Smrt display an enhanced signature of Bcl6 repression.33 Among the TFs identified in this analysis include known Bcl6 target genes such as STAT3 and PRDM1 (Figures 5B–5D).34,35 Zeb2, an important regulator of B cell development, was among the TFs with the strongest Bcl6 binding peak. Zeb2 expression inversely correlates with Bcl6 expression in activated mouse B cells, with Zeb2 displaying increased expression in CD62L+ MBCs relative to GC B cells or CD62L− MBCs following LCMV infection of Zeb2-GFP S1pr2-ERT2creTdTomato mice (Figure 5E).36,37
Figure 5. Bcl6 binds to TFs differentially expressed between MBC subsets.
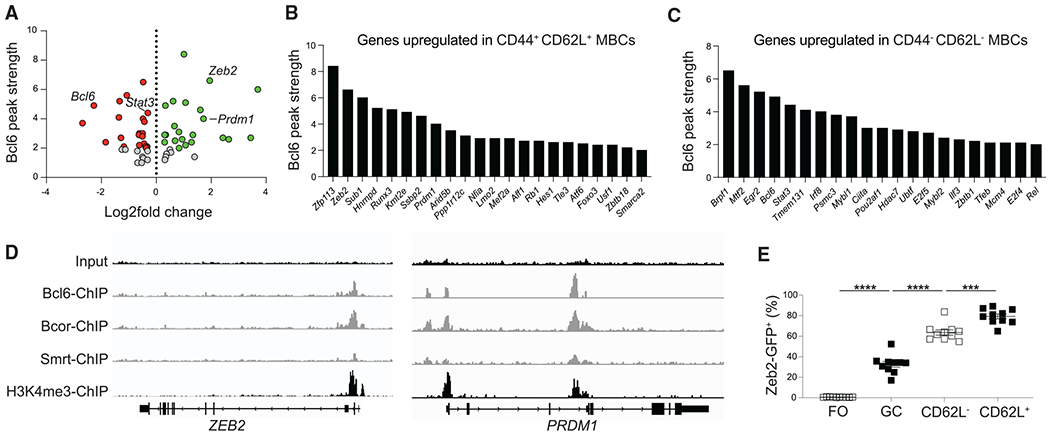
(A) Scatterplot of Bcl6 binding strength (y axis) based on Bcl6 ChIP-seq performed on human GC B cells compared to log2-fold change of differentially expressed TFs between CD44− CD62L− (negative value) and CD44+ CD62L+ (positive value) mouse GC-derived MBCs (B220+IgDloGL7−CD38+ S1pr2-Tomato+). Each dot represents a TF that is bound by Bcl6, Bcor, and Smrt. The identities of select TFs are listed.
(B) Bcl6 peak strength in TFs that are bound by Bcor and Smrt and have increased expression in CD44+ CD62L+ MBCs.
(C) Bcl6 peak strength in TFs that are bound by Bcor and Smrt and have increased expression in CD44− CD62L− MBCs. Only TFs with a Bcl6 peak strength of 2 or greater are shown in (B) and (C).
(D) Bcl6, Bcor, Smrt, and input ChIP tracks for ZEB2 (left) and PRDM1 (right). H3K4me3 ChIP track from human B cells is shown to indicate promoter location.
(E) Percentage of Zeb2-GFP+ cells among follicular (FO; B220+IgD+GL7−CD38+) B cells, GC (B220+IgDloGL7+CD38−S1pr2-Tomato+) B cells, CD62L− MBCs (B220+IgDloGL7−CD38+S1pr2-Tomato+), and CD62L+ MBCs at day 30 post LCMV infection. Data are pooled from two independent experiments with at least five mice per group. Statistical analyses were performed using the unpaired two-tailed Student’s t test (***p < 0.001, ****p < 0.0001). See also Figure S6.
Zeb2 promotes MBC development
The role of Zeb2 in MBC development was next examined using retroviral overexpression. Bone marrow was transduced with plasmids expressing Zeb2 or a control empty vector and then transferred to lethally irradiated recipient mice. Following reconstitution, mice were infected with LCMV and analyzed on day 30 p.i. The percentage of transduced GC, MBC, and MBC subsets was then determined. We found that overexpression of Zeb2 resulted in enhanced MBC development (Figure 6A). Furthermore, Zeb2 overexpression resulted in impaired development of CD62L+ MBCs (Figure 6B). To examine how Zeb2 ablation affects MBC development, we generated Zeb2flox S1pr2-ERT2creTdTomato mice. We then infected Zeb2f/+ (Het), or Zeb2f/f knockout (KO) S1pr2-ERT2creTdTomato mice with LCMV and sacrificed them at days 15 and 30 p.i. There was no difference in GC number or area in Zeb2 KO mice (Figures 6C and 6D). However, ablation of Zeb2 resulted in impaired GC-derived MBC development at both time points (Figures 6E and 6F). Furthermore, ablation of Zeb2 resulted in an increase in the percentage of CD44+CD62L− MBCs and a decrease in CD44−CD62L− MBCs at day 15 p.i. (Figure 6D). Together, these results indicate that Zeb2 promotes the development of MBCs and may restrict the differentiation of CD62L+ MBCs.
Figure 6. Zeb2 regulates MBC development.
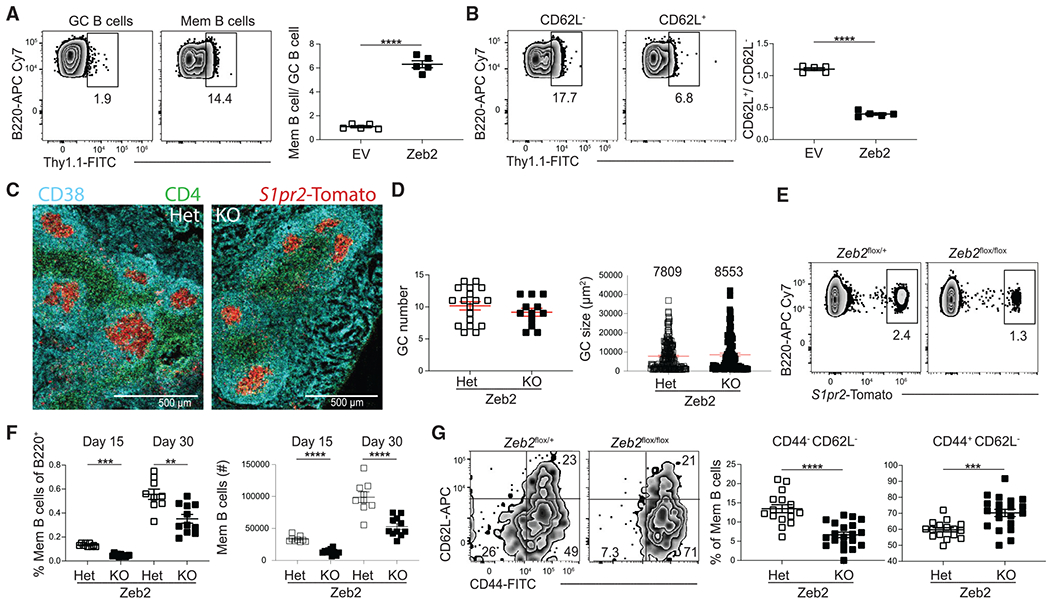
(A) Representative FACS plots (left) of the percentage of transduced (Thy1.1+) cells among splenic GC B cells (B220+IgDloGL7+CD95+) and MBCs (B220+IgDloGL7−CD38+CD95+CD73+) at day 30 post LCMV infection in EV and Zeb2-overexpressing cells. Ratio of transduced MBCs relative to GC B cells shown on right.
(B) Representative FACS plots (left) of the percentage of transduced (Thy1.1+) cells among CD62L− and CD62L+ MBCs (B220+IgDloGL7−CD38+CD95+CD73+) at day 30 post LCMV infection in EV and Zeb2-overexpressing cells. Ratio of transduced CD62L+ MBCs relative to CD62L− MBCs cells shown on right. Data are representative of three independent experiments with at least three mice per group.
(C) Representative image showing GCs in splenic sections in Zeb2flox/+ (Het) and Zeb2flox/flox (KO) S1pr2-ERT2cre TdTomato mice at day 15 post LCMV infection. Scale bar indicates 500 μm.
(D) Number of total GCs per splenic section (left) and GC size (right). GC size was quantified using ImageJ software. The mean GC size is listed above each plot. Data are representative of two independent experiments with at least three mice per group.
(E) Representative FACS plots of the percentage of S1pr2-Tomato+ cells among the B220+IgDloGL7−CD38+ population in Zeb2flox/+ (Het) and Zeb2flox/flox (KO) S1pr2-ERT2cre TdTomato mice at 30 post LCMV infection.
(F) Percentage (left) and number (right) of GC-derived MBCs (B220+IgDloGL7−CD38+ S1pr2-Tomato+) in Zeb2flox/+ (Het) and Zeb2flox/flox (KO) S1pr2-ERT2cre TdTomato mice at day 15 and 30 post LCMV infection. Data for each time point are pooled from two independent experiments with at least four mice per group.
(G) Representative FACS plots (left) and percentage (right) of the expression of CD44 and CD62L on MBCs from Zeb2 Het and KO mice at day 15 post LCMV infection. Data are pooled from three independent experiments with at least five mice per group. Statistical analyses were performed using the unpaired two-tailed Student’s t test (**p < 0.01, ***p < 0.001, ****p < 0.0001).
SARS-CoV-2-specific MBCs progressively express CD62L following vaccination
Finally, we assessed the expression of CD62L on human MBCs following SARS-CoV-2 vaccination. Peripheral blood mononuclear cells (PBMCs) were obtained from a cohort of 11 COVID-19-naive healthy donors following completion of a primary vaccination series with Pfizer-BioNTech (BNT162b2) vaccination (Figure 7A). We used flow cytometry to assess the immune response in PBMCs following vaccination using a His-tagged spike-binding probe to identify SARS-CoV-2-specific B cells (Figure S7).38,39 We found that the percentage of spike+ MBCs that expressed CD62L cells increased following vaccination (Figure 7B). CD62L+ MBCs displayed increased expression of CD44, CD71, and CXCR5 (Figures 7C–7E). CD62L+ MBCs also had a reduced percentage of IgM+ cells and an increased percentage of IgG1+ cells (Figures 7F and 7G). CD44+ MBCs did not display an altered percentage of IgM+ or IgG1+ cells (Figures S7B and S7C). Together, these data indicate that human MBCs identified using CD62L are phenotypically distinct and may encode antibodies with distinct functional properties.
Figure 7. CD62L identifies phenotypically distinct subsets of SARS-CoV-2-specific MBCs.
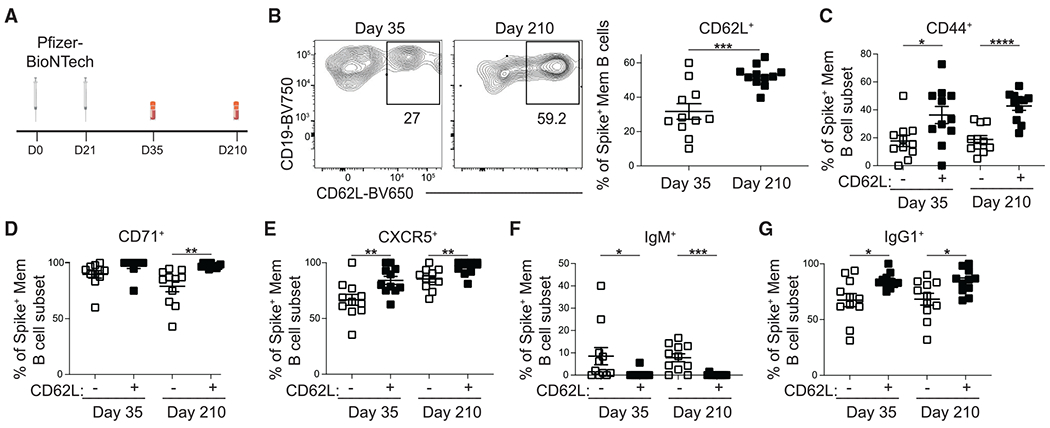
(A) Schematic of study design including time points in which PBMCs were obtained.
(B) Representative FACS plots (left) and percentage (right) of spike+ MBCs (IgDloCD20+CD38int-loCD27+) cells that express CD62L at day 35 and 210 following the first dose of the Pfizer-BioNtech SARS-CoV-2 mRNA vaccine.
(C–G) Percentage of CD62L− and CD62L+ spike+ MBCs that express (C) CD44, (D) CD71, (E) CXCR5, (F) IgM, and (G) IgG1 on days 35 and 210 post vaccination. Statistical analyses were performed using the unpaired two-tailed Student’s t test (*p < 0.05, **p < 0.01, ***p < 0.001, ****p < 0.0001).
DISCUSSION
The composition of the MBC response is an important indicator of the capacity of these cells to mediate protective immunity. Here, we find that CD62L expression identifies phenotypically distinct MBC subsets in both mice and humans. Murine CD62L+ MBCs display reduced somatic hypermutation and class switching and are predisposed to differentiate into antibody-secreting cells upon antigen re-encounter. Bcl6 regulates the development of MBC subsets through the control of a network of genes, including Zeb2 and Bcl2.
Our work indicates a model in which MBCs initially lack expression of CD44 and CD62L following their exit from the GC state. MBCs that emerge earlier from the GC response are predisposed to upregulate both CD44 and CD62L, with CD44+CD62L+ MBCs displaying high Bcl2 and low caspase expression. This provides these cells with a survival advantage over their CD44+CD62L− counterparts, which tend to emerge later in the GC response and contributes to the progressive increase in the proportion of MBCs that are CD62L+ between days 8 and 30. CD44+CD62L− MBCs that persist to later time points acquire a quiescent phenotype enabling the establishment of a stable MBC subset composition at later time points.
Murine MBC subsets are typically identified based on their expression of CD80 and PD-L2.4 We find that most GC-derived MBCs express CD80 following viral infection with no difference in CD80 or PD-L2 expression between MBC subsets identified based on CD62L expression. This indicates that there is functional heterogeneity in the MBC response that is not encompassed by CD80 and PD-L2 expression. Our finding that MBCs that emerge later from the GC are less likely to upregulate CD62L also suggests that Bcl6 may restrict CD62L+ MBC development by promoting increased exposure to GC-derived signals. MBCs tend to emerge during the early stages of the GC response, with GC output shifting toward long-lived plasma cells at later time points.19 This temporal switch would serve to limit the accumulation of CD62L− MBCs. However, MBCs can continuously develop during a persistent GC response with GCs persisting for at least 6 months in some individuals following mRNA vaccination.40,41 The persistence of the GC response may therefore be an important regulator of MBC subset composition.
The localization of MBCs is an important determinant of their ability to rapidly respond upon antigen re-encounter, with both the peri-GC and subcapsular regions found to be important sites of MBC reactivation.42,43 However, whether MBC subsets are differentially localized is not known. Here, we find that CD62L identifies MBC subsets that have distinct spatial distributions. CD62L+ MBCs display elevated expression of migratory receptors such as S1pr1 and Gpr183 that promote homing to the outer follicle/marginal zone.1 Conversely, CD62L− MBCs display elevated expression of migratory receptors, such as Cxcr5 and S1pr2, that promote localization to the peri-GC region. An immunogen that drives an immune response at the outer follicle, such as SRBC, preferentially promotes the reactivation of CD62L+ MBCs.44 This suggests that the distribution of antigen, in addition to MBC phenotype, is likely an important regulator of MBC fate upon antigen re-encounter.
Bcl6 promotes GC B cell maintenance through regulation of a diverse network of genes that control B cell positioning, survival, and differentiation.2,45 We now show that Bcl6 also has an important role in regulating MBC subset development by restricting the development of CD62L+ MBCs. The elevated expression of Bcl6 in MBCs that have recently emerged from the GC (e.g., CD44−CD62L− MBCs) suggests that Bcl6 primarily functions during the early stages of MBC differentiation to regulate MBC subset composition. Restriction of CD62L+ MBC differentiation by Bcl6 is likely independent of Bcl2, a known target of Bcl6, since overexpression of Bcl2 does not promote CD62L+ MBC development.30 Rather, overexpression of Bcl2 likely enables enhanced survival of GC B cells that differentiate into CD62L− MBCs.
Bcl6 can regulate the expression of numerous TFs involved in B cell differentiation.2 The 43 TFs that are differentially expressed between MBC subsets have peaks for Bcl6 and the corepressors Bcor and Smrt peaks in their promoter region. ZEB2 was among the TFs that displayed the strongest Bcl6 peak. Zeb2 also displayed increased expression in CD62L+ MBCs, suggesting that it may be directly repressed by Bcl6. Zeb2 is critical for B cell development and was recently found to be involved in the differentiation of CD11c+ B cells in mice and humans.36,37,46,47 We found that overexpression of Zeb2 promotes MBC development, suggesting that Bcl6 may repress Zeb2 expression in part to maintain the GC B cell state. Surprisingly, overexpression of Zeb2 also resulted in reduced development of CD62L+ MBCs. This suggests that there is redundancy in the TFs regulating MBC subset development, with Zeb2 overexpression restricting CD62L+ MBC development in GC B cells that downregulate Bcl6. This redundancy may serve as a mechanism to regulate MBC subset composition in mature MBCs that no longer express Bcl6. Ablation of Zeb2 did not promote CD62L+ MBC development, indicating that Zeb2 is not required to limit the accumulation of these cells. Whether there are other TFs that are repressed by Bcl6 that promote CD62L+ MBC development remains to be determined. We have previously found that ablation of Hhex results in decreased CD62L+ MBC development in some immunization models.8
Human CD62L+ MBCs accumulate in the blood over time following mRNA vaccination and display increased expression of markers associated with B cell activation, such as CD44 and CD71.14,48 CD62L+ MBCs also have a reduced percentage of IgM− cells relative to their CD62L− counterparts. These results indicate that CD62L may identify human MBC subsets encoding functionally distinct antibodies. It will be important for future work to establish the relationship between MBC subsets identified based on CD62L expression in mice and humans. Additionally, better understanding is needed about how MBC subsets identified based on CD62L expression relate to human MBC subsets defined using other markers, such as T-bet.49 Establishing the phenotype of human MBCs present in the draining lymph node is also needed to determine whether human MBC subsets have distinct spatial distributions that may affect their ability to respond upon antigen re-encounter.
Limitations of the study
There are several limitations associated with this study. First, many of our experiments identify MBCs using S1pr2-ERT2creTd Tomato mice to specifically examine GC-derived MBCs. Therefore, we cannot be certain that conclusions drawn from this study apply to GC-independent MBC subsets. Second, our identification of potential Bcl6-regulated genes was based on ChIP-seq data and gene expression analysis. We did not directly determine whether Bcl6 regulates the expression of these genes. Finally, this study did not directly show that human MBC subsets identified based on CD62L expression encodes antibodies that are functionally distinct, nor did it determine whether these subsets have differential ability to respond upon antigen re-encounter.
STAR★METHODS
RESOURCE AVAILABILITY
Lead contact
Further information and requests for resources and reagents should be directed to and will be fulfilled by the lead contact, Brian Laidlaw (brian.laidlaw@wustl.edu).
Materials availability
Plasmids generated in this study will be made available by request.
Data and code availability
Raw and processed data files for the RNA-seq analysis have been deposited in the NCBI Gene Expression Omnibus under accession number GSE247445.
This paper does not report original code.
Any additional information required to reanalyze the data reported in this paper is available from the lead contact upon request.
EXPERIMENTAL MODEL AND STUDY PARTICIPANT DETAILS
Mice
Adult C57BL/6 mice (stock number 664) and B6.SJL-Ptprca Pepcb/BoyJ (stock number 2014) of at least 6 weeks of age were purchased from The Jackson Laboratory and bred in our facility. S1pr2-ERT2-Cre mice were provided by T. Okada at the RIKEN Center for Integrative Medical Sciences.50 Rosa26-LSL-Cas9 (026175), AidCre (007770), Cg1Cre (010611), Ai14 (007914), and Bcl2-Tg (002321) mice were purchased from The Jackson Laboratory. Mice carrying the conditional Zeb2flox [B6; 129(Cg)-Zfhx1btm1.1Yhi] allele and the Zeb2-GFP fusion protein reporter (STOCK Zfhxlbtm2.1Yhi) were derived from biological material provided by the RIKEN BioResource Center through the National BioResource Project of the Ministry of Education, Culture, Sports, Science and Technology, Japan.51 These mice were provided by the lab of Dr. Kenneth Murphy. All mice were maintained in a specific pathogen-free animal facility following institutional guidelines under a protocol approved by the Animal Studies Committee at Washington University in St. Louis in compliance with Institutional Animal Care and Use Committee guidelines (protocol 20–0153). Most experiments were performed using mice that were 8–12 weeks of age.
Infections and immunizations
Mice were infected with 2 × 10⁵ plaque-forming units of LCMV Armstrong administered intraperitoneally (i.p.) or 30 pfu of PR8 influenza virus intranasally. Mice were immunized with 2 × 10⁸ SRBC (Colorado serum) or 100ug NP-OVA in Alum (Thermo Scientific 77161) by intraperitoneal injection.
Healthy donor cohort
Immunocompetent healthy donor volunteer blood samples were obtained as previously described.52 The healthy donor study was approved by the Institutional Review Board of Washington University School of Medicine (Approval # 202012081).
Characteristics of patient cohort
| Patient number | Age | Sex | Vaccine type |
|---|---|---|---|
| 368–05 | 36 | Male | Pfizer |
| 368–17 | 37 | Male | Pfizer |
| 368–24 | 55 | Female | Pfizer |
| 368–25 | 45 | Female | Pfizer |
| 368–27 | 47 | Male | Pfizer |
| 368–29 | 30 | Female | Pfizer |
| 368–34 | 28 | Male | Pfizer |
| 368–36 | 48 | Female | Pfizer |
| 368–37 | 44 | Male | Pfizer |
| 368–38 | 42 | Female | Pfizer |
| 368–40 | 33 | Female | Pfizer |
METHOD DETAILS
Adoptive transfers and treatments
Tamoxifen (Fisher) was dissolved in Corn Oil (Sigma–Aldrich) at 20 mg/m and injected at 2 mg per 20 g mouse i.p. Mice were administered two doses of tamoxifen on days 4 and 6 p.i., unless otherwise noted. TAM diet (Envigo) containing chow replaced normal chow on the day after the final tamoxifen dose. To overcome initial taste aversion, additional crushed TAM diet was placed in the cage at the time of the first TAM diet feeding. For adoptive transfer experiments, B cells were enriched using a MojoSort Mouse Pan B Cell Isolation Kit II (480088) (Biolegend). Depletion of CD62L+ B cells was achieved via addition of Biotin anti-mouse CD62L (5011606) (eBioscience). The number of S1pr2-Tomato+ MBCs within the enriched CD62L− B cell population was determined using flow cytometry. CD62L− B cells were then transferred into recipient mice such that each recipient received 10–30,000 S1pr2-Tomato+ MBCs. For the recall experiments, CD62L− and CD62L+ S1pr2-Tomato+ cells were sorted from the enriched B cell population. The number of MBCs within each sorted population was quantified by flow cytometry. Sorted CD62L− and CD62L+ S1pr2-Tomato+ B cells were then transferred into recipient mice such that each recipient received 15–20,000 MBCs.
Bone marrow chimeras
Adult C57BL/6 CD45.1+ mice and B6.SJL-Ptprca Pepcb/BoyJ mice were lethally irradiated with 950 rad of gamma irradiation (a split dose separated by 3 h) and then injected intravenously with the relevant bone marrow cells. Bone marrow was harvested by flushing the tibia and femurs of donor mice.
Retroviral constructs and transductions
Murine Bcl6 and Zeb2 retroviral constructs were made by inserting the mouse open reading frame into the MSCV2.2 retroviral vector followed by an internal ribosome entry site (IRES) and Thy1.1 as an expression marker. For Crispr-Cas9 gene ablation, sgRNA sequences were cloned into the pTR-MSCV-IRES-Thy1.1 vector. sgRNA sequences were selected using the Broad Institute sgRNA Designer cross-referenced with Benchling’s CRISPR Guide tool. For sgRNA sequences that did not begin with a G, a G was added. A primer with the sequence 5′-GTGGAAAGGACGAAACACC–sgRNA sequence–GTTTTAGAGCTAGAAATAG-3′ was then ordered and cloned into the pTR-MSCV-IRES vector using the NEBuilder HiFi DNA Assembly Reaction protocol (New England Biolabs) (E2621S). The following sgRNA sequences were used: Cd62L sgRNA (5′- GTAAGTACCCTCACATCTCCA-3′) and control sgRNA (5′-GCGAGGTATTCGGCTCCGCG-3′).
Retrovirus was generated by transfecting the Plat-E packaging cell line with 2μg plasmid DNA and 5μL Lipofectamine 3000 (L3000001) (Thermo Fisher Scientific). For transduction of bone marrow, wild-type mice were injected intravenously with 150 mg/kg 5-fluorouracil (F01515G) (Fisher). Bone marrow was collected after 5 days and cultured in Dulbecco’s modified Eagle medium containing 15% fetal bovine serum, antibiotics Penicillin (10,000 IU) and Streptomycin (10,000 μg/mL) in a 100-fold working concentration (MT30001CI), and 10 mM HEPES (pH 7.2) (MT25060CI) (all from Fisher), supplemented with IL-3, IL-6 and stem cell factor (at concentrations of 20, 50 and 100 ng/m, respectively; PeproTech). Cells were spin-infected at days 1 and 2 and then transferred into irradiated recipients.
Antibodies for flow cytometry staining
Spleens were mashed through a 70μm cell strainer, and red blood cells were lysed with RBC lysing buffer. Lymphocytes were then washed and counted. Samples were analyzed on a Cytek Aurora flow cytometer. For fluorescence-activated cell sorting (FACS), a BD FACSAriaII Cell sorter was used. The following antibodies were used for flow cytometry and microscopy staining: Alexa Fluor 647 anti-mouse Ki67 (558615), (from BD Biosciences); allophycocyanin (APC) anti-mouse/human B220 (103224), APC-Cy7 anti-mouse/human B220 (103212), Biotin anti-mouse CD138 (142511), Brilliant Violet 605 (BV605) anti-mouse CD138 (142515), Alexa Fluor 647 anti-mouse CD38 (102716), Fluorescein isothiocyanate (FITC) anti-mouse CD38 (102718), phycoerythrin-indotricarbocyanine (PE-Cy7) anti-mouse CD38 (102705), peridinin chlorophyll protein Cy5.5 (PerCpCy5.5) anti-mouse CD73 (127214), Alexa Fluor 647 anti-mouse GL7 (144606), Pacific Blue anti-mouse GL7 (144614), BV605 anti-mouse IgD (405727), BV711 anti-mouse IgD (405731), Pacific Blue anti-mouse IgD (405712), PerCP Cy5.5 anti-mouse IgD (405710), Alexa Fluor 700 anti-mouse Ly-6A/E (Sca1) (108141), Trustain FcX Plus (101320), Alexa Fluor 647 anti-mouse Bcl2 (633510), BV650 anti-mouse CD44 (103049), FITC anti-mouse/human CD44 (103006), phycoerythrin (PE) anti-mouse/human CD44 (103008), Biotin anti-mouse CD62L (104412), BV510 anti-mouse CD62L (104441), BV711 anti-mouse Thy1.1 (202510), FITC anti-rat/mouse Thy1.1 (202539), Biotin anti-mouse Thy1.1 (202503), PerCpCy5.5 anti-mouse CD45.1 (110728), Biotin anti-mouse CD45.2 (109804), FITC anti-mouse CD4 (100406), BV711 anti-human CD11c (301630), BV750 anti-human CD19 (302262), APC/Fire 810 anti-human CD3 (344858), BV510 anti-human IgD (348220), BV605 anti-human IgM (314524), PE/Dazzle 594 anti-human CXCR5 (356928), APC anti-His (362605), PE/Fire 810 anti-human CD27 (302859), APC/Fire 750 anti-human CD20 (302358), Zombie NIR (423106), PE-Cy7 anti-human CD71 (334112), Alexa Fluor 700 anti-human CD44 (397521), PE/Fire 810 anti-human CD27 (302859), BV421 anti-human CD24 (311122), Alexa Fluor 594 anti-His (362609), BV570 Streptavidin (405227), BV650 anti-human CD62L (304832), BV421 anti-mouse IgD (405725), APC anti-mouse CD62L (104412) (all from Biolegend); Alexa Flour 488 anti-mouse F4/80 (50-167-58), (all from eBiosciences); BV711 anti-mouse CD95 (BDB740716) PE anti-mouse CD95 (BDB554258), Alexa Fluor 647 anti-mouse BCL6 (BDB561525), BV786 Streptavidin (BDB563858), FITC Steptavidin (BDB563260), Alexa Fluor 647 Steptavidin (BDB563858), Biotin anti-human IgG3 (OB9210-08), Alexa Fluor 555 anti-human IgG2 (OB907032), PE anti-human IgG1 (OB905409), FITC anti-human IgA (CBL114FMI), Brilliant Blue 700 (BB700) anti-human CD38 (BDB566445), PE-Cy7 anti-human PD1 (BDB561272) (all from Fisher); FITC anti-mouse VAD-FMK (50-246-327), APC anti-mouse TCR beta (2297504) (all from Invitrogen); PE-Cy7 anti-mouse IgM (25-5790-82), Live/Dead Near IR (L10119) (all from Thermofisher); NIP-BSA-Biotin (N-1027-5) from Biosearch. Influenza A H1N1(PR8) Nucleoprotein (11675-V08B) was purchased from Sino Biological and conjugated using the APC Conjugation Kit-Lightning Link (Ab201807) from Abcam according to manufacturer’s instructions.
RNA-seq library preparation and data analysis
Total RNA was purified from cells sorted by FACS using the RNeasy Micro kit (Qiagen). Samples were prepared by GeneWiz or the Genome Technology Access Center using the SMART-Seq v4 Ultra Low Input RNA Kit (Clontech). Paired end sequencing was performed on a IlluminaHiSeq2x150bp or Illumina NovaSeq X Plus and sequences were reported as FASTQ files, which were aligned to the mm10 genome using STAR (Spliced Transcripts Alignment to a Reference). Mappable reads were counted with HTSeq and imported into RStudio software (version 1.1.463) for analysis of differential expression with DESeq2 software.
Analysis of somatic mutations in JH558 intron
30,000 cells for each population were FACS sorted and DNA was isolated using a QIAamp DNA Micro kit (QIAGEN). DNA was eluted in 20 μL and used as a template for nested PCR. New primers and reagents were added directly to the first PCR product for the secondary reaction. Secondary reaction was then incubated with 1 unit of TAQ DNA Polymerase (Fisher). The resultant product was ligated into TOPO TA Cloning Kit for sequencing (Invitrogen). Colonies were then miniprepped and submitted for sequencing (GeneWiz), using T3 Primer, 5’ CTGTGTTCCTTTGAAAGCTGG3’, and sequences aligned to the germline JH558 intronic sequence using standard nucleotide BLAST. Primers are as follows: Nested Forward 1, 5′-AGCCTGACATCTGAGGAC-3′; Nested Reverse 1, 5′-TCTGATCGGCCATCTTGACTC-3′; Nested Forward 2, 5′-CATCTGAGGACTCTGCGGTCT-3′; Nested Reverse 2, 5′-CTGTGTTCCTTTGAAAGCTGG-3′.
Transcription factor staining
Single cell suspensions of splenic samples were obtained and plated onto a 96-well plate. The cells were then permeabilized for intracellular staining using the FOXP3 Fix/Perm Buffer Set (421403) (Biolegend).
Intravascular labelling
LCMV-immune mice were intravenously injected with 3 μg of Biotin anti-mouse CD45.2 (109804) (Biolegend) 5 min prior to sacrifice.
Pathway analysis
The pathway analysis was performed using the Ingenuity Pathway Analysis software (Qiagen). Upstream Regulator Analysis was performed to identify upstream regulators of genes differentially expressed between CD44−CD62L− and CD44+CD62L+ MBCs based on predictions made by the Z score algorithm (www.ingenuity.com).
ChIP seq analysis
Publicly available chromatin immunoprecipitation sequencing (ChIP)-seq data was analyzed to assess binding of Bcl6, Bcor, and Smrt to all transcriptional factors differentially expressed between CD44−CD62L− and CD44+CD62L+ MBCs.33 Peak strength was assessed as the difference between the binding intensity at the promoter regions between Bcl6 and the input control. The promoter was identified using a H3K4me3 CHIP-seq that was performed on an OCI-LY1 cell line.33
Immunofluorescence microscopy analysis
Splenic sections were fixed with 4% PFA for 2 h with rotation at 4°C, washed four times with PBS for 10 min each, and then put in a 30% sucrose solution until sections sank to the bottom. They were then embedded in OCT compound (Fisher Scientific) and sectioned at 10 μm. An Endogenous Biotin-Blocking Kit (Thermo Fisher) followed by an Alexa Fluor 488 Tyramide SuperBoost Kit (Thermo Fisher) was used to amplify the CD62L-Biotin staining according to manufacturer’s instructions. Images were captured using a Nikon AXR confocal microscope with 40x water immersion lens. Programs used were Nikon NIS Elements and Fiji.53 The Fiji Plugin that was used was Bio-Formats.54 Distance from GC center was quantified by finding the central point of the GC and measuring the distance between the central point and memory B cell subsets in Fiji. GC size was quantified in Fiji.
Preparation of peripheral blood mononuclear cells
Patient blood was collected in sodium citrate cell preparation tubes (BD Biosciences). Tubes were centrifuged at room temperature for 30 min at 1650 x g without brake. The mononuclear cells and plasma layer were then transferred to a 50 mL conical tube and centrifuged at room temperature for 10 min at 256 x g. Supernatant was removed without disturbing the cell pellet. Cells were resuspended in PBS, and all cells of the same subject were combined into one 15-mL conical tube. Cells were centrifuged as above. Supernatant was removed without disturbing the cell pellet, and cells were resuspended in 5mL of ACK lysing buffer (Thermo Fisher) for 5 min. Cells were washed with PBS, counted, washed again with PBS, resuspended in 10% dimethylsulfoxide in FBS at 106 cells per mL and aliquoted into cryovials. Cryovials were transferred to a freezing container (Daigger Scientific, Mr. Frosty) and placed in a −80°C freezer overnight before being transferred to liquid nitrogen for storage.
His-tagged SARS-CoV-2 protein purification
Genes encoding SARS-CoV-2 Wuhan-Hu-1 spike protein (residues 1–1213, GenBank: MN908947.3), the Wuhan-Hu-1 RBD (residues 319–514), and B.1.1.529 (BA.1) spike protein were cloned into a pCAGGS mammalian expression vector with a C-terminal hexahistidine tag. Both spike proteins were prefusion stabilized and expression optimized via six proline substitutions (F817P, A892P, A899P, A942P, K986P, V987P), with a disrupted S1/S2 furin cleavage site and a C-terminal foldon trimerization motif (YIPEAPRDGQAYVRKDGEWVLLSTFL).55 Expi293F cells were transiently transfected, and proteins were recovered via cobalt-charged resin chromatography (G-Biosciences) as previously described.38,39
QUANTIFICATION AND STATISTICAL ANALYSIS
Statistical significance was determined using Prism Version 9 (GraphPad). Statistical analysis was determined by one-way ANOVA, unpaired t test, mixed model analysis, or two-way ANOVA with Fisher’s least significant difference testing. For all tests, *, p < 0.05, **, p < 0.01; ***, p < 0.001; ****, p < 0.0001.
Supplementary Material
KEY RESOURCES TABLE
| REAGENT or RESOURCE | SOURCE | IDENTIFIER |
|---|---|---|
| Antibodies | ||
| Alexa Fluor 647 anti-mouse Ki67 | BD Biosciences | Cat# 558615; RRID: AB_647130 |
| APC anti-mouse/human B220 | Biolegend | Cat# 103224; RRID:AB_313006 |
| APC-Cy7 anti-mouse/human B220 | Biolegend | Cat# 103212; RRID:AB_312997 |
| Biotin anti-mouse CD138 | Biolegend | Cat# 142511; RRID:AB_2561980 |
| BV605 anti-mouse CD138 | Biolegend | Cat# 142515; RRID:AB_2562337 |
| Alexa Fluor 647 anti-mouse CD38 | Biolegend | Cat# 102716; RRID:AB_2073334 |
| FITC anti-mouse CD38 | Biolegend | Cat# 102718; RRID:AB_2072892 |
| PE-Cy7 anti-mouse CD38 | Biolegend | Cat# 102705; RRID:AB_312926 |
| PerCpCy5.5 anti-mouse CD73 | Biolegend | Cat# 127214; RRID:AB_11219608 |
| Alexa Fluor 647 anti-mouse GL7 | Biolegend | Cat# 144606; RRID:AB_2562185 |
| Pacific Blue anti-mouse GL7 | Biolegend | Cat# 144614; RRID:AB_2563291 |
| BV605 anti-mouse IgD | Biolegend | Cat# 405727; RRID:AB_2562887 |
| BV711 anti-mouse IgD | Biolegend | Cat# 405731; RRID:AB_2563342 |
| Pacific Blue anti-mouse IgD | Biolegend | Cat# 405712; RRID:AB_1937244 |
| PerCP Cy5.5 anti-mouse IgD | Biolegend | Cat# 405710; RRID:AB_1575115 |
| Alexa Fluor 700 anti-mouse Ly-6A/E (Sca1) | Biolegend | Cat# 108141; RRID:AB_2565958 |
| Trustain FcX Plus | Biolegend | Cat# 101320; RRID:AB_1574975 |
| Alexa Fluor 647 anti-mouse Bcl2 | Biolegend | Cat# 633510; RRID:AB_2274702 |
| BV650 anti-mouse/human CD44 | Biolegend | Cat# 103049; RRID:AB_2562600 |
| FITC anti-mouse/human CD44 | Biolegend | Cat# 103006; RRID:AB_493685 |
| PE anti-mouse/human CD44 | Biolegend | Cat# 103008; RRID:AB_493687 |
| Biotin anti-mouse CD62L | Biolegend | Cat# 104412; RRID:AB_313099 |
| BV510 anti-mouse CD62L | Biolegend | Cat# 104441; RRID:AB_2561537 |
| BV711 anti-mouse Thy1.1 | Biolegend | Cat# 202510; RRID:AB_2201417 |
| FITC anti-rat/mouse Thy1.1 | Biolegend | Cat# 202539; RRID:AB_2562645 |
| Biotin anti-mouse Thy1.1 | Biolegend | Cat# 202503; RRID:AB_314014 |
| PerCpCy5.5 anti-mouse CD45.1 | Biolegend | Cat# 110728; RRID:AB_893348 |
| FITC anti-mouse CD4 | Biolegend | Cat# 100406; RRID:AB_312690 |
| Biotin anti-mouse CD45.2 | Biolegend | Cat# 109804; RRID:AB_313441 |
| BV711 anti-human CD11c | Biolegend | Cat# 301630; RRID:AB_11219609 |
| BV750 anti-human CD19 | Biolegend | Cat# 302262; RRID:AB_2810434 |
| APC/Fire 810 anti-human CD3 | Biolegend | Cat# 344858; RRID:AB_2860895 |
| BV510 anti-human IgD | Biolegend | Cat# 348220; RRID:AB_2561945 |
| BV605 anti-human IgM | Biolegend | Cat# 314524; RRID:AB_2562374 |
| PE/Dazzle 594 anti-human CXCR5 | Biolegend | Cat# 356928; RRID:AB_2563688 |
| APC anti-His | Biolegend | Cat# 362605; RRID:AB_2715818 |
| PE/Fire 810 anti-human CD27 | Biolegend | Cat# 302859; RRID:AB_2894557 |
| APC/Fire 750 anti-human CD20 | Biolegend | Cat# 302358; RRID:AB_2572125 |
| Zombie NIR | Biolegend | Cat# 423106 |
| PE-Cy7 anti-human CD71 | Biolegend | Cat# 334112; RRID:AB_ |
| Alexa Fluor 700 anti-human CD44 | Biolegend | Cat# 397521; RRID:AB_2563118 |
| PE/Fire 810 anti-human CD27 | Biolegend | Cat# 302859; RRID:AB_2894557 |
| BV421 anti-human CD24 | Biolegend | Cat# 311122; RRID:AB_2561691 |
| Alexa Fluor 594 anti-His | Biolegend | Cat# 362609; RRID:AB_2716214 |
| BV570 Streptavidin | Biolegend | Cat# 405227 |
| BV650 anti-human CD62L | Biolegend | Cat# 304832; RRID:AB_2561461 |
| BV421 anti-mouse IgD | Biolegend | Cat# 405725; RRID:AB_2562743 |
| APC anti-mouse CD62L | Biolegend | Cat# 104412; RRID:AB_313099 |
| Alexa Flour 488 anti-mouse F4/80 | eBiosciences | Cat# 50-167-58; RRID:AB_469914 |
| BV711 anti-mouse CD95 | Fisher | Cat# BDB740716; RRID:AB_ |
| BV786 Streptavidin | Fisher | Cat# BDB563858; RRID:AB_2869529 |
| PE anti-mouse CD95 | Fisher | Cat# BDB554258; RRID:AB_395330 |
| Alexa Fluor 647 anti-mouse BCL6 | Fisher | Cat# BDB561525; RRID:AB_10898007 |
| FITC Steptavidin | Fisher | Cat# BDB563260; RRID:AB_2869476 |
| Alexa Fluor 647 Steptavidin | Fisher | Cat# BDB563858; RRID:AB_2869529 |
| Biotin anti-human IgG3 | Fisher | Cat# OB9210-08; RRID:AB_2796700 |
| Alexa Fluor 555 anti-human IgG2 | Fisher | Cat# OB907032; RRID:AB_2796642 |
| PE anti-human IgG1 | Fisher | Cat# OB905409; RRID:AB_2796628 |
| FITC anti-human IgA | Fisher | Cat# CBL114FMI; RRID:AB_92852 |
| BB700 anti-human CD38 | Fisher | Cat# BDB566445; RRID:AB_2744375 |
| PE-Cy7 anti-human PD1 | Fisher | Cat# BDB561272; RRID:AB_10611585 |
| FITC anti-mouse VAD-FMK | Invitrogen | Cat# 50-246-327; RRID:AB_2574939 |
| APC anti-mouse TCR beta | Invitrogen | Cat# 2297504; RRID:AB_ |
| PE-Cy7 anti-mouse IgM | Thermofisher | Cat# 25-5790-82; RRID:AB_ |
| Live/Dead Near IR | Thermofisher | Cat# L10119; RRID:AB_ |
| NIP-BSA-Biotin | Biosearch | Cat#: N-1027-5; RRID:AB_ |
| His tagged SARS-COV-2 Wuhan-Hu-1 Spike | Generated in lab | N/A |
| Bacterial and virus strains | ||
| Lymphocytic choriomeningitis virus | Grown in lab | N/A |
| H1N1 A/Puerto Rico/8/1934 (PR8) | Grown in lab | N/A |
| Chemicals, peptides, and recombinant proteins | ||
| NP-OVA | BioSearch Technologies | Cat#: N-5051-10 |
| Alum | Thermo Scientific | Cat# 77161 |
| Tamoxifen | Fisher | Cat# AAJ6350906 |
| TAM diet | Teklad | Cat# 130859 |
| Lipofectamine 3000 | Thermo Fisher Scientific | Cat#: L3000001 |
| 5-fluorouracil | Fisher | F01515G |
| Mouse IL-3 | Peprotech | 50-813-291 |
| Mouse IL-6 | Peprotech | 216-1650UG |
| Mouse SCF | Peprotech | 250-03-100UG |
| Influenza A H1N1(PR8) Nucleoprotein | Sino Biological | 11675-V08B |
| TAQ DNA Polymerase | Fisher | F530S |
| Critical commercial assays | ||
| RNeasy Micro kit | Qiagen | Cat# 74004 |
| SMART-Seq v4 Ultra Low Input RNA Kit | Takara | Cat# 634888 |
| MojoSort Mouse Pan B Cell Isolation Kit II | Biolegend | Cat# 480088 |
| FOXP3 Fix/Perm Buffer Set | Biolegend | Cat# 421403 |
| APC Conjugation Kit-Lightning Link | Abcam | Cat# Ab201807 |
| QIAamp DNA Micro kit | Qiagen | Cat# 56304 |
| TOPO TA Cloning Kit | Invitrogen | Cat# 45-003-0 |
| Endogenous Biotin-Blocking Kit | Thermo Fisher | Cat# E21390 |
| Alexa Fluor 488 Tyramide SuperBoost Kit | Thermo Fisher | Cat# B40932 |
| Deposited data | ||
| Raw and analyzed data | This paper | GEO: GSE247445 |
| Experimental models: Cell lines | ||
| Plat-E packaging cell line | Cell Biolabs | Cat# RV-101 |
| Experimental models: Organisms/strains | ||
| C57BL/6 | The Jackson Laboratory | Stock: 664 |
| B6.SJL-Ptprca Pepcb/BoyJ | The Jackson Laboratory | Stock: 2014 |
| S1pr2-ERT2-Cre | T. Okada | N/A |
| Rosa26-LSL-Cas9 | The Jackson Laboratory | Stock: 026175 |
| Aid Cre | The Jackson Laboratory | Stock: 007770 |
| Cg1 Cre | The Jackson Laboratory | Stock: 010611 |
| Ai14 | The Jackson Laboratory | Stock: 007914 |
| Bcl2-Tg | The Jackson Laboratory | Stock: 002321 |
| Zeb2 flox | RIKEN | N/A |
| Zeb2-GFP | RIKEN | N/A |
| Oligonucleotides | ||
| Cd62L sgRNA: 5′ GTAAGTACCCTCACATCTCCA 3′ | Life Technologies | N/A |
| Control sgRNA: 5′ GCGAGGTATTCGGCTCCGCG 3′ | Life Technologies | N/A |
| T3 Primer: 5′ CTGTGTTCCTTTGAAAGCTGG 3′, | Life Technologies | N/A |
| Nested Forward 1, 5′-AGCCTGACATCTGAGGAC-3′ | Life Technologies | N/A |
| Nested Reverse 1, 5′-TCTGATCGGCCATCTTGACTC-3′ | Life Technologies | N/A |
| Nested Forward 2, 5′-CATCTGAGGACTCTGCGGTCT-3′ | Life Technologies | N/A |
| Nested Reverse 2, 5′-CTGTGTTCCTTTGAAAGCTGG-3′. | Life Technologies | N/A |
| Recombinant DNA | ||
| MSCV-EV | Generated in lab | N/A |
| MSCV-Bcl6 | Generated in lab | N/A |
| MSCV-Zeb2 | Generated in lab | N/A |
| pTR-MSCV-IRES-Thy1.1 Control | Generated in lab | N/A |
| pTR-MSCV-IRES-Thy1.1 CD62L | Generated in lab | N/A |
| Software and algorithms | ||
| HTSeq | Open source | https://bioinformaticsdotca.github.io/htseq_2020_installation |
| DESeq2 | Open source | https://bioconductor.org/packages/release/bioc/html/DESeq2.html |
| FIJI | Open source | https://imagej.net/software/fiji/ |
| FlowJo | BD | https://www.flowjo.com/solutions/flowjo/downloads |
| GraphPad Prism | GraphPad | https://www.graphpad.com/scientific-software/prism/ |
| Ingenuity Pathway Analysis | Qiagen | https://analysis.ingenuity.com/pa/installer/select |
| Other | ||
| Sheep Red Blood Cells | Colorado serum | Cat# 31112 |
| Corn oil | Sigma–Aldrich | Cat#: C8267 |
Highlights.
CD44 and CD62L identify transcriptionally and functionally distinct memory B cell subsets
Bcl6 regulates memory B cell differentiation through control of a network of genes
Overexpression of Zeb2 restricts the differentiation of CD62L+ memory B cells
CD62L identifies phenotypically distinct human memory B cells following mRNA vaccination
ACKNOWLEDGMENTS
This work was supported by grants and contracts from the NIH: DP2AI169978, UL1TR002345, and K22AI153015 (all to B.J.L.), 75N93019C00062 and 75N93022C0003 (all to D.H.F.), and U01AI141990, U01AI150747, HHSN272201400006C, HHSN272201400008C, and 75N93019C00051 (all to A H.E.). This study utilized samples obtained from the Washington University School of Medicine COVID-19 biorepository, which is supported by the NIH/National Center for Advancing Translational Sciences (UL1 TR002345). The WU368 studies were reviewed and approved by the Washington University Institutional Review Board (approval no. 308 202012081). The authors express their gratitude to all study participants. The authors also thank the Washington University Center for Cellular Imaging Core facility for their assistance.
DECLARATION OF INTERESTS
The Ellebedy laboratory received funding from Emergent BioSolutions, AbbVie, and Moderna that is unrelated to the data presented in the current study. A.H.E. has received consulting and speaking fees from InBios International, Fimbrion Therapeutics, RGAX, Mubadala Investment Company, Moderna, Pfizer, GSK, Danaher, Third Rock Ventures, Goldman Sachs, and Morgan Stanley and is the founder of ImmuneBio Consulting. J.S.T. and A.H.E. are recipients of a licensing agreement with AbbVie that is unrelated to the data presented in the current study.
Footnotes
SUPPLEMENTAL INFORMATION
Supplemental information can be found online at https://doi.org/10.1016/j.celrep.2023.113542.
REFERENCES
- 1.Cyster JG, and Allen CDC (2019). B Cell Responses: Cell Interaction Dynamics and Decisions. Cell 177, 524–540. [DOI] [PMC free article] [PubMed] [Google Scholar]
- 2.Laidlaw BJ, and Cyster JG (2021). Transcriptional regulation of memory B cell differentiation. Nat. Rev. Immunol 21, 209–220. [DOI] [PMC free article] [PubMed] [Google Scholar]
- 3.Toyama H, Okada S, Hatano M, Takahashi Y, Takeda N, Ichii H, Takemori T, Kuroda Y, and Tokuhisa T (2002). Memory B cells without somatic hypermutation are generated from Bcl6-deficient B cells. Immunity 17, 329–339. [DOI] [PubMed] [Google Scholar]
- 4.Zuccarino-Catania GV, Sadanand S, Weisel FJ, Tomayko MM, Meng H, Kleinstein SH, Good-Jacobson KL, and Shlomchik MJ (2014). CD80 and PD-L2 define functionally distinct memory B cell subsets that are independent of antibody isotype. Nat. Immunol 15, 631–637. [DOI] [PMC free article] [PubMed] [Google Scholar]
- 5.McHeyzer-Williams LJ, Milpied PJ, Okitsu SL, and McHeyzer-Williams MG (2015). Class-switched memory B cells remodel BCRs within secondary germinal centers. Nat. Immunol 16, 296–305. [DOI] [PMC free article] [PubMed] [Google Scholar]
- 6.Terreri S, Piano Mortari E, Vinci MR, Russo C, Alteri C, Albano C, Colavita F, Gramigna G, Agrati C, Linardos G, et al. (2022). Persistent B cell memory after SARS-CoV-2 vaccination is functional during breakthrough infections. Cell Host Microbe 30, 400–408.e4. [DOI] [PMC free article] [PubMed] [Google Scholar]
- 7.Pritchard GH, Krishnamurty AT, Netland J, Arroyo EN, Takehara KK, and Pepper M (2019). The Development of Optimally Responsive Plasmodium-specific CD73+CD80+ IgM+ Memory B cells Requires Intrinsic BCL6 expression but not CD4+ Tfh cells. Preprint at bioRxiv. [Google Scholar]
- 8.Laidlaw BJ, Duan L, Xu Y, Vazquez SE, and Cyster JG (2020). The transcription factor Hhex cooperates with the corepressor Tle3 to promote memory B cell development. Nat. Immunol 21, 1082–1093. [DOI] [PMC free article] [PubMed] [Google Scholar]
- 9.Koike T, Harada K, Horiuchi S, and Kitamura D (2019). The quantity of CD40 signaling determines the differentiation of B cells into functionally distinct memory cell subsets. Elife 8, e44245. [DOI] [PMC free article] [PubMed] [Google Scholar]
- 10.Kenderes KJ, Levack RC, Papillion AM, Cabrera-Martinez B, Dishaw LM, and Winslow GM (2018). T-Bet+ IgM Memory Cells Generate Multi-lineage Effector B Cells. Cell Rep. 24, 824–837.e3. [DOI] [PMC free article] [PubMed] [Google Scholar]
- 11.Weisel NM, Joachim SM, Smita S, Callahan D, Elsner RA, Conter LJ, Chikina M, Farber DL, Weisel FJ, and Shlomchik MJ (2022). Surface phenotypes of naive and memory B cells in mouse and human tissues. Nat. Immunol 23, 135–145. [DOI] [PMC free article] [PubMed] [Google Scholar]
- 12.Morrison VL, Barr TA, Brown S, and Gray D (2010). TLR-Mediated Loss of CD62L Focuses B Cell Traffic to the Spleen during Salmonella typhimurium Infection. J. Immunol 185, 2737–2746. [DOI] [PMC free article] [PubMed] [Google Scholar]
- 13.Pape KA, Catron DM, Itano AA, and Jenkins MK (2007). The Humoral Immune Response Is Initiated in Lymph Nodes by B Cells that Acquire Soluble Antigen Directly in the Follicles. Immunity 26, 491–502. [DOI] [PubMed] [Google Scholar]
- 14.Camp RL, Kraus TA, Birkeland ML, and Puré E (1991). High levels of CD44 expression distinguish virgin from antigen-primed B cells. J. Exp. Med 173, 763–766. [DOI] [PMC free article] [PubMed] [Google Scholar]
- 15.Turner JS, Zhou JQ, Han J, Schmitz AJ, Rizk AA, Alsoussi WB, Lei T, Amor M, McIntire KM, Meade P, et al. (2020). Human germinal centres engage memory and naive B cells after influenza vaccination. Nature 586, 127–132. [DOI] [PMC free article] [PubMed] [Google Scholar]
- 16.Platt RJ, Chen S, Zhou Y, Yim MJ, Swiech L, Kempton HR, Dahlman JE, Parnas O, Eisenhaure TM, Jovanovic M, et al. (2014). CRISPR-Cas9 Knockin Mice for Genome Editing and Cancer Modeling. Cell 159, 440–455. [DOI] [PMC free article] [PubMed] [Google Scholar]
- 17.Casola S, Cattoretti G, Uyttersprot N, Koralov SB, Seagal J, Hao Z, Waisman A, Egert A, Ghitza D, and Rajewsky K (2006). Tracking germinal center B cells expressing germ-line immunoglobulin γ1 transcripts by conditional gene targeting. Proc National Acad Sci 103, 7396–7401. [DOI] [PMC free article] [PubMed] [Google Scholar]
- 18.Viant C, Wirthmiller T, ElTanbouly MA, Chen ST, Cipolla M, Ramos V, Oliveira TY, Stamatatos L, and Nussenzweig MC (2021). Germinal center–dependent and –independent memory B cells produced throughout the immune response. J. Exp. Med 218, e20202489. [DOI] [PMC free article] [PubMed] [Google Scholar]
- 19.Weisel FJ, Zuccarino-Catania GV, Chikina M, and Shlomchik MJ (2016). A Temporal Switch in the Germinal Center Determines Differential Output of Memory B and Plasma Cells. Immunity 44, 116–130. [DOI] [PMC free article] [PubMed] [Google Scholar]
- 20.Park S-R, Zan H, Pal Z, Zhang J, Al-Qahtani A, Pone EJ, Xu Z, Mai T, and Casali P (2009). HoxC4 binds to the promoter of the cytidine deaminase AID gene to induce AID expression, class-switch DNA recombination and somatic hypermutation. Nat. Immunol 10, 540–550. [DOI] [PMC free article] [PubMed] [Google Scholar]
- 21.Laidlaw BJ, Schmidt TH, Green JA, Allen CDC, Okada T, and Cyster JG (2017). The Eph-related tyrosine kinase ligand Ephrin-B1 marks germinal center and memory precursor B cells. J. Exp. Med 214, 639–649. [DOI] [PMC free article] [PubMed] [Google Scholar]
- 22.Jolly CJ, Klix N, and Neuberger MS (1997). Rapid methods for the analysis of immunoglobulin gene hypermutation: application to transgenic and gene targeted mice. Nucleic Acids Res. 25, 1913–1919. [DOI] [PMC free article] [PubMed] [Google Scholar]
- 23.Anderson KG, Mayer-Barber K, Sung H, Beura L, James BR, Taylor JJ, Qunaj L, Griffith TS, Vezys V, Barber DL, and Masopust D (2014). Intravascular staining for discrimination of vascular and tissue leukocytes. Nat. Protoc 9, 209–222. [DOI] [PMC free article] [PubMed] [Google Scholar]
- 24.Lewis SM, Williams A, and Eisenbarth SC (2019). Structure and function of the immune system in the spleen. Sci. Immunol 4, eaau6085. [DOI] [PMC free article] [PubMed] [Google Scholar]
- 25.Li J, Lu E, Yi T, and Cyster JG (2016). EBI2 augments Tfh cell fate by promoting interaction with IL-2-quenching dendritic cells. Nature 533, 110–114. [DOI] [PMC free article] [PubMed] [Google Scholar]
- 26.Dent AL, Shaffer AL, Yu X, Allman D, and Staudt LM (1997). Control of Inflammation, Cytokine Expression, and Germinal Center Formation by BCL-6. Science 276, 589–592. [DOI] [PubMed] [Google Scholar]
- 27.Ye BH, Cattoretti G, Shen Q, Zhang J, Hawe N, de Waard R, Leung C, Nouri-Shirazi M, Orazi A, Chaganti RS, et al. (1997). The BCL-6 proto-oncogene controls germinal-centre formation and Th2-type inflammation. Nat. Genet 16, 161–170. [DOI] [PubMed] [Google Scholar]
- 28.Strasser A, Whittingham S, Vaux DL, Bath ML, Adams JM, Cory S, and Harris AW (1991). Enforced BCL2 expression in B-lymphoid cells prolongs antibody responses and elicits autoimmune disease. Proc National Acad Sci 88, 8661–8665. [DOI] [PMC free article] [PubMed] [Google Scholar]
- 29.Smith KG, Weiss U, Rajewsky K, Nossal GJ, and Tarlinton DM (1994). Bcl-2 increases memory B cell recruitment but does not perturb selection in germinal centers. Immunity 1, 803–813. [DOI] [PubMed] [Google Scholar]
- 30.Saito M, Novak U, Piovan E, Basso K, Sumazin P, Schneider C, Crespo M, Shen Q, Bhagat G, Califano A, et al. (2009). BCL6 suppression of BCL2 via Miz1 and its disruption in diffuse large B cell lymphoma. Proc National Acad Sci 106, 11294–11299. [DOI] [PMC free article] [PubMed] [Google Scholar]
- 31.Hollister K, Kusam S, Wu H, Clegg N, Mondal A, Sawant DV, and Dent AL (2013). Insights into the Role of Bcl6 in Follicular Th Cells Using a New Conditional Mutant Mouse Model. J. Immunol 191, 3705–3711. [DOI] [PMC free article] [PubMed] [Google Scholar]
- 32.Robbiani DF, Bothmer A, Callen E, Reina-San-Martin B, Dorsett Y, Difilippantonio S, Bolland DJ, Chen HT, Corcoran AE, Nussenzweig A, and Nussenzweig MC (2008). AID Is Required for the Chromosomal Breaks in c-myc that Lead to c-myc/IgH Translocations. Cell 135, 1028–1038. [DOI] [PMC free article] [PubMed] [Google Scholar]
- 33.Hatzi K, Jiang Y, Huang C, Garrett-Bakelman F, Gearhart MD, Giannopoulou EG, Zumbo P, Kirouac K, Bhaskara S, Polo JM, et al. (2013). A hybrid mechanism of action for BCL6 in B cells defined by formation of functionally distinct complexes at enhancers and promoters. Cell Rep. 4, 578–588. [DOI] [PMC free article] [PubMed] [Google Scholar]
- 34.Ding BB, Yu JJ, Yu RY-L, Mendez LM, Shaknovich R, Zhang Y, Cattoretti G, and Ye BH (2008). Constitutively activated STAT3 promotes cell proliferation and survival in the activated B-cell subtype of diffuse large B-cell lymphomas. Blood 111, 1515–1523. [DOI] [PMC free article] [PubMed] [Google Scholar]
- 35.Johnston RJ, Poholek AC, DiToro D, Yusuf I, Eto D, Barnett B, Dent AL, Craft J, and Crotty S (2009). Bcl6 and Blimp-1 Are Reciprocal and Antagonistic Regulators of T Follicular Helper Cell Differentiation. Science 325, 1006–1010. [DOI] [PMC free article] [PubMed] [Google Scholar]
- 36.Li J, Riedt T, Goossens S, Carrillo García C, Szczepanski S, Brandes M, Pieters T, Dobrosch L, Gütgemann I, Farla N, et al. (2017). The EMT transcription factor Zeb2 controls adult murine hematopoietic differentiation by regulating cytokine signaling. Blood 129, 460–472. [DOI] [PubMed] [Google Scholar]
- 37.Huang X, Ferris ST, Kim S, Choudhary MNK, Belk JA, Fan C, Qi Y, Sudan R, Xia Y, Desai P, et al. (2021). Differential usage of transcriptional repressor Zeb2 enhancers distinguishes adult and embryonic hematopoiesis. Immunity 54, 1417–1432.e7. [DOI] [PMC free article] [PubMed] [Google Scholar]
- 38.Alsoussi WB, Turner JS, Case JB, Zhao H, Schmitz AJ, Zhou JQ, Chen RE, Lei T, Rizk AA, McIntire KM, et al. (2020). A Potently Neutralizing Antibody Protects Mice against SARS-CoV-2 Infection. J. Immunol 205, 915–922. [DOI] [PMC free article] [PubMed] [Google Scholar]
- 39.Hassan AO, Case JB, Winkler ES, Thackray LB, Kafai NM, Bailey AL, McCune BT, Fox JM, Chen RE, Alsoussi WB, et al. (2020). A SARS-CoV-2 Infection Model in Mice Demonstrates Protection by Neutralizing Antibodies. Cell 132, 744–753.e4. [DOI] [PMC free article] [PubMed] [Google Scholar]
- 40.Kim W, Zhou JQ, Horvath SC, Schmitz AJ, Sturtz AJ, Lei T, Liu Z, Kalaidina E, Thapa M, Alsoussi WB, et al. (2022). Germinal centre-driven maturation of B cell response to mRNA vaccination. Nature 604, 141–145. [DOI] [PMC free article] [PubMed] [Google Scholar]
- 41.Yewdell WT, Smolkin RM, Belcheva KT, Mendoza A, Michaels AJ, Cols M, Angeletti D, Yewdell JW, and Chaudhuri J (2021). Temporal dynamics of persistent germinal centers and memory B cell differentiation following respiratory virus infection. Cell Rep. 37, 109961. [DOI] [PMC free article] [PubMed] [Google Scholar]
- 42.Moran I, Nguyen A, Khoo WH, Butt D, Bourne K, Young C, Hermes JR, Biro M, Gracie G, Ma CS, et al. (2018). Memory B cells are reactivated in subcapsular proliferative foci of lymph nodes. Nat. Commun 9, 3372. [DOI] [PMC free article] [PubMed] [Google Scholar]
- 43.Aiba Y, Kometani K, Hamadate M, Moriyama S, Sakaue-Sawano A, Tomura M, Luche H, Fehling HJ, Casellas R, Kanagawa O, et al. (2010). Preferential localization of IgG memory B cells adjacent to contracted germinal centers. Proc National Acad Sci 107, 12192–12197. [DOI] [PMC free article] [PubMed] [Google Scholar]
- 44.Lu E, Dang EV, McDonald JG, and Cyster JG (2017). Distinct oxysterol requirements for positioning naïve and activated dendritic cells in the spleen. Sci. Immunol 2, eaal5237. [DOI] [PMC free article] [PubMed] [Google Scholar]
- 45.Inoue T, Shinnakasu R, Kawai C, Ise W, Kawakami E, Sax N, Oki T, Kitamura T, Yamashita K, Fukuyama H, and Kurosaki T (2021). Exit from germinal center to become quiescent memory B cells depends on metabolic reprograming and provision of a survival signal. J. Exp. Med 213, e20200866. [DOI] [PMC free article] [PubMed] [Google Scholar]
- 46.Gao X, Shen Q, Roco JA, Frith K, Munier CML, Nekrasov M, Dalton B, He J-S, Jaeger R, Cook MC, et al. (2022). ZEB2 regulates the development of CD11c+ atypical B cells. Preprint at bioRxiv. [Google Scholar]
- 47.Gu S, Han X, Yao C, Ding H, Zhang J, Hou G, Qu B, Zhou H, Ying Z, Ye Z, et al. (2021). The transcription factor Zeb2 drives differentiation of age-associated B cells. Preprint at bioRxiv. [Google Scholar]
- 48.Ellebedy AH, Jackson KJL, Kissick HT, Nakaya HI, Davis CW, Roskin KM, McElroy AK, Oshansky CM, Elbein R, Thomas S, et al. (2016). Defining antigen-specific plasmablast and memory B cell subsets in human blood after viral infection or vaccination. Nat. Immunol 17, 1226–1234. [DOI] [PMC free article] [PubMed] [Google Scholar]
- 49.Nellore A, Zumaquero E, Scharer CD, Fucile CF, Tipton CM, King RG, Mi T, Mousseau B, Bradley JE, Zhou F, et al. (2023). A transcriptionally distinct subset of influenza-specific effector memory B cells predicts long-lived antibody responses to vaccination in humans. Immunity 56, 847–863.e8. [DOI] [PMC free article] [PubMed] [Google Scholar]
- 50.Shinnakasu R, Inoue T, Kometani K, Moriyama S, Adachi Y, Nakayama M, Takahashi Y, Fukuyama H, Okada T, and Kurosaki T (2016). Regulated selection of germinal-center cells into the memory B cell compartment. Nat. Immunol 17, 861–869. [DOI] [PubMed] [Google Scholar]
- 51.Higashi Y, Maruhashi M, Nelles L, Van de Putte T, Verschueren K, Miyoshi T, Yoshimoto A, Kondoh H, and Huylebroeck D (2002). Generation of the floxed allele of the SIP1 (Smad-interacting protein 1) gene for Cre-mediated conditional knockout in the mouse. Genesis 32, 82–84. [DOI] [PubMed] [Google Scholar]
- 52.Turner JS, O’Halloran JA, Kalaidina E, Kim W, Schmitz AJ, Zhou JQ, Lei T, Thapa M, Chen RE, Case JB, et al. (2021). SARS-CoV-2 mRNA vaccines induce persistent human germinal centre responses. Nature 596, 109–113. [DOI] [PMC free article] [PubMed] [Google Scholar]
- 53.Schindelin J, Arganda-Carreras I, Frise E, Kaynig V, Longair M, Pietzsch T, Preibisch S, Rueden C, Saalfeld S, Schmid B, et al. (2012). Fiji: an open-source platform for biological-image analysis. Nat. Methods 9, 676–682. [DOI] [PMC free article] [PubMed] [Google Scholar]
- 54.Linkert M, Rueden CT, Allan C, Burel J-M, Moore W, Patterson A, Loranger B, Moore J, Neves C, MacDonald D, et al. (2010). Metadata matters: access to image data in the real world. J. Cell Biol 189, 777–782. [DOI] [PMC free article] [PubMed] [Google Scholar]
- 55.Hsieh C-L, Goldsmith JA, Schaub JM, DiVenere AM, Kuo H-C, Javanmardi K, Le KC, Wrapp D, Lee AG, Liu Y, et al. (2020). Structure-based design of prefusion-stabilized SARS-CoV-2 spikes. Science 369, 1501–1505. [DOI] [PMC free article] [PubMed] [Google Scholar]
Associated Data
This section collects any data citations, data availability statements, or supplementary materials included in this article.
Supplementary Materials
Data Availability Statement
Raw and processed data files for the RNA-seq analysis have been deposited in the NCBI Gene Expression Omnibus under accession number GSE247445.
This paper does not report original code.
Any additional information required to reanalyze the data reported in this paper is available from the lead contact upon request.