Abstract
To understand better the relative contributions of transcriptional and post-transcriptional processes towards the regulation of gene expression in plant mitochondria, we compared the steady state levels of RNAs with the respective transcriptional activities. All of the protein and rRNA coding genes of the Arabidopsis mitochondrial genome and several orfs were analyzed by run-on and northern experiments. rRNAs constitute the bulk of the steady state RNA in Arabidopsis mitochondria, but are (different from maize mitochondria) not equally prominent among the run-on transcripts. Their relatively low rate of active transcription is apparently compensated by their high stability. Run-on transcription values differ significantly between genes coding for different subunits of the same protein complex. The steady state RNA levels are considerably more homogeneous, indicating that high variations of transcription rates are counterbalanced by post-transcriptional processes. The relative amounts of the steady state transcripts for the different subunits in a given protein complex reflect the relative stoichiometries of the protein subunits much more closely than the respective transcriptional activities. Post-transcriptional RNA processing and stability thus contribute significantly to the regulation of gene expression in Arabidopsis mitochondria.
INTRODUCTION
The availability of the Arabidopsis mitochondrial genome sequence permits a global expression analysis at the level of the entire genome (Unseld et al., 1997; Giegé et al., 1998b; Giegé and Brennicke, 1999). Beyond ascribing novel functions by their active expression (Giegé et al., 1998a), such a genome-wide investigation will also allow insights into the relative contribution of transcriptional activity and transcript turn-over to the regulatory mechanisms operative in plant mitochondria. Various processes of RNA degradation have been identified recently in plant mitochondria. Specific and often conserved stem–loop structures at the 3′ termini of several mRNAs protect these molecules from immediate degradation (Bellaoui et al., 1997; Dombrowski et al., 1997). Polyadenylation on the other hand can destabilize mRNA molecules and initiate 3′ to 5′ degradation processes (Gagliardi and Leaver, 1999; Lupold et al., 1999).
To analyze the role of transcript turn-over we compared steady state RNA levels and transcriptional activities for all the protein and rRNA coding genes in plant mitochondria. The steady state levels of the respective mRNAs are generally found to correlate with the stoichiometries of the subunits within the final protein complexes, suggesting that much of the regulation of gene expression in plant mitochondria occurs before translation is initiated. Transcriptional activity as determined by run-on assays varies much more between the different subunits than the steady state levels, indicating a major buffering effect of post-transcriptional processes.
RESULTS AND DISCUSSION
Estimations of transcriptional activities in Arabidopsis mitochondria
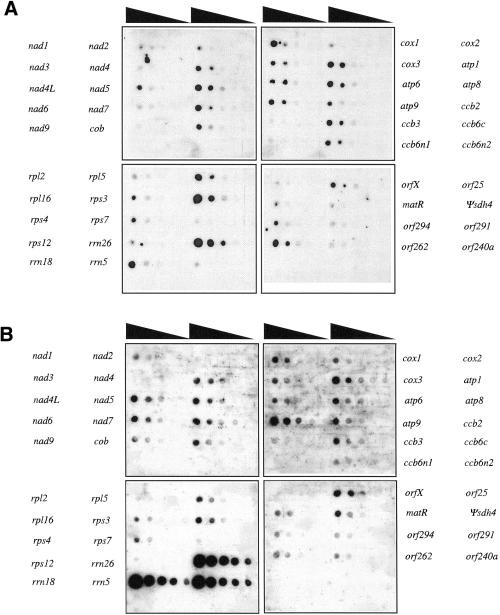
The relative transcriptional activities of the Arabidopsis mitochondrial genes were estimated by hybridizing run-on transcripts to probes of the identified protein and rRNA coding genes and to probes of several novel open reading frames where transcription and RNA editing status had been investigated by cDNA analysis (Figure 1A; Marienfeld et al., 1997; Giegé and Brennicke, 1999). The run-on transcription data were normalized for the number of Us or Gs present in the RNA of the respectively investigated transcription unit (Figure 2A).
Fig. 1. Autoradiograms of the nylon filters representing the Arabidopsis mitochondrial gene content were hybridized with mitochondrial run-on transcripts (A) or with 5′ labeled steady state mitochondrial transcripts (B). Black triangles indicate the decreasing amount of DNA on the filters with the highest concentration of probe on the left and the lowest on the right. The correspondence between genes and spot rows is indicated beside the autoradiograms.
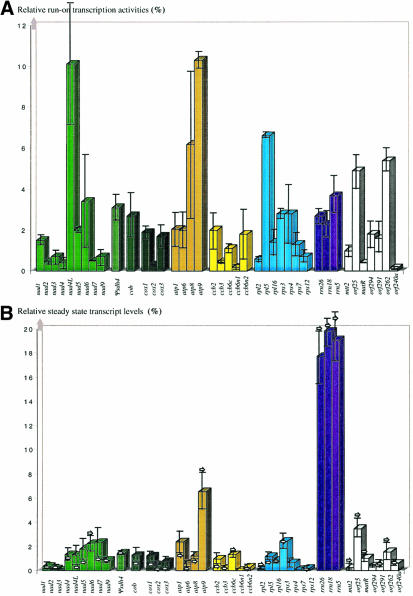
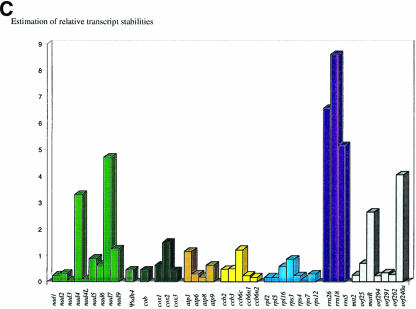
Fig. 2. Histograms indicating the respective transcriptional activity (A), steady state transcript levels (B) and deduced transcript stability (C). The values displayed in (A) and (B) are expressed as a percentage of the total amounts observed in the respective experiments. The bars indicate the standard deviation obtained in four experiments each for (A) and (B). Arrows in (B) specify the values obtained when filters were hybridized with 3′-labeled RNA. The transcript stability values shown in (C) are calculated by dividing the average steady state value by the average run-on value. The histogram columns are grouped into the gene families of complex I, complex II, complex III, complex IV, complex V, cytochrome c biogenesis, ribosomal proteins and rRNA genes. Another category includes novel orfs and unclassified genes.
The run-on values are found to be highly variable between different genes in Arabidopsis mitochondria, ranging from 10.3% for atp9 to 0.15% for orf240a. Some genes thus seem to be more strongly transcribed than others (Figure 2A). For example, transcription of atp9 is 4.1 times more active than the average rate of transcription derived from all the mRNAs investigated, rpl5 2.6 times, orf25 1.9 times and nad6 1.4 times, respectively. rRNA run-on values in Arabidopsis mitochondria were not found to be above the average mRNA level, contrary to maize mitochondria, where both run-on values and steady state levels of rRNAs were found to be 5- to 10-fold higher than the mRNAs (Finnegan and Brown, 1990; Figure 2A).
Co-transcription of closely spaced genes
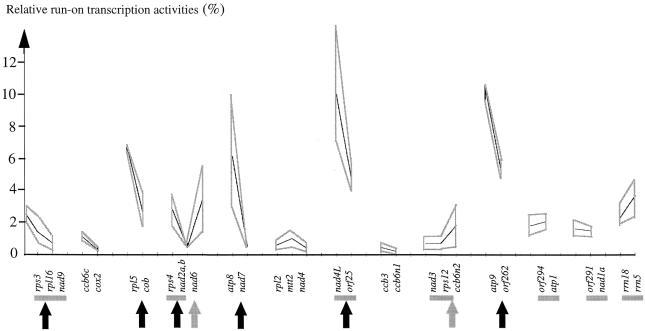
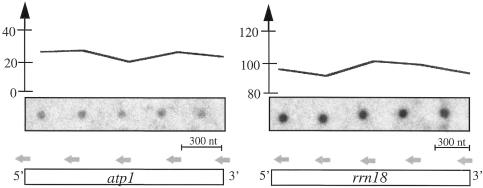
The close spatial arrangement of several genes on the same DNA strand raises the possibility that genes could be co-transcribed (Unseld et al., 1997). Co-transcription has been confirmed for several genes found on the same cDNA clones (horizontal gray bars in Figure 4). In general, co-transcription should be reflected by similar run-on values provided that transcription proceeds linearly with a constant rate of nucleotide addition. To investigate the processivity of transcription, run-on values through a gene sequence were investigated by hybridizing run-on transcripts to oligonucleotides spaced every 200 nucleotides along the arbitrarily selected atp1 and rrn18 RNAs (Figure 3). The stable run-on values reflect the constant rate of transcription.
Fig. 4. Variation of transcription activity (expressed for each gene as a percentage of the total run-on activity) among closely spaced genes in Arabidopsis mitochondria. The genes or exons are listed in 5′ to 3′ for each genomic region. Horizontal gray bars designate genes that have been found to be co-transcribed in previous cDNA analyses (Brandt et al., 1992; Lippok et al., 1996; Giegé and Brennicke, 1999). Gray lines delimit the highest and lowest values calculated for the respective genes. Decreases from one gene to another within a given genomic region are indicated by vertical black arrows, an increase by a gray arrow.
Fig. 3. Distribution of run-on values along a given gene sequence. Oligonucleotides complementary to the atp1 and rrn18 transcripts (horizontal gray arrows) were spotted on nylon filters and hybridized with mitochondrial run-on transcripts (central part of the figure) obtained by incorporating [α-32P]UTP. The intensity of the signals was quantified and its variation from 5′ to 3′ is indicated in the upper part of the figure.
For closely spaced genes similar values of run-on activities were found for rrn5 (3.7% of the total run-on transcripts) and rrn18 (2.3%), or for nad3 (0.7%) and rps12 (0.7%). Other genes predicted to be co-transcribed by their proximity, however, show very different run-on values, such as the rps3 (2.8%), rpl16 (1.4%) and nad9 (0.7%) genes or the rpl5 (6.6%) and cob (2.7%) genes (Figure 4). Such a decrease of run-on values from 5′ to 3′ in gene clusters may be due to the presence of leaky transcription stops, or could alternatively be explained by fast processing/degradation events in the primary transcripts, while large increases between two genes may indicate additional transcription starts (Figure 4).
Steady state transcript levels in Arabidopsis mitochondria
Steady state RNA levels in Arabidopsis mitochondria were investigated with total mitochondrial RNA, end-labeled to compare signal intensities independently of transcript lengths (Figure 1B). The hybridization experiments were performed repeatedly with RNAs isolated from different preparations, labeled in 5′ with [γ-32P]ATP and alternatively in 3′ with [γ-32P]pCp (Figure 2B). The slight differences observed between 5′ and 3′ labeling experiments may be partly due to the structures that RNAs adopt at their termini, notably the double inverted repeat structures often observed at 3′ mRNA ends in plant mitochondria, which may disfavor efficient labeling (Bellaoui et al., 1997; Dombrowski et al., 1997). The limited divergence between 5′ and 3′ labeling experiments shows this to be a minor influence (Figure 2B).
The steady state transcript levels vary in Arabidopsis mitochondria and as in other genetic systems, the rRNAs contribute the bulk of the steady state transcripts (Figure 2B). Considering their relatively low rates of transcription, the high rRNA levels must (contrary to maize) in Arabidopsis mitochondria be mostly due to their high stability, i.e. their slow degradation. It must be noted that the steady state levels of the rRNAs may be underestimated since most of the 5 µg of mitochondrial RNA used in these hybridizations will be rRNA molecules. This large number of molecules may distort quantification through saturation if the number of target molecules on the filters was not in excess even at the highest concentration.
The second largest contribution is made by the nine complex I and four complex V transcripts, which contribute 10.5 and 10.8% of the total RNA, respectively. The transcripts of the three complex IV subunits account for 2.5% of the investigated total mitochondrial RNAs, the cytochrome c biogenesis genes represent 2.9% with five transcript species and the transcripts for ribosomal proteins sum up to 5.6% of the total mitochondrial RNA. The mRNAs for the individual subunits are, however, not present at equivalent levels. Some complex I transcripts are greatly under-represented, such as the nad3 mRNAs, which constitute only 0.06% of the steady state transcripts, whereas the nad7 mRNAs contribute 2.4%.
The relative representation of some transcripts reflects the stoichiometry of the respective subunits, at least for complex V. In the F0 part of the complex, ATP6, 8 and 9 have a relative stoichiometry of 1:2:6/12 in mitochondria (Nagley, 1988), which correlates well with the steady state transcript values of 0.60:1.26:6.57. Similarly, with the 1:1 stoichiometry of the F0 and F1 parts of complex V, ATP1 has a stoichiometry of 3:1 to the other subunits of the F1-ATPase and thus also to ATP6 of the F0-ATPase (Glaser and Norling, 1991), which correlates with the respective steady state mRNA ratios observed in Arabidopsis mitochondria (2.41:0.60). For the other protein complexes the relative RNA quantities differ somewhat more from the final relative protein abundances, e.g. complex IV and the ribosome, each of which should contain the mitochondrially encoded subunits in a 1:1 ratio as extrapolated from their homologs in bacteria (Nomura et al., 1984; Iwata et al., 1995).
Estimations of relative transcript stabilities
The steady state amount of a given transcript depends largely on two parameters: the strength of the transcriptional activity and the stability of the RNA. The relative steady state levels and transcriptional intensities permit predictions of relative individual transcript stabilities (Figure 2C). The calculated stability values range from 0.08 for nad3 mRNAs to 8.6 for 18S rRNAs, the rRNAs showing the highest stability (which may still be underestimated as mentioned in the previous paragraph). Other transcripts like those for nad4 and nad7 show a comparatively high stability, which, however, may be over-balanced because of their particularly low run-on value. The large size of their RNAs may make these molecules more susceptible to experimental variations (Unseld et al., 1997). Beyond the secondary and tertiary structures of transcripts influencing physical stability, the respective stability values should reflect the different transcript degradation processes. Degradation such as that triggered by polyadenylation (Gagliardi and Leaver, 1999; Lupold et al., 1999) may not affect all transcripts to the same extent and may thus contribute to adjusting the varying steady state levels in Arabidopsis mitochondria.
RNA steady state levels vary less than transcriptional activities in Arabidopsis mitochondria
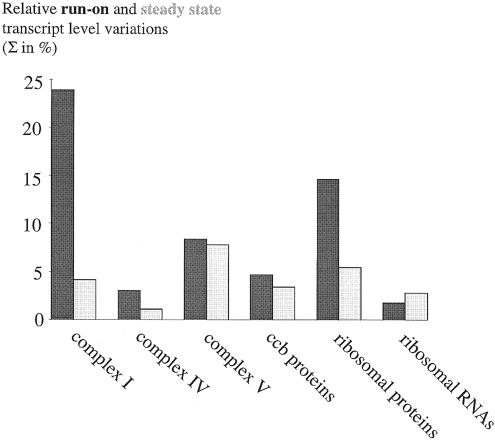
We next compared the variations of the respective transcriptional activities (Figure 2A) and of the steady state RNA levels (Figure 2B) between genes coding for different subunits of a protein complex (Figure 5). Variations in transcription are found to be systematically higher than the steady state RNA level variations. This is particularly apparent in the complex I and ribosomal protein transcript families. Thus, post-transcriptional regulation such as RNA degradation mechanisms appear to compensate at least partially the variations in transcriptional activities. With the relative steady state levels of transcripts within a complex–subunit group consistently seen to be much closer to the relative abundances of the final protein subunits (e.g. complexes I and IV and the ribosome; Figure 5), and the complex V mRNAs even reflecting the relative stoichiometries of the protein subunits, post-transcriptional processes gain a new significance as major factors in the regulation of gene expression in plant mitochondria. It seems that much of this regulation takes place after transcription, and that a major part is contributed by the various post-transcriptional mechanisms responsible for transcript turn-over, such as RNA degradation.
Fig. 5. Variations of the transcriptional activities within several gene families (dark bars) are compared with the variations of transcript steady state levels (light bars). In all the protein gene families, variations between the steady state RNA levels have been dampened in comparison with the primary transcription activities, i.e. have become more similar for a given protein complex. This comparison reveals the impact of post-transcriptional processes in the regulation of gene expression.
METHODS
Preparation of Arabidopsis mitochondria. For an average experiment, 500 g of plant material from an Arabidopsis var. C24 cell suspension culture were filtered through Miracloth and transferred to a Waring blender with 2 ml of mitochondrial extraction buffer [600 mM sucrose, 20 mM MOPS pH 7.2 and 2 mM EGTA–KOH, 2 g/l bovine serum albumin (BSA) and 6 g/l polyvinylpyrrolidone; the latter was added to the solution just before use] per gram of cells. Cells were disrupted with three bursts of 5 s at full speed. This suspension was centrifuged for 10 min at 3400 r.p.m. in a JA10 rotor (Beckman) and the supernatant was recentrifuged for 10 min at 5800 r.p.m. in the same rotor. Mitochondria were harvested from the second supernatant by centrifugation for 10 min at 9000 r.p.m. (in the JA10 rotor) and the pellet obtained was resuspended in 20 ml of wash buffer (300 mM sucrose, 10 mM MOPS pH 7.2 and 1 mM EGTA–KOH). The suspension was then layered onto discontinuous gradients of 20, 35, 47 and 60% sucrose in wash buffer. Gradients were centrifuged for 90 min at 25 000 r.p.m. in an SW28 rotor (Beckman). Mitochondria were collected from the interphases between 35/47% and 47/60% sucrose. The mitochondrial solution was washed, resuspended in wash buffer and stored at –80°C.
Isolation of mitochondrial RNA. Mitochondria were lysed in 3 vols of lysis buffer [250 mM Tris–HCl pH 7.5, 75 mM EDTA and 10% (w/v) sodium sarkosyl] and proteins were removed from this solution by repeated phenol/chloroform extractions. RNA was precipitated from the aqueous phase overnight at 4°C with 1 vol. of 4 M LiCl and subsequently centrifuged at 4°C for 45 min at 10 000 r.p.m. in a JA20 rotor (Beckman). The mRNA pellet was resuspended with 1 ml of diethyl pyrocarbonate (DEPC)-treated H2O and 1 vol. of 4 M LiCl was added. RNAs were allowed to precipitate for 4–6 h at 4°C. After centrifugation at 4°C for 30 min at 13 000 r.p.m., the pellet was washed with 100% EtOH, resuspended in DEPC H2O and stored at –80°C.
5′ and 3′ labeling of steady state transcripts. Transcripts (5 µg) were labeled at their 5′ ends with T4 polynucleotide kinase (PNK). The reaction was performed for 30 min at 37°C in a volume of 20 µl in exchange reaction buffer [50 mM imidazole–HCl pH 6.4, 18 mM MgCl2, 5 mM dithiothreitol (DTT), 0.1 mM spermidine, 0.1 mM EDTA and 0.1 mM ADP]. RNAs were labeled with 50 µCi of [γ-32P]ATP, the reaction was stopped by adding 1 µl of 0.5 M EDTA pH 8.0, and the labeled RNAs were extracted with phenol/chloroform.
RNA was labeled at the 3′-terminus with T4 RNA ligase. The reaction was performed overnight at 4°C in a volume of 50 µl with buffer (50 mM HEPES pH 7.5, 15 mM MgCl2, 10% dimethyl sulfoxide), 0.02 mM ATP, 1 µg of BSA, 2 mM DTT, 50 µCi of [γ-32P]pCp and 2.5 U T4 RNA ligase. Labeled RNAs were extracted with phenol/chloroform.
Run-on transcription. Intact mitochondria (the equivalent of 100 µg of mitochondrial protein) were added to a reaction mix containing 60 µl of R buffer (17 mM MgCl2, 66 mM KCl, 23 mM HEPES pH 7.9), 10 µl of 10× nucleotide mix (0.3 mM UTP or GTP, 5 mM ATP, CTP and GTP or UTP each) and 100 µCi of [α-32P]UTP or [α-32P]GTP. The reaction mix was gently pipetted up and down six times to disrupt mitochondria. The solution was incubated for 8 min at 25°C and the reaction stopped by adding 10 µl of lysis buffer (50 mg/ml N-laurylsarcosine, 50 mM Tris–HCl pH 8.0, 25 mM EDTA pH 8.0). Run-on transcripts were extracted at least twice with phenol/chloroform/isoamyl alcohol (25:25:1).
Nylon filter preparation. DNA samples, i.e. PCR products, with an average size of 537 nucleotides, covering gene or exon sequences of the identified genes in Arabidopsis mitochondria as well as several novel open reading frames (given in Figure 1) were spotted manually on Hybond N+ nylon filters (Amersham) and crosslinked. Each sample was spotted at five different dilutions (Figure 1), i.e. 500, 150, 50, 15 and 5 ng of DNA per 5 µl spot. The sequence and position of the primers used to amplify the PCR products are available upon request to the authors.
Quantification. After hybridizing the filters prepared as described above, the autoradiogram signals were quantified with a bio-imager using a video densitometric system. Individual signal intensities were put in relation to the total added signals obtained in a given experiment. Each experiment was repeated four times with independently labeled RNA obtained from two separate preparations of mitochondria. The four experiments were averaged and standard deviations were calculated as given in Figure 2.
Acknowledgments
ACKNOWLEDGEMENTS
We are grateful for the very constructive comments and suggestions of the anonymous reviewers. This work was supported by a grant from the Bundesministerium für Bildung, Wissenschaft und Technologie and by the Fonds der chemischen Industrie.
REFERENCES
- Bellaoui M., Pelletier, G. and Budar, F. (1997) The steady-state level of mRNA from Ogura cytoplasmic male sterility locus in Brassica cybrids is determined post-transcriptionally by its 3′ region. EMBO J., 16, 5057–5068. [DOI] [PMC free article] [PubMed] [Google Scholar]
- Brandt P., Sünkel, S., Unseld, M., Brennicke, A. and Knoop, V. (1992) The nad4L gene is encoded between exon c of nad5 and orf25 in the Arabidopsis mitochondrial genome. Mol. Gen. Genet., 236, 33–38. [DOI] [PubMed] [Google Scholar]
- Dombrowski S., Brennicke, A. and Binder, S. (1997) 3′-inverted repeats in plant mitochondrial mRNAs are processing signals rather than transcription terminators. EMBO J., 16, 5069–5076. [DOI] [PMC free article] [PubMed] [Google Scholar]
- Finnegan P.M. and Brown, G.G. (1990) Transcriptional and post-transcriptional regulation of RNA levels in maize mitochondria. Plant Cell, 2, 71–83. [DOI] [PMC free article] [PubMed] [Google Scholar]
- Gagliardi D. and Leaver, C. (1999) Polyadenylation accelerates the degradation of the mitochondrial mRNA associated with cytoplasmic male sterility in sunflower. EMBO J., 18, 3757–3766. [DOI] [PMC free article] [PubMed] [Google Scholar]
- Giegé P. and Brennicke, A. (1999) RNA editing in Arabidopsis mitochondria effects 441 C to U changes in open reading frames. Proc. Natl Acad. Sci. USA, 96, 15324–15329. [DOI] [PMC free article] [PubMed] [Google Scholar]
- Giegé P., Knoop, V. and Brennicke, A. (1998a) Complex II subunit 4 (sdh4) homologous sequences in plant mitochondrial genomes. Curr. Genet., 34, 313–317. [DOI] [PubMed] [Google Scholar]
- Giegé P., Konthur, Z., Walter, G. and Brennicke, A. (1998b) An ordered Arabidopsis thaliana mitochondrial cDNA library on high-density filters allows rapid systematic analysis of plant gene expression: a pilot study. Plant J., 15, 721–726. [DOI] [PubMed] [Google Scholar]
- Glaser E. and Norling, B. (1991) Chloroplast and plant mitochondrial ATP synthases. Curr. Top. Bioenerg., 16, 223–263. [Google Scholar]
- Iwata S., Ostermeier, C., Ludwig, B. and Michel, H. (1995) Structure at 2.8 Å resolution of cytochrome c oxidase from Paracoccus denitrificans.Nature, 376, 660–669. [DOI] [PubMed] [Google Scholar]
- Lippok B., Brennicke, A. and Unseld, M. (1996) The rps4-gene is encoded upstream of the nad2-gene in Arabidopsis mitochondria. Biol. Chem. Hoppe Seyler, 377, 251–257. [DOI] [PubMed] [Google Scholar]
- Lupold D.S., Caoile, A.G. and Stern, D.B. (1999) Polyadenylation occurs at multiple sites in maize mitochondrial cox2 mRNA and is independent of editing status. Plant Cell, 11, 1565–1578. [DOI] [PMC free article] [PubMed] [Google Scholar]
- Marienfeld J., Unseld, M., Brandt, P. and Brennicke, A. (1997) Mosaic open reading frames in the Arabidopsis thaliana mitochondrial genome. Biol. Chem., 378, 859–862. [DOI] [PubMed] [Google Scholar]
- Nagley P. (1988) Eukaryote membrane genetics: the F0 sector of mitochondrial ATP synthase. Trends Genet., 4, 46–51. [DOI] [PubMed] [Google Scholar]
- Nomura M., Gourse, R. and Baugham, G. (1984) Regulation of the synthesis of ribosomes and ribosomal components. Annu. Rev. Biochem., 53, 75–117. [DOI] [PubMed] [Google Scholar]
- Unseld M., Marienfeld, J.R., Brandt, P. and Brennicke, A. (1997) The mitochondrial genome of Arabidopsis thaliana contains 57 genes in 366,924 nucleotides. Nature Genet., 15, 57–61. [DOI] [PubMed] [Google Scholar]


