

Abstract
Electrochemical methods offer unique advantages for chemical synthesis, as the reaction selectivity may be controlled by tuning the applied potential or current. Similarly, measuring the current or potential during the reaction can provide valuable mechanistic insights into these reactions. The aim of this Tutorial Review is to explain the use of cyclic voltammetry and chronoamperometry to interrogate reaction mechanisms, optimize electrochemical reactions, or design new reactions. Fundamental principles of cyclic voltammetry and chronoamperometry experiments are presented together with the application of these techniques to probe (electro)chemical reactions. Several diagnostic criteria are noted for the use of cyclic voltammetry and chronoamperometry to analyze coupled electrochemical-chemical (EC) reactions, and a series of individual mechanistic studies are presented. Steady state voltammetric and amperometric measurements, using microelectrodes (ME) or rotating disk electrodes (RDE) provide a means to analyze concentrations of redox active species in bulk solution and offer a versatile strategy to conduct kinetic analysis or determine the species present during (electro)synthetic chemical reactions.
Graphical Abstract

This Tutorial Review explains the use of cyclic voltammetry and chronoamperometry to interrogate reaction mechanisms, optimize electrochemical reactions, or design new reactions.
Introduction
The fields of organic and organometallic electrochemistry consist of two major domains: (1) preparative electrosynthesis and (2) electroanalytical and mechanistic studies. From a synthetic perspective, electrochemistry offers one of the most controlled and environmentally benign approaches to conduct electron-transfer reactions. From a mechanistic perspective, the electrochemical potential and current are controlled and/or monitored precisely, thereby enabling exquisite insights to be gained into (electro)chemical reactions.1 Several electroanalytical techniques have been developed,2 and many of them have been used to study the mechanisms of redox reactions, probe redox active species3,4 and, more broadly, to gain insights into “molecular electrochemistry”.5,6 Few organic chemists are trained in electroanalytical chemistry while many may be unfamiliar with these tools and the information they can provide. The goal of this tutorial is to present some of the fundamental principles underlying electroanalytical techniques, with an orientation toward synthetic organic chemistry. Cyclic voltammetry and chronoamperometry are two widely used electrochemical techniques.7–9 These techniques will be introduced below, after which specific case studies will be presented to show how these techniques have been used to gain mechanistic insights into organic and organometallic redox reactions and/or to optimize (electro)synthetic reactions.
Cyclic Voltammetry
A cyclic voltammetry experiment is performed by scanning the potential of a working electrode linearly, relative to a reference electrode, in both forward and backward directions (Fig. 1a) while measuring the current. If the solution contains the reduced form (Red) of a redox couple (Eq. 1), the working electrode potential is scanned from an initial potential, Ei, past the formal redox potential of the molecule, E°',10 resulting in
| Eq. 1 |
oxidation of Red to Ox.11 At the switching potential, Es, the positive or anodic potential scan is reversed and scanned back from Es to the final potential, Ef, which is typically set to the same value as Ei. This negative or cathodic potential scan results in reduction of Ox back to Red. The potential waveforms for two cyclic voltammetry experiments, conducted at different scan rates, are shown in Fig. 1a. The current resulting from the electrode potential scans is then plotted as a function of potential, and the resulting trace is called a cyclic voltammogram (Fig. 1b). As the axes show, each cyclic voltammogram (CV; note: “CV” is often used as an abbreviation for both cyclic voltammetry and cyclic voltammogram) has two major parameters: potential and current. Two characteristic CV potentials are the anodic and cathodic peak potentials, and they typically have different values. The average or midpoint of the two peak potentials, often termed E1/2 or Emp, coincides with the formal potential E°' for well-behaved redox couples.12–15
Fig. 1.

(a) Wave form showing the time-dependent applied potentials during a cyclic voltammetry (CV) experiment with an electroactive compound that has an E°' value of 0.5 V. (b) The cyclic voltammograms obtained from the experiment defined in (a). (c) The normalized cyclic voltammograms that account for scan-rate dependence of the current response in a CV experiment. The CV data recorded at 25 (blue) and 100 (red) mV s–1 directly overlay in these plots.
The other characteristic of a CV is the current, especially the peak current. The cyclic voltammetry experiment is carried out in an unstirred, quiescent solution that eliminates convection, and diffusion is the primary contributor to mass transfer. The area near the electrode surface that is altered by electron transfer and diffusion is called the diffusion layer. The current depends on the dimensions of the diffusion layer, and it changes with the time scale or scan rate of the cyclic voltammetry experiment. In addition, the current decays after reaching a peak value to a steady-state value, resulting in the characteristic “duck” shape. This current response arises because redox active species are depleted from the diffusion layer, and the steady-state current is defined by diffusion from the bulk solution into the diffusion layer.16 A comparison of the current response obtained at two different scan rates is shown in Fig. 1b. The CV peak current (Ip) is a function of the number of electrons transferred to/from the electrode (n), the electrode surface area (A in cm2), and the concentration (C in mol mL–1) and diffusion coefficient (D in cm2 s–1) of the redox-active species. It also depends on the scan rate of the voltammetric experiment (𝑣 is V s–1), as described by the Randles-Ševčík equation (at 25 °C).9,17
| Eq. 2 |
For a set of CV experiments in which all the parameters except 𝑣 remain constant, the CV current will be directly proportional to the square root of the scan rate. It can be useful to normalize CVs by dividing the CV current by the square root of the scan rate. Normalized CVs, obtained at different scan rates, can be overlaid to enable comparison. The normalized CV in Fig. 1c directly overlay, but some of the case studies presented below will show how this normalized CV comparison can provide valuable mechanistic information.
Chronoamperometry
To perform a chronoamperometry experiment, the potential of a working electrode is stepped from a potential (E1),18 at which no electron-transfer reaction occurs, to a potential (E2) beyond the E°' of the redox species, at which the rate of electron transfer is not the limiting factor for the electrode reaction.19 Fig. 2a shows the potential step applied to a solution containing Red (cf. redox couple in Eq. 1). The potential step results in an oxidation reaction, and since E2 is significantly more positive than E°' the concentration of Red goes nearly to zero at the electrode surface. Thus, the current is controlled (limited) by diffusion and gradually decreases over time. The resulting chronoamperogram (CA) is shown in Fig. 2a and is described by the Cottrell equation:
| Eq. 3 |
Fig. 2.

(a) Time-dependent applied potential of a chronoamperometry experiment, (b) resulted chronoamperograms, and (c) chronocoulogram for oxidation of a redox-active compound with standard potential (E°') of 0.5 V. (d) Time-dependent applied potential for a double step chronoamperometry and (e) resulted chronoamperograms for oxidation and reduction of a redox-active compound with standard potential (E°') of 0.5 V.
In this expression, It is the current, n is the number of electrons transferred, A is the area of the electrode, D and C are the diffusion coefficient and the initial concentration of Red, respectively, and t is time.16 At a sufficiently high overpotential (i.e., ≥120 mV beyond E°' for a 1 e– reaction), where the potential is not a limiting factor, the current is limited by the flux or concentration of the redox-active species. Under these limiting conditions, deriving the concentration profiles and quantitative information about the reaction and reactivity of the redox-active species is straightforward.4 Charge integration of the chronoamperometry current trace, called a chronocoulogram (Fig. 2c), gives the number of molecules that undergo electrode reaction within the diffusion layer. Both charge and current can be used for these quantitative reaction analyses. Similar to the cyclic voltammetry experiment, the first potential step (forward step) may be followed immediately by a backward step to perform the opposite electrode reaction. Fig. 2d shows a double potential step experiment and its resulting CA currents. The backward potential step (E3) needs to be beyond the E°' on the opposite side relative to E2 to drive the back electron-transfer step. For example, if the solution includes Red, E2 needs to be at least 120 mV above E°' and E3 at least 120 mV below E°', corresponding to a >240 mV potential step from E2 to E3.20
Cyclic Voltammetry Study of Correlation Between Thermodynamic Parameters and Redox Potential
Redox potentials acquired by cyclic voltammetry are readily accessible and represent valuable thermodynamic parameters that provide insights into the properties of organic molecules, organometallic complexes, or electrochemical mediators and electrocatalysts. These provide useful insights relevant to understanding reaction mechanisms, optimizing electrochemical reactions, or designing new reactions. The correlation between redox potential and thermodynamic parameters is summarized in Box 1.

In 2000, Matyjaszewski and Amatore studied the relationship between the redox potential of CuI complexes and their behavior as co-initiators in atom transfer radical addition (ATRA) and polymerization (ATRP) reactions.21 Because initiation of these reactions involves the abstraction of a halide from the initiator (R-X) by the metal complex, they sought to understand the correlation between the reaction kinetics, which are influenced by the abstraction equilibrium, and the redox potential of the complex (Fig. 3a). Eight ligands with two copper salts (CuCl and CuBr) were studied. Many complexes exhibited sluggish outer-sphere electron transfer rates, evident from the non-Nernstian7,22 separation between the anodic and cathodic peaks (Fig. 3b). Nonetheless, approximated redox potentials (E1/2) were correlated with the apparent rate of the polymerization reaction (Fig. 3c). Five of the copper bromide complexes showed good correlation between the Keqapp and the approximated redox potential, suggesting that there was a correlation between more reducing CuI complexes (or less oxidizing CuII complexes) and more rapid reaction.
Fig. 3.
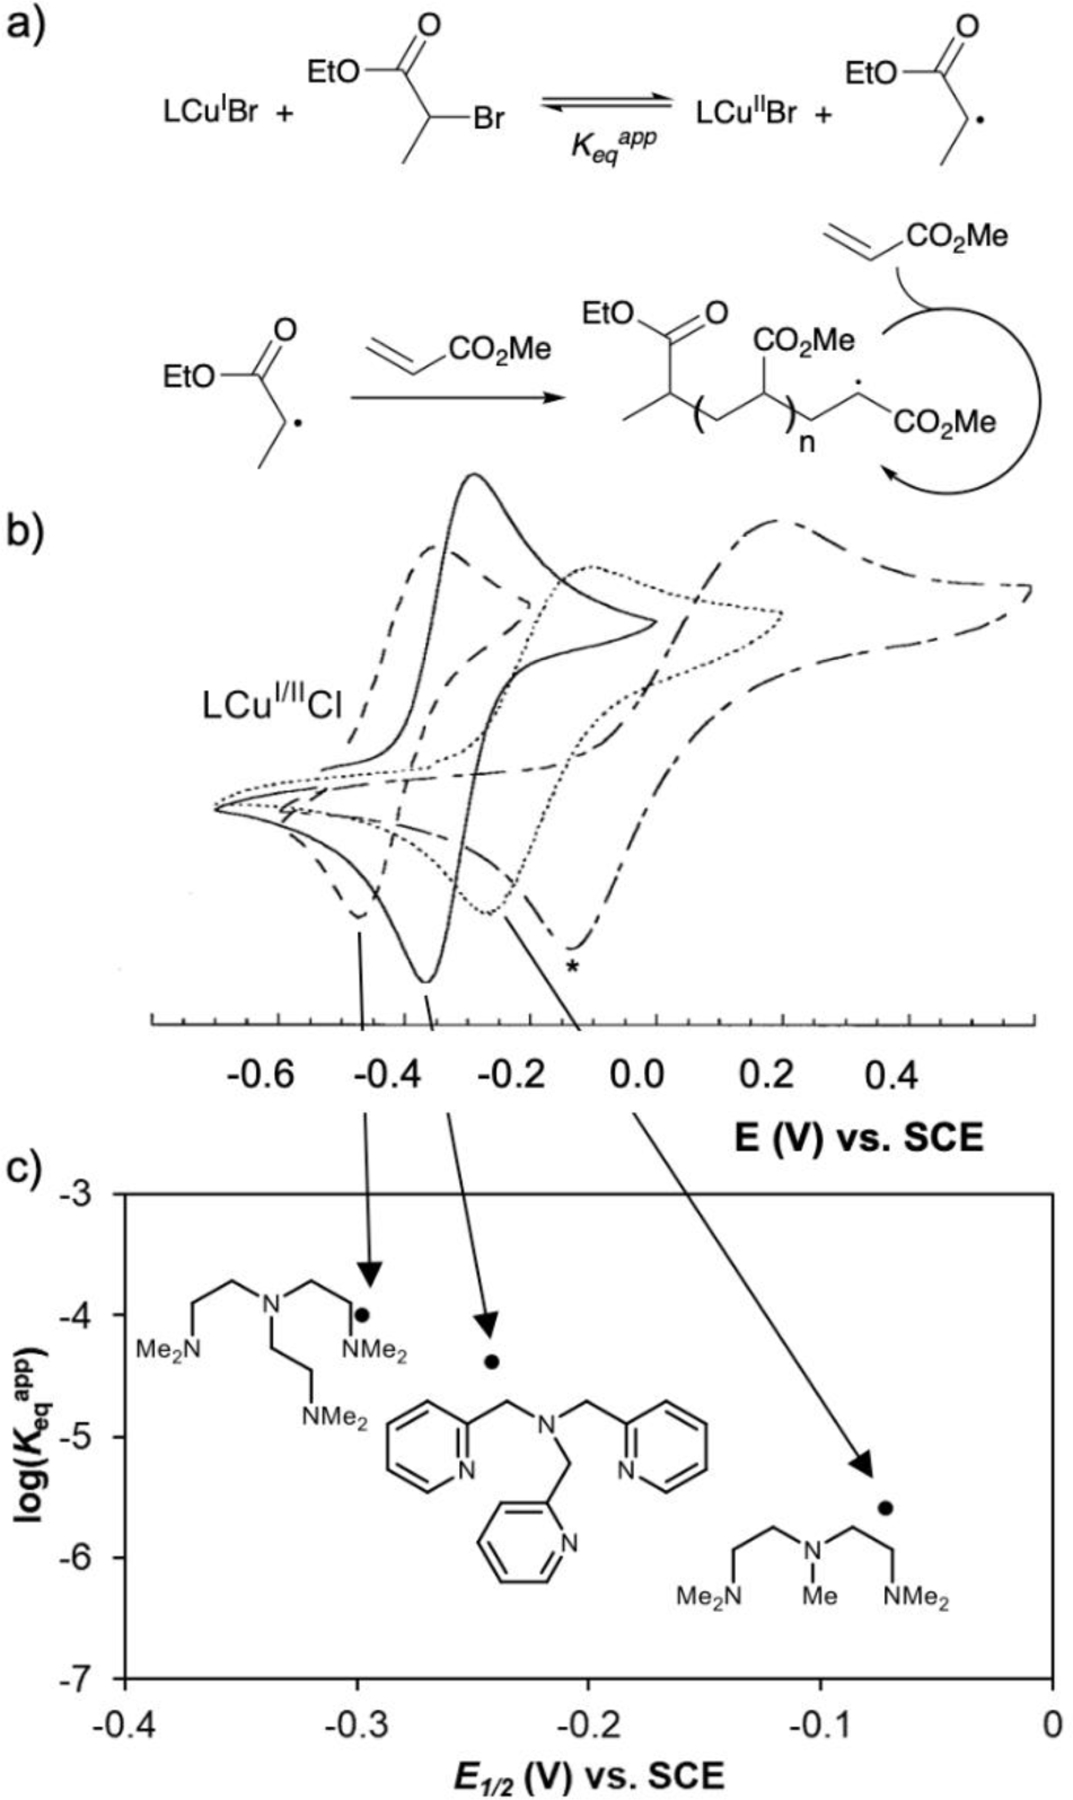
(a) General scheme of atom transfer radical polymerization reactions. (b) Cyclic voltammograms of four ligands with copper chloride (1:1 except in the case of bipyridine*) at 10 mM in acetonitrile (100 mM NBu4PF6). (c) Correlation between the halide abstraction equilibrium constant (derived from ATRP kinetic data) and the redox potential of the associated copper bromide/ligand catalyst complex. Reproduced from ref. 21 with permission from John Wiley and Sons, copyright 2000.
In 2002, Yoshida and Yamago demonstrated electrochemical glycosylation using chalcogenoglycosides as the glycosyl-transfer agent (Fig. 4a).23 Linear sweep voltammetry (LSV) was used to measure the peak potential of the irreversible, one-electron oxidation of various pyranose sugars bearing aryl sulfur, selenium, or tellurium acetals at the anomeric carbon and different protecting groups and aryl substituents. The oxidation (decomposition) potential of these molecules showed a clear trend with the ionization potential (IP) of the chalcogen atoms in the order of Te < Se < S (Fig. 4b), indicating that the molecular orbital contributing to the one-electron oxidation was localized on the chalcogen atom. These clearly distinguishable oxidation potentials were used to demonstrate selective activation of one chalcogenoglycoside (2) toward oxidation-induced glycosyl transfer over another (1). Under constant-potential electrolysis in divided or undivided cells, selective activation and glycosyl-transfer occurred from the most easily oxidized telluro- or selenoglycoside.
Fig. 4.

(a) Reaction scheme and mechanism of electrochemical glycosylation. (b) Correlation between observed irreversible oxidation potential of various chalcogenoglycosides and the ionization potential of the associated chalcogen atom. Reproduced from ref. 23 with permission from American Chemical Society, copyright 2002.
In 2013, Little and coworkers studied a suite of triarylimidazoles (3a-e, Fig. 5), to assess the relationship between substituent effects and the potential of the electrochemical mediator.24 Little had previously shown that these compounds, which have CVs that feature one quasi-reversible oxidation and two irreversible oxidations, function as efficient oxidative mediators and are able to affect the mediated electrochemical oxidation of alcohols or ethers. The first oxidation potentials of these mediators spanned more than 700 mV, and the values correlated with either the sum of the two Hammett (σ+) parameters of the substituents (Fig. 5) or the calculated ionization potential. In 2018, Muñiz and coworkers demonstrated the electrochemical oxidative C-H amination of acyclic amines (4) to form saturated nitrogen heterocycles (Fig. 6).25
Fig. 5.

Correlation between the first oxidation potential of triarylimidazoles and the sum of the Hammett parameters of the para-substituents. Reproduced from ref. 24 with permission from American Chemical Society, copyright 2013.
Fig. 6.

(a) Cyclic voltammetry showing that direct oxidation of the aryl tosylamide substrate correlates with oxidation of an aromatic analogue and not an analogous tosylamide. (b) The mechanism of cyclization, relying on 2e–, 1H+ oxidation of the benzylic C-H bond. Reproduced from ref. 25 with permission from the Royal Society of Chemistry, copyright 2018.
Cyclic voltammetry was used to probe the onset potential for oxidation of a model substrate (5) and two other compounds, one lacking the amine functionality (6), and one with a saturated carbocycle in place of the aromatic ring (7).
The data showed that the current onset of the substrate aligns well with the simple aromatic compound, while oxidation of the saturated amine occurs at >200 mV more positive potentials (Fig. 6a). This analysis indicated that the mechanism of the reaction is initiated by oxidation of the aromatic ring, followed by proton loss to give a benzylic radical, which could undergo further oxidation to a benzylic cation (Fig. 6b). Trapping of this cation forms the products. This mechanism aligns with observation of modest diastereoinduction by proximal stereocenters.
In 2015, Sigman and Minteer used DFT calculations and multiparameter kinetic analysis to study the reactivity of oxoammonium electrocatalysts.26 They used glycerol oxidation as a model reaction and measured the redox potentials of nitroxyl electrocatalysts (Fig. 7, Ea1, Ea2) and the peak anodic and cathodic CV currents at the nitroxyl/oxoammonium potential in the presence and absence of glycerol (Ipa, Ipc). The ratio Ipa/Ipc correlates with the catalytic turnover rate of the different oxoammonium species. Both redox potentials, the oxidation of the nitroxyl to the oxoammonium (Ea1) and the pH-dependent reoxidation of the fully reduced hydroxylamine (Ea2), contributed to the best multiparameter fit.
Fig. 7.

Correlation between redox potential and structural features in oxoammonium electrocatalysts and the classifications of oxoammonium mediators based on their catalytic activity and redox potential. Reproduced from ref. 26 with permission from American Chemical Society, copyright 2015.
DFT calculations were used to calculate the redox potentials of diverse nitroxyl species, and these values were correlated with other computed features, such as the N=O and N-O• bond stretching frequencies. Structural features that stabilize one or the other of these functional groups, such as stereoelectronic effects, contribute to the stretching frequencies (which could be measured and/or computed) and were then correlated with the thermodynamic redox potential. Finally, these data were used to classify different types of nitroxyl compounds into their potential applications: electrochemical or synthetic catalysts, spectroscopic standards, and antioxidants (Fig. 7).
In 2018, Stahl and coworkers described a mediated Shono-type oxidation using bicyclic nitroxyl mediators.27 The Shono oxidation, which traditionally proceeds through direct oxidation of amines at the nitrogen atom (via an ECE mechanism, see below) to imines and ultimately amides, demonstrated poor site selectivity on a substrate bearing a pendant electron-rich arene. They used cyclic voltammetry to show that a variety of functional groups exhibited direct oxidation at potentials lower than the amine oxidation, indicating that such functional groups would undergo reactions competitive with amine oxidation. Alternatively, bicyclic nitroxyls, upon oxidation, promote hydride abstraction to provide the Shono-type products. Because the redox potentials of nitroxyls are far below the oxidation potentials of amines, this reaction showed higher functional group tolerance. In the direct oxidation each amine bearing a reactive functional group provided poor yields of amide, but under mediated conditions, such substrates provided high yields. The breadth of tolerated functional groups was demonstrated using cyclic voltammetry of a variety of additives in a robustness screen (Fig. 8)28; each additive showed an onset potential at or below that of the model substrate, indicating competitive reactivity, but much higher than the mediator potential, indicating selective mediated reactivity. These additives were both recoverable after the mediated reaction and left the yield of amide product largely unchanged. In this way cyclic voltammetry, via the elucidation of redox potentials, provided information on the relative chemoselectivity of two separate reaction pathways and about potentially problematic functional groups.
Fig. 8.

Cyclic voltammograms of electrocatalyst, substrate, and two of the additives used for the study of the robustness and functional group tolerance. Reproduced from ref. 27 with permission from John Wiley and Sons, copyright 2018.
Study of Coupled Electrochemical-Chemical Reactions
Electrochemistry may be used to generate new species by adding electrons to, or removing them from, a molecule. The reduced or oxidized species formed in this manner often undergoes rapid chemical reaction in solution. Electroanalytical methods provide a versatile means to study coupled redox processes of this type.
Various factors contribute to the utility of electrochemical techniques for kinetic and mechanistic studies. The recorded current is proportional to concentration of the redox active species. This feature not only makes it possible to probe the concentration of redox-active species, but also redox-inactive species that interact or react with the redox-active species. The ability to perform double-step or double-scan experiments enables reactive species to be generated by stepping or scanning the potential in one direction and probing its concentration by stepping or scanning the potential in the reverse direction. The flexible time window of electroanalytical techniques allows them to be used to study reactions with a wide range of rates. Multiple simple-to-advanced electroanalytical techniques are available to study coupled electrochemical-chemical reactions; however, cyclic voltammetry and chronoamperometry are among the most frequently used. These two techniques, which are typically integrated within the software for commercial instruments, provide information about electrode reactions ranging from simple direct electron transfer to more complex coupled electrochemical-chemical reactions. Cyclic voltammetry is unique in its ability to vary the time scale by changing the potential scan rate, and chronoamperometry is very easy to perform experimentally.
Terminology has been developed to describe redox reactions that feature chemical reactions coupled to electron transfer at an electrode. “E” denotes an electron-transfer reaction, “C” denotes a chemical reaction, and these terms are ordered to reflect the sequence of reactions. For example, an EC reaction reflects a process initiated by electron transfer at the electrode, followed by a chemical reaction of the reduced or oxidized species. A related mechanism, termed EC’, is used for reactions in which an electron transferred in the E step involves a species that promotes catalytic turnover (i.e., a series of chemical steps). In such reactions, the catalyst can be regenerated at the electrode surface and undergo another electron-transfer step on the time scale of the electrochemical experiment. EC and EC’ are common mechanisms in organic electrosynthesis and will be a major focus of the discussion and analysis below.
EC Mechanisms
An EC mechanism consists of an electron-transfer reaction followed by a chemical reaction that consumes the product of electron transfer, commonly in an irreversible step (e.g., Eqs. 4 and 5).
| Eq. 4 |
| Eq. 5 |
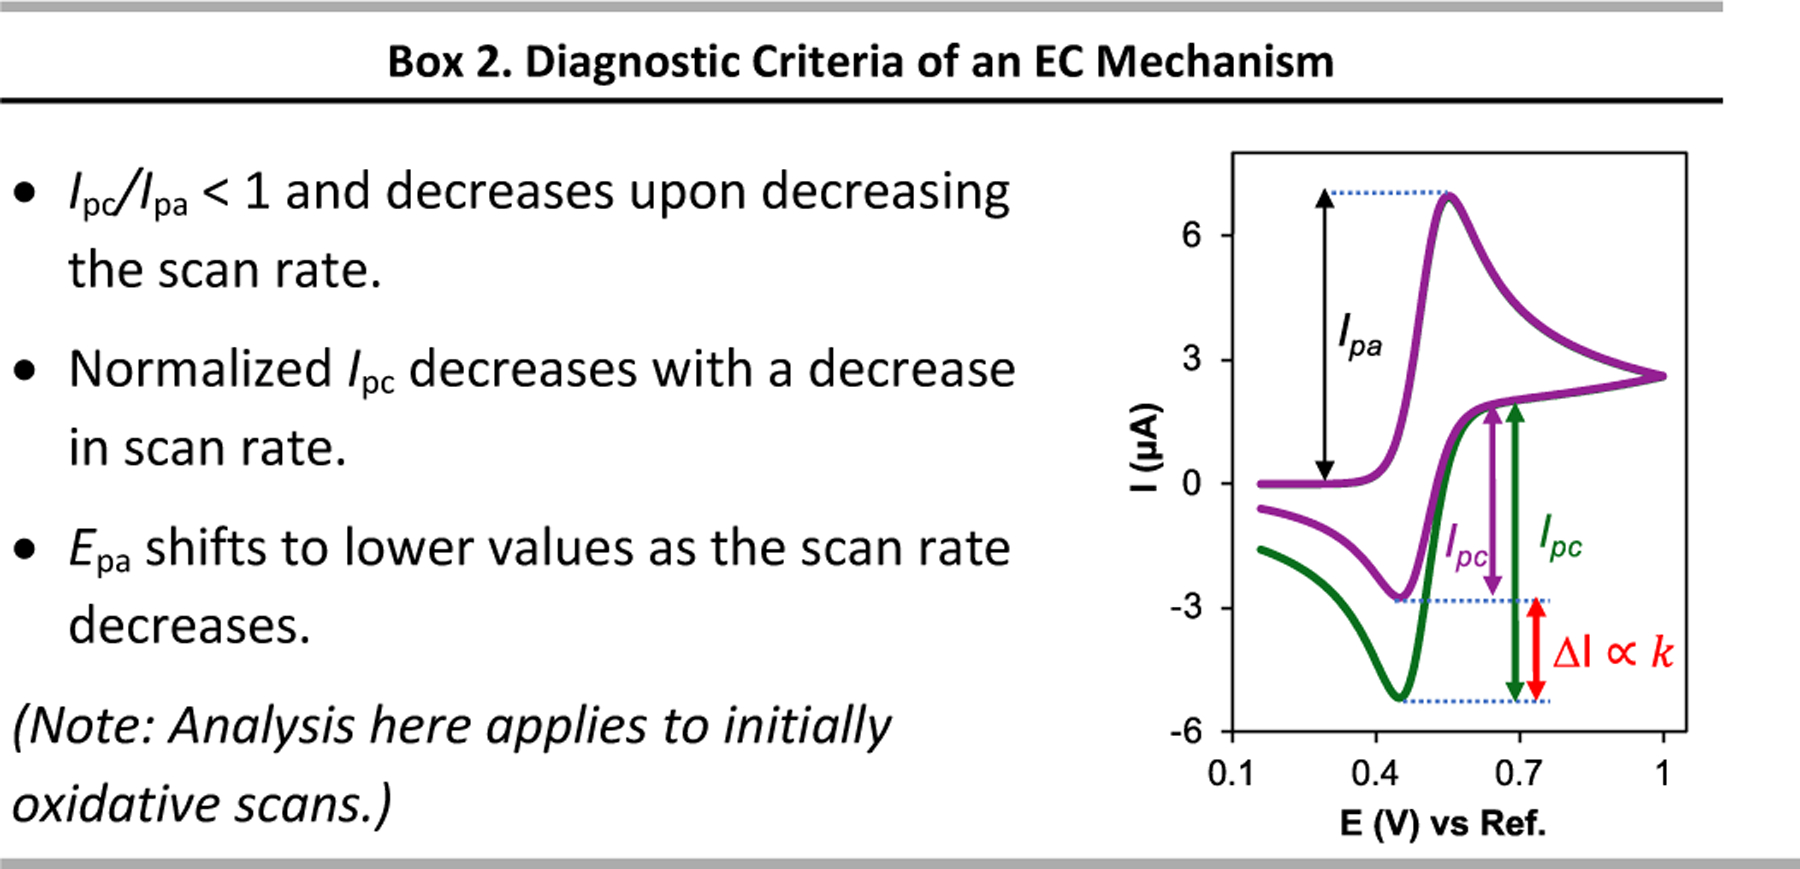
CV analysis of a reaction with an EC mechanism reveals a peak associated with electron transfer in the forward scan, resembling that observed in an electron-transfer-only (E) mechanism. The chemical reaction (C) step consumes the Ox species generated by the electrode reaction, and the backward peak current therefore has decreased current. The magnitude of this decrease depends on the rate of the C step and the time scale of cyclic voltammetry experiment (i.e., the scan rate). The ratio of the backward and forward peak current, Ipc/Ipa, will be less than unity and will decrease as the rate of the C step increases (Fig. 9a). The dimensionless parameter k𝜏, where k is the rate constant of the C step and 𝜏 is the time to scan the potential between the switching potential (Es) and E1/2, was introduced by Shain as an indicator of the extent of the reaction.29
Fig. 9.

(a) Simulated cyclic voltammograms for the oxidation of 1 mM Red with E1/2 = 0.5 V, in the absence (dotted line) and presence of a chemical reaction with k value = 0.2 M–1 s–1, scan rate 100 mV s–1. (b) Cyclic voltammograms of EC mechanism with k = 0.2 M–1 s–1 at different scan rates, (c) plot showing how the cathodic-to-anodic peak-current ratio varies as a function of k, the rate constant of the C step in the EC mechanism, and 𝜏, the time to scan the potential between the switching potential and E1/2, and (d) plot of the normalized cyclic voltammograms in panel (b).
The time scale of the cyclic voltammetry experiment, 𝜏 (defined by the scan rate and potential window of the experiment), is inversely proportional to the scan rate (𝑣). The Ipc/Ipa ratio increases with increasing 𝑣 (Fig. 9b), and plotting the Ipc/Ipa versus log(kτ) (Fig. 9c) may be used to determine the value of k from the slope in the linear region of the plot.30 A related plot based on the k/𝑣 ratio, rather than kτ, has also been used to determine the k value for an EC mechanism.29,31 Because the anodic and cathodic CV currents depend on the scan rate, it is useful to plot CVs with normalized current to show the effect of the chemical reaction more clearly (Fig. 9d). A slight potential shift in the forward peak potential may be observed. This feature reflects consumption of Ox by the chemical reaction in the C step, which promotes the Red to Ox reaction according to Le Chatelier’s principle and shifts the oxidative peak to less positive potentials (cf. Fig. 9d).
Double-step chronoamperometry experiments complement CV studies and can be used similarly to perform kinetic studies of EC reactions. In these experiments, the potential is switched (“stepped”) between two different potential values, rather than scanned continuously, as in CV experiments. For an oxidative EC reaction such as that shown in Eqs. 4 and 5, the first step is used to oxidize Red to Ox at a potential more positive than the E1/2 for Red. The current is recorded at this potential before stepping back to a more negative potential, suitable to reduce Ox to Red. The ratio of the current or charge passed in the second step relative to the first step will vary, depending on the rate of the C step in the EC sequence and the time delay between the first and second potential steps. The step 1/step 2 ratio of currents, or charge passed, may be analyzed in a manner similar to the CV data in Fig. 9 to derive the k value for the C step.32,33
Reactions with more than one E or C Steps
Redox reactions initiated by an E step may be followed by another E step, and also may include more than one subsequent step. Other common reactions, in addition to EC reactions, include EE, ECE, and ECEC mechanisms. An EE mechanism consists of two successive electron-transfer steps. ECE mechanisms arise when the second E step, which follows a chemical step, is thermodynamically more favourable than the first E step. In other words, the product of the C step undergoes rapid electron transfer because the electrode potential is set at the potential needed to initiate the first E step. When the C step in an ECE mechanism is very fast (i.e., when k/𝑣 is high), the forward CV scan or forward chronoamperometry step will have the appearance of an EE mechanism. This behavior is common for the electrochemical oxidation of many organic molecules,34–36–<sup>35,36</sup> for example, when the first electron-transfer reaction (ET) is followed by a fast proton-transfer (PT) step. Such ET-PT steps often generate radicals that are more readily oxidized than the original starting material, and another ET step forms a cationic species. The carbocation generated in this ECE (i.e., ET-PT-ET) mechanism often reacts readily in another chemical step (e.g., reaction with a nucleophile), leading to a net ECEC pathway.
The PT step of many of these reactions is very fast, resulting in the CV exhibiting an irreversible wave with a current that reflects the transfer of two electrons. An example this type of ECEC mechanism is shown in Fig. 6b for oxidation of the alkylarene substrate 5. The reaction is initiated by anodic oxidation of 5 to generate an arene radical-cation (E), followed by proton transfer (C) from the benzylic position to form a carbon-centred radical. Rapid oxidation of the radical (E) forms a carbocation that undergoes reaction with the appended sulfonamide nucleophile (C) to form the final product. Complementary reductive ECEC reactions are known. An example is the electrochemical Birch reduction of aromatic compounds.37
EC’ Mechanism
Many emerging electrosynthetic reactions employ mediators or electrocatalysts that undergo electron transfer at the electrode and then undergo chemical reaction with the substrate. (Note: although distinctions could be made, the terms “mediator” and “electrocatalyst” are often used interchangeably in the literature.) If the C step is sufficiently fast, the mediator or electrocatalyst will be regenerated on the timescale of the electrochemical scan, allowing for one or more additional sequences of electrochemical/chemical reactions. Such reactions, designated EC’, represent a variation of the conventional EC sequence (Eqs. 6 and 7), in which regeneration of Red in the C step, which differs from the irreversible reaction shown in Eq. 5.
| Eq. 6 |
| Eq. 7 |
Regeneration of the catalyst upon reaction with substrate (formation of Red in Eq. 7) can lead to a significant increase in current during the forward CV scan. The same reactivity eliminates the current in the reverse scan because Ox is consumed by the substrate, and thus is not available to undergo electron transfer at the electrode. This behavior is depicted in Fig. 10a, where the catalyst in the absence of substrate shows a typical reversible CV feature (black dashed trace), but in the presence of substrate shows a sigmoidal curve associated with electrocatalysis (red solid trace). Under conditions in which the concentration of substrate does not limit the catalytic rate, the forward scan exhibits a plateau at a current that correlates with the rate of catalytic turnover and is independent of the scan rate. The height of this kinetically controlled plateau can be used to derive the turnover number (TON) or turnover frequency (TOF) of the catalytic reactions.
Fig. 10.
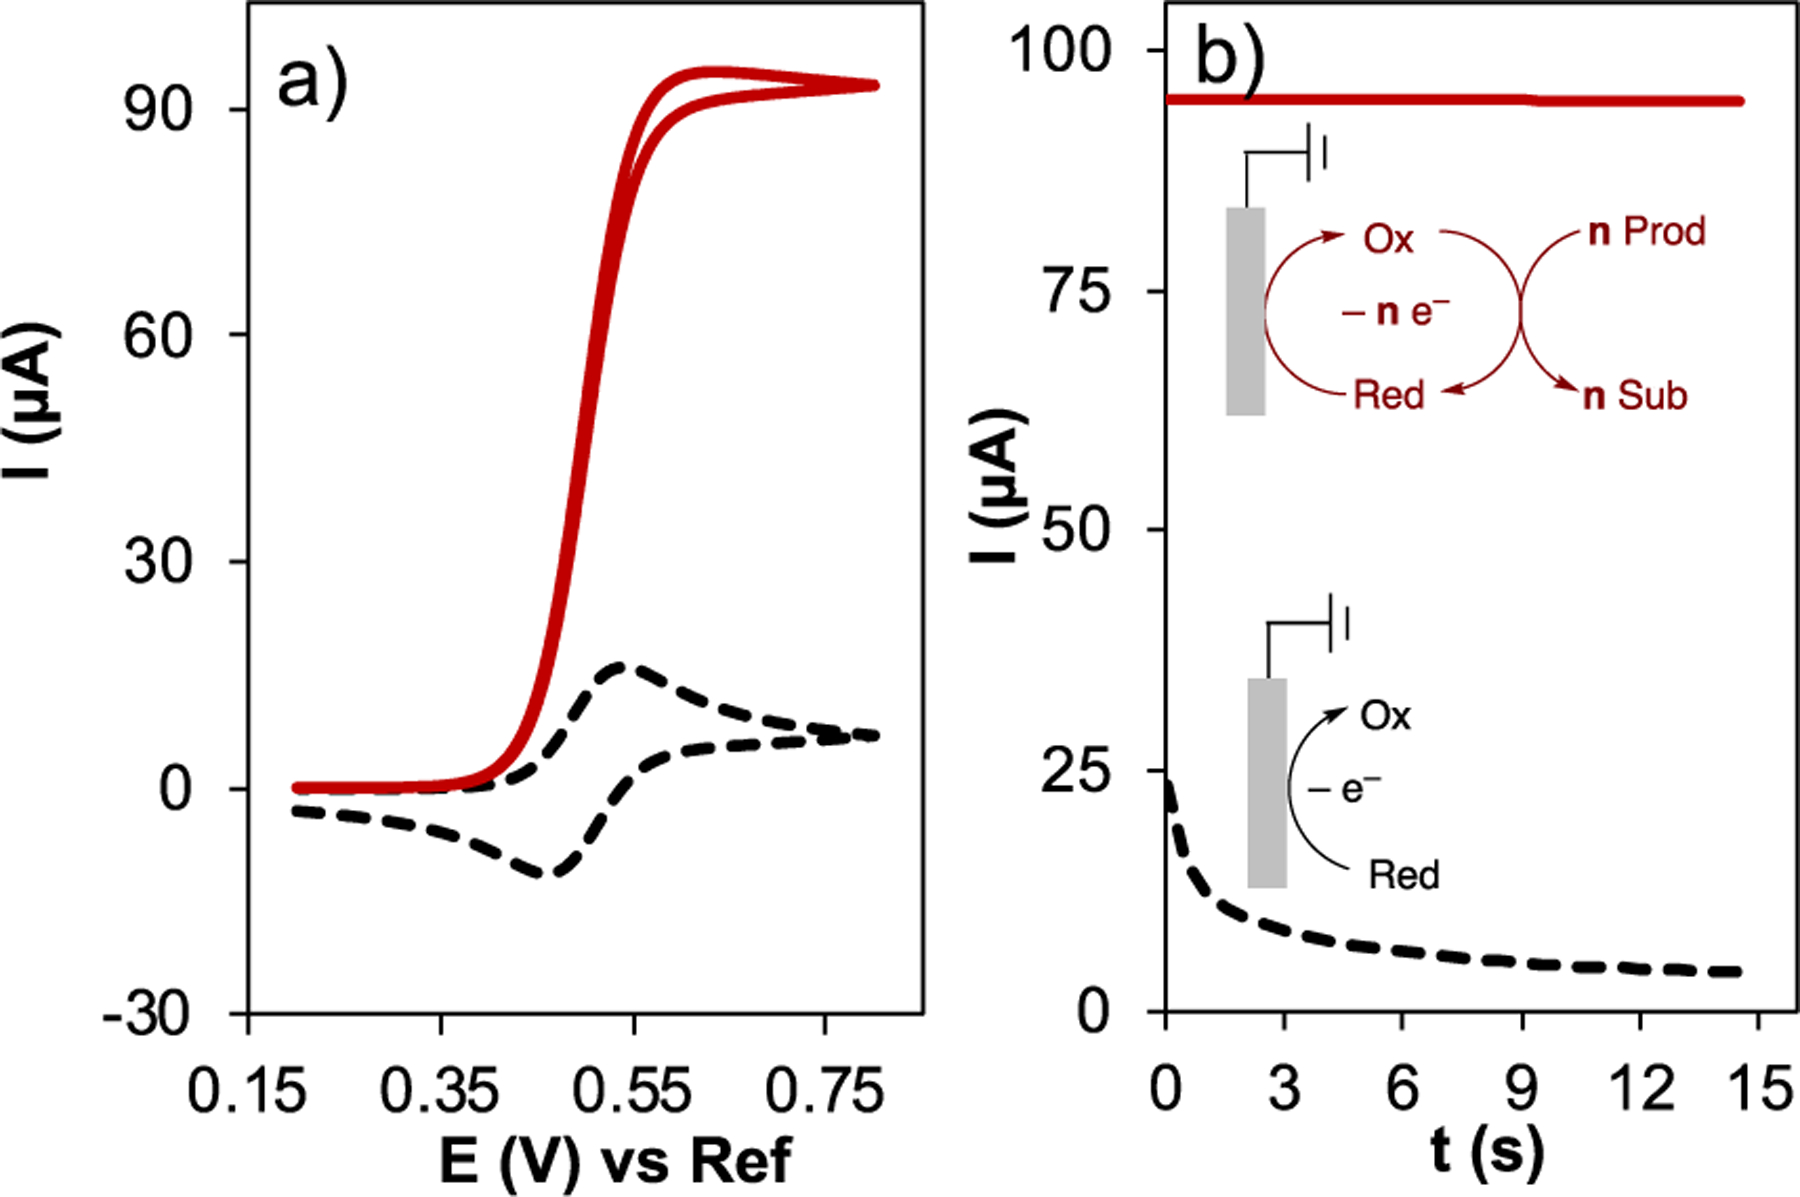
(a) Simulated cyclic voltammograms for electrode reaction of 1 mM Red with E1/2 = 0.5 V, in the absence (dashed black trace) and presence (solid red trace) of a catalytic reaction with k = 20 M–1s–1, scan rate 100 mV s–1. (b) Chronoamperometry of the same electrode reaction (dashed black trace) and electrocatalytic reaction (solid red trace), with an applied potential for chronoamperometry of 0.62 V vs Ref electrode.
No kinetic information can be obtained from the backward scan since all the Ox is consumed. In ideal cases, the forward and reverse scans are identical (i.e., they directly overlap). Electrocatalytic reactions are readily studied by single-step chronoamperometry (CA). Fig. 10b shows CA traces associated with the same electrocatalytic reaction analyzed by CV in Fig. 10a. When the electrode is stepped to 0.62 V (120 mV higher than the catalyst E1/2 value) in the absence of substrate, a decaying current trace is observed associated with electrochemical oxidation of the catalyst at the electrode surface (black dashed trace in Fig. 10b; cf. E step in Eq. 6). In contrast, a significantly higher steady current is observed in the presence of substrate (red solid trace in Fig. 9b), arising from catalytic turnover according to the EC’ mechanism in Eqs. 6 and 7. The chronoamperometric current may be used to derive the TOF of the catalyst, as described below.
Examples of the EC Mechanism
Cyclic voltammetry is characterized by rapid collection of data, easy experimental set up and covers a wide range of time scales to analyze reactivity. These features make this technique very powerful to obtain mechanistic information, including rate constants. Many reactions can be analyzed in very short time periods by using CV. Consequently, CV is ideally suited to analyze broads sets of data, for example, in the development of Hammett plots or the use of Multivariate Linear Regression (MLR) methods. The diagnostic criteria for CVs of an EC mechanism with an irreversible subsequent chemical reaction are presented in Box 2.
The groups of Sigman and Minteer have used CV methods to interrogate mechanistic aspects of different reactions, particularly in the context of Co and Ni catalysis.38–41 For example, they have investigated the oxidative addition of allyl acetates to Co and Ni complexes. Well-defined cyclic voltammetry traces were observed for the MII/I reduction, when sterically hindered bipyridines and phenanthrolines were used as the ligands (Fig. 11).40 The proposed mechanism for the reaction of allyl acetate with Ni/Mebpy (Mebpy = 6,6′-dimethyl-2,2′-bipyridine) upon reduction of the metal to NiI is in agreement with an EC mechanism (Fig. 11a) and is consistent with CV observations. CV analysis was therefore used to probe cathodic and anodic peak currents observed for the metal complex in the presence of substrate. NiI is generated during the cathodic scan and the reverse scan will lead to an anodic peak that varies in magnitude depending on the scan rate and the rate of the oxidative addition step, which consumes NiI (Fig. 11b). The elapsed time between the cathodic and anodic peaks and the ratio of anodic and cathodic peak currents (Fig. 11c) may be used to obtain rate constants for the oxidative addition step (Fig. 11d). Analogous data can be obtained with different ligands and substrate and used to build Hammett plots and MLR models to probe factors that influence the oxidative addition step. Based on the same approach, Minteer and Sigman investigated the oxidative addition of benzylic halides to CoI complexes.39 Rate constants for the oxidative addition step were obtained by cyclic voltammetry, but the data also implicated a more complex mechanism.
Fig. 11.

(a) Proposed mechanism for reaction of allyl acetate with a NiBr2/Mebpy complex. (b) Cyclic voltammetry traces at two scan rates using a solution of 1.0 mM NiBr2∙DME, 1.0 mM Mebpy ligand, 5.0 mM allyl acetate in a solution of acetonitrile containing 100 mM NBu4PF6 at 25 °C. (c) Equations used in the study to obtain kinetic data from cyclic voltammetry data in (b). (d) A second order kinetic plot using CV data to obtain rate constants for oxidative addition. Reproduced from ref. 40 with permission from American Chemical Society, copyright 2022.
The effect of the substrate concentration 8 on the CV peak current ratios analyzed by CV was consistent with consumption of CoI on the timescale of the CV (lower Ipa/Ipc at increased [8]); however, the data also revealed a shift in the cathodic peak to lower potentials with increasing substrate concentration (Fig. 12b). The shift is opposite to the direction expected for an EC mechanism (see further discussion below), and CV simulations provided support for a more complex multistep mechanism, shown in Fig. 12a. As noted above, EC mechanisms can lead to a shift in the peak during the forward CV scan.
Fig. 12.
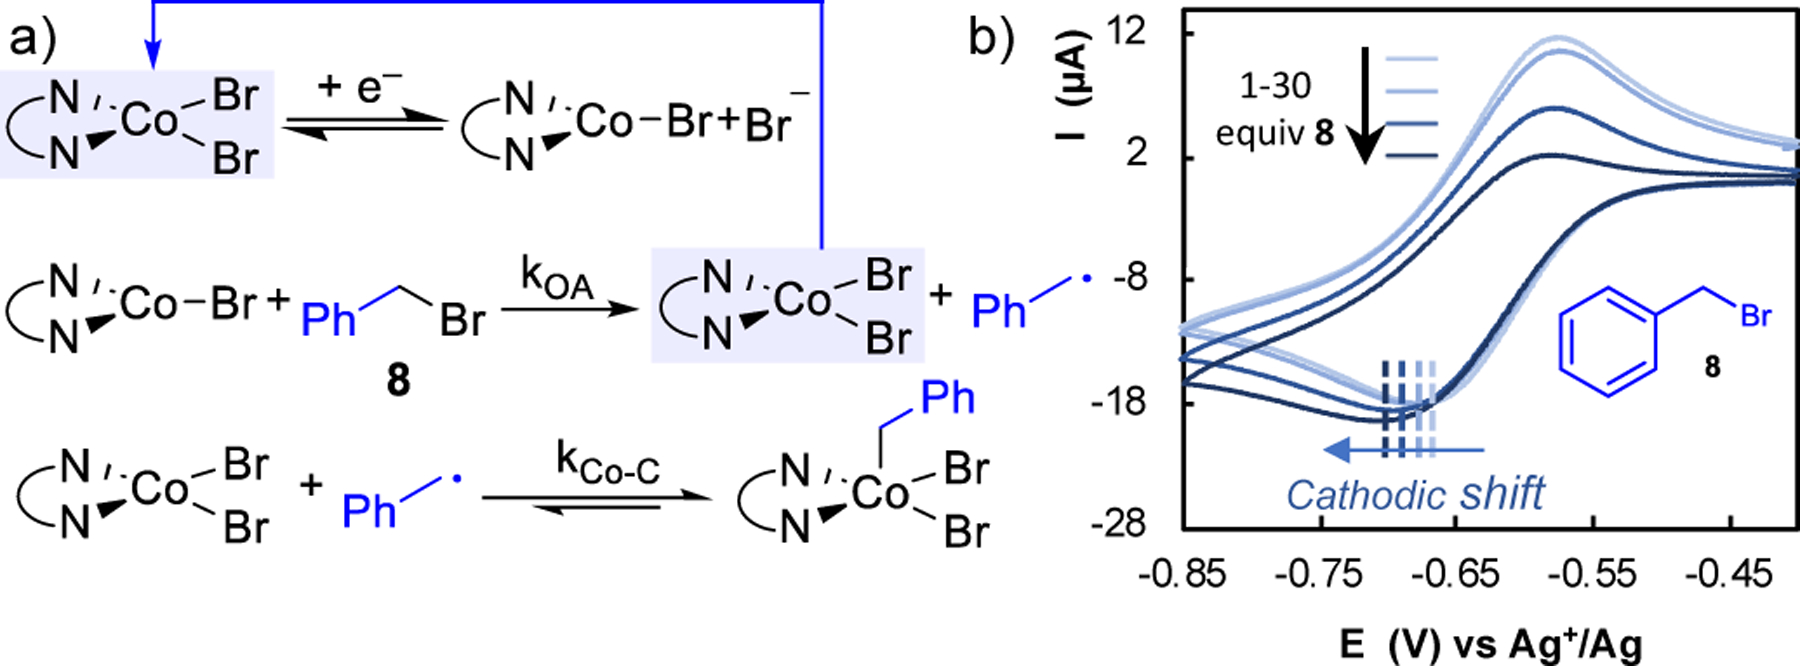
(a) Proposed mechanism for activation of benzyl bromide by Co/pyrox system. (b) Cathodic shift of peak cathodic potential for the CoII/CoI couple ligated by 5CN-pyrox ((S)-6-(4-(tert-butyl)-4,5-dihydrooxazol-2-yl)nicotinonitrile) with successive increases in benzyl bromide 8 concentration. Reproduced from ref. 39 with permission from American Chemical Society, copyright 2019.
Dempsey et al. observed such behavior in the reaction of different acids with cobalt complexes that form cobalt hydrides relevant to the hydrogen evolution reaction (HER).42 CV analysis of [(dppe)(CH3CN)Co(Cp)]2+ in the absence of added acid reveals two reversible redox features, E1 and E2, in CH3CN solvent corresponding to CoIII/CoII and CoII/CoI redox reactions (blue traces in Fig. 13b,c). Upon changing the solvent to CH2Cl2, E1 becomes irreversible, rationalized by an EC mechanism in which the C step involves dissociation of CH3CN from the CoII complex. This behavior is accompanied by a potential shift to more positive potentials (Fig. 13b), which is characteristic of a reversible E step followed by a C step. Adding CH3CN to CH2Cl2 recovers CoIII/CoII reversibility, and the E1/2 shifts toward the more negative values observed in the CH3CN solvent (not shown).
Fig. 13.

(a) Proposed mechanism for the formation of Co-H complex. (b) Cyclic voltammograms of [(dppe)(CH3CN)Co(Cp)](PF6)2 0.5 mM in CH3CN (blue trace) and CH2Cl2 (red trace). (c) Cyclic voltammograms of the same complex in the absence of a proton source (blue) and as 4-cyano-anilinium (pKa = 7) is titrated into an CH3CN solution (traces grey to red). Cyclic voltammograms were recorded in 0.25 M NBu4PF6 at 100 mV s–1. (d) Rate constants for protonation of CoI (kPT) on a logarithmic scale as a function of acid pKa in CH3CN and selected examples of acids included in the study. Reproduced from ref. 42 with permission from American Chemical Society, copyright 2017.
If acid is present, reduction of CoII to CoI results in the reaction of the CoI complex with a proton, generating the corresponding CoIII hydride. In this case, the features expected for an EC mechanism are reflected in the CV: the reverse peak disappears (Epa2, and consequently, Epa1) and the reduction peak (Epc2) is shifted positive at high concentration of acid (Fig. 13b, grey and red traces). These data are consistent with an ET-PT (electron transfer followed by proton transfer) mechanism for formation of CoIII hydride. Additional CV experiments performed at different concentrations of acid and scan rates allowed determination of the PT rate constant (kobs = kPT) (eq. 8).
| Eq. 8 |
In this equation R, T, and F are the gas constant, temperature, and Faraday constant, respectively. Ep is the reduction peak potential in the presence of acid, where E1/2 is obtained from CV analysis in the absence of acid. A plot of kPT versus the pKa of different acids revealed three different groups of proton donors (Fig. 13c): weaker acids with rate constants that increase as the pKa is lowered (Fig. 13d, red); strong acids that have identical rate constants (Fig. 13d, green), and acids that do not fit either of these two trends, due to steric interactions (Fig. 13d, blue). The mechanistic origin of the break in the pKa trend was not identified, but the results highlight the ability of CV to analyze kinetic behavior of this type.
Amatore and Jutand investigated the mechanism of reductive biaryl coupling of aryl halides catalyzed by (dppe)NiCl2 using cyclic voltammetry.43 To study the catalytic reaction, they first studied the redox behavior of (dppe)NiCl2 that undergoes a two-step reduction. The CV of (dppe)NiCl2 shows two reduction peaks, C1 and C2, corresponding to NiII/I/dppe to NiI/0/dppe, respectively (Fig. 14). The oxidative peaks in the backward scans are ill-defined and this prevents the use of anodic/cathodic peak ratios to study the stability of the electrochemically generated Ni complexes. Normalized current CVs showed that the first reduction peak (C1) is diffusion-controlled, and its normalized current is independent of the scan rate. The normalized current of the second reduction peak (C2), however, decays by decreasing the scan rate. It also decays by increasing the concentration of (dppe)NiCl2. This behavior implicates a chemical reaction of NiI/dppe upon its electrochemical generation, and the concentration dependence of the decay is consistent with a dimerization process.
Fig. 14.

(a) Cyclic voltammogram of (dppe)NiCl2 (2 mM) in HMPA/THF (1/2) mixture (0.1 M NBu4BF4) at 20 ºC. Voltammogram at a stationary gold microelectrode (d = 125 µm, ν = 500 V s−1). (b) Variations of current peak ratio Ip(R2)/Ip(R1) with the scan rate and the (dppe)NiCl2 concentration, C0: ( ○ ) 1.0, ( ◐ ) 1.5, and ( ● ) 2.0 mM. Solid line: theoretical variations for a NiI dimerization mechanism. (ν in V s–1, C0 in M, ΔEp in V; k in M−1 s−1; Z = 0.034(FΔEp/RT); 20 ºC). Reproduced from ref. 43 with permission from American Chemical Society, copyright 1988.
This reactivity was further probed by monitoring the ratio of the C2 peak current (Ipc2) relative to the C1 peak current (Ipc1) at different scan rates and concentrations of (dppe)NiCl2. As shown in Fig. 14b, the Ipc2/Ipc1 ratio is low at low scan rates and approaches unity at higher scan rates, showing that the kinetics of NiI dimerization can be competitive with the CV scan rate.
In addition to this qualitative analysis, plotting these ratios at different scan rates and concentration allows the construction of a working curve for an EC mechanism, from which the rate constant for the dimerization of NiI can be determined. With a similar approach and diffusion reaction equations, the authors obtained rate constants for the chemical steps involved in the mechanism for this Ni-catalyzed reductive coupling.
The above examples show that cyclic voltammetry is a powerful tool to obtain information about reactions described by the EC mechanism. This is the simplest mechanism to find where a chemical reaction occurs after a redox event. However, more complex mechanisms can arise if other follow-up electrochemical and chemical steps are involved. One of these complex mechanisms, the ECEC mechanism, is illustrated by the work of Nematollahi and Rafiee involving electrochemical synthesis of benzofurans and CV studies to determine the reaction mechanism (Fig. 15).44
Fig. 15.

(a) General reaction scheme. (b) Cyclic voltammogram at a glassy carbon electrode (A = 2.5 mm2) of 2 mM catechol 9 alone (red) in the presence of 2 mM acetylacetone 11 (blue) and 2 mM 11 alone (green). (c) Cyclic voltammogram as in (b) but at pH = 9 in buffered solutions with same ionic strength. ν = 100 mV s−1, T = 25 °C. (d) Curve I: Variation of peak current ratio Ipc/Ipa in the absence of acetylacetone; curve II: variation of peak current ratio Ipc/Ipa in the presence of acetyl acetone; curve III: difference between peak current ratio Ipc/Ipa in the presence and absence of acetylacetone. Reproduced from ref. 44 with permission from Elsevier B.V., copyright 2003.
The reaction takes place via oxidation of catechol (9) into the quinone (10) followed by Michael addition of acetylacetonate (11). Further oxidation of the intermediate (12) enables a second nucleophilic attack by the enolate oxygen atom to form the furan ring (14) (Fig. 15a). Oxidation of 9 to 10 follows a quasi-reversible two-electron process, with an Ipc/Ipa of approximately 1 (Fig. 15b). At high pH, however, this reversibility is lost due to polymerization reactions of the quinone with anionic species (Fig. 15c, red trace) that can compete with the reaction of interest. At lower pH, this decomposition pathway is negligible and the disappearance of the cathodic peak in the presence of 11 (Fig. 15b, blue trace) reflects reaction of 10 with this nucleophile. By plotting the Ipc/Ipa at different pH in the absence and presence of the nucleophile, optimal pH conditions can be found to maximise the productive pathway in electrosynthesis (Fig. 15d).
Examples of the EC’ Reactions Analyzed by Cyclic Voltammetry
The diagnostic criteria for CVs of an EC’ electrocatalytic mechanism are presented in Box 3.

A straightforward example of an EC’ mechanism can be seen in the work by Cass et. al, where ferrocenecarboxylic acid (15) was used as a mediator for the oxidation of glucose by the enzyme glucose oxidase (GO). Inspiration for this reaction came from detection of blood glucose levels, which normally uses O2 as the oxidant.45
15 undergoes oxidation at the electrode surface forming 15+ then reacts with GOred, generating GOox and regenerating the original form of 15, which can then again undergo oxidation at the electrode surface. GOox reacts with glucose to produce gluconolactone and regenerate GOred, completing the catalytic cycle (Fig. 16). Comparing the CV of the ferrocene mediator in the absence and presence of glucose oxidase (all with glucose present) shows a significant increase in the anodic peak current on the forward scan and loss of the reduction peak on the backward scan (Fig. 16b). The features are characteristic of an EC’ mechanism (Box 3). Performing cyclic voltammetry at different concentrations of GO allowed determination of the 2nd-order homogenous rate constant between ferrocenium and glucose oxidase. By plotting the Icat/Ipa versus 𝑣–1 from pseudo-first-order conditions, the rate constant of catalytic reaction (kf) can be derived, according to Eq. 9.45
| Eq. 9 |
Fig. 16.

(a) Cyclic voltammogram of 15 and glucose in the absence and presence of GO. (b) Reaction scheme for electrocatalytic reaction (c) plotting kinetic parameter kf/(nFνR−1T−1) as a function of ν−1 for various glucose concentrations. Reproduced from ref. 45 with permission from American Chemical Society, copyright 1984.
The slope of the line for each glucose concentration gives a pseudo-first-order rate constant kf, which is then used to determine the second-order homogeneous rate constant from kf/[GO]. The presence of 𝑣 in this equation reflects the scan-rate dependence of Ipa; however, as mentioned above (EC’ mechanism section), Icat is independent of scan rate and controlled by turnover rate of the catalytic reaction. Generally, measurement of Icat/Ipa is a useful method for the study of catalytic reactions, either by cyclic voltammetry or chronoamperometry studies.
An alternative to derive kf involves plotting Icat versus the square root of substrate concentration as shown in Eq. 10.6,46
| Eq. 10 |
Here, Ccat and Csub denote the bulk concentrations of catalyst and substrate, respectively, and n, F, and A represent the number of electrons, the Faraday constant, and the electrode surface area, respectively.
In 2021, Diao and Liu combined cyclic voltammetry studies with DFT calculations to elucidate the mechanism of alkyl radical formation by reaction of (bpy)NiI(Ar) complexes with C(sp3) electrophiles.47 This step is proposed to play a role in reductive cross-electrophile coupling reactions. Ni complexes with bipyridyl ligands are commonly used; however, the high reactivity and instability of monoligated (bpy)NiI(Ar) complexes hampered their study. CV analysis of (bpy)NiII(Mes)Br (16) at −60 °C and at room temperature showed a cathodic peak assigned to one-electron reduction of 16 to 16’ and a corresponding anodic peak for reoxidation from 16’ to 16. (Fig. 17b). The Ipa/Ipc ratio is ~1 over a wide range of scan rates, indicating that 16’ is stable on the CV time scale under these conditions (i.e. 0.67–20 sec at −60 °C; Fig. 17c). The CV at room temperature exhibits a smaller Ipa/Ipc ratio. This observation was proposed to arise from dissociation of Br− from 16’ to form (bpy)NiI(Mes). A second oxidation peak is evident at a more positive potential and was assigned to the oxidation of (bpy)NiI(Mes). The Ipa/Ipc ratio varies with the CV scan rate, reflecting an EC mechanism, and the rate of this dissociation was determined to be 2.5 s−1. CV analysis was then performed with 16 in the presence of 1-bromopropane.
Fig. 17.

(a) Scheme of single electron reduction of 16. (b) Cyclic voltammograms of 16 at −60 °C (blue trace) and room temperature (green trace), both with ν = 500 mV s–1. The enhancement in current seen at room temperature is due to the increase in diffusion; this effect is accounted for in the Randles-Ševčík equation. The second peak, at more positive potentials, was assigned to the oxidation of (bpy)NiI(Mes), formed via Br− dissociation from 16’. (c) Plot of Ipa/Ipc ratio against scan rate conducted at −60 °C, showing the peak to peak ratio remains approximately unity at different scan rates. Reproduced from ref. 47 with permission from American Chemical Society, copyright 2021.
A reaction between 16’ and 1-bromopropane was evident from a reduction in Ipa and decrease in Ipa/Ipc (Fig. 18a). The enhancement of Ipc in the presence of 1-bromopropane could arise from an EC’ (electrocatalytic) mechanism or an ECE process in which the product of NiI reaction with bromopropane is reduced at this potential. Conducting cyclic voltammetry with slower scan rates allows for more time for reaction of electrogenerated 16’ with 1-bromopropane, which enhances Ipc and decreases the Ipa/Ipc. These effects are evident in Fig. 18b with normalized CVs at different scan rates. The authors used Ipa/Ipc at different scan rates and a fitting process to derive the rate constant (5.9 × 10⁻¹ M−1 s−1). The same procedure was repeated for different electrophiles, allowing the determination of various rate constants. No reactivity was observed with aryl electrophiles. While this is indeed a catalytic reaction, the scan rate independent plateau current is not observed which can be attributed to the slow rate of the catalytic reaction at −60 °C. The scan rate dependence of the catalytic peak and the diffusive decay after the peak potential are indicators of a reaction that is controlled by both diffusion (of the substrate) and catalytic turnover.
Fig. 18.

(a) Cyclic voltammograms of 16 in the absence and presence of 1-Br propane substrate. (b) Normalized voltammograms of 16 in the presence of substrate at 5 mV s−1 and 15 mV s−1 scan rates. All CVs performed at −60 °C. Reproduced from ref. 47 with permission from American Chemical Society, copyright 2021.
Foot-of-the-wave analysis (FOWA) has been pioneered by Savéant and co-workers as a method of expediently extracting kinetic data from cyclic voltammograms for catalytic reactions in which side-phenomena cause deviation from the typical EC’ mechanism voltammogram.48 In their seminal papers, they used digitally simulated voltammograms to show catalysts are not characterized by their TOF and overpotential (η) separately, but rather that these parameters are linked together by a defined relationship. Overpotential is defined as the difference between the formal redox potential, E°', and the applied potential, E, such that:
| Eq. 11 |
The log(TOF)/η relation can often be linearized, and the equation of this line can be used to determine the TOF at zero overpotential (TOF0). FOWA grants access to the TOF, log(TOF-η) relation, and TOF0, regardless of side-phenomena that interfere at high current densities e.g. decay of current from diffusion layer. The validity of their methodology is established theoretically and checked with examples taken from the catalytic reduction of CO2 by Fe0 porphyrins. They first demonstrate on the ideal and familiar case of a catalytic current without interfering phenomena (Fig. 19 blue trace). Here the whole of the scan can be linearized (Fig. 19b), while more complex voltammograms deviate slightly from this linearity. Fig. 19a shows CVs where consumption of the substrate is on the timescale of the cyclic voltammetry experiment, with different colours indicating different concentrations of substrate, i.e. different scales of substrate consumption. The key to note is that all the plots, including the non-ideal cases, are linear at the “foot of the wave” region (Fig. 19b). The less ideal cases deviate from linearity more dramatically as the scan proceeds, but kinetic parameters derived from the linear region remain valid overall.
Fig. 19.

(a) Cyclic voltammograms corresponding to an EC’ mechanism, with increasing degrees of substrate consumption. The blue trace is the ideal case with no consumption ( and in the absence of substrate). (b) Corresponding Foot-of-the-wave analysis plots. (Note: left plot is shown in the US convention, with negative potentials on the right, while the rest of our paper is in IUPAC convention). Reproduced from ref. 48 with permission from American Chemical Society, copyright 2012.
In the second part of the work by Diao and co-workers, FOWA was employed to obtain the kobs for the reaction between the electrochemically generated NiI (16’) and BnBr at room temperature. The CV at room temperature of the NiII complex (16) in presence of 100 eq. of BnBr substrate shows several folds enhancement in catalytic current and a loss of reversibility (Fig. 20, violet trace), indicating a rapid oxidation of 16’ by BnBr (EC’ process). At the foot of the wave there is a linear relationship between I/Ip0 and the kobs within a given potential range (Fig. 19b). From their FOW analysis they obtained a pseudo-first order kobs of 4 × 10⁴ M−1 s−1 for the reaction between 16’ and BnBr to generate Bn. (benzyl radical). The use of FOWA further allowed them to study the steric and electronic effects on reaction kinetics. The rate constants derived from cyclic voltammetry experiments, together with DFT calculations, identified the concerted halogen atom abstraction as the most probable mechanism for the C(sp3) electrophile activation by (bpy)NiI complexes.
Fig. 20.

Cyclic voltammograms of 1.0 mM 16 in a 100 mM solution of NBu4BF4 in DMF at 22 °C in the absence (green trace) and presence (violet trace) of 100 equiv. of BnBr, with the region used for foot-of-the-wave analysis highlighted (red trace). Reproduced from ref. 47 with permission from American Chemical Society, copyright 2021.
Inspired by the hydrogen evolution reaction (HER) catalyzed by cobalt complexes, research by several groups demonstrated the versatility and robustness of cobalt hydrides in the electrochemical derivatization of double and triple bonds.49
In addition to the development of different electrosynthetic reactions, CV studies were used to gain insights into the reaction mechanism and the identity of catalytic metal species involved in the isomerization of alkenes and reduction of alkynes. Alkene isomerization was carried out using a salen-ligated Co catalyst 17. This complex exhibits reversible reduction of CoII to CoI, and this redox behavior is not affected by the presence of an alkene (Fig. 21a). An increase in cathodic current was observed, however, when HFIP is included as a proton source in the reaction. This was attributed to catalytic generation of a CoIII-hydride species that can catalyze alkene isomerization (Fig. 21b, cycle A), in addition to promoting hydrogen evolution (Fig. 21b, cycle B).
Fig. 21.

(a) Cyclic voltammograms of Co/salen complex 17 in the presence and absence of HFIP and alkene 18. (b) Proposed mechanism for the electrochemical isomerization of alkenes catalyzed by Co. Note: Only one of the possible mechanisms for H2 generation is shown in cycle B. Reproduced from ref. 49 with permission from Springer Nature, copyright 2022.
Examples of EC’ Reactions Analyzed by Chronoamperometry
Chronoamperometry, which records current over time at a constant applied voltage, is a echanistic technique that can provide valuable information about solution reactions of electroactive species whenever electrode kinetics are not a limitation. Stahl and Rafiee have provided a detailed procedure for the use of chronoamperometry to calculate the turnover frequency (TOF) in electrochemical oxoammonium-catalyzed oxidation of alcohols.16 In this reaction, the observed current arises from three sources: non-faradaic charging of the electrode surface, oxidation of 2,2,6,6-tetramethylpiperidine-N-oxyl (TEMPO, the catalytically active oxoammonium species), and electrochemical regeneration of the oxoammonium species after each reaction with substrate. Chronoamperograms (CAs) are recorded under three sets of conditions (Figs. 22a and 22b): (1) a “blank” in the absence of the electrocatalyst (QB), (2) the solution containing the catalyst in the absence of organic substrate (QA), and (3) a fully constituted reaction solution containing the electrocatalyst and substrate (QT). The measured charge under each of these conditions, together with the elapsed reaction time (t) and the number of electrons associated with the redox reaction (n), may be used to determine the catalytic turnover frequency (Eq. 12).
Fig. 22.

(a) Visualization of the effect of increasing alcohol concentration on the chronoamperogram of (b) mediated alcohol oxidation and (c) the trends of initial turnover frequency for various alcohols with different nitroxyl electrocatalysts. Reproduced from ref. 16 with permission from American Chemical Society, copyright 2021.
| Eq. 12 |
In 2015, Stahl and Rafiee used this technique to study the effect of nitroxyl and alcohol structures on the TOF in nitroxyl-catalyzed electrochemical alcohol oxidation.50 Several nitroxyl electrocatalysts (TEMPO, ACT, ABNO and AZADO; see structures in Fig. 22c) and multiple structurally distinct alcohols were examined at three different alkaline pH values. Representative data obtained at pH 10 show that 4-acetamido-TEMPO (ACT) is almost always the most active nitroxyl (Fig. 22c, red bars). The relative activity was attributed to the higher redox potential of ACT (650 mV vs. Ag/AgCl) relative to the less sterically hindered nitroxyls, ABNO and AZADO (480 and 450 mV vs. Ag/AgCl respectively), which creates a stronger driving force for alcohol oxidation. The TOFs observed for different substrates show that structural trends reflect both electronic and steric effects: benzylic alcohols are more reactive than sterically similar aliphatic alcohols, and less sterically hindered alcohols are more reactive (Fig. 22c; e.g., TOFs are higher for 1°, rather than 2° alcohols).
In 2018, Stahl, Rafiee and coworkers disclosed an electrosynthetic method for oxidation of 1° aliphatic and benzylic alcohols or aldehydes to carboxylic acids using electrochemistry and a nitroxyl electrocatalyst (Fig. 23a), representing an electrochemical alternative to the Anelli or Pinnick reactions.51 Resembling the results of the mechanistic study outlined above, ACT was the most effective electrocatalyst and led to good synthetic results under basic aqueous conditions with constant potential electrolysis (700 mV vs. Ag/AgCl). Aldehydes bearing electron-deficient substituents (e.g., pyridyl or heteroatom-containing substituents) undergo faster oxidation than their associated alcohol. This observation was leveraged in the oxidation of a stereoenriched alcohol (19), which is a precursor to the generic drug levetiracetam (Fig. 23b). Under the basic reaction conditions, the stereocenter in the aldehyde intermediate could undergo racemization; however, rapid oxidation of the aldehyde into the carboxylate protects the stereocenter and limits racemization. The difference in reaction rate between a series of different alcohols and the corresponding aldehyde was qualitatively analyzed by comparing the current enhancement observed by CV upon adding the substrate to ACT, and a structural dependence was observed for the relative reactivity of the alcohol and aldehyde. These trends were quantified by using chronoamperometry to determine the TOFs (Fig. 23c).
Fig. 23.

(a) Mechanistic cycle of mediated electrochemical oxidation of alcohols or aldehyde hydrates to aldehydes and acids. (b) Mediated oxidation of a stereoenriched alcohol (19), demonstrating that the relatively fast oxidation of the aldehyde outcompetes base-induced epimerization, providing stereoenriched product. (c) Relative turnover frequency of mediated alcohol or aldehyde oxidation with ACT, showing a clear structure reactivity dependence.
Electroanalytical Methods to Analyze Bulk Concentrations: Rotating Disk Voltammetry and Microelectrodes
Cyclic voltammetry and chronoamperometry are performed under quiescent conditions in which only diffusion contributes to mass transport. Related electroanalytic methods, called hydrodynamic voltammetry and amperometry, are performed under conditions with convective mass transport. These experimental variations of cyclic voltammetry and chronoamperometry experiments commonly use a rotating disc electrode (RDE). The centrifugal force resulting from the electrode rotation creates a well-defined convective pattern to and from the electrode surface. This convective mass transfer replenishes the solution area near the electrode surface, providing a steady stream of reactants that prevents expansion of the diffusion layer. Similar behavior can be achieved without fast electrode rotation by using a microelectrode (ME).52,53 In this case, the rate of hemispherical diffusion to and from the microscale electrode can be similar to or faster than the rate of reactions at the electrode surface, again preventing the expansion of the diffusion layer. CVs recorded with a RDE or ME exhibit a sigmoidal shape, owing to the lack of diffusion limitations that lead to the “duck” shape of a typical CV. The current observed in CA experiments performed with RDEs and MEs is proportional to the bulk concentration of electroactive species and can be used to probe their concentration during conventional chemical reactions. An advantage of MEs for probing the concentration profiles is that they don’t need the equipment required for electrode rotation; however, environmental noise can complicate recording of the nanoamp-scale current observed with MEs. Five examples from the literature are documented below, in which RDE or ME techniques have been used to probe reaction mechanisms and/or perform kinetic analysis of chemical reactions. Box 4 demonstrates the application of ME and RDE for probing the bulk concentration of redox active reaction components.

Amatore and co-workers elucidated the crucial role of a base, such as NaOH, NaOAc, or Na2CO3, in the Pd-catalyzed Suzuki-Miyaura cross-coupling of aryl halides with arylboronic acids.54 The rate determining step in biaryl formation is often transmetalation from an arylboronic acid to a PdII(Ar)Br complex. Transmetalation in the presence of a base can become so fast that it is difficult to monitor this reaction using standard techniques, such as 1H or 31P NMR spectroscopy. To determine the effect of the base on the rate of transmetalation, the reaction between trans-(PPh3)2PdII(Ar)Br (20) (Ar = pCNC6H4) and phenylboronic acid (21) was studied in presence and absence of excess hydroxide (10 equiv, introduced as NBu4OH) in DMF (Fig. 24a). Transmetalation and reductive elimination steps generate the Ph-Ar biaryl product (22) and (PPh3)3 Pd0 (23) complex over ~400 seconds. Both products are electroactive and have distinct redox features as shown by the CV in Fig. 24b, which was recorded at the end of the reaction. 22 shows a reversible reduction peak at −2.01 V vs SCE while 23 shows an irreversible oxidation peak at +0.03 V vs SCE. The kinetics of transmetalation between 20 and 21 were monitored electrochemically using a gold RDE at a constant potential of +0.05 V [the oxidation potential of 23]. The current recorded at this potential is proportional to the concentration of 23 generated during the reaction. The chronoamperometry experiment revealed a first-order current (or concentration) versus time plot, as shown in Fig. 24c. The current recorded at the end of the reaction (10 μA) corresponds to the current expected for complete conversion of 20 into 23. Kinetic data of this type, recorded at different base loadings, revealed the role of hydroxide in accelerating transmetalation, and a (PPh3)2Pd(Ar)OH intermediate was proposed.
Fig. 24.

(a) General reaction equation. (b) Cyclic voltammetry trace performed with a gold disk electrode (d = 1 mm) in DMF containing 0.3 M NBu4BF4 at a scan rate of 0.5 V s−1 at r.t. on a solution containing (PPh3)2Pd(pCNC6H4)Br, PhB(OH)2, 10 eq. OH- and 2 eq. of PPh3 after 400 s from the addition of the base. (c left) Evolution of the oxidation current of [(PPh3)3Pd0] vs time. The current was determined by chronoamperometry performed at a RDE (d = 2 mm) polarized at + 0.05 V (c right) plot of ln(x) vs time where x = (Ilim-It)/Ilim; Ilim defined as the final oxidation current of [(PPh3)3Pd0] and It as the oxidation current of [(PPh3)3Pd0] at a given time t. Reproduced from ref. 54 with permission from John Wiley and Sons, copyright 2011.
Amatore and co-workers independently used chronoamperometry to study the rates and mechanism of oxidative addition of an aryl halide to Pd0 complexes.55 The specific reaction featured p-iodotoluene (24) and (PPh3)4 Pd0 (25), which react to give trans-(PPh3)2dII(tol)Br (26) complex and free ligand (Fig. 25a). As in the previous example, the concentration of 25 in the bulk was monitored during the reaction. In this case a ME was used rather than a RDE to accommodate the low dielectric constant of the reaction solvent (toluene). MEs generate/consume very low currents (e.g., ≤ 10 nA), allowing them to be used without electrolytes when using solvents with a high dielectric constant or with only small amounts of electrolytes in low conducting solvents. Linear sweep voltammograms (LSVs; note: LSVs represent the first step of a two-step CV experiment) were recorded at different concentrations of 25 with a ME to confirm that the current is proportional to the concentration (Fig. 25b). Then, the reaction was monitored over a period of 600 seconds with a gold ME. The ME was scanned between +0.2 V and −2.7 V vs Ag/AgBF4. The reductive scan was used to overcome passivation of the microelectrode surface while the oxidative scan (at +0.2 V) was used to monitor the amount of 25 in solution. The current decay in the presence of tolyl iodide 24 was measured and plotted vs time (Fig. 25c). Repeating the same experiment at different concentrations of 24 allowed determination of the rate constant for oxidative addition in toluene.
Fig. 25.

(a) General reaction scheme. (b) Linear sweep voltammograms recorded in the oxidative direction for a solution containing increasing concentration of (PPh3)4Pd in toluene, n-hex4NBF4 (0.06 M) using a gold microelectrode (10 μm), 200 mV s−1 scan rate (C1 is the highest concentration = 1.5 mM). (c) Concentration profile of (PPh3)4Pd0 vs time in presence of excess p-Iodotoluene obtained from cyclic step chronoamperometry (CSCA) at a ME (10 μm) scanned between +0.2 V and −2.7 V vs Ag/AgBF4 over 600 s, the reductive step at −2.7 V was used to regenerate the ME surface after each oxidation step but is not considered for the concentration determination. Reproduced from ref. 55 with permission from American Chemical Society, copyright 1990.
Stahl and co-workers used an RDE to monitor TEMPO species in solution during TEMPO-catalyzed oxidation of alcohols with bleach (NaOCl).50 TEMPO undergoes reversible one-electron oxidation to TEMPO+ at E1/2 = +0.53 V vs Ag/AgCl (see LSV in Fig. 26a). Both TEMPO and TEMPO+ species could be monitored under reaction conditions by using cyclic step chronoamperometry (CSCA) at a RDE. The RDE was stepped between +0.71 V and +0.35 V vs Ag/AgCl. The current measured at +0.71 V is proportional to [TEMPO], reflecting oxidation of TEMPO to TEMPO+, while the current at +0.35 V is proportional to [TEMPO+], reflecting reduction of TEMPO+ to TEMPO. The result of the CSCA experiment is shown in Figs. 26b and 25c, with an expansion of an individual step sequence in Fig. 26b and a full-time course of the reaction in Fig. 26c. Plotting the oxidative currents obtained at +0.71 V and the reductive currents at +0.35 V reflects the concentration profiles of TEMPO and TEMPO+ vs time (Fig. 26d). Repeating this protocol in the presence of the alcohol substrate and/or with other various nitroxyl derivatives allowed determination of the rates of alcohol oxidation with different nitroxyls and different alcohols.
Fig. 26.

(a) Linear sweep voltammograms of TEMPO in the oxidative (blue) and reductive (red) directions at a RDE. (b) Representative cyclic chronoamperometric data for the oxidation of TEMPO by bleach. (c) Expansion of the oxidation and reduction currents from a single cycle in plot b, obtained from potential steps at 0.71 and 0.35 V vs Ag/AgCl. (d) Plots of the Faradaic anodic (positive) and cathodic (negative) currents at each step in plot b. Pulse width = 3 s, RDE rotation rate = 2000 rpm. Initial concentrations: 5.0 mM TEMPO, 0.2 M NaOCl, 0.12 M NaHCO3. Reproduced from ref. 50 with permission from American Chemical Society, copyright 2015.
Stahl and coworkers later used CSCA to study the mechanism of aerobic alcohol oxidation using a cocatalyst system composed of Fe(NO3)3 and TEMPO.56 The CSCA studies again used a rotating disk electrode that was stepped between +0.71 V and +0.35 V vs Ag/AgCl in order to monitor the TEMPO and TEMPO+ concentrations. The reactivity of Fe(NO3)3 with TEMPO was among the issues probed in this study, and it was possible to monitor the TEMPO/TEMPO+ species in the presence of Fe(NO3)3 without alcohol present under an air atmosphere (Fig. 27). An induction period was observed, followed by fast conversion of TEMPO into TEMPO+ (Fig. 26, red trace).
Fig. 27.

[TEMPO] (blue trace) and [TEMPO+] (red trace) obtained using cyclic step chronoamperometry at a rotating disk electrode upon mixing CH3CN solutions of 3 mM TEMPO and 3 mM Fe(NO3)3·9H2O in 0.1 M NBu4PF6 in CH3CN at 1000 rpm. Reproduced from ref. 56 with permission from American Chemical Society, copyright 2021
These results showed that Fe(NO3)3 can oxidize TEMPO to TEMPO+, the latter species can serve as an oxidant for the alcohol substrate. This outcome contrasts complementary studies of (bpy)Cu/TEMPO catalysts for aerobic alcohol oxidation, which features a mechanism for alcohol oxidation involving CuII and TEMPO, rather than a TEMPO+ species.57,58
Electroanalytical techniques also may be used to study bulk electrolysis reactions. Nematollahi et. al used cyclic voltammetry to monitor solution species during the electrochemical oxidation of 2,5-dihydroxybenzoic acid (27) in the presence of acetylacetone to furnish the substituted benzofuran (30) (Fig. 28a).59 The experimental set-up consisted of four electrodes: a graphite rod working electrode for bulk electrolysis, a Pt mesh counter electrode, a SCE reference electrode, and a small glassy carbon electrode used to acquire CVs during electrolysis reactions. The working electrode was periodically switched between the graphite-rod macroelectrode, used to support bulk electrolysis, and the glassy carbon, used to obtain CVs. Bulk electrolysis was performed by applying a constant potential of +0.27 V vs SCE, which is capable of oxidizing 27 to quinone (28) (Fig. 28). After passing 0, 12, 24, 36 and 48 C of charge, the applied potential at the graphite rod and the stirring of the reaction mixture were stopped to record CVs using the analytical glassy carbon electrode with a quiescent solution (Fig. 28b). As shown in Fig. 28b, A1 disappears over time due to consumption of 27 while two new peaks, A2 (assigned to the oxidation of 29) and A3 (assigned to the oxidation of 30), increase in intensity. After 48 C were passed (end point of the bulk electrolysis) the reaction was quenched with acid and 30 was isolated. A new CV of isolated 30 was recorded, which confirmed A3 as the oxidation of the final product.
Fig. 28.
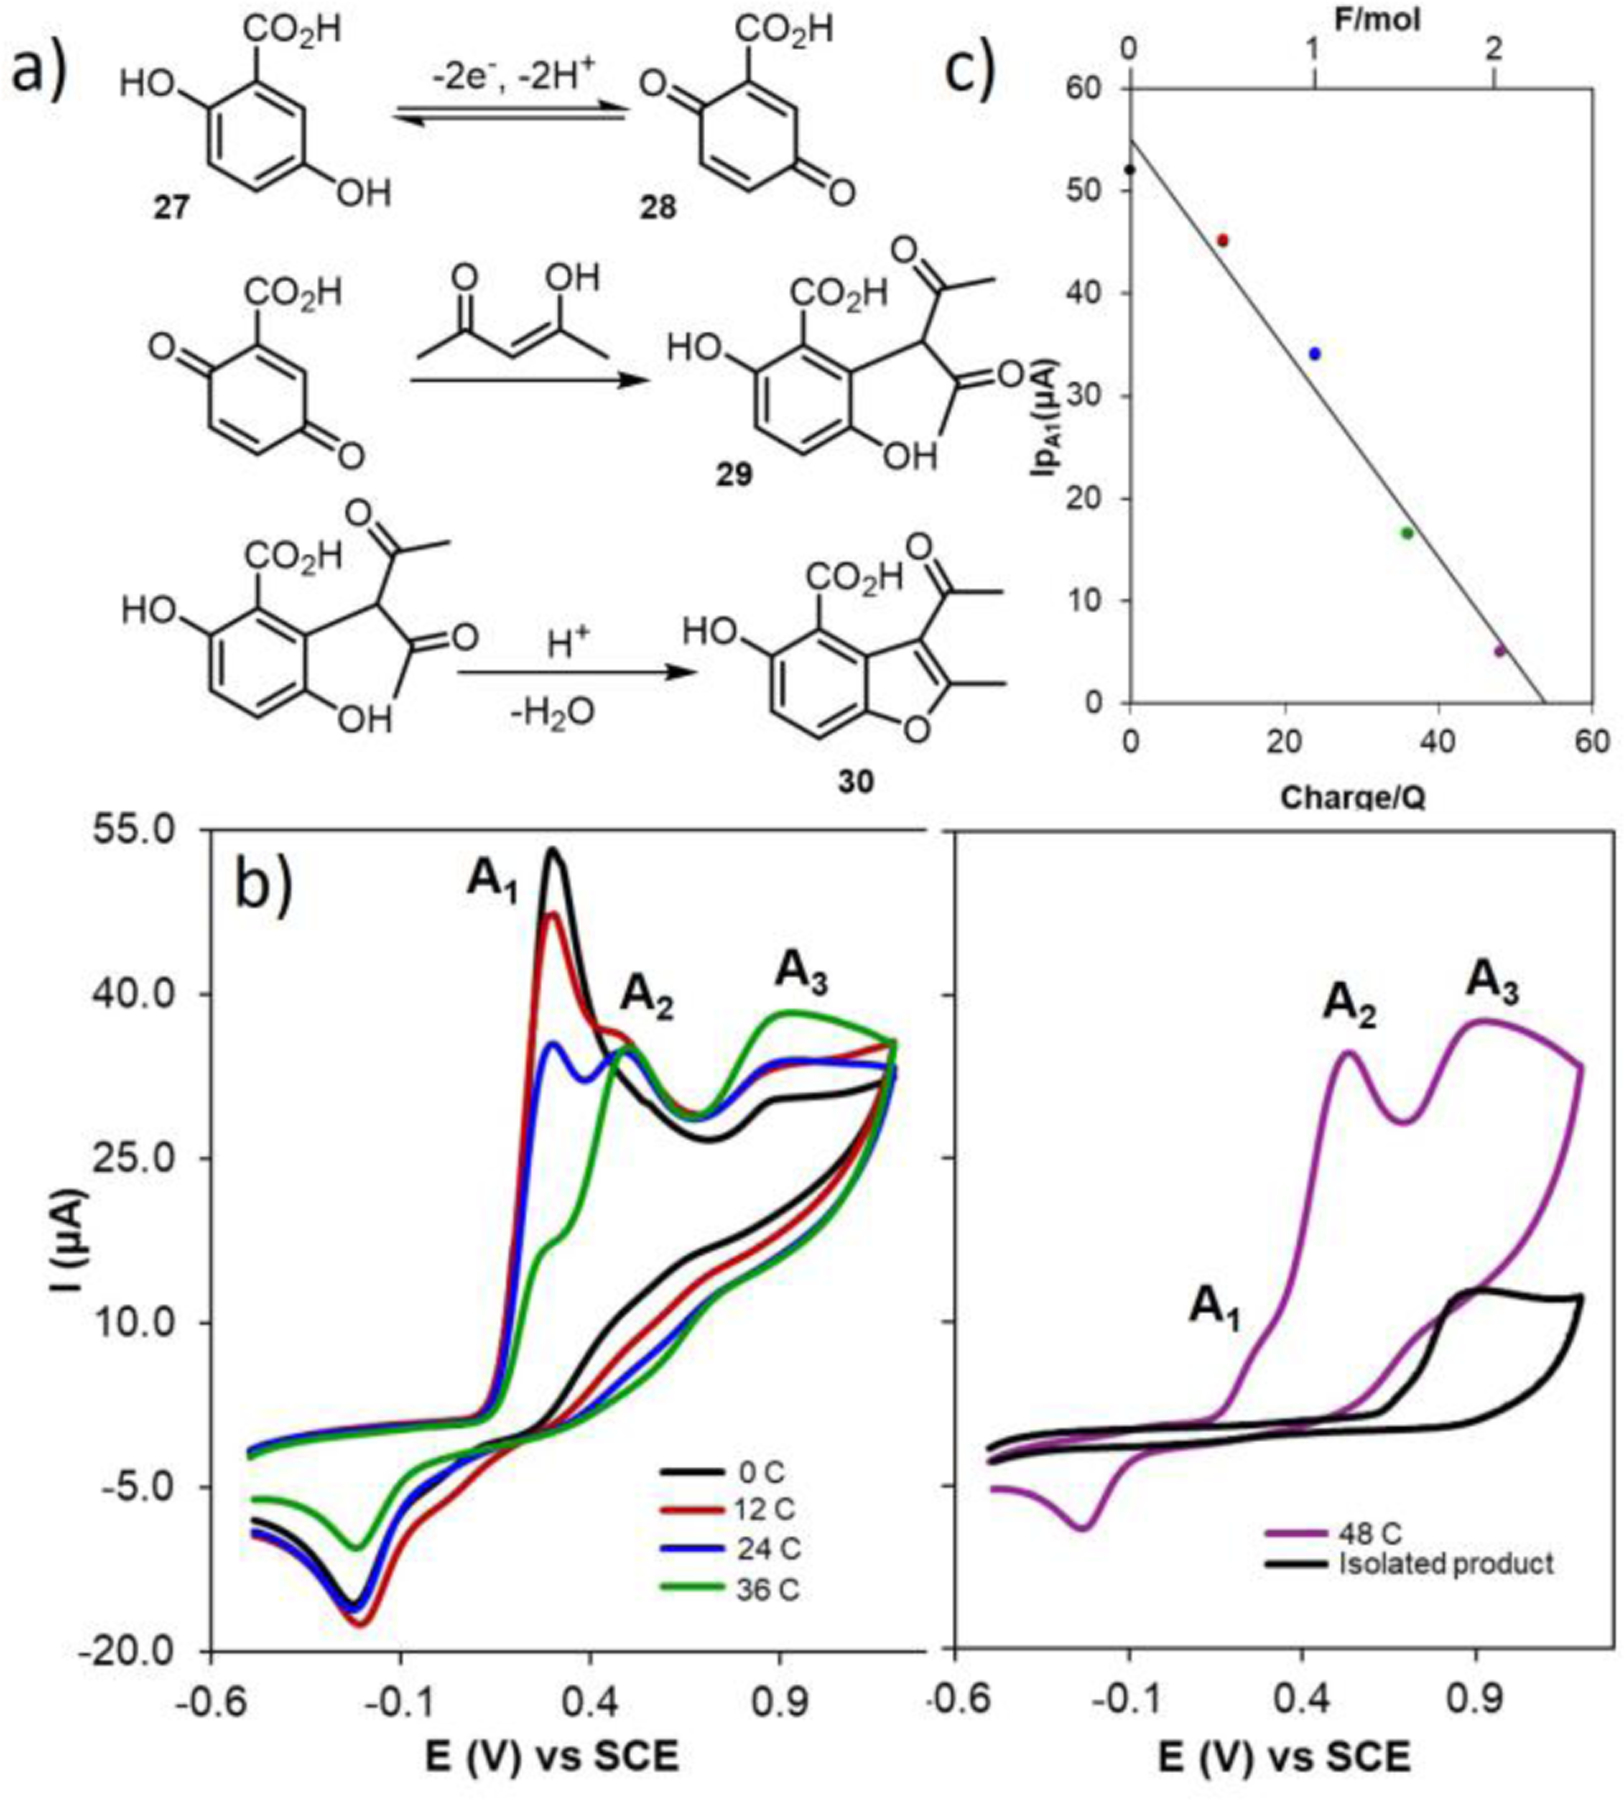
(a) General reaction scheme. (b) Cyclic voltammograms of 0.25 mmol 2,5-dihydroxybenzoic acid in the presence of 0.25 mmol acetylacetone in 0.2 M NaOAc solution at a glassy carbon electrode during controlled potential coulometry at 0.27 V versus SCE; after consumption of: 0 (black), 12 (red), 24 (blue), 36 (green), and 48 C (purple). Compared with the cyclic voltammogram of a saturated solution of final product 30 after separation and purification (black). (c) Variation of peak current Ip,o1 versus charge consumed. Scan rate 100 mV s−1. Reproduced from ref. 59 with permission from the Royal Society of Chemistry, copyright 2005.
Conclusions
This tutorial review has summarized the fundamental principles of cyclic voltammetry and chronoamperometry and the application of these techniques to the study of chemical and electrochemical reactions. The methods have been showcased in a series of representative organic and organometallic reactions, highlighting their broad utility as mechanistic tools. Voltammetric techniques, for example, may be used to measure redox potentials that often correlate with structural features of substrate molecules and/or catalysts. The measured potentials can be used to understand or predict reaction selectivity and catalyst efficiency. Voltammetric and amperometric methods may be used to probe reactions that feature coupled electrochemical and chemical reactions and often provide insights into the sequence of these steps. The use of rotating disk electrodes and microelectrodes in voltammetric and amperometric experiments provides a means to measure bulk concentrations of electroactive species present during chemical or electrochemical reactions. It is hoped that the presentation of the techniques and applications outlined herein will provide a foundation for their broader adoption by organic and organometallic chemists to understand and support the development of useful new chemical and electrochemical synthetic reactions.
Key Learning Points.
Cyclic voltammetry.
Chronoamperometry.
Molecular Electrochemistry and Reaction Mechanisms.
Coupled Chemical-Electrochemical Reactions.
Electrosynthesis.
Acknowledgments
The authors are grateful for funding from the following sources of funding, which have supported ongoing work on projects related to the topics presented in this article NSF CHE- 2154700 (MR), NSF CHE- 2154698 (SSS, ARA), NIH R35 GM134929 (SSS, DJA, LC). ARA also thanks Ministerio de Universidades of the Spanish Government and European Union funds – NextGenerationEU – for the postdoctoral Margarita Salas Fellowship (MSALAS-2022–20213).
Footnotes
Conflicts of interest
There are no conflicts to declare.
Notes and references
- 1.Costentin C and Savéant JM, Proc. Natl. Acad. Sci. U. S. A, 2019, 166, 11147–11152. [DOI] [PMC free article] [PubMed] [Google Scholar]
- 2.Barek J and Zima J, Electroanalysis, 2003, 15, 467–472. [Google Scholar]
- 3.McKenzie ECR, Hosseini S, Petro AGC, Rudman KK, Gerroll BHR, Mubarak MS, Baker LA and Little RD, Chem. Rev, 2022, 122, 3292–3335. [DOI] [PubMed] [Google Scholar]
- 4.Sandford C, Edwards MA, Klunder KJ, Hickey DP, Li M, Barman K, Sigman MS, White HS and Minteer SD, Chem. Sci, 2019, 10, 6404–6422. [DOI] [PMC free article] [PubMed] [Google Scholar]
- 5.Jing Q and Moeller KD, Acc. Chem. Res, 2020, 53, 135–143. [DOI] [PMC free article] [PubMed] [Google Scholar]
- 6.Savéant J, Elements of Molecular and Biomolecular Electrochemistry, John Wiley & Sons, Inc., Hoboken, NJ, USA, 2006. [Google Scholar]
- 7.Bard AJ and Faulkner LR, Electrochemical Methods: Fundamentals and Applications, John Wiley & Sons, Inc., 2nd edn., 2001. [Google Scholar]
- 8.Khalafi L and Rafiee M, in Encyclopedia ofPhysical Organic Chemistry, eds. Wang Z, Wille U and Juaristi E, 1st edn., 2017. [Google Scholar]
- 9.Elgrishi N, Rountree KJ, McCarthy BD, Rountree ES, Eisenhart TT and Dempsey JL, J. Chem. Educ, 2018, 95, 197–206. [Google Scholar]
- 10. The formal potential is an adjusted form of standard potential under a specified conditions e.g., pH, ionic strength, concentration of complexing agents.
- 11. Except if there is a reason to have both oxidized and reduced states of a redox couple in solution, typically electrochemical experiments are performed in a solution with only one of the redox states.
- 12. The electrode process described here is a reversible electrochemical reaction, in which the heterogeneous rate of electron transfer is fast, and both forms are stable at the timescale of cyclic voltammetry experiment. There are several possibilities considering the rate of electron transfer, and stability or reactivity of the electrode reaction products that cause irreversibility or deviation from this reversible behavior. The effect of chemical reaction on voltammograms are discussed in this review. To see the effect of rate of electron transfer and electrochemical irreversibility see the following three references.
- 13.Inzelt G, ChemTexts, 2015, 1, 2. [Google Scholar]
- 14.Seeber R, Zanardi C and Inzelt G, ChemTexts, 2015, 1, 18. [Google Scholar]
- 15.Seeber R, Zanardi C and Inzelt G, ChemTexts, 2016, 2, 8. [Google Scholar]
- 16.Goes SL, Mayer MN, Nutting JE, Hoober-Burkhardt LE, Stahl SS and Rafiee M, J. Chem. Educ, 2021, 98, 600–606. [DOI] [PMC free article] [PubMed] [Google Scholar]
- 17.Khalafi L, Cunningham AM, Hoober-Burkhardt LE and Rafiee M, J. Chem. Educ, 2021, 98, 3957–3961. [DOI] [PMC free article] [PubMed] [Google Scholar]
- 18. The time that E1 is applied is called induction period and the current are not collected and are not shown for a regular chronoamperometry experiment.
- 19. Typically a preliminary cyclic voltammetry experiment is required to measure the E°’, prior to chronoamperometric esperiment.
- 20. The reason for choosing 120 mV difference is that it is about 2 times of 59 mV and based on Nernst equation applying these potentials ensures quantitative redox reactions (more than 99%) at the electrode surface.
- 21.Qiu J, Matyjaszewski K, Thouin L and Amatore C, Macromol. Chem. Phys, 2000, 201, 1625–1631. [Google Scholar]
- 22. Non-Nernstian (i.e., quasireversible) electron transfer reactions exhibit kinetic limitations manifested as a peak-to-peak separation greater than 59 mV/n (n = number of electrons), but not so large as to be completely irreversible. This behavior also results in a change in the peak currents of both waves.
- 23.Yamago S, Kokubo K, Hara O, Masuda S and ichi Yoshida J, J. Org. Chem, 2002, 67, 8584–8592. [DOI] [PubMed] [Google Scholar]
- 24.Zhang NT, Zeng CC, Lam CM, Gbur RK and Little RD, J. Org. Chem, 2013, 78, 2104–2110. [DOI] [PubMed] [Google Scholar]
- 25.Herold S, Bafaluy D and Muñiz K, Green Chem, 2018, 20, 3191–3196. [Google Scholar]
- 26.Hickey DP, Schiedler DA, Matanovic I, Doan PV, Atanassov P, Minteer SD and Sigman MS, J. Am. Chem. Soc, 2015, 137, 16179–16186. [DOI] [PubMed] [Google Scholar]
- 27.Wang F, Rafiee M and Stahl SS, Angew. Chem. Int. Ed, 2018, 57, 6686–6690. [DOI] [PMC free article] [PubMed] [Google Scholar]
- 28.Collins KD and Glorius F, Nat. Chem, 2013, 5, 597–601. [DOI] [PubMed] [Google Scholar]
- 29.Nicholson RS and Shain I, Anal. Chem, 1964, 36, 706–723. [Google Scholar]
- 30.Bontempelli G, Magno F and Daniele S, Anal. Chem, 1985, 57, 1503–1504. [Google Scholar]
- 31. A working curve is constructed by plotting a characteristic chemical parameter, e.g., rate constant, versus an experimental observable, e.g., peak current, to relate or demonstrate a correlation.
- 32.Van Duyne RP and Reilley CN, Anal. Chem, 1972, 44, 153–158. [Google Scholar]
- 33.Parker VD and Bethell D, J. Am. Chem. Soc, 1987, 109, 5066–5072. [Google Scholar]
- 34.Afkhami A, Nematollahi D, Khalafi L and Rafiee M, Int. J. Chem. Kinet, 2005, 37, 17–24. [Google Scholar]
- 35.Wang F and Stahl SS, Acc. Chem. Res, 2020, 53, 561–574. [DOI] [PMC free article] [PubMed] [Google Scholar]
- 36.Gentry EC and Knowles RR, Acc. Chem. Res, 2016, 49, 1546–1556. [DOI] [PMC free article] [PubMed] [Google Scholar]
- 37.Peters BK, Rodriguez KX, Reisberg SH, Beil SB, Hickey DP, Kawamata Y, Collins M, Starr J, Chen L, Udyavara S, Klunder K, Gorey TJ, Anderson SL, Neurock M, Minteer SD and Baran PS, Science, 2019, 363, 838–845. [DOI] [PMC free article] [PubMed] [Google Scholar]
- 38.Hickey DP, Sandford C, Rhodes Z, Gensch T, Fries LR, Sigman MS and Minteer SD, J. Am. Chem. Soc, 2019, 141, 1382–1392. [DOI] [PubMed] [Google Scholar]
- 39.Sandford C, Fries LR, Ball TE, Minteer SD and Sigman MS, J. Am. Chem. Soc, 2019, 141, 18877–18889. [DOI] [PubMed] [Google Scholar]
- 40.Tang T, Jones E, Wild T, Hazra A, Minteer SD and Sigman MS, J. Am. Chem. Soc, 2022, 144, 20056–20066. [DOI] [PubMed] [Google Scholar]
- 41.Tang T, Hazra A, Min DS, Williams WL, Jones E, Doyle AG and Sigman MS, J. Am. Chem. Soc, 2023, 145, 8689–8699. [DOI] [PMC free article] [PubMed] [Google Scholar]
- 42.Elgrishi N, Kurtz DA and Dempsey JL, J. Am. Chem. Soc, 2017, 139, 239–244. [DOI] [PubMed] [Google Scholar]
- 43.Amatore C and Jutand A, Organometallics, 1988, 7, 2203–2214. [Google Scholar]
- 44.Nematollahi D and Rafiee M, J. Electroanal. Chem, 2004, 566, 31–37. [Google Scholar]
- 45.Cass AEG, Davis G, Francis GD, Allen H, Hill O, Aston WJ, Higgins IJ, Plotkin EV, Scott LDL and Turner APF, Anal. Chem, 1984, 56, 667–671. [DOI] [PubMed] [Google Scholar]
- 46.Rafiee M, Karimi B and Alizadeh S, ChemElectroChem, 2014, 1, 455–462. [Google Scholar]
- 47.Lin Q, Fu Y, Liu P and Diao T, J. Am. Chem. Soc, 2021, 143, 14196–14206. [DOI] [PMC free article] [PubMed] [Google Scholar]
- 48.Costentin C, Drouet S, Robert M and Savéant JM, J. Am. Chem. Soc, 2012, 134, 11235–11242. [DOI] [PubMed] [Google Scholar]
- 49.Gnaim S, Bauer A, Zhang HJ, Chen L, Gannett C, Malapit CA, Hill DE, Vogt D, Tang T, Daley RA, Hao W, Zeng R, Quertenmont M, Beck WD, Kandahari E, Vantourout JC, Echeverria PG, Abruna HD, Blackmond DG, Minteer SD, Reisman SE, Sigman MS and Baran PS, Nature, 2022, 605, 687–695. [DOI] [PMC free article] [PubMed] [Google Scholar]
- 50.Rafiee M, Miles KC and Stahl SS, J. Am. Chem. Soc, 2015, 137, 14751–14757. [DOI] [PMC free article] [PubMed] [Google Scholar]
- 51.Rafiee M, Konz ZM, Graaf MD, Koolman HF and Stahl SS, ACS Catal, 2018, 8, 6738–6744. [Google Scholar]
- 52. This is the definition of microelectrode based on IUPAC definition, reported in the following reference: “microelectrode has dimensions of tens of micrometers or less, down to submicrometer range”.
- 53.Stulík K, Amatore C, Holub K, Marecek V and Kutner W, Pure Appl. Chem, 2000, 72, 1483–92. [Google Scholar]
- 54.Amatore C, Jutand A and Le Duc G, Chem. - Eur. J, 2011, 17, 2492–2503. [DOI] [PubMed] [Google Scholar]
- 55.Amatore C and Pflüger F, Organometallics, 1990, 9, 2276–2282. [Google Scholar]
- 56.Nutting JE, Mao K and Stahl SS, J. Am. Chem. Soc, 2021, 143, 10565–10570. [DOI] [PMC free article] [PubMed] [Google Scholar]
- 57.Badalyan A and Stahl SS, Nature, 2016, 535, 406–410. [DOI] [PubMed] [Google Scholar]
- 58.Hoover JM, Ryland BL and Stahl SS, J. Am. Chem. Soc, 2013, 135, 2357–2367. [DOI] [PMC free article] [PubMed] [Google Scholar]
- 59.Nematollahi D and Rafiee M, Green Chem, 2005, 7, 638–644. [Google Scholar]