

Abstract
The lack of preventive and disease modifying therapies for temporal lobe epilepsy (TLE) is a major unmet medical need. Search for such therapies utilize mouse models and require detection of seizures in electroencephalography (EEG) recordings. The labor-intensive nature of reviewing EEGs spanning many weeks underscores the need for a method of automated detection. Here we report a simple automated method of detecting seizures in long term EEG recordings from electrodes implanted in the hippocampus in animal models of TLE. We utilize a 2-pronged approach that relies on the increase in power within the gamma band range (20–50hz) during the seizure followed by suppression of activity following the seizure (post-ictal suppression [PIS]). We demonstrate the utility of this method for detecting seizures in hippocampal and amygdala EEG recordings from multiple models of TLE.
Keywords: rodent epilepsy models, automated seizure detection, post-ictal suppression
1.1. Introduction
The persistence of seizures in 30% of patients with epilepsy despite optimal use of antiseizure drugs (Chen et al 2020) underscores the need to develop preventive and disease modifying therapies. Developing such therapies necessitates assessing effects on seizure occurrence over many weeks in animal models. The gold standard for seizure detection has been analysis of long-term EEG activity. Reviewing such data is time consuming and labor-intensive for even the most skilled electroencephalographers. Development of an automated approach for seizure detection in animal models of epilepsy would greatly advance the field. Unfortunately, automated detection of seizures in EEG recordings of mice in particular has proven particularly challenging because of their active behavior which generates EEG signals of non-cerebral origin.
Here we report a simple, automated method for detecting seizures in long term EEG recordings from electrodes implanted in the hippocampus in animal models of TLE that can be readily adapted across multiple analysis platforms. We utilize a 2-pronged approach that relies on the increase in power within the gamma band range (20–50hz) during the seizure followed by suppression of activity following the seizure (post-ictal suppression, PIS). We demonstrate the utility of this method for detecting seizures in hippocampal EEG recordings from multiple models of TLE.
1.2. Materials & Methods
1.2.1. Surgical procedures:
All animal procedures were done in accordance with IACUC approved protocols of Duke University. For the intra-amygdala and tail vein kainic acid infusion model, male mice between 35 and 45 days old, were anesthetized and implanted with a bipolar twisted wire electrode in the left dorsal hippocampus (AP: −2.0mm, ML: −1.5mm, DV: −1.7mm) to monitor EEG. For the Intra-amygdala kainate (IAK) model, an infusion cannula was also implanted into the right amygdala (AP: −1.0mm, ML: +3.1mm, DV: 1.7mm). A ground wire was connected to a skull screw over the cerebellum. The bipolar electrode was soldered to an 8-pin connector that connected to a Pinnacle Technologies A/D preamplifier and commutator (Pinnacle Technologies, part number 8408). EEG signals were recorded between the bipolar electrodes in the hippocampus. Animals recovered for at least 1 week at which time status epilepticus (SE) was induced as detailed below.
For kindling experiments, mice were surgically implanted with a twisted bipolar electrode in the right amygdala (AP: −1.0mm, ML: +3.1mm, DV: −4.6mm below dura) and a screw over the left frontal lobe. The skull screw was connected to a single pin, while the electrode was connected to two pins. Both implants were then secured to the skull with dental cement. Animals were given 1 week to recover from the implantation surgery at which time stimulations were initiated.
1.2.2. Seizure induction:
For the pilocarpine experiments, male and female CD1 mice were used. For all other experiments, C57Bl/6 mice were used (Charles River).
Pilocarpine –
Mice (male and female, CD1, Charles River) were pre-treated with N-methylscopalamine (2 mg/kg, intraperitoneal [IP]), injected with pilocarpine (100mg/kg) 30 min later, and immediately connected to the EEG monitoring system. If a seizure did not present within 30 minutes, then additional doses of pilocarpine were administered every 10 minutes until a seizure was detected in real-time by a trained observer. Initial seizures were allowed to resolve naturally, and mice were monitored for 12 days for spontaneous recurrent seizures (SRS).
IAK –
Kainic Acid (Fisher Scientific) was dissolved in phosphate buffered saline (pH 7.4) at a concentration of 1mg/ml and aliquoted, frozen, and stored at −80° C. On the day of infusion, an aliquot was removed from the freezer and allowed to come to room temperature prior to infusion; unused excess was discarded. Mice were connected to a Grass Systems amplifier and data recorder for detection of SE caused by the infusion. Infusion of KA was performed using a micro syringe (Hamilton) and syringe pump. A total volume of 300nL was administered at a rate of 60nL/min. Animals were acclimated to the chamber and baseline video-EEG was recorded for 10-minutes prior to initiating infusion of KA. Once the first electrographic seizure was detected, SE was allowed to continue for 40 to 45 minutes at which time animals were treated with diazepam (10mg/kg) and one hour later with lorazepam (6mg/kg). Mice were returned to their home cage for 24 hours, then moved to the long-term monitoring system, where continuous video-EEG recordings were performed for 28–40 days, the goal being to detect SRS.
Tail-vein KA –
Animals were gently restrained (Broome Style Rodent Restrainer, Plas Labs) and KA (10–12mg/kg) was infused into the lateral tail vein via a 30 gauge needle at an infusion rate of 70 ul/min as described in Drysdale et al (Drysdale et al 2021). Following infusion, the mouse was placed in a clear cage within view of the camera for two-hour video EEG observation using a Grass system until the SE resolved. Animals were then placed on the EEG rig for long-term seizure monitoring.
Flurothyl –
Seizures were induced following the methods described in Ferland et al (Ferland 2017). Flurothyl was freshly prepared at 10% in ethanol every 2 days. A plastic desiccator was modified so that a needle connected to a syringe pump could drip flurothyl into the sealed chamber. A clean cotton gauze square was suspended in the chamber lid. A mouse was placed in the bottom of the chamber, and a syringe pump administered drops of the convulsant at the rate of 6mL/min. The mouse was monitored for behavioral seizures and was removed from the chamber as soon as it exhibited a class 5 seizure (loss of posture/falling). Mice were exposed to flurothyl twice per day, separated by 4 hours per session where they rested in their home cages, for 7 consecutive days. Video-EEG recordings were performed between flurothyl exposures during the initiation process and for 2 weeks following the last flurothyl-evoked seizure.
Kindling –
Each animal was connected to an A-M Systems isolated pulse stimulator and both EEG and video were recorded. To determine the electrographic seizure threshold for each animal, a stimulus train (one second train of 60μA 1 msec biphasic pulses at frequency of 60 Hz) was administered and increased in increments of 20μA at one-minute intervals until an electrographic seizure was detected. Once electrographic seizure threshold was determined, each animal received 3 stimulations a day at the pre-determined EST, spaced at least 3 hours apart, until 3 consecutive sessions elicited a behavioral seizure of at least Class 4 (Racine).
1.2.3. Seizure Monitoring:
Spontaneous seizures were detected with continuous video-EEG monitoring which was initiated either immediately (Pilocarpine, Flurothyl, and Tail-vein Kainate models) or 24 hours (IAK) following chemically evoked seizures. EEG was recorded using head-mounted preamplifiers with 100X amplification and 1Hz high-pass filtering (Pinnacle Technologies, part number 8406). The electrical signal was digitized by 1401-Power2A A/D boards (Cambridge Electronic Design Ltd) and sampled at 500Hz with a 60Hz digital notch filter using Spike2 software. Video was captured using VMS Video Servers (GeoVision Inc) to multiplex IR cameras and compress the video files. A list of components is included as a supplementary table.
1.2.4. Data Processing:
EEG data was processed in 24-hour blocks to detect seizures. Seizures were detected by analysis of EEG data using an algorithm written and implemented using CED Spike2 software (version 9.13.). Detection of seizures was automated but fully user supervised; users have the option to accept or reject any detected seizure. This allows full transparency of the process, but the user supervision can be disabled or eliminated without altering the detection accuracy. EEG data was first down-sampled to reduce file size by low-pass filtering at 70Hz and visualized by plotting as a spectral decomposition of the EEG signal, referred to here as a “sonogram”. The user was asked to define a seizure-free baseline period for each animal. A power spectra was generated for the gamma frequency range (20–50Hz, 1 Hz resolution), and plotted with the sonogram. The algorithm then searched the power spectra for an excursion above a user-set threshold of a minimum duration (usually, 2X the SD of the baseline lasting at least 8 seconds). When a threshold excursion meeting these requirements was found, the algorithm then searched for a period of PIS following the elevation within 3 minutes. See Results for full details of the definition of the PIS. When an event that met both the criteria for elevated gamma power and a PIS is found, the user was asked to confirm the presence of a seizure or given the opportunity to reject the event. Separately, the reduced power spanning all frequencies inherent in PIS together with increased gamma were readily evident to a user viewing the sonogram, thereby providing a second layer of authentication. Restated, event detection is automated, but fully user supervised. All accepted seizures were quantified (time of seizure, duration of seizure, integral of the power in the gamma frequency normalized to a baseline period) and saved.
The sensitivity and accuracy of the automated seizure detection was tested using 24 hours of EEG data from 3 animals. Two experienced researchers read the EEG traces from all animals to find seizures: one human reviewer missed 1 seizure found by the other human. The algorithm successfully identified all seizures found by the human reviewers, and did not suggest any false-positives (see table for numbers of seizure found)
Source code can be found on GitHub at: https://github.com/emat2009/Spike2-PIS-Seizures/tree/main
1.3. Results
1.3.1. Developing an approach for reliable seizure detection
We sought to develop an automated method of detecting seizures in awake, tethered, but freely moving, adult mice that would be readily accessible to preclinical investigators. Analyses of local field potentials (LFPs) of EEG recorded from a bipolar electrode in the hippocampus and amplified with a preamplifier in the head mount revealed patterns of seizures distinct from non-seizure activity. These seizures recorded from hippocampal electrodes consisted of the abrupt onset of high amplitude (at least twice the pre-seizure baseline), rhythmic (at least 5 HZ) activity that evolved in amplitude and frequency with a duration of at least 5 seconds before terminating abruptly and starting a period of PIS (Fig 1A and B). A commonly used measure for automatically detecting a seizure seeks excursions away from a baseline mean, where large excursions might be measured by line length (coastline index) (Korn et al 1987), or a threshold crossing with additional time, or duration constraints. Such “threshold-based” approaches can be further refined by pre-processing the EEG signal and seeking increases in activity within a specified frequency band of the EEG, e.g. gamma frequency. Threshold-based approaches are robust and computationally efficient yet suffer from a high rate of false-positives, often due to artifacts caused by normal murine behavior. The artifactual increased activity in the theta and gamma frequency range due to normal behaviors necessitates inspecting time-locked video data to assess the behavior accompanying the event. Recognition of such events requires review by a trained electroencephalographer, a labor intensive and time-consuming endeavor essential for accurate detection of spontaneous recurrent seizures in epilepsy models.
Figure 1: The PIS is a distinctive feature of a spontaneous seizure.

A) A 24-hour trace of hippocampal EEG (local field potential [LFP] voltage trace) (lower, black) converted into a sonogram plot for simple visualization of the activity. In the sonogram, the PIS (denoted by dotted red box spanning both EEG and sonogram) is clearly seen as an absence of activity (dark blue in the color scale) across all frequency bands during 2 seizure events (denoted by arrows at top of sonogram). Note that a 60Hz notch filter has been applied to the EEG at the time of acquisition (reduced power due to notch filter denoted by arrow at right side of sonogram).
B) The Baseline, Seizure and PIS from the event denoted by dotted red box in A on an expanded time scale. During the Baseline period, the mouse was in a sleeping posture. The mouse startled and woke at the point marked by the # symbol. During the seizure the mouse exhibited mouth chewing (*), onset of forelimb clonus (†) that continued throughout the seizure, and then brief loss of posture (‡). The forelimb clonus continued for 29 additional seconds during the PIS. The total period of suppression lasted more than 4 minutes, during which time, the mouse groomed briefly and returned to a sleeping posture.
C) The sonogram spanning the seizure in panel A is expanded to highlight the activity in the gamma range prior to, during, and following the seizure – refer to color scale in A, white is maximum power. Note that during the PIS there is a complete suppression of activity across all frequency bands, including a strong reduction in theta. Refer to color scale in A, dark blue is 0dB power.
D) The power in the gamma (20–50Hz) band (red) is shown below the EEG LFP trace (black). This gamma power is the signal for detecting both threshold crossings (dashed line, 3SD above baseline mean), and the PIS. Note that the power exceeded the scale of the Y axis.
Initial studies examined LFPs recorded from the left hippocampus of an adult mouse that had undergone status epilepticus (SE) evoked by infusion of kainic acid (KA) into the right amygdala weeks prior to this recording session (Liu et al 2013). Examining a color-map sonogram of the LFP recorded from hippocampus of an adult mouse reveals an obvious marker of a seizure, namely the period of suppressed activity following a seizure, the PIS (Fig 1A and B). This suppression has been widely recognized (Bauer et al 2017, Krishnan & Bazhenov 2011, Molnar et al 2023, Payne et al 2018), and is particularly notable in that it extends across multiple frequency bands, nearly eliminating even theta activity (Fig 1A and 1C). This lack of activity across all frequencies renders detection of the PIS an attractive signal of a seizure. We are unaware of instances in which loss of activity across all frequencies occurs in EEG from normal humans or rodents; as such, detection of PIS can limit the number of false positives. Thus our search for a sensitive, specific, and automatable method for rapid screening of seizures in mice led us to combine the threshold-based method with a requirement for a PIS in the hippocampal EEG.
We empirically arrived at a mathematical description of the PIS, based on inspection of a set of 10 seizures identified by an experienced electroencephalographer. We defined the PIS as a period of at least 6 seconds when the power in the gamma frequency (20–50Hz) is at least 100X less than the maximum power during the seizure (Fig 2A). In practice, the algorithm performs the following steps. The algorithm defines a potential seizure start time when an increase in the 20–50Hz power (of 3X the standard deviation of a user-defined, seizure-free baseline) persisting for at least 5s is detected. The next 90s of EEG is then smoothed with a 2ms sliding window, and the values are sorted from minimum to maximum (Fig 2A and 2C). A comparison index value (inverse coefficient of variation) is created to account for cases of high variability in the 3 minimal and 3 maximum values. In our hands, there were never cases of high variability in the minimum values, but in some cases, there were very large variances in the maximum values (typically due to artifacts such as mouse chewing, Fig 2B); such events were then eliminated due to failing the 100X comparison (Fig 2C).
Figure 2: Statistical evaluation of PIS by seizure detection algorithm reduces false positives.

A) A baseline, seizure-free period of 30 minutes duration is defined by the user, and the mean and standard deviation of the power of frequencies spanning 20–50Hz is calculated (pale blue boxed area). This baseline mean value is used for the whole 24-hour period for each animal. A probable seizure event is triggered when the increase of power exceeds the threshold of the baseline mean + 3SD for a minimum of 5 seconds (horizontal grey dashed line). The algorithm then evaluates the ensuing 90s of the EEG and power spectra for the presence of a PIS (light red boxed area). Inset: even by visual inspection of the logarithmic scale (Y-axis), it is clear that the power during the seizure is at least 103 fold more than the post-seizure power, thereby far exceeding the criterion of 100X.
B) A potential seizure event (light red boxed area) is triggered by an increase of power that exceeds the mean + 3 SD over the baseline (light blue boxed area, grey dashed line indicates threshold) for over 5 seconds. In contrast to the seizure event depicted in panel A, no PIS is detected. Inset: visual inspection of the logarithmic scale reveals the small difference in power (far less than criterion of 100X) during versus following the event, thereby rejecting the event as a seizure. Review of the video revealed that the mouse was chewing on a toy at this time.
C) The values of the power spectra of the 90s search window are sorted from lowest values to highest values; this panel shows the ordered values from the potential seizure event in A-inset and B-inset. The inverse CoV (coefficient of variance) of the 3 smallest values must be less than that inverse CoV of the 3 highest values divided by 100. See Results for the calculation of the inverse CoV.
The index for the 3 minimum values and the 3 maximum values were then compared, and if the index for the maximum was 100X the index for the minimum, the detected event was considered a seizure (Fig 2C). Events detected by the algorithm can be confirmed by a user’s examination of the LFP and the animal’s behavior detected from the time locked video. This user-supervision of the algorithmically detected seizure events allows for maximum transparency of the data analysis pipeline but could be eliminated from the pipeline if so desired.
1.3.2. Testing sensitivity as seizures emerge in kindling
Knowing when during epileptogenesis that the PIS emerges is important to understanding the sensitivity of this approach for detection of seizures. To address this question, we utilized the kindling model in which focal application of an initially sub-convulsive electrical stimulus evokes a brief localized electrographic seizure without overt behavioral abnormality; repeated application of such stimuli evoke progressively longer and widely propagated electrographic seizures accompanied by behaviors of head nodding, forelimb clonus, rearing and falling (Goddard et al 1969). We examined recordings of LFPs of focal seizures detected from a bipolar electrode in the amygdala of an adult mouse during the initial stages of development of kindling. The seizures were evoked by a brief electrical stimulus through the same electrode (a one second train of 60 HZ bipolar rectangular pulses 480–520 μA) in a normal animal. Examination of the LFP revealed that the initial seizure consisted of a train of clustered spikes that evolved in amplitude and pattern (FIG 3A, left panels); this event was not associated with any overt change in behavior. Inspection of the sonogram of the event revealed increased power in the gamma frequency persisting for 8.7 seconds, sufficient to trigger the algorithm’s threshold for a seizure. Subsequent analysis of the 90s period from the start of the seizure revealed a brief suppression of activity across all frequencies, but the inverse CoV for this period was not sufficient for the algorithm to detect a PIS, that is, it failed to satisfy the second criterion for detection based on the index (>100X). Assessment of the subsequent stimulation-evoked electrographic seizures revealed that the algorithm identified the event evoked by the 3rd stimulation to be a seizure (Fig 3A, middle panel); events evoked by subsequent stimulations were detected as seizures (Fig 3A, right panel). This demonstrates that the network mechanisms underlying the PIS develop early in the course of epileptogenesis in this model and underscore the sensitivity of PIS as a tool for seizure detection.
Figure 3: The PIS appears at the onset of kindling and is independent of the severity or duration of the seizure, and is present in the hippocampus across numerous models of seizure disorders.
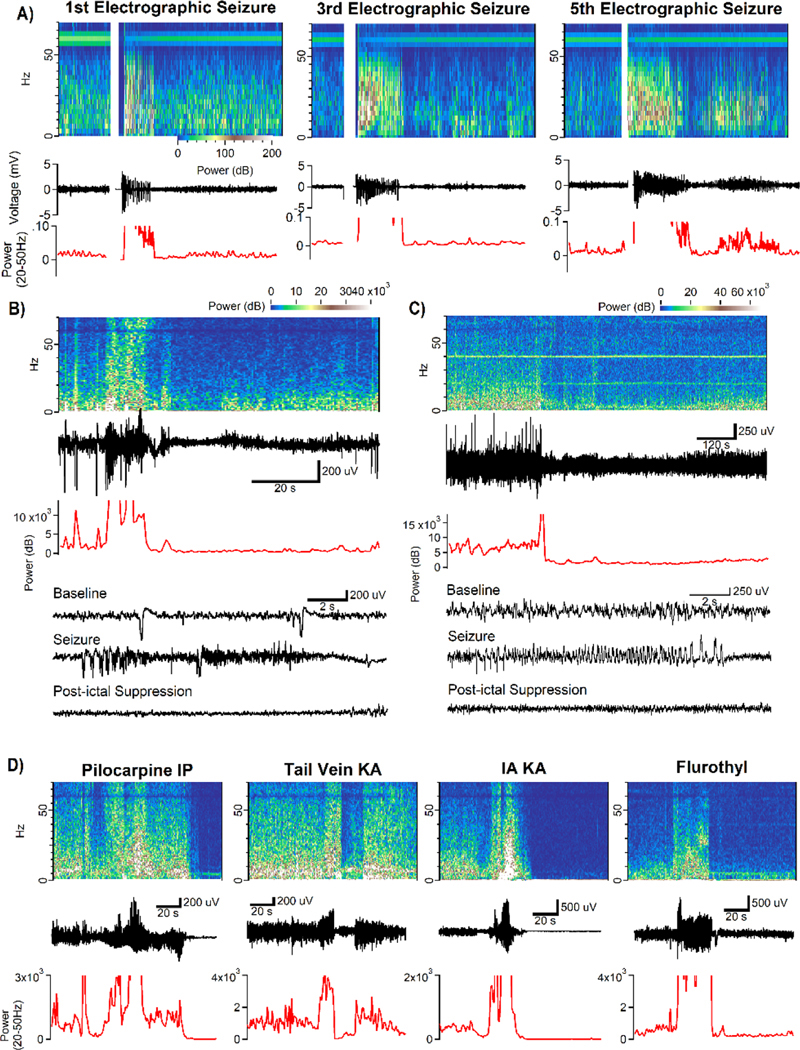
A) The PIS is small and brief, but still present at even the initial kindled afterdischarge. Over the course of subsequent stimulations, the PIS becomes more complete across all frequency bands and increases in duration.
B) Even seizures with low Racine scores (behavioral score of 1 in this instance) exhibit a clear PIS This animal had previously undergone SE induced by infusion of KA into the right amygdala.
C) Even very brief seizures have a PIS. The seizure in this example lasted less than 10s. This animal had previously undergone SE induced by infusion of KA into its tail vein. Expanded time frames of the Baseline, Seizure, and PIS are shown at bottom. Expanded time frames of the Baseline, Seizure, and PIS are shown at bottom of both B & C.
D) Spontaneous seizures measured by hippocampal LFP following (from left to right) intraperitoneal Pilocarpine injection, tail vein KA injection, intra-amygdala KA injection, and the inhalant flurothyl all exhibit prominent PIS following spontaneous seizures. The behavioral seizures associated with the electrographic seizures in each of the four models shown here were Racine Class 4 or higher.
The sensitivity of the algorithm was also evident in detection of spontaneously occurring electrographic seizures that were accompanied by minimal change in behavior (Class 1 on Racine scale, Figs 3B and 3C). Here the algorithm detected even brief spontaneous seizures by virtue of the increased power in gamma followed by the occurrence of PIS (Fig 3C). Importantly, the algorithm successfully detected spontaneous recurrent seizures in each of three models of epilepsy following SE induced by pilocarpine, infusion of KA into tail vein, or infusion of KA into amygdala (Fig 3D). Likewise the algorithm detected spontaneous recurrent seizures in a model in which epilepsy is induced by repeated inhalation of the convulsant gas, flurothyl (Ferland 2017) (Fig 3D, far right).
1.3.3. Validation against skilled humans
Validating the utility of the algorithm requires comparison of detection of seizures with that of the current “gold standard”, namely detection of seizures by human observers skilled in the art. Towards that end, the algorithmic approach was compared with results of two trained human reviewers using 24-hours of EEG data from 3 animals that had previously undergone SE induced by infusion of kainic acid into the right amygdala. The automated process detected a total of 11 seizures in the three animals, which was matched by one of the human reviewers. The second reviewer detected 10 seizures but missed one seizure (Table 1, left). This experiment was repeated in which two additional human reviewers examined 24 hours of EEG data from each of three additional animals (Table 1, right). The two human reviewers identified the same events to be seizures in each of the three animals and these findings were compared to the performance of the algorithm. The algorithm successfully detected each of the 9 seizures in animal 105095 (no false negatives) and detected a single event deemed not to be seizure by the human reviewers (1 false positive). The algorithm detected 43 of 43 seizures in animal 105508 and detected 1 event deemed not to be seizure by the human reviewers (1 false positive). The algorithm identified three events in animal 105093 each of which was deemed a seizure by human reviewers (no false positives or false negatives). In sum, independent human reviewers identified a total of 66 events to be seizures. The algorithm detected 66 of these 66 events (false negative rate of 0%) and identified 2 events deemed not to be seizure (false positive rate of 3%).
Table 1:
Comparison of seizure detection sensitivity between trained human reviewers and the automated algorithm

|
We further inspected the 2 false positive events detected by the algorithm but judged by human reviewers to not be seizures. In both cases, the EEG record showed a seizure which subsided with between 3 and 10 seconds of suppression, then reemerged into high frequency activity, followed by a second PIS. We intentionally did not include a minimum time between seizure events in the algorithm which would have suppressed the second seizure detection in these 2 cases, but at the possible cost of missing seizures that occur with high frequency. Therefore, the algorithm counted each episode of high frequency activity as a separate seizure, while the human reviewers counted the whole series as a single event. These edge cases support the inclusion of user-supervision in the algorithm; users can determine whether they will accept both periods of high-frequency activity as separate seizures or reject the algorithmic determination and count only a single multi-phase event.
1.4. Discussion
We sought to develop an automated method of detecting seizures in animal models of TLE that utilize tethered but freely-moving adult mice. EEG was recorded from electrodes within hippocampus and amplified with head-mounted preamplifiers, thereby providing high quality signals almost exclusively of cerebral origin. Features of the EEG patterns of seizures led us to design an algorithm that involves detection of increased power in gamma frequency followed by PIS. The algorithm performed favorably in comparison to human reviewers’ analyses of long-term EEG recordings of epileptic mice, proving to be both sensitive (3% false negatives) and specific (1% false positives). The algorithm successfully detected seizures in five different models of TLE. Analyses of the kindling model revealed emergence of PIS and successful detection of seizures by the algorithm in the initial stages of epileptogenesis. We conclude that this algorithm provides a simple, automated method of detecting seizures in awake tethered but freely moving adult mice and can be easily implemented by preclinical investigators across any software platform.
The time consuming and labor-intensive nature of detecting seizures in EEG recordings spanning days to weeks triggered efforts for automated methods initially in humans and later in experimental animals. Automated methods of detecting seizures in human EEG were implemented four decades ago by Jean Gotman and colleagues who systematically assessed their sensitivity and specificity compared to human electroencephalographers (Gotman 1990). This technology was then deployed for detecting seizures in experimental models of rats (Bertram & Cornett 1993). Advanced computerized methodologies were subsequently deployed by many investigators (reviewed by Moyer et al 2017). Notably, a method utilizing advanced time frequency analysis of EEG signals recorded from skull screws successfully detected both temporal lobe and generalized spike wave seizures in multiple animal models (Casillas-Espinosa et al 2019). In contrast to rats, many fewer reports appeared for automated seizure detection in mice (Anjum et al 2018, Bergstrom et al 2013). A comprehensive study of mice utilized a machine learning approach termed Epi-AI in which EEG data collected from epidural recordings overlying neocortex of three mouse models of epilepsy (Dravet syndrome and the IAK model in two distinct genetic backgrounds) was used as a training set (Wei et al 2021). Additional mice from these three models as well as mice from a fourth model (epilepsy emerging after pilocarpine SE) were used as an independent test set to evaluate the sensitivity and selectivity of the method in comparison to skilled human electroencephalographers. The Epi-AI algorithm exhibited a sensitivity of 76% and specificity of 98% in the model (epilepsy induced by pilocarpine SE) not used in developing the approach.
The approach reported here is sharply focused on detection of seizures in mouse models of TLE. Towards that end, a bipolar recording electrode was placed directly in hippocampus, a structure engaged in seizure activity. The EEG signals recorded from an electrode embedded in the circuitry generating the seizure are almost certainly more robust than recordings from epidural electrodes overlying neocortex which are spatially separated from circuits in the temporal lobe. The use of a preamplifier in the headmount reduced the contamination of EEG by signals of non-cerebral origin (e.g. chewing, movement etc), further facilitating detection of seizure activity. In contrast to methods utilizing time frequency analysis or machine learning, the algorithm described here was developed simply by visual analysis of features evident in the spectrograms of seizures, specifically the increased power in gamma frequency during the event followed by the striking reduction of activity spanning all frequencies, the PIS. Requiring an increase of gamma power to be followed by PIS provided remarkable sensitivity and specificity of this simple algorithm as assessed by comparison to findings of human electroencephalographers in extensive studies of the IAK model. To our knowledge, the reduced activity spanning all frequencies does not occur in EEG of normal humans or rodents, thereby enhancing the value of this measure in reducing false positives associated with increased gamma power. The algorithm successfully detected seizures in three additional models. The emergence of detectable PIS following the third evoked focal seizure in the kindling model demonstrates that even brief focal seizures early in the course of epileptogenesis can be detected with our algorithm. Performance of our algorithm with seizures in a generalized spike-wave epilepsy or with EEG data acquired with different methods (e.g. from epidural recordings over neocortex of temporal lobe seizures) will require additional study.
Supplementary Material
Highlights.
Detection of seizures in mouse models of temporal lobe epilepsy is essential for assessing putative preventive and disease modifying therapies.
The gold standard method has been analyses of long-term EEG recordings by skilled humans, a labor intensive and time-consuming task.
We report and validate a simple, automated method for detecting seizures in long term EEG recordings of awake, tethered but freely moving adult mice in five models.
This method will be freely available to all investigators and easily adaptable across different software platforms.
1.5. Acknowledgments
We thank Thiri Lin, Dylan Tamayo, and Enhui Pan for technical assistance with these experiments. This work was supported by NIH grants R01NS097717 & R01NS056217 to JOM; T32-GM007171 to KK & SCH via the Duke Medical Scientist Training Program.
Footnotes
Ethical Statement: We confirm that we have read the Journal’s position on issues involved in ethical publication and affirm that this report is consistent with those guidelines.
Conflict of Interest: None of the authors has any conflict of interest to disclose.
Publisher's Disclaimer: This is a PDF file of an unedited manuscript that has been accepted for publication. As a service to our customers we are providing this early version of the manuscript. The manuscript will undergo copyediting, typesetting, and review of the resulting proof before it is published in its final form. Please note that during the production process errors may be discovered which could affect the content, and all legal disclaimers that apply to the journal pertain.
Data Availability:
The basic code used to detect seizures will be made freely available to interested researchers on a secure website (Dropbox or Github).
1.6 Literature
- Anjum SMM, Kaufer C, Hopfengartner R, Waltl I, Broer S, Loscher W. 2018. Automated quantification of EEG spikes and spike clusters as a new read out in Theiler’s virus mouse model of encephalitis-induced epilepsy. Epilepsy Behav 88: 189–204 [DOI] [PubMed] [Google Scholar]
- Bauer PR, Thijs RD, Lamberts RJ, Velis DN, Visser GH, et al. 2017. Dynamics of convulsive seizure termination and postictal generalized EEG suppression. Brain 140: 655–68 [DOI] [PMC free article] [PubMed] [Google Scholar]
- Bergstrom RA, Choi JH, Manduca A, Shin HS, Worrell GA, Howe CL. 2013. Automated identification of multiple seizure-related and interictal epileptiform event types in the EEG of mice. Sci Rep 3: 1483. [DOI] [PMC free article] [PubMed] [Google Scholar]
- Bertram EH, Cornett J. 1993. The ontogeny of seizures in a rat model of limbic epilepsy: evidence for a kindling process in the development of chronic spontaneous seizures. Brain research 625: 295–300 [DOI] [PubMed] [Google Scholar]
- Casillas-Espinosa PM, Sargsyan A, Melkonian D, O’Brien TJ. 2019. A universal automated tool for reliable detection of seizures in rodent models of acquired and genetic epilepsy. Epilepsia 60: 783–91 [DOI] [PubMed] [Google Scholar]
- Chen Z, Brodie MJ, Kwan P. 2020. What has been the impact of new drug treatments on epilepsy? Curr Opin Neurol 33: 185–90 [DOI] [PubMed] [Google Scholar]
- Drysdale ND, Matthews E, Schuetz E, Pan E, McNamara JO. 2021. Intravenous kainic acid induces status epilepticus and late onset seizures in mice. Epilepsy Res 178: 106816 [DOI] [PMC free article] [PubMed] [Google Scholar]
- Ferland RJ. 2017. The Repeated Flurothyl Seizure Model in Mice. Bio Protoc 7 [DOI] [PMC free article] [PubMed] [Google Scholar]
- Goddard GV, McIntyre DC, Leech CK. 1969. A permanent change in brain function resulting from daily electrical stimulation. Exp Neurol 25: 295–330 [DOI] [PubMed] [Google Scholar]
- Gotman J 1990. Automatic seizure detection: improvements and evaluation. Electroencephalogr Clin Neurophysiol 76: 317–24 [DOI] [PubMed] [Google Scholar]
- Korn SJ, Giacchino JL, Chamberlin NL, Dingledine R. 1987. Epileptiform burst activity induced by potassium in the hippocampus and its regulation by GABA-mediated inhibition. Journal of neurophysiology 57: 325–40 [DOI] [PubMed] [Google Scholar]
- Krishnan GP, Bazhenov M. 2011. Ionic dynamics mediate spontaneous termination of seizures and postictal depression state. The Journal of neuroscience : the official journal of the Society for Neuroscience 31: 8870–82 [DOI] [PMC free article] [PubMed] [Google Scholar]
- Molnar L, Ferando I, Liu B, Mokhtar P, Domokos J, Mody I. 2023. Capturing the power of seizures: an empirical mode decomposition analysis of epileptic activity in the mouse hippocampus. Front Mol Neurosci 16: 1121479 [DOI] [PMC free article] [PubMed] [Google Scholar]
- Moyer JT, Gnatkovsky V, Ono T, Otahal J, Wagenaar J, et al. 2017. Standards for data acquisition and software-based analysis of in vivo electroencephalography recordings from animals. A TASK1-WG5 report of the AES/ILAE Translational Task Force of the ILAE. Epilepsia 58 Suppl 4: 53–67 [DOI] [PMC free article] [PubMed] [Google Scholar]
- Payne DE, Karoly PJ, Freestone DR, Boston R, D’Souza W, et al. 2018. Postictal suppression and seizure durations: A patient-specific, long-term iEEG analysis. Epilepsia 59: 1027–36 [DOI] [PubMed] [Google Scholar]
- Wei L, Boutouil H, R RG, Mamad O, Heiland M, et al. 2021. Detection of spontaneous seizures in EEGs in multiple experimental mouse models of epilepsy. J Neural Eng 18 [DOI] [PubMed] [Google Scholar]
Associated Data
This section collects any data citations, data availability statements, or supplementary materials included in this article.
Supplementary Materials
Data Availability Statement
The basic code used to detect seizures will be made freely available to interested researchers on a secure website (Dropbox or Github).