

Abstract
Heterogeneity usually restricts conventional mass spectrometry to molecular weights less than around a megadalton. As a single-particle technique, charge detection mass spectrometry (CDMS) overcomes this limitation. In CDMS, the mass-to-charge (m/z) ratio and charge are measured simultaneously for individual ions, giving a direct mass measurement for each ion. Recent applications include the analysis of viruses, virus-like particles, vaccines, heavily glycosylated proteins, and gene therapy vectors.
Introduction to CDMS
Soft ionization techniques, especially electrospray, allow non-covalent interactions to be preserved after ions are transferred into the gas phase for interrogation by mass spectrometry (MS). This, along with the development of new strategies to transmit and detect high molecular weight (MW) ions, has enabled the analysis of large biomolecular complexes by MS [1–5]. However, the mass range available to conventional MS is limited, leaving many high MW samples like viruses and virus-like particles (VLPs) inaccessible. This limitation results because electrospray creates a distribution of charge states for each mass species, yielding a series of peaks in the mass-to-charge ratio (m/z) spectrum that is measured. If the m/z peaks are well resolved, the charge associated with each peak can be determined from their spacing and the mass obtained from the m/z and charge [6]. Heterogeneity broadens the m/z peaks, making it difficult to assign the charge. There are several sources of heterogeneity, including post-translational modifications, salt adducts, counterions, and trapped solvent. Heterogeneity increases with size and usually limits conventional MS to masses less than around a megadalton. Measurements have been reported for a few highly purified homogeneous samples with larger MWs [7,8]. However, heterogeneity can also prevent the MS analysis of much smaller species such as heavily glycosylated proteins. In this short review, charge detection mass spectrometry (CDMS) is discussed as a solution to the heterogeneity problem. Just like conventional MS, in CDMS the m/z ratio is measured, but instead of relying on charge state assignment after the measurement, the charge is measured along with the m/z for each ion, allowing for direct determination of each ion’s mass. Measurements performed for many particles are then binned to give the mass distribution. This technology opens the door to accurate MW measurements into the gigadalton regime.
In CDMS, ions are detected by passing them through a conducting cylinder. When an ion enters the cylinder, it induces a charge that dissipates when it leaves. If the cylinder is long enough the induced charge equals the charge on the ion. This approach was first used in the early 1960s to measure masses for micron-sized metal particles [9]. Fuerstenau and Benner adapted it to electrosprayed ions in the 1990s, but electrical noise led to a high charge uncertainty (150 e) [10–12]. Trapping the ions in an electrostatic linear ion trap (ELIT) so that they oscillate back and forth through the detection cylinder [13–15] along with improvements in amplifier design and signal processing [16–22] has brought us to where the charge can be measured with an uncertainty (RMSD) of 0.2 e (elementary charges). With this uncertainty, charge states are well resolved in the charge spectrum and ions can be assigned to integer charge states with a low error rate.
A schematic diagram of a illustrative CDMS instrument is shown in Figure 1A. Ions are generated by electrospray and enter the instrument through a capillary. The resulting supersonic jet is thermalized, and the ions are desolvated in an ion funnel/ion carpet hybrid (FUNPET) [23]. The ions then pass through a radiofrequency (RF) hexapole, where their kinetic energy is set. The ion beam is radially compressed in a segmented RF quadrupole, and then the ions are focused into a dual hemispherical deflection energy analyzer (HDA) where a narrow band of ion kinetic energies are transmitted into the ELIT. Figure 1B shows a cross-section through the ELIT showing the central detection cylinder located between the endcaps. The endcap potentials are switched between transmission and trapping modes to trap ions that oscillate back and forth through the detection cylinder. When inside, the ion induces a charge on the cylinder which is detected by a charge sensitive amplifier. A time domain signal from a 100 ms trapping event is shown in Figure 1C. The inset shows an expanded view of the signal from 41 to 42 ms that shows oscillations due to the ion passing through the cylinder. Figure 1D shows a fast Fourier transform (FFT) of the 100 ms signal. The trapped ion’s m/z ratio is determined from the oscillation frequency and its charge is obtained from the amplitude of the fundamental in the FFT.
Figure 1. How CDMS measurements are performed.
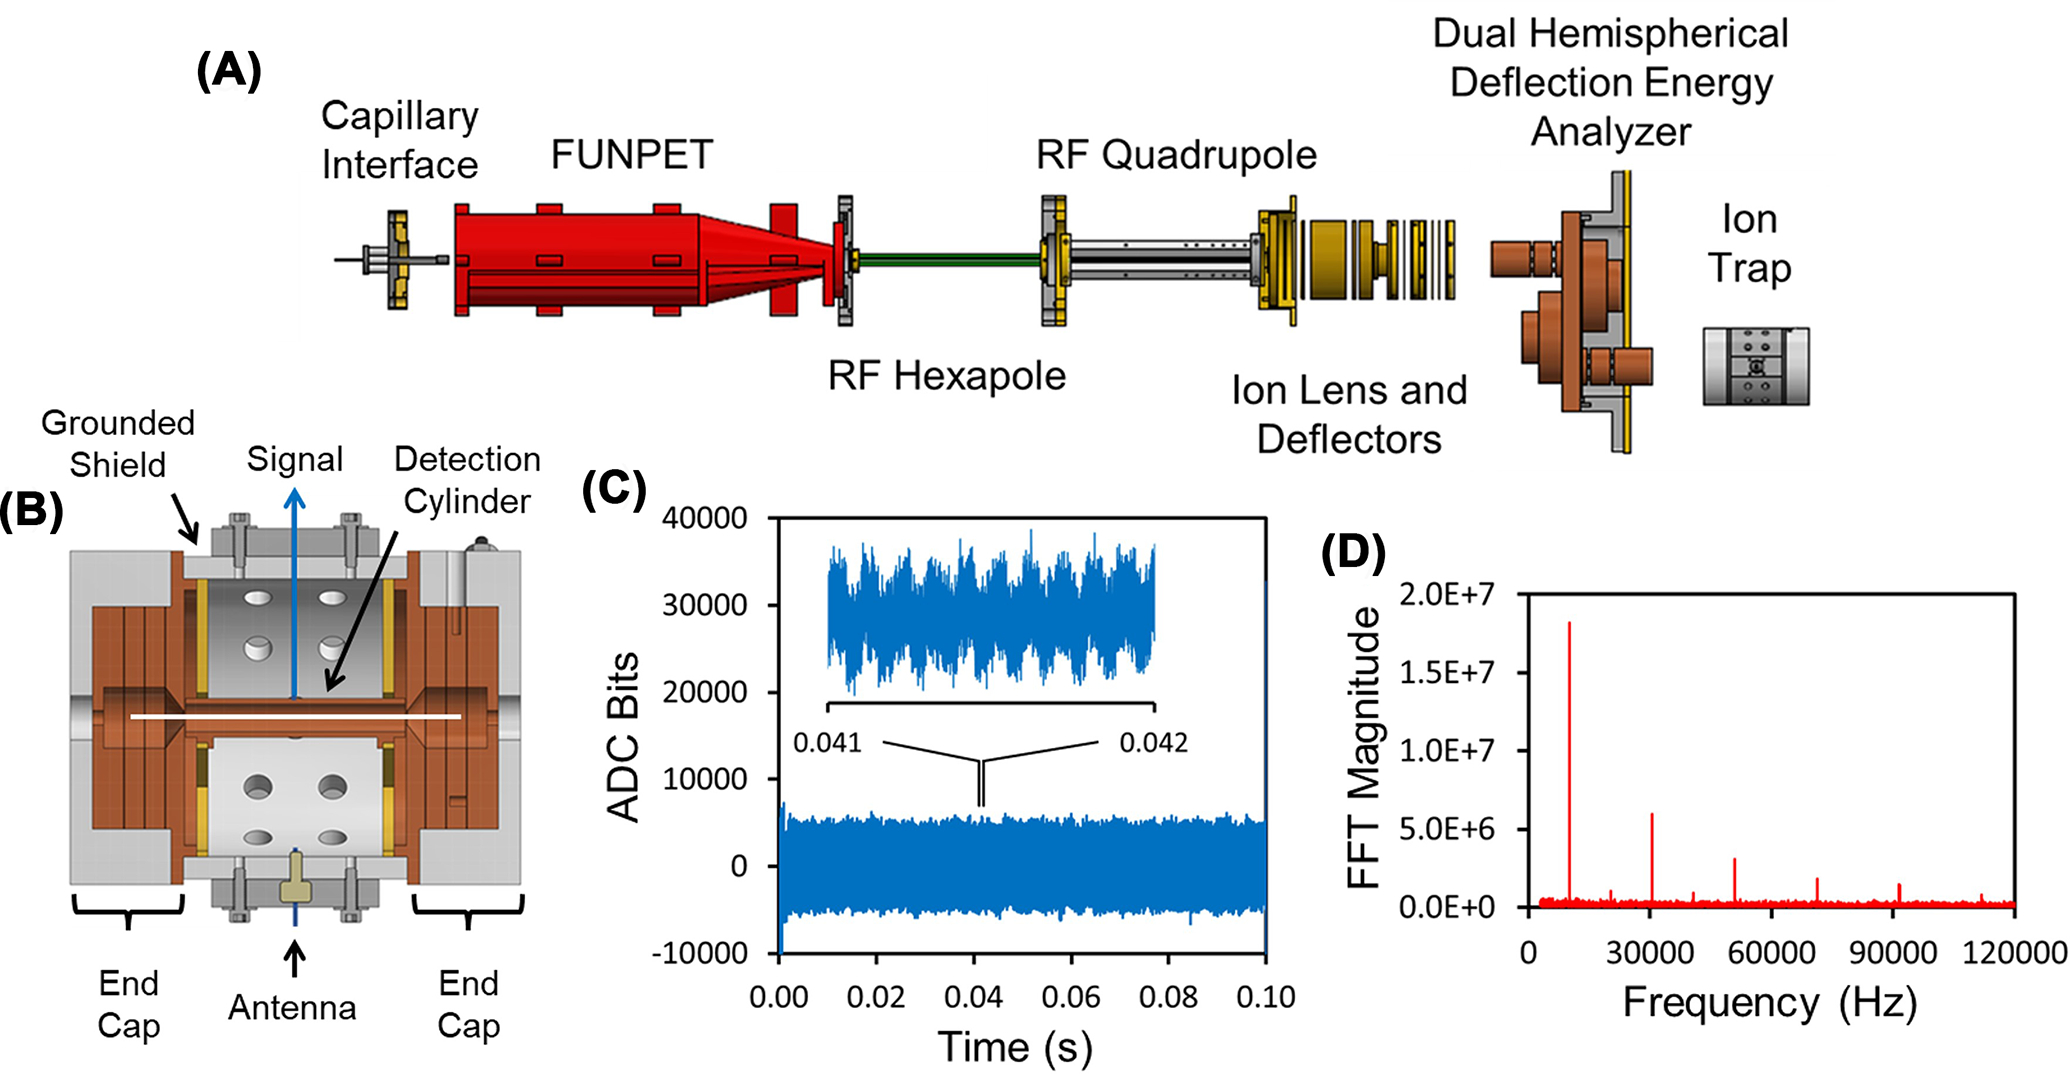
(A) Schematic diagram showing main components of an illustrative CDMS instrument using an ELIT. (B) Cross-section of an ELIT showing the detection cylinder between two end-caps. (C) Time domain signal from a 100 ms trapping event for a single ion. The inset shows the periodic oscillations of an ion over a 1 ms period. (D) Fast Fourier transform of the full trapping event in (C).
Research-grade CDMS instruments are currently available in a few laboratories in the US and Europe [24–28]. The technology is currently being commercialized and will become more widely available soon. Individual ion measurements have been reported on two other platforms. In the 1990s, Smith and co-workers measured masses for individual ions using Fourier transform ion cyclotron resonance (FT-ICR) [29]. More recently, Kelleher and co-workers performed individual ion measurements on an Orbitrap [30,31]. Their approach which they called Individual Ion Mass Spectrometry (I2MS) has now been commercialized as a Direct Mass Technology Mode on the Orbitrap. Heck and co-workers have also performed individual ion measurements using a slightly different way of analyzing the data [32].
In CDMS, the ion is surrounded by the detection cylinder and the induced charge equals the charge on the ion regardless of the ion’s trajectory. This allows the charge to be measured very accurately—to within a fraction of an elementary charge even for ions with hundreds of charges [21]. In the Orbitrap and FTICR instruments, the electrodes that detect the induced charge do not surround the ion, thus the full charge is not detected, and the part that is detected depends on the ion’s trajectory (i.e., how close the ion is to the detector electrodes) [33]. Since the ions have slightly different trajectories, this leads to an uncertainty in the charge measurement which amounts to approximately 4% in the case of Orbitrap I2MS. This limits the mass resolving power to around 25 for heterogeneous samples where m/z charge states are not resolved.
In what follows we briefly describe several studies of viruses and VLPs (taken mainly from our own work) to illustrate the types of problems CDMS and the other individual ion methods can be used to investigate.
Heavily glycosylated surface proteins—SARS-CoV-2 spike trimer
Glycosylation is one of the most common post translational modifications. It plays an important role in virus anti-genicity and infectivity. The surface proteins of SARS-CoV, HIV, and Ebolavirus are all extensively glycosylated. Since each glycosite is usually populated by several different glycans, the number of possible glycoforms can become astronomically large. The resulting mass distribution cannot be analyzed by conventional MS. Glycosylation is usually studied using a bottom-up approach such as glycoproteomics where glycoproteins are enzymatically digested to give glycopeptides, which are analyzed by liquid chromatography-MS [34]. This approach gives information on the glycosylation sites as well as the glycans found at each site.
The SARS-CoV-2 spike trimer has 66 N-linked glycosites. The glycans occupying each site have been determined by glycoproteomics [35]. Considering glycans with populations >1%, 8.2 × 1075 different glycoforms would be expected (assuming glycosylation at different sites is not correlated) [36]. Figure 2 shows CDMS measurements for a spike trimer derived from HEK293 cells. Figure 2A shows the m/z spectrum of the trimer. Because of heterogeneity, charge states are not resolved. Figure 2B shows the charge spectrum measured for the trimer which shows near baseline resolution of the charge states. The blue line in Figure 2C shows the mass distribution for the spike trimer. This distribution was obtained by multiplying the m/z ratio for each ion by its integer charge and then binning the masses. The red line in Figure 2C shows the mass distribution calculated from the glycoproteomics results. The measured distribution is at a significantly higher mass, probably because the abundances of larger complex glycoforms are underestimated in the glycoproteomics measurements. Similar behavior was found for several variants. In contrast, Heck and co-workers recently reported Orbitrap I2MS measurements for a spike protein trimer where they found an average mass in exact agreement with that expected from the protein sequence mass and the glycan mass expected from glycoproteomics [37]. However, the results of Stiving et al., who also used Orbitrap I2MS, agree with the CDMS measurements described above [38]. Heck used a different variant, but it is not clear why one variant should be different from all the others studied. The measured peak in Figure 2C (blue line) is much broader than the distribution calculated from the glycoproteomic results (red line) (all three studies concur on this point). This observation suggests that glycan processing is correlated, so that, for some trimers most of the glycosites are lightly processed while for others most of them are heavily processed.
Figure 2. CDMS measurements for SARS-CoV-2 spike protein trimer derived from HEK293 cells.
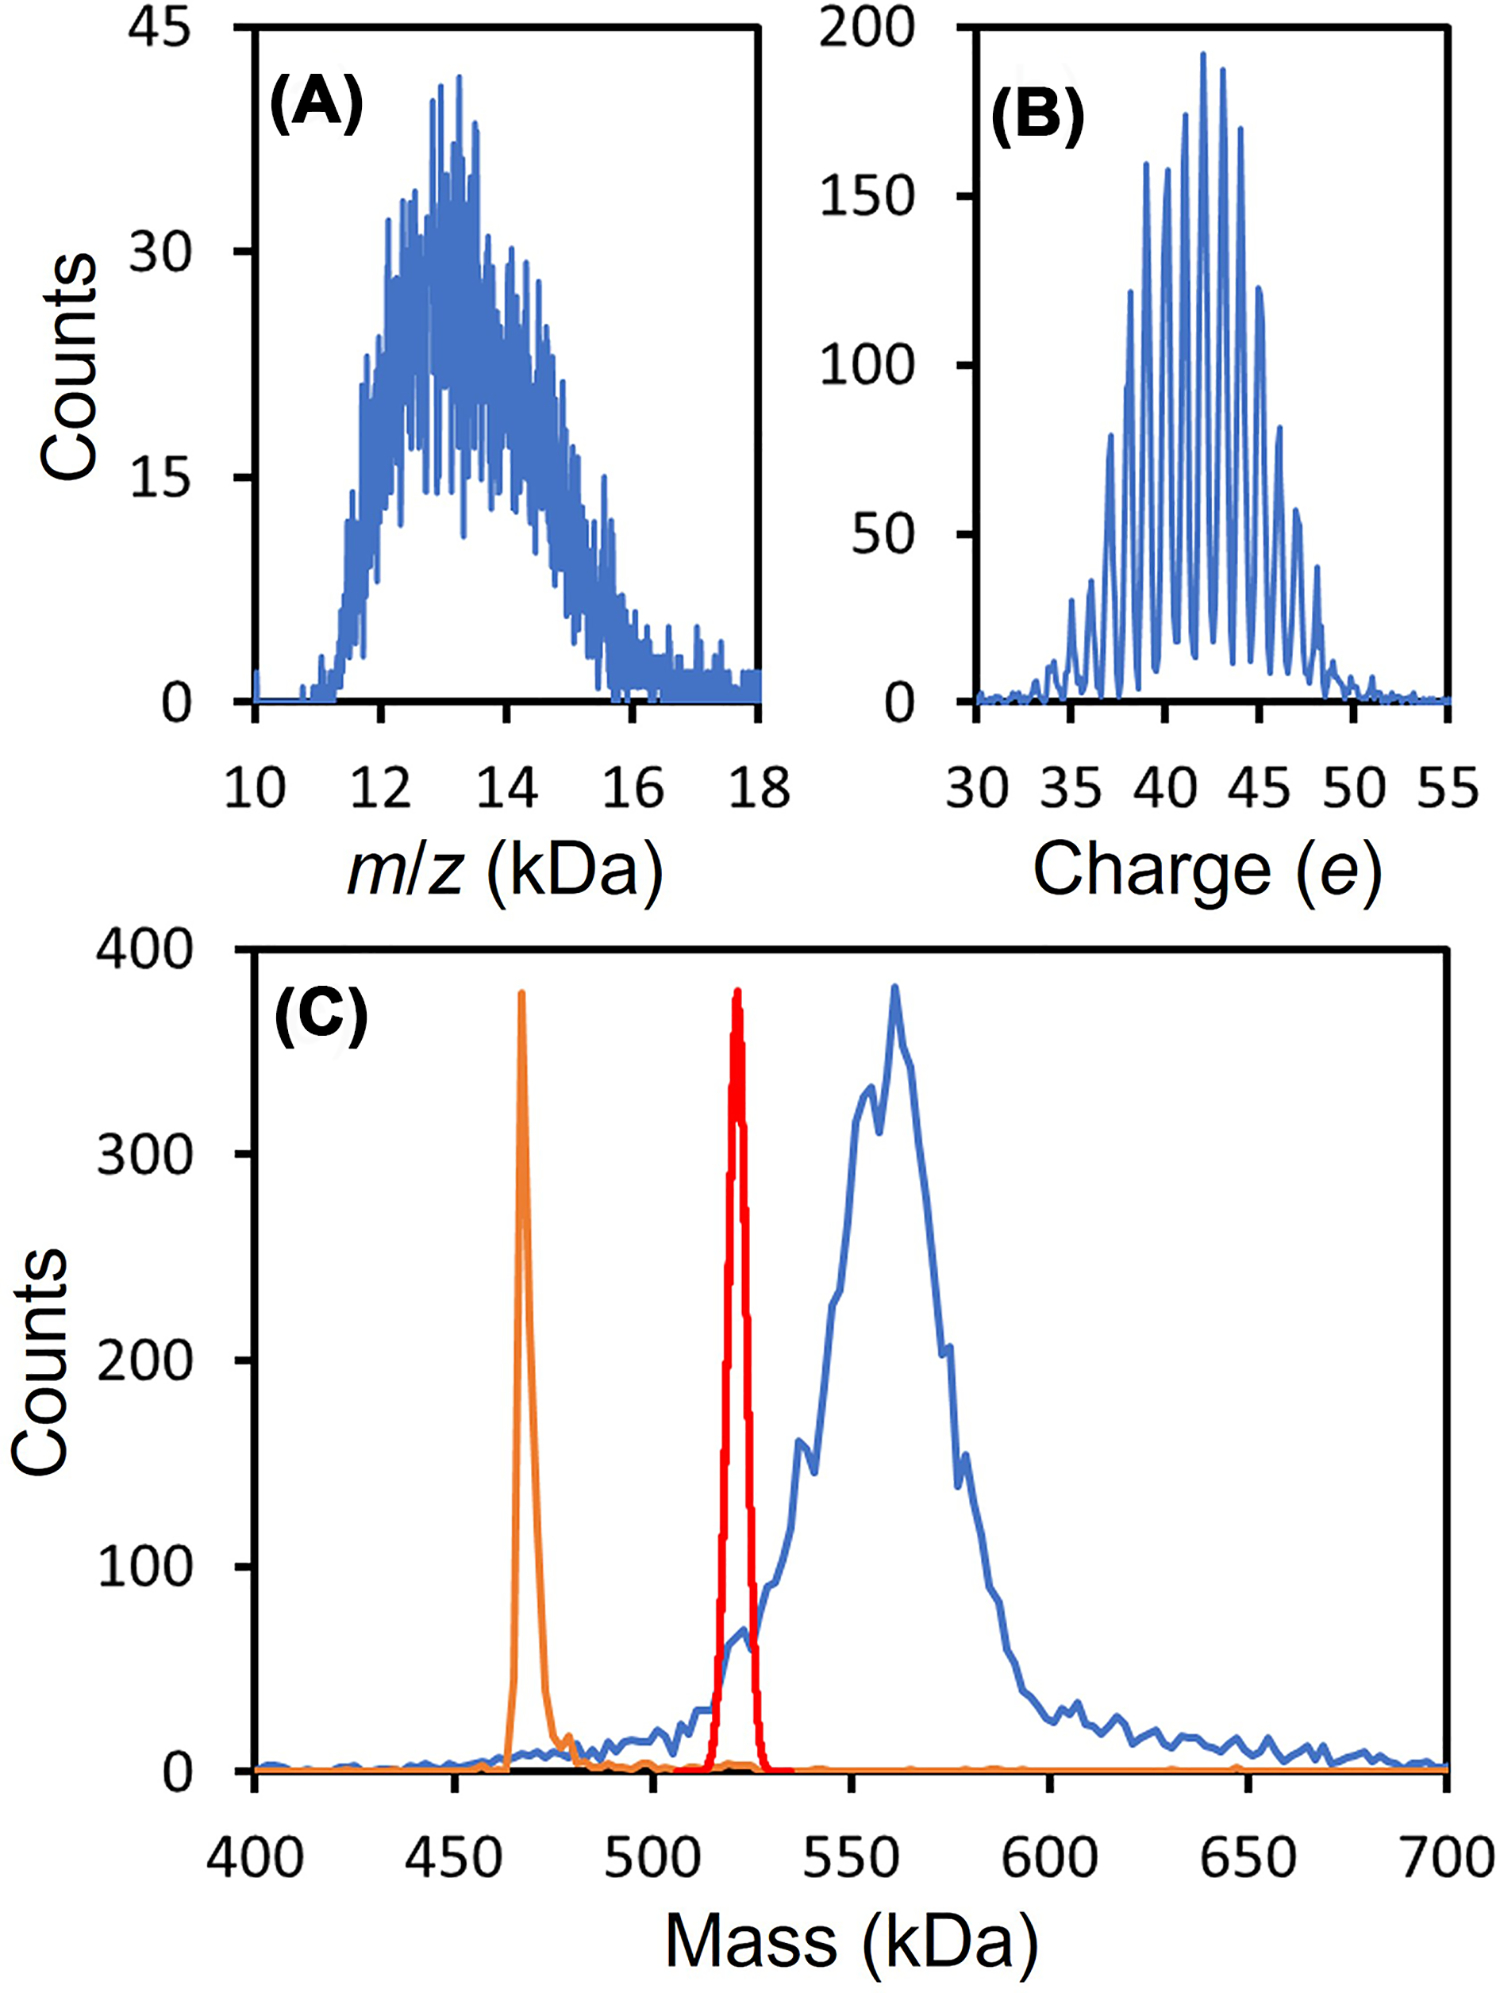
(A and B) show the measured m/z ratio and charge distributions. The blue line in (C) shows the mass distribution obtained by multiplying each ion’s m/z by its integer charge. The red line shows the mass distribution expected from glycoproteomics measurements. The orange line shows the mass distribution measured for β-galactosidase under identical conditions. The distribution is narrow and the measured mass for β-galactosidase (467.6 kDa) is <0.5% larger than the expected mass (465.4 kDa). Masses measured for large protein complexes by MS are usually slightly larger than the expected masses because of residual salt and counterions. This result shows that the broad distribution measured for the spike trimer is not a consequence of the experimental conditions employed.
Assembly of viruses and virus-like particles
Viruses assemble into complex structures on a biologically relevant time scale [39]. The capsid, the protein shell that surrounds the viral genome, is assembled from many identical subunits. Understanding the assembly process is beneficial to the design of antiviral therapies and in manipulating the assemblies into structures useful in biotherapeutics [40]. In some cases, the capsid proteins self-assemble in vitro into VLPs that mimic the native capsid structure. Structural tools such as cryo-electron microscopy are particularly valuable for the analysis of well-defined, high-symmetry structures such as the end product of a virus assembly reaction, but they are not well suited to the analysis of heterogeneous mixtures of assembly intermediates. CDMS fills this void because it can be used to determine stoichiometry [41–50]. Mass distributions can be measured relatively quickly, so CDMS can be used to find conditions where a particular structure or intermediate is abundant and then cryo-EM used to determine its structure, using the stoichiometry determined by CDMS. This synergistic approach was recently used to identify some unusual non-icosahedral geometries found in the assembly of brome mosaic virus capsid proteins with short oligonucleotides [46].
Figure 3 shows a CDMS spectrum measured for VLPs from the assembly reaction of hepatitis B virus (HBV) truncated capsid proteins (Cp149). The building block is the capsid protein dimer and assembly is triggered by raising the ionic strength. The dimer assembles into two icosahedral VLPs: a T = 3 with 90 capsid protein dimers and a T = 4 with 120. In the example shown in Figure 3 the assembly reaction has stalled and there are many trapped intermediates. In addition to peaks due to the T = 3 and T = 4 capsids, there are peaks due to the dimer and every possible dimer oligomer up to the T = 4 capsid. There are also peaks due to oligomers with more than 120 dimers. Other studies indicate that these overgrown species relax back to the T = 4 capsid [42]. CDMS studies of the HBV VLP assembly reaction have revealed important information about the assembly intermediates [41–43,45,51]. Hepatitis B is a devasting disease with over 800 000 deaths annually. Capsid assembly is thought to one of the most druggable steps in the virus lifecycle. Better knowledge of the assembly process will aid in the development of assembly inhibitors.
Figure 3. CDMS mass distribution measured for an HBV capsid assembly reaction.
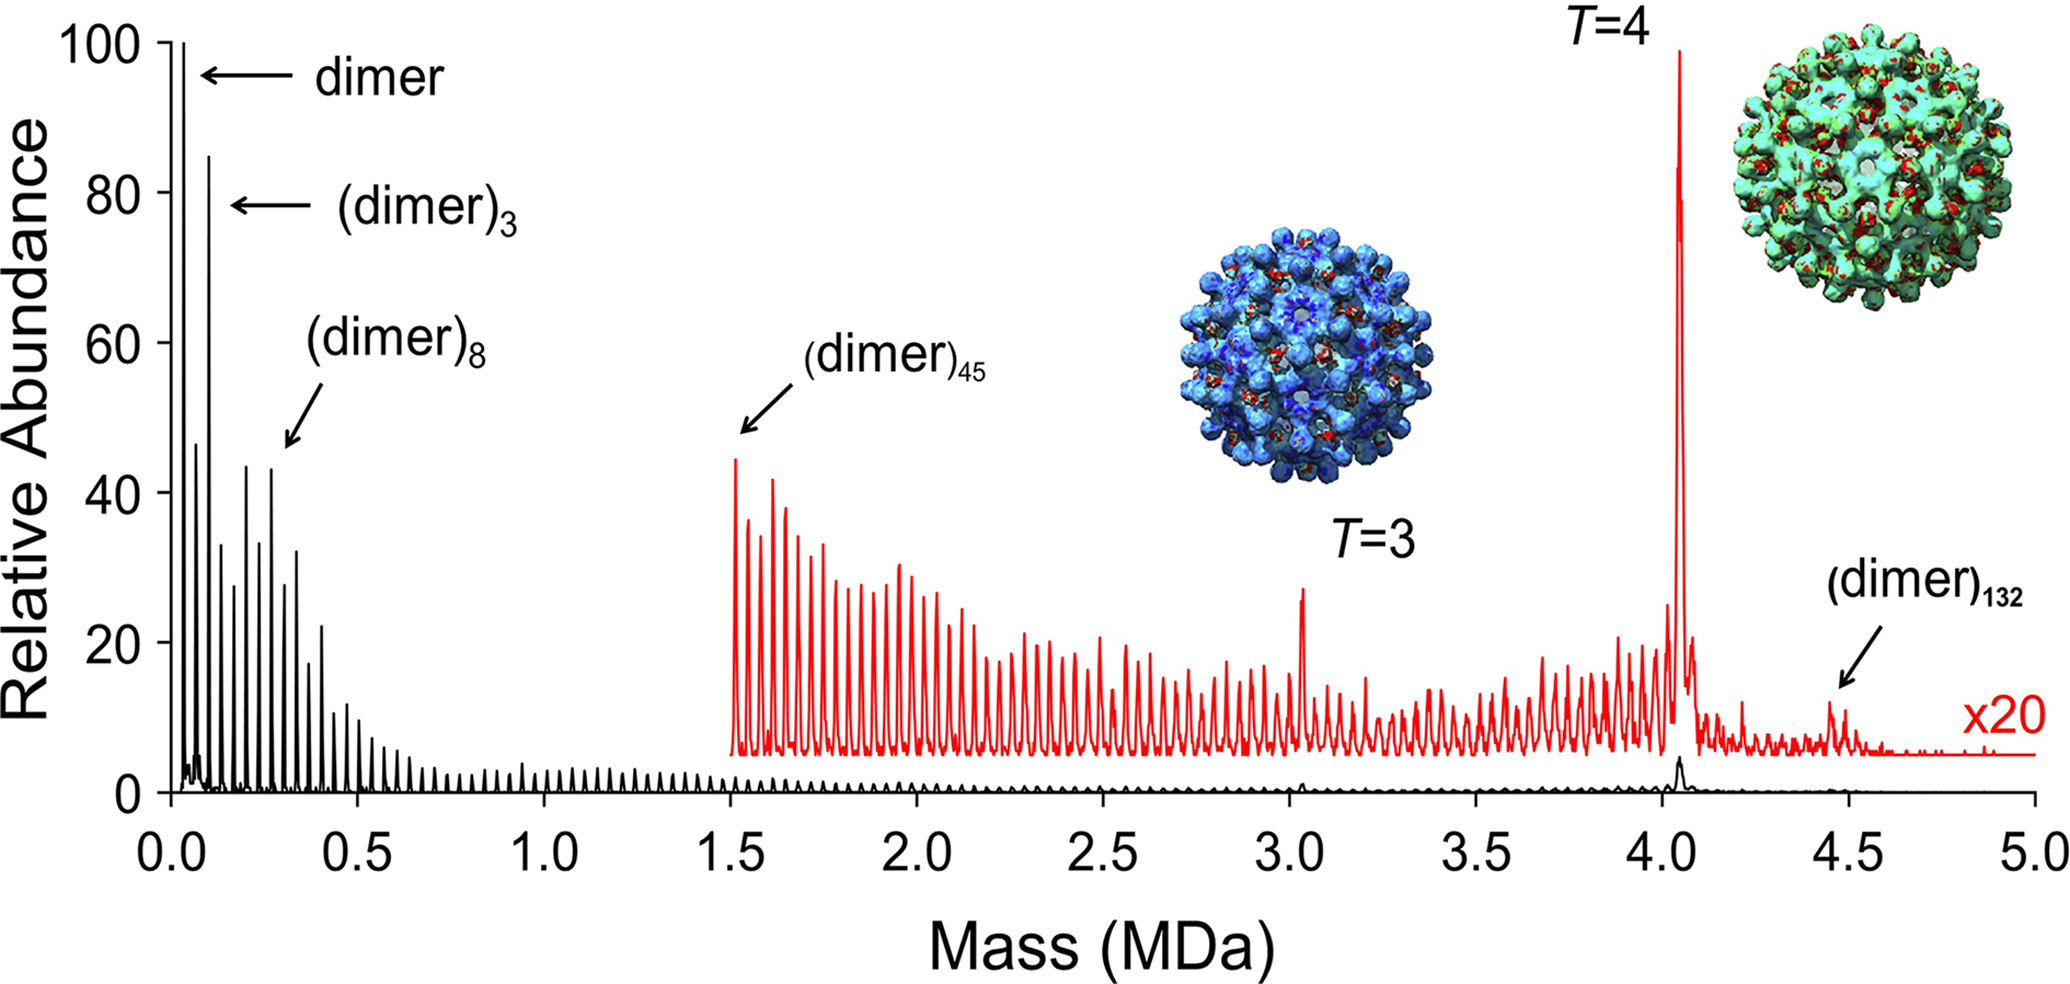
HBV Cp149 capsid protein dimers are assembled into T = 3 and T = 4 icosahedral capsids by raising the ionic strength. The T = 3 capsid contains 90 identical dimers and the T = 4 contains 120. In this example, the assembly reaction has stalled leaving many kinetically trapped intermediates.
Gene therapy vectors-AAV and adenovirus
With two FDA approvals, recombinant adeno-associated virus (rAAV) is the leading platform for gene delivery [52]. This non-pathogenic 25 nm single-stranded DNA virus has a capsid assembled from three capsid proteins VP1, VP2, and VP3 in a ratio of approximately 1:1:10. Sixty capsid proteins assemble into a quasi-icosahedral capsid that packages a single-stranded DNA (ssDNA) genome [53–55]. As the use of AAV based therapeutics expands to larger patient cohorts, in depth characterization becomes even more critical to avoid unfavorable patient outcomes. CDMS has emerged as an important technique for AAV characterization [56,57]. Figure 4A shows a CDMS mass distribution measured for AAV with a genome close to the packaging capacity (the wt genome is approximately 4.7 kb). The prominent peaks at around 3.7 MDa is due to empty capsids and the one at 5.2 MDa is due to particles that have packaged the full genome. In addition, there is a low intensity distribution between the two peaks, which is attributed to particles that have packaged a partial genome.
Figure 4. CDMS analysis of AAV.
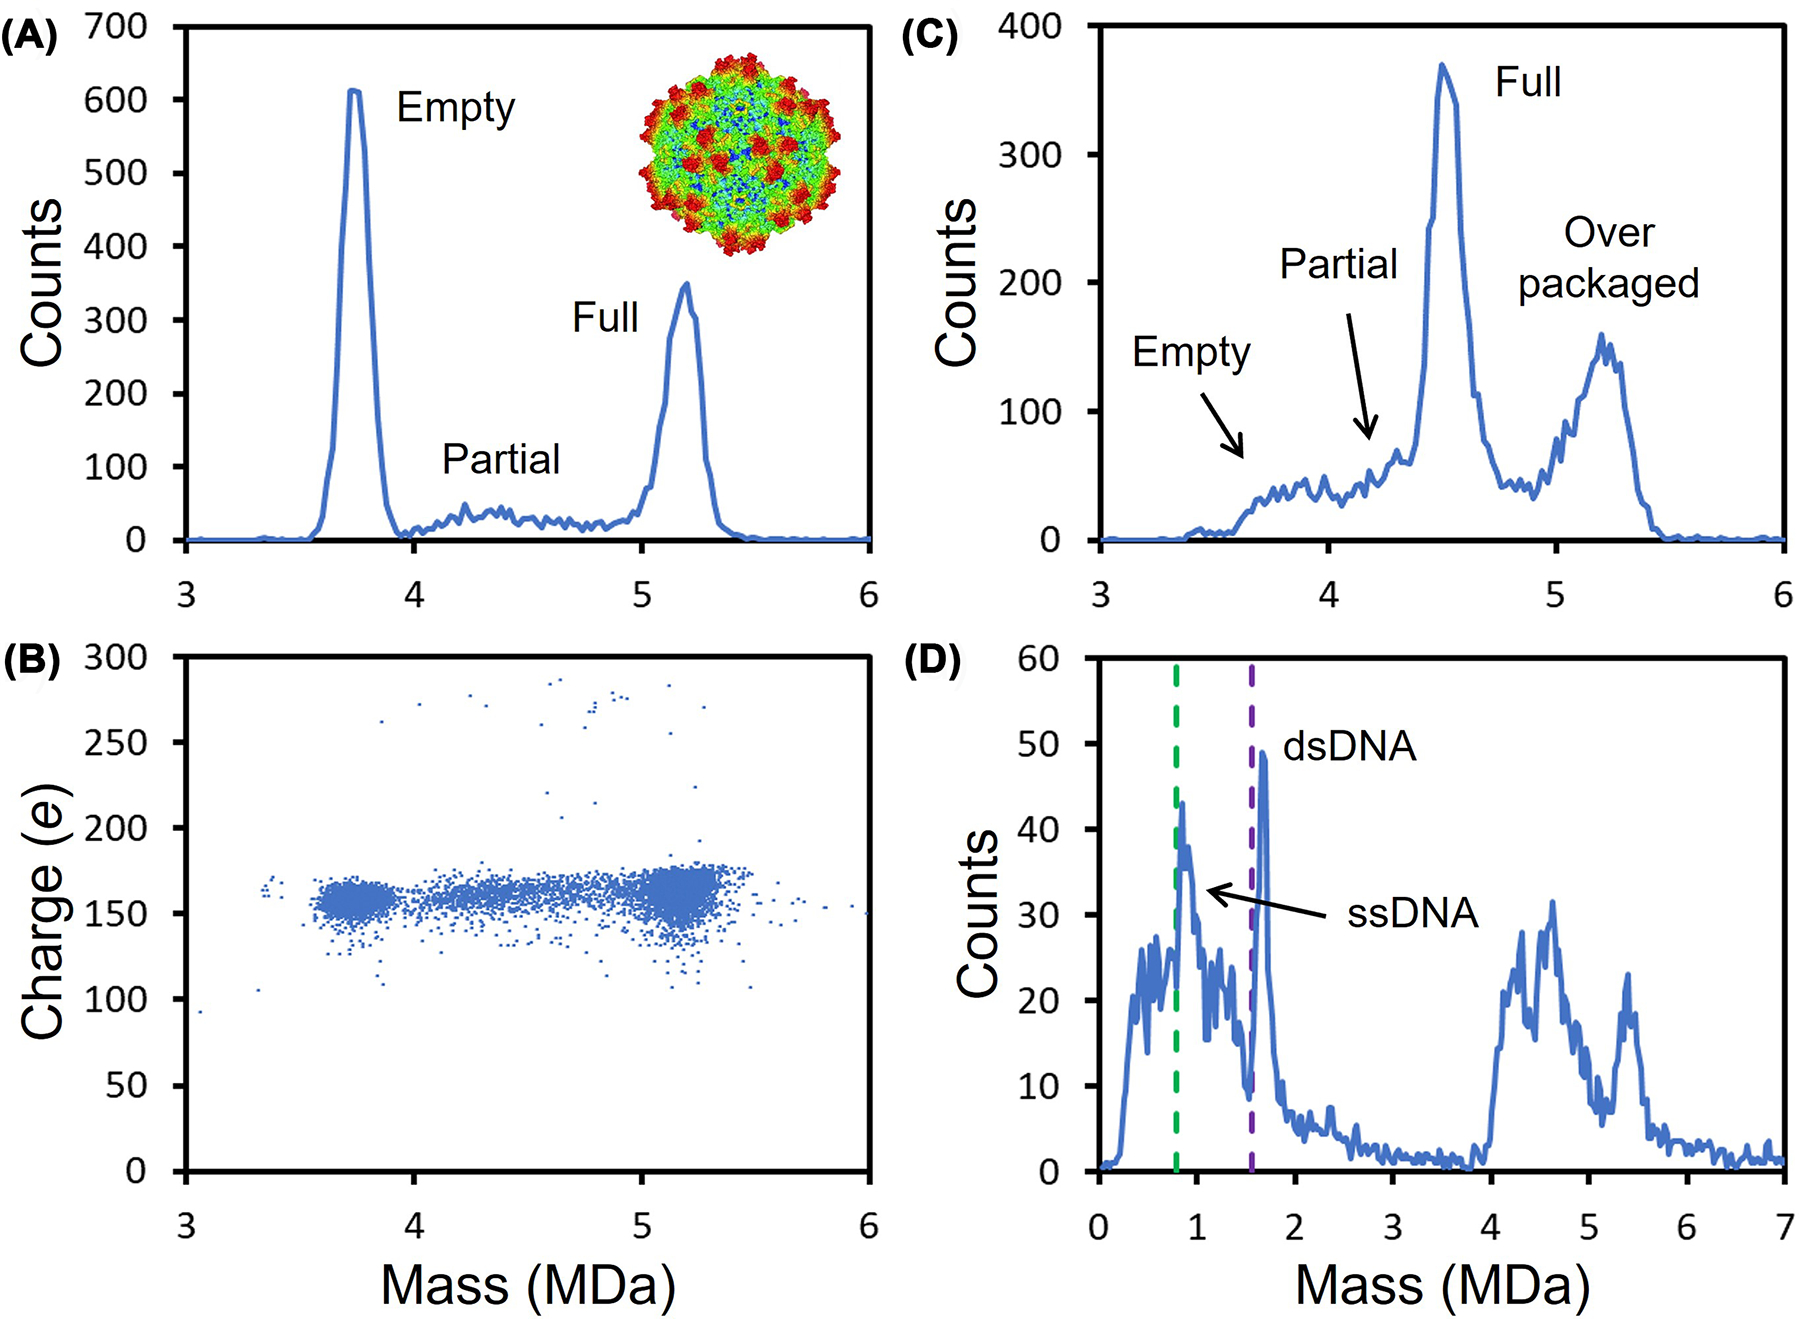
(A) Shows a mass distribution measured for an AAV sample with a peaks at approximately 3.7 and 5.2 MDa due to empty capsids and capsids that have packaged a full genome at near the packaging capacity. The broad distribution between the peaks results form particles that have packaged a partial genome. Panel (B) shows the charge versus mass scatter plot for the sample in (A). Each point is a measurement for a single ion. (C) Shows the mass distribution measured for AAV8 with CMV-GFP genome that is 2.54 kb (just over half the packaging capacity). In this case, the full peak occurs at around 4.5 MDa. The peak at around 5.2 MDa is due to particles that have over packaged. Panel (D) shows the mass distribution measured for AAV8-CMV-GFP after incubation at an elevated temperature to release the genome. The green dashed line shows the sequence mass for single-stranded CMV-GFP genome (ssDNA), and the purple line shows the mass of double stranded (dsDNA).
Figure 4B shows a charge versus mass scatter plot. In this plot, the mass and charge of each ion that contributes to the mass distribution in Figure 4A are represented by a point. The ions assigned to empty, partial, and full particles have similar charges (approximately 150 e). Large ions generated by electrospray are thought to be produced by the charge residue mechanism, where the charge carried by the ion is expected to reflect its size [58,59]. Thus, similar charges for the empty, partial, and full particles suggest that the DNA is inside the capsid (if it was outside, the charge would be larger). When DNA is extruded from the capsid the charge increases substantially [60]. Figure 4C shows a mass distribution measured for an AAV8 sample with a CMV-GFP genome. In this case, the genome (2.54 kb) is just over half the length of the wt genome (4.7 kb) and the peak due to the full particle is at 4.5 MDa. There is, however, still a peak at around 5.2 MDa (i.e., close to the packaging capacity). This could be due to the packaging of a full and partial genome, but studies indicate that it results mainly from a single heterogeneous strand of DNA, presumably derived from the host or plasmid [57]. AAV is apparently not very selective in the DNA that it packages.
The best way to characterize the packaged DNA is to extract it. Figure 4D shows CDMS mass distributions measured for AAV8-CMV-GFP after incubation at an elevated temperature to release the DNA [60]. The sequence mass of the CMV-GFP genome is 0.783 MDa (indicated by the dashed green line in Figure 4D). AAV packages negative and positive sense DNA with equal frequency [61] and once the ssDNA is released into solution it can base pair. The sequence mass of dsDNA CMV-GFP genome is 1.567 MDa (indicated by the purple dashed line in Figure 4D). There are peaks at slightly higher mass than the sequence masses for the ssDNA and dsDNA. The small deviation from the sequence masses is attributed to counterions which are needed because the DNA backbone is partially ionized in solution.
The small packaging capacity of AAV is remedied by adenovirus. Adenovirus is a large non-enveloped dsDNA virus with a 36 kb genome. In addition to being a gene therapy vector it was recently approved as the delivery system for several COVID-19 vaccines including Oxford/AstraZeneca and Johnson & Johnson. Adenovirus contains over 2500 protein molecules and has an overall diameter of 165 nm. The pseudo-T = 25 capsid is made of hexons, pentons, and fiber proteins (see inset in Figure 5A). The CDMS mass spectrum for a human adenovirus 5 (HAdV5) shows a main peak at 156.1 MDa assigned to the mature virus and the smaller peak at 129.6 MDa attributed to an empty or light particle that does not contain the genome [62,63]. Such high MWs are well beyond the range of conventional MS. The charge versus mass heat map in Figure 5B shows that the empty/light particles have a significantly lower charge than the mature virus because the light particles are missing some if not all of the fiber proteins [64].
Figure 5. CDMS measurements for HAdV5.
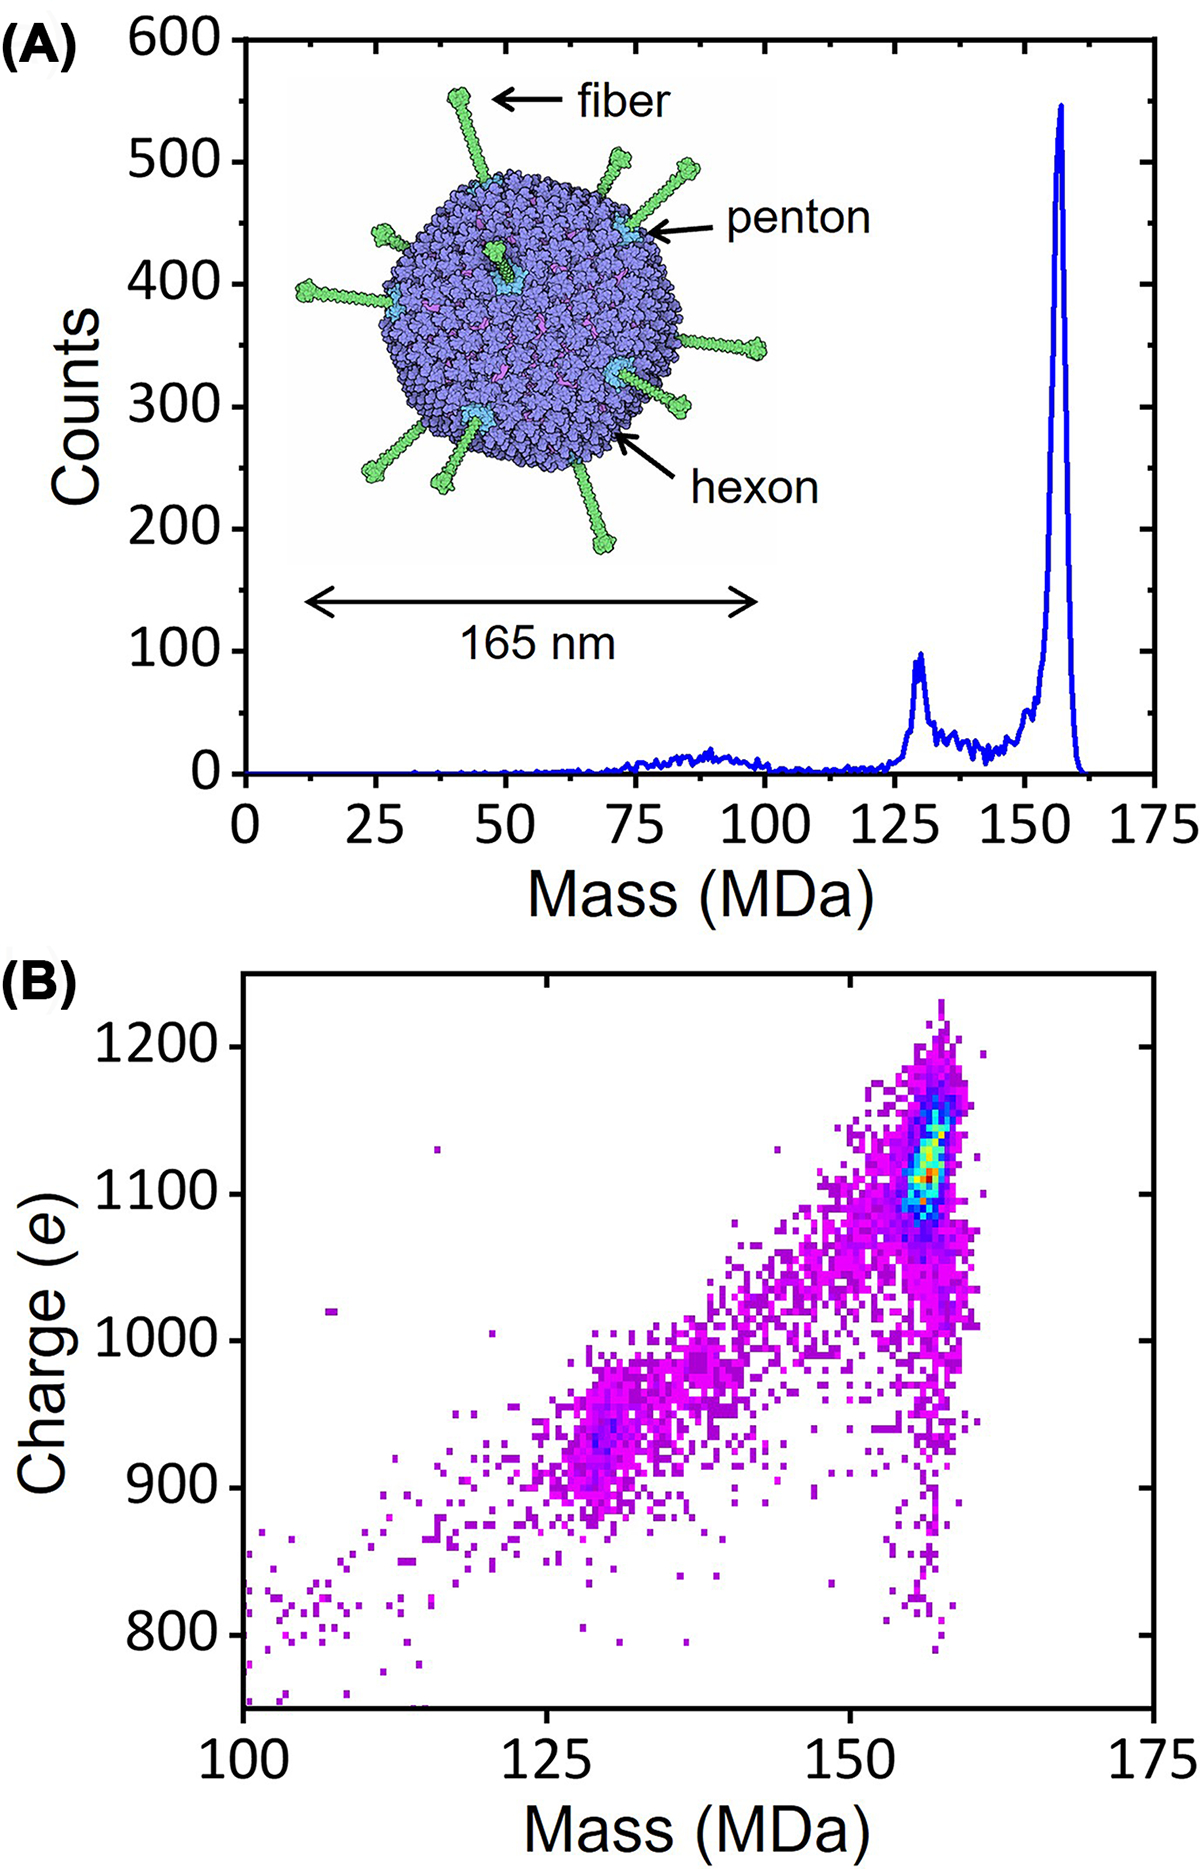
Panel (A) shows the CDMS mass spectrum measured for HAdV5. The inset shows an exterior view of HAdV5. The hexons are purple, the pentons are blue, and the fibers are green. Panel (B) shows a charge versus mass heat map for the data in part (A). Warmer colors indicate higher intensity.
Mass spectrometry has played a critical role in the characterization of small molecule pharmaceuticals. It is now poised to make a similar contribution to the analysis and of larger biologics, including gene therapies and vaccines, as well as delivery vehicles such as nanoparticles. The characterization of these large and complex samples is challenging, and robust analytical techniques are in short supply.
Summary.
CDMS brings the resolution and accuracy of mass spectrometry to the analysis of complex, heterogeneous macromolecules with masses that extend into the gigadalton regime.
In addition to CDMS, other individual ion methods are now being developed, most notably Orbitrap I2MS.
The few applications briefly summarized here illustrate the wide range of problems that CDMS and other emerging individual ion methods can help to solve.
Funding
We are grateful to the National Institutes of Health for financial support [grant number R01GM131100].
Abbreviations
- CDMS
charge detection mass spectrometry
- ELIT
electrostatic linear ion trap
- FFT
fast Fourier transform
- FT-ICR
Fourier transform ion cyclotron resonance
- HAdV5
human adenovirus 5
- HBV
hepatitis B virus
- I2MS
individual ion mass spectrometry
- m/z
mass to charge ratio
- MS
mass spectrometry
- MW
molecular weight
- rAAV
recombinant adeno-associated virus
- ssDNA
single-stranded DNA
- VLP
virus-like particle
Footnotes
Competing Interests
One of the authors (M.F.J.) is a shareholder in Megadalton Solutions, a company engaged in commercializing CDMS.
References
- 1.Rostom AA and Robinson CV (1999) Detection of the intact GroEL chaperonin assembly by mass spectrometry. J. Am. Chem. Soc 121, 4718–4719, 10.1021/ja990238r [DOI] [Google Scholar]
- 2.Loo J (2000) Electrospray ionization mass spectrometry: a technology for studying noncovalent macromolecular complexes. Int. J. Mass Spectrom 200, 175–186, 10.1016/S1387-3806(00)00298-0 [DOI] [Google Scholar]
- 3.van den Heuvel RHH and Heck AJR (2004) Native protein mass spectrometry: from intact oligomers to functional machineries. Curr. Opin. Chem. Biol 8, 519–526, 10.1016/j.cbpa.2004.08.006 [DOI] [PubMed] [Google Scholar]
- 4.Hernández H and Robinson CV (2007) Determining the stoichiometry and interactions of macromolecular assemblies from mass spectrometry. Nat. Protoc 2, 715–726, 10.1038/nprot.2007.73 [DOI] [PubMed] [Google Scholar]
- 5.Mehmood S, Allison TM and Robinson CV (2015) Mass spectrometry of protein complexes: from origins to applications. Annu. Rev. Phys. Chem 66, 453–474, 10.1146/annurev-physchem-040214-121732 [DOI] [PubMed] [Google Scholar]
- 6.Mann M, Meng CK and Fenn JB (1989) Interpreting mass spectra of multiply charged ions. Anal. Chem 61, 1702–1708, 10.1021/ac00190a023 [DOI] [Google Scholar]
- 7.Tito MA, Tars K, Valegard K, Hajdu J and Robinson CV (2000) Electrospray time-of-flight mass spectrometry of the intact MS2 virus capsid. J. Am. Chem. Soc 122, 3550–3551, 10.1021/ja993740k [DOI] [Google Scholar]
- 8.Snider J, Rose RJ, Veesler D, Johnson JE and Heck AJR (2013) Studying 18 MDa virus assemblies with native mass spectrometry. Angew. Chem. Int. Ed 52, 4020–4023, 10.1002/anie.201210197 [DOI] [PMC free article] [PubMed] [Google Scholar]
- 9.Shelton H, Hendricks CD and Wuerker RF (1960) Electrostatic acceleration of microparticles to hypervelocities. J. Appl. Phys 31, 1243–1246, 10.1063/1.1735813 [DOI] [Google Scholar]
- 10.Fuerstenau SD and Benner WH (1995) Molecular weight determination of megadalton DNA electrospray ions using charge detection time-of-flight mass spectrometry. Rapid Commun. Mass Spectrom 9, 1528–1538, 10.1002/rcm.1290091513 [DOI] [PubMed] [Google Scholar]
- 11.Schultz JC, Hack CA and Benner WH (1998) Mass determination of megadalton-DNA electrospray ions using charge detection mass spectrometry. J. Am. Soc. Mass. Spectrom 9, 305–313, 10.1016/S1044-0305(97)00290-0 [DOI] [PubMed] [Google Scholar]
- 12.Fuerstenau SD, Benner WH, Thomas JJ, Brugidou C, Bothner B and Siuzdak G (2001) Mass spectrometry of an intact virus. Angew. Chem. Int. Ed 40, 541–544, [DOI] [PubMed] [Google Scholar]
- 13.Benner WH (1997) A gated electrostatic ion trap to repetitiously measure the charge and m/z of large electrospray ions. Anal. Chem 69, 4162–4168, 10.1021/ac970163e [DOI] [Google Scholar]
- 14.Contino NC and Jarrold MF (2013) Charge detection mass spectrometry for single ions with a limit of detection of 30 charges. Int. J. Mass Spectrom 345–347, 153–159, 10.1016/j.ijms.2012.07.010 [DOI] [Google Scholar]
- 15.Hogan JA and Jarrold MF (2018) Optimized electrostatic linear ion trap for charge detection mass spectrometry. J. Am. Soc. Mass. Spectrom 29, 2086–2095, 10.1007/s13361-018-2007-x [DOI] [PubMed] [Google Scholar]
- 16.Contino NC, Pierson EE, Keifer DZ and Jarrold MF (2013) Charge detection mass spectrometry with resolved charge states. J. Am. Soc. Mass. Spectrom 24, 101–108, 10.1007/s13361-012-0525-5 [DOI] [PubMed] [Google Scholar]
- 17.Pierson EE, Contino NC, Keifer DZ and Jarrold MF (2015) Charge detection mass spectrometry for single ions with an uncertainty in the charge measurement of 0.65 e. J. Am. Soc. Mass. Spectrom 26, 1213–1220, 10.1007/s13361-015-1126-x [DOI] [PubMed] [Google Scholar]
- 18.Keifer DZ, Shinholt DL and Jarrold MF (2015) Charge detection mass spectrometry with almost perfect charge accuracy. Anal. Chem 87, 10330–10337, 10.1021/acs.analchem.5b02324 [DOI] [PubMed] [Google Scholar]
- 19.Draper BE and Jarrold MF (2019) Real time analysis and signal optimization for charge detection mass spectrometry. J. Am. Soc. Mass. Spectrom 30, 898–904, 10.1007/s13361-019-02172-z [DOI] [PubMed] [Google Scholar]
- 20.Todd AR, Alexander AW and Jarrold MF (2020) Implementation of a charge sensitive amplifier without a feedback resistor for charge detection mass spectrometry reduces noise and enables detection of individual ions carrying a single charge. J. Am. Soc. Mass. Spectrom 31, 146–154, 10.1021/jasms.9b00010 [DOI] [PubMed] [Google Scholar]
- 21.Todd AR and Jarrold MF (2020) Dynamic calibration enables high accuracy charge measurements on individual ions for charge detection mass spectrometry. J. Am. Soc. Mass. Spectrom 31, 1241–1248, 10.1021/jasms.0c00081 [DOI] [PubMed] [Google Scholar]
- 22.Todd AR, Barnes LF, Young K, Zlotnick A and Jarrold MF (2020) Higher resolution charge detection mass spectrometry. Anal. Chem 92, 11357–11364, 10.1021/acs.analchem.0c02133 [DOI] [PMC free article] [PubMed] [Google Scholar]
- 23.Draper BE, Anthony SN and Jarrold MF (2018) The FUNPET- a new hybrid ion funnel-ion carpet atmospheric pressure interface for the simultaneous transmission of a broad mass range. J. Am. Soc. Mass. Spectrom 29, 2160–2172, 10.1007/s13361-018-2038-3 [DOI] [PubMed] [Google Scholar]
- 24.Pansieri J, Halim MA, Vendrely C, Dumoulin M, Legrand F, Sallanon MM et al. (2018) Mass and charge distributions of amyloid fibers involved in neurodegenerative diseases: mapping heterogeneity and polymorphism. Chem. Sci 9, 2791–2796, 10.1039/C7SC04542E [DOI] [PMC free article] [PubMed] [Google Scholar]
- 25.Antoine R (2020) Weighing synthetic polymers of ultra-high molar mass and polymeric nanomaterials: what can we learn from charge detection mass spectrometry? Rapid Commun. Mass Spectrom 34, e8539, 10.1002/rcm.8539 [DOI] [PubMed] [Google Scholar]
- 26.Harper CC, Elliott AG, Oltrogge LM, Savage DF and Williams ER (2019) Multiplexed charge detection mass spectrometry for high-throughput single ion analysis of large molecules. Anal. Chem 91, 7458–7465, 10.1021/acs.analchem.9b01669 [DOI] [PubMed] [Google Scholar]
- 27.Harper CC, Brauer DD, Francis MB and Williams ER (2021) Direct observation of ion emission from charged aqueous droplets: effects on gaseous macromolecular charging. Chem. Sci 12, 5185–5195, 10.1039/D0SC05707J [DOI] [PMC free article] [PubMed] [Google Scholar]
- 28.Barney BL, Daly RT and Austin DE (2013) A multi-stage image charge detector made from printed circuit boards. Rev. Sci. Instrum 84, 114101, 10.1063/1.4828668 [DOI] [PubMed] [Google Scholar]
- 29.Chen R, Wu Q, Mitchell DW, Hofstadler SA, Rockwood AL and Smith RD (1994) Direct charge number and molecular weight determination of large individual ions by electrospray ionization Fourier transform ion cyclotron resonance mass spectrometry. Anal. Chem 66, 3964–3969, 10.1021/ac00094a018 [DOI] [Google Scholar]
- 30.Kafader JO, Beu SC, Early BP, Melani RD, Durbin KR, Zabrouskov V et al. (2019) STORI plots enable accurate tracking of individual ion signals. J. Am. Soc. Mass. Spectrom 30, 2200–2203, 10.1007/s13361-019-02309-0 [DOI] [PMC free article] [PubMed] [Google Scholar]
- 31.Kafader JO, Melani RD, Durbin KR, Ikwuagwu B, Early BP, Fellers RT et al. (2020) Multiplexed mass spectrometry of individual ions improves measurement of proteoforms and their complexes. Nat. Methods 17, 391–394, 10.1038/s41592-020-0764-5 [DOI] [PMC free article] [PubMed] [Google Scholar]
- 32.Wörner TP, Snijder J, Bennett A, Agbandje-McKenna M, Makarov AA and Heck AJR (2020) Resolving heterogeneous macromolecular assemblies by Orbitrap-based single-particle charge detection mass spectrometry. Nat. Methods 17, 395–398, 10.1038/s41592-020-0770-7 [DOI] [PubMed] [Google Scholar]
- 33.Jarrold MF (2021) Applications of charge detection mass spectrometry in molecular biology and biotechnology. Chem. Rev 122, 7415–7441, 10.1021/acs.chemrev.1c00377 [DOI] [PMC free article] [PubMed] [Google Scholar]
- 34.Dong X, Huang Y, Cho BG, Zhong J, Gautam S, Peng W et al. (2018) Advances in mass spectrometry-based glycomics. Electrophoresis 39, 3063–3081, 10.1002/elps.201800273 [DOI] [PubMed] [Google Scholar]
- 35.Watanabe Y, Allen JD, Wrapp D, McLellan JS and Crispin M (2020) Site-specific glycan analysis of the SARS-CoV-2 spike. Science 369, 330–333, 10.1126/science.abb9983 [DOI] [PMC free article] [PubMed] [Google Scholar]
- 36.Miller LM, Barnes LF, Raab SA, Draper BE, El-Baba TJ, Lutomski CA et al. (2021) Heterogeneity of glycan processing on trimeric SARS-CoV-2 spike protein revealed by charge detection mass spectrometry. J. Am. Chem. Soc 143, 3959–3966, 10.1021/jacs.1c00353 [DOI] [PMC free article] [PubMed] [Google Scholar]
- 37.Yin V, Lai S-H, Caniels TG, Brouwer PJM, Brinkkemper M, Aldon Y et al. (2021) Probing affinity, avidity, anticooperativity, and competition in antibody and receptor binding to the SARS-CoV-2 spike by single particle mass analyses. ACS Cent. Sci 7, 1863–1873, 10.1021/acscentsci.1c00804 [DOI] [PMC free article] [PubMed] [Google Scholar]
- 38.Stiving AQ, Foreman DJ, VanAernum ZL, Dur E, Wang S, Vlasak J et al. Dissecting the heterogeneous glycan profiles of recombinant coronavirus spike proteins with individual ion mass spectrometry. ChemRxiv, 10.26434/chemrxiv-2022-9vnch [DOI] [PubMed] [Google Scholar]
- 39.Perlmutter JD and Hagan MF (2015) Mechanisms of virus assembly. Annu. Rev. Phys. Chem 66, 217–239, 10.1146/annurev-physchem-040214-121637 [DOI] [PMC free article] [PubMed] [Google Scholar]
- 40.Wen AM and Steinmetz NF (2016) Design of virus-based nanomaterials for medicine, biotechnology, and energy. Chem. Soc. Rev 45, 4074–4126, 10.1039/C5CS00287G [DOI] [PMC free article] [PubMed] [Google Scholar]
- 41.Pierson EE, Keifer DZ, Selzer L, Lee LS, Contino NC, Wang JC-Y et al. (2014) Detection of late intermediates in virus capsid assembly by charge detection mass spectrometry. J. Am. Chem. Soc 136, 3536–3541, 10.1021/ja411460w [DOI] [PMC free article] [PubMed] [Google Scholar]
- 42.Lutomski CA, Lyktey NA, Zhao Z, Pierson EE, Zlotnick A and Jarrold MF (2017) HBV capsid completion occurs through error correction. J. Am. Chem. Soc 139, 16932–16938, 10.1021/jacs.7b09932 [DOI] [PMC free article] [PubMed] [Google Scholar]
- 43.Lutomski CA, Lyktey NA, Pierson EE, Zhao Z, Zlotnick A and Jarrold MF (2018) Multiple pathways in capsid assembly. J. Am. Chem. Soc 140, 5784–5790, 10.1021/jacs.8b01804 [DOI] [PMC free article] [PubMed] [Google Scholar]
- 44.Kukreja AA, Wang JC-Y, Pierson E, Keifer DZ, Selzer L, Tan Z et al. (2014) Structurally similar woodchuck and human hepadnavirus core proteins have distinctly different temperature dependences of assembly. J. Virol 88, 14105–14115, 10.1128/JVI.01840-14 [DOI] [PMC free article] [PubMed] [Google Scholar]
- 45.Pierson EE, Keifer DZ, Kukreja AA, Wang JC-Y, Zlotnick A and Jarrold MF (2016) Charge detection mass spectrometry identifies preferred non-icosahedral polymorphs in the self-assembly of woodchuck hepatitis virus capsids. J. Mol. Biol 428, 292–300, 10.1016/j.jmb.2015.06.019 [DOI] [PMC free article] [PubMed] [Google Scholar]
- 46.Bond K, Tsvetkova I, Wang JC-Y, Jarrold MF and Dragnea B (2020) Virus assembly pathways: straying away but not too far. Small 16, 2004475, 10.1002/smll.202004475 [DOI] [PubMed] [Google Scholar]
- 47.Bond KM, Lyktey NA, Tsvetkova IB, Dragnea B and Jarrold MF (2020) Disassembly intermediates of brome mosaic virus identified by charge detection mass spectrometry. J. Phys. Chem. B 124, 2124–2131, 10.1021/acs.jpcb.0c00008 [DOI] [PubMed] [Google Scholar]
- 48.Bond KM, Aanei IL, Francis MB and Jarrold MF (2020) Determination of antibody population distributions for virus-antibody conjugates by charge detection mass spectrometry. Anal. Chem 92, 1285–1291, 10.1021/acs.analchem.9b04457 [DOI] [PubMed] [Google Scholar]
- 49.Zhao Z, Wang JC-Y, Zhang M, Lyktey NA, Jarrold MF, Jacobson SC et al. (2021) Asymmetrizing an icosahedral virus capsid by hierarchical assembly of subunits with designed asymmetry. Nat. Commun 12, 589, 10.1038/s41467-020-20862-1 [DOI] [PMC free article] [PubMed] [Google Scholar]
- 50.Dunbar CA, Callaway HM, Parrish CR and Jarrold MF (2018) Probing antibody binding to canine parvovirus with charge detection mass spectrometry. J. Am. Chem. Soc 140, 15701–15711, 10.1021/jacs.8b08050 [DOI] [PubMed] [Google Scholar]
- 51.Starr C, Barnes LF, Jarrold MF and Zlotnick A (2022) Hysteresis in HBV requires assembly of near-perfect capsids. Biochem 61, 505–513, 10.1021/acs.biochem.1c00810 [DOI] [PMC free article] [PubMed] [Google Scholar]
- 52.Wang D, Tai PWL and Gao G (2019) Adeno-associated virus vector as a platform for gene therapy delivery. Nat. Rev. Drug Discovery 18, 358–378, 10.1038/s41573-019-0012-9 [DOI] [PMC free article] [PubMed] [Google Scholar]
- 53.Rose JA, Maizel JV, Inman JK and Shatkin AJ (1971) Structural proteins of adenovirus-associated viruses. J. Virol 8, 766–770, 10.1128/jvi.8.5.766-770.1971 [DOI] [PMC free article] [PubMed] [Google Scholar]
- 54.Johnson FB, Ozer HL and Hoggan MD (1971) Structural proteins of adenovirus associated virus type 3. J. Virol 8, 860–863, 10.1128/jvi.8.6.860-863.1971 [DOI] [PMC free article] [PubMed] [Google Scholar]
- 55.Nam H, Lane M, Padron E, Gurda B, McKenna R, Kohlbrenner E et al. (2007) Structure of adeno-associated virus serotype 8, a gene therapy vector. J. Virol 81, 12260–12271, 10.1128/JVI.01304-07 [DOI] [PMC free article] [PubMed] [Google Scholar]
- 56.Pierson EE, Keifer DZ, Asokan A and Jarrold MF (2016) Resolving adeno-associated viral particle diversity with charge detection mass spectrometry. Anal. Chem 88, 6718–6725, 10.1021/acs.analchem.6b00883 [DOI] [PMC free article] [PubMed] [Google Scholar]
- 57.Barnes LF, Draper BE, Chen Y-T, Powers TW and Jarrold MF (2021) Quantitative analysis of genome packaging in recombinant AAV vectors by charge detection mass spectrometry. Mol. Ther. Methods Clin. Dev 23, 87–97, 10.1016/j.omtm.2021.08.002 [DOI] [PMC free article] [PubMed] [Google Scholar]
- 58.Fernandez de la Mora J (2000) Electrospray ionization of large multiply charged species proceeds via Dole’s charged residue mechanism. Anal. Chim. Acta 406, 93–104, 10.1016/S0003-2670(99)00601-7 [DOI] [Google Scholar]
- 59.Konermann L, Ahadi E, Rodriguez AD and Vahidi S (2013) Unraveling the mechanism of electrospray ionization. Anal. Chem 85, 2–9, 10.1021/ac302789c [DOI] [PubMed] [Google Scholar]
- 60.Barnes LF, Draper BE and Jarrold MF (2022) Analysis of thermally driven structural changes, genome release, disassembly and aggregation of recombinant AAV by CDMS. Mol. Ther. Methods Clin. Dev, (under review) [DOI] [PMC free article] [PubMed] [Google Scholar]
- 61.Berns KI and Rose JA (1970) Evidence for a single-stranded adenovirus-associated virus genome: Isolation and separation of complementary single strands. J. Virol 5, 693–699, 10.1128/jvi.5.6.693-699.1970 [DOI] [PMC free article] [PubMed] [Google Scholar]
- 62.Barnes LF, Draper BE and Jarrold MF (2022) Analysis of recombinant adenovirus vectors by ion trap charge detection mass spectrometry: accurate molecular weight measurements beyond 150 MDa. Anal. Chem 94, 1543–1551, 10.1021/acs.analchem.1c02439 [DOI] [PubMed] [Google Scholar]
- 63.Mullins EK, Powers TW, Zobel J, Clawson KM, Barnes LF, Draper BE et al. (2021) Characterization of recombinant chimpanzee adenovirus C68 low and high-density particles: impact on determination of viral particle titer. Front. Bioeng. Biotechnol 9, 753480, 10.3389/fbioe.2021.753480 [DOI] [PMC free article] [PubMed] [Google Scholar]
- 64.Takahashi E, Cohen SL, Tsai PK and Sweeney JA (2006) Quantitation of adenovirus type 5 empty capsids. Anal. Biochem 349, 208–217, 10.1016/j.ab.2005.11.014 [DOI] [PubMed] [Google Scholar]