

Abstract
Understanding the electronic structures of high-valent metal complexes aids the advancement of metal-catalyzed cross coupling methodologies. A prototypical complex with formally high valency is [Cu(CF3)4]− (1), which has a formal Cu(III) oxidation state but whose physical analysis has led some to a Cu(I) assignment in an inverted ligand field model. Recent examinations of 1 by X-ray spectroscopies have led previous authors to contradictory conclusions, motivating the re-examination of its X-ray absorption profile here by a complementary method, resonant diffraction anomalous fine structure (DAFS). From analysis of DAFS measurements for a series of seven mononuclear Cu complexes including 1, here it is shown that there is a systematic trifluoromethyl effect on X-ray absorption that blue shifts the resonant Cu K-edge energy by 2-3 eV per CF3, completely accounting for observed changes in DAFS profiles between formally Cu(III) complexes like 1 and formally Cu(I) complexes like (Ph3P)3CuCF3 (3). Thus, in agreement with the inverted ligand field model, the data presented herein imply that 1 is best described as containing a Cu(I) ion with dn count approaching 10.
Keywords: copper, high-valent metals, trifluoromethyl ligands, oxidation state, anomalous diffraction
Graphical Abstract

The electronic structures of [Cu(CF3)4]− and other Cu-CF3 complexes are (re-)evaluated using resonant X-ray diffraction methods. A systematic trend was identified by which each additional CF3 ligand shifts the resonant Cu K-edge energy by 2-3 eV, completely accounting for observed differences between complexes with different formal oxidation states. The recently debated assignment of [Cu(CF3)4]− as containing a Cu(I) ion is, thus, verified.
Introduction
Due to the beneficial effects of trifluoromethyl (CF3) substituents on physiological properties of drug molecules,[1,2] significant research efforts have been spent developing methods for C-CF3 coupling.[3–6] Metal-promoted reactions in this arena are often thought to involve high-valent M-CF3 [M = e.g. Ni(III),[7] Ni(IV),[8] Pd(II),[9,10] Pd(IV),[11] Au(III)[12]] intermediates poised for C-CF3 reductive elimination. To further advance available technologies in this area, it is obligatory to understand the electronic structures of these key intermediates.
There exist several Cu-promoted methods for C-CF3 bond formation.[13–24] Because Cu-catalyzed coupling reactions are often proposed to involve canonical Cu(I)/Cu(III) redox cycling,[25–27] this raises the question of the viability of formally Cu(III)-CF3 intermediates.[23,24] Paradoxically, several formally Cu(III)-CF3 complexes [e.g. Cu(CF3)2(S2CNEt2), Cu(CF3)3(bpy)] are known to be thermally stable and generally unreactive.[23,28–32] Recently, Hartwig invoked the stability of the formally Cu(III)-CF3 bond as a driving force for alkyl halide oxidative addition to Cu(I) in the context of cross coupling catalysis.[33] In fact, only in 2019 was the first C-CF3 reductive elimination process from a well-defined, formally Cu(III) species observed by Liu.[34,35]
A notable complex in this context is the [Cu(CF3)4]− anion (1), which was first reported by Naumann in 1993[36] and whose synthesis was optimized by Grushin in 2015.[37] Standard oxidation state formalisms along with the distorted square planar (D2d) geometry of 1 led to its initial description as a Cu(III) complex with d8 count. However, despite the expected high-energy nature of the Cu(III) oxidation state,[38] anion 1 is air-stable, thermally robust, and inert as a trifluoromethylation reagent, even having been put forth as a weakly coordinating anion candidate.[39] A rationalization for this behavior was first given by Snyder in 1995.[40] Based on computational analysis, Snyder proposed that 1 is best described as having a Cu(I) center with d10 count surrounded by a (CF3)42− ligand field (i.e., CF30.5− on average). Snyder’s proposal was contested at the time,[41,42] and anion 1 has since been subjected to several theoretical treatments.[37,39,43–45] A spirited set of discussions involving Alvarez, Hoffmann, and Mealli included potential classification of 1 as having an “inverted ligand field” due to the predominantly ligand-based character of the LUMO.[46,47] Spectroscopic data (XAS, RIXS) collected by Lancaster during 2016-2019 provided the first experimental evidence in support of an inverted ligand field in 1 and related, formally Cu(III) compounds.[44,48] Single-crystal high-resolution charge density analysis of 1 conducted by Overgaard in 2019 also indicated a Cu(I) assignment.[45] However, in 2022 Cutsail revisited spectroscopic analysis of 1 and proposed a physical Cu(III), d8 assignment on the basis of Cu K-edge XAS and Cu Kβ valence-to-core X-ray emission spectroscopies.[49] A rebuttal of this assignment recently appeared in the literature,[50] highlighting the fact that the definitive electronic structure description for 1 remains in flux.
Another method for probing a metal center’s physical oxidation state is resonant diffraction anomalous fine structure (DAFS) analysis, which is a high-resolution multiwavelength anomalous diffraction (MAD) technique. DAFS measurements involve conducting single-crystal X-ray diffraction experiments at various energies near the metal K-edge and observing changes in the diffraction patterns due to metal X-ray absorption and resulting anomalous diffraction. The anomalous scattering terms (f′ and f′′) of the atomic scattering factor (f) are refined against the variable-energy data based on a structural model derived from separately collected, high-energy diffraction data. The f′ term tends to undergo a dramatic decrease at the resonant energy at which a given metal site absorbs X-ray photons. This f′min energy is, in theory, directly proportional to Zeff,[51] which in turn is proportional to “physical oxidation state”.[52–55] DAFS is typically used to analyze multinuclear metal complexes because of its unique ability to deconvolute X-ray absorption profiles of crystallographically unique metal sites within the same molecule even in homometallic cases.[54–61] DAFS can also be used to probe the physical oxidation states of mononuclear metal complexes,[51,62] although this application is not typically emphasized compared to the more commonly used XAS methods. Given that independent evaluations of 1 by XAS techniques led previous authors to contradictory conclusions,[44,49] we hypothesized that DAFS analysis of 1 would provide complementary data that might lend clarity on its electronic structure. Here we report DAFS data for 1 and a series of related Cu-CF3 complexes: (Ph3P)3CuCF3, (phen)(PPh3)CuCF3, and (bpy)Cu(CF3)3.[63] Combining these data with our previous benchmarking series for Cu K-edge DAFS,[53] the electronic structure of 1 is re-evaluated. Our most striking finding is that, although dramatic changes in DAFS profiles are observed across the series of complexes examined, these shifts can be attributed solely to the presence of CF3 ligands without invoking changes in Cu oxidation state. As such, the experimental data presented herein provides support for the inverted ligand field interpretation for 1.
Results and Discussion
We began our investigation by conducting DAFS measurements on single crystals of formally Cu(III) anion 1 as its PPN+ salt (PPN+ = bis(triphenylphosphine)iminium)[36,37] for comparison to formally Cu(II) anion [CuCl4]2− (2) which has a square-planar (D4h) geometry as its bis(β-alaninium) salt.[53,64] Importantly, these salts of 1 and 2 share similar square planar geometries at Cu. The f′ vs. E profiles for both 1 and 2 show doublet in-edge shapes (Figure 1), which is typical for four-coordinate Cu(I) and Cu(II) complexes.[53] (The f′′ vs. E plots for these and all complexes are presented in Supporting Information.) Interestingly, while the falling-edge f′ traces of 1 and 2 are nearly indistinguishable, they diverge drastically in the rising edge region (8990-9006 eV) before converging at ~9007 eV. The rising edge positions that occur after the complex in-edge features are often used as probes of oxidation state (i.e., Zeff) in the DAFS literature.[53–55] Initially, one could attribute the observed ~8-eV blue shift of f′[1] relative to f′[2] at the rising edge to a higher copper valency [i.e., Cu(III)] in 1, given the previously benchmarked 3-5 eV blue shift for oxidation from Cu(I) to Cu(II).[53] To probe this issue further, a systematic study of different trifluoromethylcopper complexes and other reference compounds was undertaken.
Figure 1.
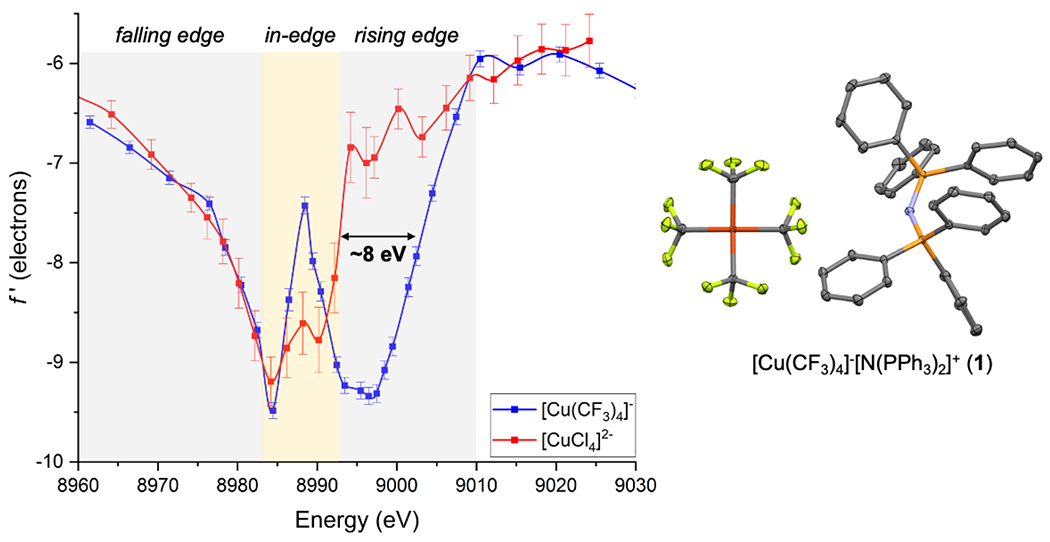
(left) Experimentally determined energy dependence of the f′ scattering factor for the Cu sites in [Cu(CF3)4][PPN] (1) and [β-alaninium]2[CuCl4] (2),[53] and (right) crystal structure of 1. Non-hydrogen atoms are shown as thermal ellipsoids (50% probability), and hydrogens are omitted for clarity.
Both complexes, (Ph3P)3CuCF3 (3)[65] and (Ph3P)3CuCl (4)[53,66,67], contain C3V-symmetric, formally Cu(I) centers supported by tris(triphenylphosphine) ligand shells, differing only by replacement of a single Cl ligand with CF3. Complex 3 crystallized with three molecules in its asymmetric unit, allowing for the f′ and f′′ parameters to be refined independently for three different Cu sites. The resulting plots were practically indistinguishable (Figure S2–S3), and so data for only one Cu site is presented Figure 2. Also in Figure 2 is the DAFS data for complex 4 from our previous literature report.[53] Again, the four-coordinate copper sites in both 3 and 4 exhibit doublet in-edge features, but with some notable differences. Complex 3 has an asymmetric in-edge shape with a local minimum at ~8982 eV and a global minimum at ~8992 eV (amplitude-weighted center: ~8988 eV). Conversely, the doublet feature centered at ~8985 eV is symmetric for 4. Thus, the in-edge center position for 3 is blue shifted by ~3 eV compared to that of 4. Additionally, the f′ traces for 3 and 4 differ in both the falling edge (8940-8980 eV) and rising edge (8988-9040 eV) regions. In the falling-edge region, f′[3] is blue shifted by ~5 eV compared to f′[4]. This trend also persists in the rising edge region, where f′[3] is blue shifted by ~2 eV relative to f’[4]. Therefore, switching one Cl ligand to a CF3 group, causes the f′ energy envelope to shift to higher energies by ~2-5 eV.
Figure 2.
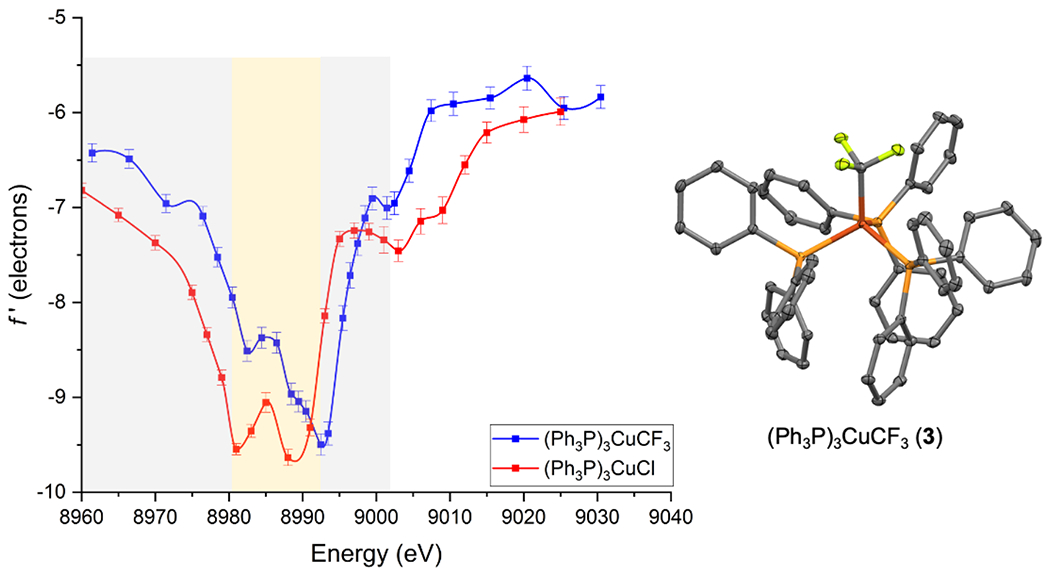
(left) Experimentally determined energy dependence of the f′ scattering factor for the Cu sites in (Ph3P)3CuCF3 (3) and (Ph3P)3CuCl (4),[53] and (right) crystal structure of 3. Non-hydrogen atoms are shown as thermal ellipsoids (50% probability), and hydrogens are omitted for clarity. Data for only one of three molecules in the asymmetric unit of 3 are shown.
The impact of trifluoromethyl ligation was probed further by comparing [Cu(CF3)4]− (1) and (bpy)Cu(CF3)3 (5, bpy = 2,2’-bipyridine),[37] which share the formal Cu(III) assignment but differ in the number of CF3 ligands. In contrast to the four-coordinate complexes previously discussed, five-coordinate 5 shows a quite different in-edge peak shape (Figure 3) due to the changes in the ligand shell and the coordination number/geometry.[53–55,68,69] A complex set of in-edge features was observed for 5, which matches the highly structured XAS spectrum previously reported for this compound (Figure S6)[48]. In the falling edge region (8960-8984 eV), f′[5] shifts ~3 eV higher than f′[1] (Figure S7). Similarly, the rising-edge position of f′[5] is blue shifted by ~3 eV compared to f′[1] before converging at ~9002 eV. Thus, while 1 and 5 have the same formal oxidation state assignment, the energy envelop spanned by f′[5] is shifted to higher energy than that of f′[1] by ~3 eV. This shift is in accord with previous XAS[68,69] and DAFS literatures[54,55] including our previous Cu K-edge DAFS study,[53] which showed that increases in Cu coordination number cause f’ plots to blue shift by ~3.5 eV per added ligand. To account for the coordination number differences between 1 and 5, an energy correction of −3.5 eV is applied to 5 in the linear regression analysis described below.
Figure 3.

(left) Experimentally determined energy dependence of the f′ scattering factor for the Cu sites in (Ph3P)3CuCF3 (3), (bpy)Cu(CF3)3 (5), and (Ph3P)(phen)CuCF3 (6), and (right) crystal structures of 5 and 6. Non-hydrogen atoms are shown as thermal ellipsoids (50% probability), and hydrogens are omitted for clarity. A correction of −3.5 eV was applied to DAFS data for 5 (see text).
Next we analyzed (Ph3P)(phen)CuCF3 (6, phen = 1,10-phenanthroline)[65] for comparison to (Ph3P)3CuCF3 (3) and (bpy)Cu(CF3)3 (5). Complexes 3 and 6 have the same coordination number/geometry and the same number of CF3 groups but possess slightly different ligand shells (P3 vs PN2). Complexes 5 and 6 share bpy/phen ligand shells but differ in the number of CF3 groups (3 vs 1). As expected for a four-coordinate complex, f′[6] has a doublet in-edge shape (Figure 3). While the f′[3] and f′[6] traces are distinctive in the falling edge region (8960-8982 eV), they overlap on the rising right-hand side of the spectrum that is sensitive to changes in Zeff. In the falling-edge region, f′[6] is red shifted by ~2 eV. Thus, complex 6 displays a slightly broader energy envelop than 3. Peak broadening in DAFS is usually attributed to additional metal-ligand covalency,[53–55] here presumably introduced by π-acidic phen. These two complexes also exhibit different in-edge profiles corresponding to changes in the ligand environments as discussed previously for 3 and 4.
The f′[5] profile was found to be red-shifted by ~1.5 eV in the falling edge region compared to f′[6] (Figure 3). Reminiscent of the square planar [CuCl4]2− (2) case discussed above, the most drastic changes between 5 and 6 are observed in the rising edge region. The f′[6] trace is shifted ~4 eV lower in energy than f′[5].
The last compound we examined was formally Cu(II) complex, trans-CuBr2(pyBr)2 (7, pyBr = 2-bromopyridine),[70] which provides another square planar example for comparison to 1 and 2. The f’ profile of 7 overlays well with those of 1 and 2 in the falling- and in-edge regions but diverges in the rising edge region (Figure S9). It is advisable to avoid detailed interpretation of this rising-edge shift due to the well-known dependence of X-ray absorption profiles on halides.[52] Nonetheless, the qualitative comparison of 1, 2, and 7 serves to reinforce that ligand shell influences on DAFS responses of the square planar set are predominantly observed in the rising edge region of f’ vs. E (when controlling for coordination number/geometry).
When analyzing the preceding data globally, it is evident that there is a notable “CF3 effect” on the rising edge position, with each added CF3 group blue shifting the resonant energy. In fact, plotting the rising edge energy (at f′ = −8, see Supporting Information for detailed analysis procedure) against number of CF3 ligands gives an apparent linear correlation that is independent of formal Cu oxidation state (Figure 4). The linear regression slope is ~2-3 eV per CF3.
Figure 4.

Linear correlation between number of CF3 ligands and rising-edge energy at f′ = −8 (see SI). An energy correction of −3.5 eV was applied to complex 5, as described in the text. Results of linear regression (95% confidence intervals): R2 = 0.978, slope = 2.6 ± 0.7 eV/CF3, y-intercept = 8992 ± 1 eV.
Having established that the number of CF3 ligands (independent of formal Cu oxidation state) is the dominant factor controlling the rising edge position, with ~2-3 eV blueshift in f′ per added CF3 group, we revisited the DAFS profiles of formally Cu(III) complex 1 and formally Cu(II) complex 2. Both these compounds show doublet in-edge features like four-coordinate 3, 4, 6, and 7 but unlike five-coordinate 5. In the falling edge region, the f′ plots of square planar complexes 1 and 2 are indistinguishable. However, they diverge drastically in the rising edge region that is often sensitive to Zeff,[53–55] with 1 shifted to higher energy than 2 by ~8 eV. Given that both 1 and 2 exhibit similar coordination environments, initially it is tempting to assign the higher rising-edge f′ position to a higher Zeff in 1 presumably resulting from its higher oxidation state, i.e., Cu(III). However, through global analysis of all the complexes, a ~2-3 eV per CF3 effect on rising-edge f′ position was determined (Figure 4). Since 1 has four additional CF3 ligands compared to 2, this CF3 effect completely accounts for the ~8 eV difference between 1 and 2. In other words, if anion 1 truly contained a Cu(III) center, one would expect the rising edge to have shifted even further to higher energy (by an additional ~3-5 eV according to previous benchmarking)[53]. Instead, the ~8-eV shift between 1 and 2 is consistent with their having roughly similar Cu oxidation levels. (The [CuCl4]2− anion in D4h symmetry is highly covalent, with the singly-occupied molecular orbital possessing 61% Cu 3dx2-y2 character.[71,72]) A complimentary interpretation is evident for complex 5 after having applied a correction for the coordination number effect[53] on rising-edge f′ energy. These observations suggests that, in accord with the inverted ligand field model,[44,47,48] [Cu(CF3)4]− and other formally trifluoromethylcopper(III) complexes are best described as Cu(I) complexes with dn counts approaching 10.
Conclusion
Whereas DAFS has typically been used for deconvoluting redox load in multinuclear metal clusters,[54–61] here this technique was applied to mononuclear complexes to probe physical oxidation state at Cu. Because XAS techniques previously led to contradictory conclusions about the electronic structure of [Cu(CF3)4]− and other formally Cu(III) complexes,[44,49] the use of DAFS to probe physical oxidation state has provided complementary and clarifying experimental data. From these data, a ~2-3 eV “CF3 effect” on the resonant Cu K-edge energy was identified. This effect accounts completely for energy shifts between Cu complexes with different formal oxidation states, implying that all complexes in this study have roughly the same Cu oxidation level. As such, this study provides additional support for the inverted ligand field model[44,47,48] used to describe many formally Cu(III) complexes.
Supplementary Material
Acknowledgements
This project was funded by NIH (R35 GM140850 to N.P.M.). P.A. was supported by a Moriarty Graduate Fellowship from the UIC Department of Chemistry. NSF’s ChemMatCARS Sector 15 is supported by the Divisions of Chemistry (CHE) and Materials Research (DMR), National Science Foundation, under grant number NSF/CHE-1834750. Use of the Advanced Photon Source, an Office of Science User Facility operated for the U.S. Department of Energy (DOE) Office of Science by Argonne National Laboratory, was supported by the U.S. DOE under Contract No. DE-AC02-06CH11357.
Footnotes
Supporting information for this article is given via a link at the end of the document.
References
- [1].Müller K, Faeh C, Diederich F, Science 2007, 317, 1881–1886. [DOI] [PubMed] [Google Scholar]
- [2].O’Hagan D, Chem. Soc. Rev 2008, 37, 308–319. [DOI] [PubMed] [Google Scholar]
- [3].Chen B, Vicic DA, in Organomet. Fluor. Chem (Eds.: Braun T, Hughes RP), Springer International Publishing, Cham, 2015, pp. 113–141. [Google Scholar]
- [4].Tomashenko OA, Grushin VV, Chem. Rev 2011, 111, 4475–4521. [DOI] [PubMed] [Google Scholar]
- [5].Li X, Shi X, Li X, Shi D, Beilstein J. Org. Chem 2019, 15, 2213–2270. [DOI] [PMC free article] [PubMed] [Google Scholar]
- [6].Mandal D, Maji S, Pal T, Kumar Sinha S, Maiti D, Chem. Commun 2022, 58, 10442–10468. [DOI] [PubMed] [Google Scholar]
- [7].Bour JR, Camasso NM, Meucci EA, Kampf JW, Canty AJ, Sanford MS, J. Am. Chem. Soc 2016, 138, 16105–16111. [DOI] [PubMed] [Google Scholar]
- [8].Meucci EA, Nguyen SN, Camasso NM, Chong E, Ariafard A, Canty AJ, Sanford MS, J. Am. Chem. Soc 2019, 141, 12872–12879. [DOI] [PMC free article] [PubMed] [Google Scholar]
- [9].Grushin VV, Marshall WJ, J. Am. Chem. Soc 2006, 128, 12644–12645. [DOI] [PubMed] [Google Scholar]
- [10].Bakhmutov VI, Bozoglian F, Gómez K, González G, Grushin VV, Macgregor SA, Martin E, Miloserdov FM, Novikov MA, Panetier JA, Romashov LV, Organometallics 2012, 31, 1315–1328. [Google Scholar]
- [11].Ball ND, Kampf JW, Sanford MS, J. Am. Chem. Soc 2010, 132, 2878–2879. [DOI] [PMC free article] [PubMed] [Google Scholar]
- [12].Winston MS, Wolf WJ, Toste FD, J. Am. Chem. Soc 2014, 136, 7777–7782. [DOI] [PMC free article] [PubMed] [Google Scholar]
- [13].Morimoto H, Tsubogo T, Litvinas ND, Hartwig JF, Angew. Chem. Int. Ed 2011, 50, 3793–3798. [DOI] [PMC free article] [PubMed] [Google Scholar]
- [14].Senecal TD, Parsons AT, Buchwald SL, J. Org. Chem 2011, 76, 1174–1176. [DOI] [PMC free article] [PubMed] [Google Scholar]
- [15].Dubinina GG, Furutachi H, Vicic DA, J. Am. Chem. Soc 2008, 130, 8600–8601. [DOI] [PubMed] [Google Scholar]
- [16].Liu T, Shen Q, Org. Lett 2011, 13, 2342–2345. [DOI] [PubMed] [Google Scholar]
- [17].Oishi M, Kondo H, Amii H, Chem Commun 2009, 1909. [DOI] [PubMed] [Google Scholar]
- [18].Knauber T, Arikan F, Röschenthaler G-V, Gooßen LJ, Chem. – Eur. J 2011, 17, 2689–2697. [DOI] [PubMed] [Google Scholar]
- [19].Zhang C-P, Wang Z-L, Chen Q-Y, Zhang C-T, Gu Y-C, Xiao J-C, Angew. Chem. Int. Ed 2011, 50, 1896–1900. [DOI] [PubMed] [Google Scholar]
- [20].Dai J-J, Fang C, Xiao B, Yi J, Xu J, Liu Z-J, Lu X, Liu L, Fu Y, J. Am. Chem. Soc 2013, 135, 8436–8439. [DOI] [PubMed] [Google Scholar]
- [21].Xu X, Chen H, He J, Xu H, Chin. J. Chem 2017, 35, 1665–1668. [Google Scholar]
- [22].Paeth M, Carson W, Luo J-H, Tierney D, Cao Z, Cheng M-J, Liu W, Chem. – Eur. J 2018, 24, 11559–11563. [DOI] [PubMed] [Google Scholar]
- [23].Nebra N, Grushin VV, J. Am. Chem. Soc 2014, 136, 16998–17001. [DOI] [PubMed] [Google Scholar]
- [24].Guo S, AbuSalim DI, Cook SP, J. Am. Chem. Soc 2018, 140, 12378–12382. [DOI] [PMC free article] [PubMed] [Google Scholar]
- [25].Cheng L-J, Mankad NP, Chem. Soc. Rev 2020, 49, 8036–8064. [DOI] [PubMed] [Google Scholar]
- [26].Beletskaya IP, Cheprakov AV, Coord. Chem. Rev 2004, 248, 2337–2364. [Google Scholar]
- [27].Hossain A, Bhattacharyya A, Reiser O, Science 2019, 364, eaav9713. [DOI] [PubMed] [Google Scholar]
- [28].Willert-Porada MA, Burton DJ, Baenziger NC, J. Chem. Soc. Chem. Commun 1989, 1633–1634. [Google Scholar]
- [29].Zhang S-L, Bie W-F, RSC Adv. 2016, 6, 70902–70906. [Google Scholar]
- [30].Zhang S-L, Bie W-F, Dalton Trans. 2016, 45, 17588–17592. [DOI] [PubMed] [Google Scholar]
- [31].Zhang S-L, Xiao C, Wan H-X, Dalton Trans. 2018, 47, 4779–4784. [DOI] [PubMed] [Google Scholar]
- [32].Tan X, Liu Z, Shen H, Zhang P, Zhang Z, Li C, J. Am. Chem. Soc 2017, 139, 12430–12433. [DOI] [PubMed] [Google Scholar]
- [33].Luo Y, Li Y, Wu J, Xue X-S, Hartwig JF, Shen Q, Science 2023, 381, 1072–1079. [DOI] [PMC free article] [PubMed] [Google Scholar]
- [34].Paeth M, Tyndall SB, Chen L-Y, Hong J-C, Carson WP, Liu X, Sun X, Liu J, Yang K, Hale EM, Tierney DL, Liu B, Cao Z, Cheng M-J, Goddard WA, Liu W, J. Am. Chem. Soc 2019, 141, 3153–3159. [DOI] [PubMed] [Google Scholar]
- [35].Liu S, Liu H, Liu S, Lu Z, Lu C, Leng X, Lan Y, Shen Q, J. Am. Chem. Soc 2020, 142, 9785–9791. [DOI] [PubMed] [Google Scholar]
- [36].Naumann D, Roy T, Tebbe K-F, Crump W, Angew. Chem. Int. Ed. Engl 1993, 32, 1482–1483. [Google Scholar]
- [37].Romine AM, Nebra N, Konovalov AI, Martin E, Benet-Buchholz J, Grushin VV, Angew. Chem. Int. Ed 2015, 54, 2745–2749. [DOI] [PubMed] [Google Scholar]
- [38].Hickman AJ, Sanford MS, Nature 2012, 484, 177–185. [DOI] [PMC free article] [PubMed] [Google Scholar]
- [39].Preiss U, Krossing I, Für Anorg Z. Allg. Chem 2007, 633, 1639–1644. [Google Scholar]
- [40].Snyder JP, Angew. Chem. Int. Ed. Engl 1995, 34, 80–81. [Google Scholar]
- [41].Kaupp M, von Schnering HG, Angew. Chem. Int. Ed. Engl 1995, 34, 986–986. [Google Scholar]
- [42].Snyder JP, Angew. Chem. Int. Ed. Engl 1995, 34, 986–987. [Google Scholar]
- [43].Aullón G, Alvarez S, Theor. Chem. Acc 2009, 123, 67–73. [Google Scholar]
- [44].Walroth RC, Lukens JT, MacMillan SN, Finkelstein KD, Lancaster KM, J. Am. Chem. Soc 2016, jacs.5b10819-10. [DOI] [PubMed] [Google Scholar]
- [45].Gao C, Macetti G, Overgaard J, Inorg. Chem 2019, 58, 2133–2139. [DOI] [PubMed] [Google Scholar]
- [46].Alvarez S, Hoffmann R, Mealli C, Chem. - Eur. J 2009, 15, 8358–8373. [DOI] [PubMed] [Google Scholar]
- [47].Hoffmann R, Alvarez S, Mealli C, Falceto A, Cahill TJ, Zeng T, Manca G, Chem. Rev 2016, 116, 8173–8192. [DOI] [PubMed] [Google Scholar]
- [48].DiMucci IM, Lukens JT, Chatterjee S, Carsch KM, Titus CJ, Lee SJ, Nordlund D, Betley TA, MacMillan SN, Lancaster KM, J. Am. Chem. Soc 2019, 141, 18508–18520. [DOI] [PMC free article] [PubMed] [Google Scholar]
- [49].Geoghegan BL, Liu Y, Peredkov S, Dechert S, Meyer F, DeBeer S, Cutsail GE, J. Am. Chem. Soc 2022, 144, 2520–2534. [DOI] [PMC free article] [PubMed] [Google Scholar]
- [50].DiMucci IM, Titus CJ, Nordlund D, Bour JR, Chong E, Grigas DP, Hu C-H, Kosobokov MD, Martin CD, Mirica LM, Nebra N, Vicic DA, Yorks LL, Yruegas S, MacMillan SN, Shearer J, Lancaster KM, Chem. Sci 2023, 14, 6915–6929. [DOI] [PMC free article] [PubMed] [Google Scholar]
- [51].Wu G, Zhang Y, Ribaud L, Coppens P, Wilson C, Iversen BB, Larsen FK, Inorg. Chem 1998, 37, 6078–6083. [DOI] [PubMed] [Google Scholar]
- [52].MacMillan SN, Lancaster KM, ACS Catal. 2017, 7, 1776–1791. [Google Scholar]
- [53].Alayoglu P, Chang T, Lorenzo Ocampo MV, Murray LJ, Chen Y-S, Mankad NP, Inorg. Chem 2023, 62, 15267–15276. [DOI] [PMC free article] [PubMed] [Google Scholar]
- [54].Bartholomew AK, Teesdale JJ, Sánchez RH, Malbrecht BJ, Juda CE, Ménard G, Bu W, Iovan DA, Mikhailine AA, Zheng SL, Sarangi R, Wang SYG, Chen YS, Betley TA, Proc. Natl. Acad. Sci. U. S. A 2019, 116, 15836–15841. [DOI] [PMC free article] [PubMed] [Google Scholar]
- [55].Bartholomew AK, Musgrave RA, Anderton KJ, Juda CE, Dong Y, Bu W, Wang S-Y, Chen Y-S, Betley TA, Chem. Sci 2021, 12, 15739–15749. [DOI] [PMC free article] [PubMed] [Google Scholar]
- [56].Hernández Sánchez R, Champsaur AM, Choi B, Wang SG, Bu W, Roy X, Chen YS, Steigerwald ML, Nuckolls C, Paley DW, Angew. Chem. - Int. Ed 2018, 57, 13815–13820. [DOI] [PubMed] [Google Scholar]
- [57].Einsle O, Andrade SLA, Dobbek H, Meyer J, Rees DC, J. Am. Chem. Soc 2007, 129, 2210–2211. [DOI] [PMC free article] [PubMed] [Google Scholar]
- [58].Spatzal T, Schlesier J, Burger E-M, Sippel D, Zhang L, Andrade SLA, Rees DC, Einsle O, Nat. Commun 2016, 7, 10902. [DOI] [PMC free article] [PubMed] [Google Scholar]
- [59].Han H, Carozza JC, Zhou Z, Zhang Y, Wei Z, Abakumov AM, Filatov AS, Chen YS, Santalucia DJ, Berry JF, Dikarev EV, J. Am. Chem. Soc 2020, 142, 12767–12776. [DOI] [PubMed] [Google Scholar]
- [60].Arnett CH, Kaiser JT, Agapie T, Inorg. Chem 2019, 58, 15971–15982. [DOI] [PubMed] [Google Scholar]
- [61].Gao Y, Frost-Jensen A, Pressprich MR, Coppens P, Marquez A, Dupuis M, J. Am. Chem. Soc 1992, 114, 9214–9215. [Google Scholar]
- [62].Zhang L, Kaiser JT, Meloni G, Yang KY, Spatzal T, Andrade SLA, Einsle O, Howard JB, Rees DC, Angew. Chem. - Int. Ed 2013, 52, 10529–10532. [DOI] [PMC free article] [PubMed] [Google Scholar]
- [63].Supporting X-ray crystallography data is available for download from the CCDC (deposition numbers 2283318, 2283319, 2283320, 2283321, 2283426)
- [64].Willett RD, Jardine FH, Rouse I, Wong RJ, Landee CP, Numata M, Phys. Rev. B 1981, 24, 5372–5381. [Google Scholar]
- [65].Tomashenko OA, Escudero-Adán EC, Martínez Belmonte M, Grushin VV, Angew. Chem. Int. Ed 2011, 50, 7655–7659. [DOI] [PubMed] [Google Scholar]
- [66].Folting K, Huffman J, Mahoney W, Acta Crystallogr. C 1987, C43, 1490–1492. [Google Scholar]
- [67].Carlson TF, Fackler Jnr JP, Kresinski RA, Acta Crystallogr. C 1996, 52, 1117–1119. [Google Scholar]
- [68].Kau LS, Spira-Solomon DJ, Penner-Hahn JE, Hodgson KO, Solomon EI, J. Am. Chem. Soc 1987, 109, 6433–6442. [Google Scholar]
- [69].Rudolph J, Jacob CR, Inorg. Chem 2018, 57, 10591–10607. [DOI] [PubMed] [Google Scholar]
- [70].Awwadi FF, Willett RD, Haddad SF, Twamley B, Cryst. Growth Des 2006, 6, 1833–1838. [Google Scholar]
- [71].Gewirth AA, Cohen SL, Schugar HJ, Solomon EI, Inorg. Chem 1987, 26, 1133–1146. [Google Scholar]
- [72].George SJ, Lowery MD, Solomon EI, Cramer SP, J. Am. Chem. Soc 1993, 115, 2968–2969. [Google Scholar]
Associated Data
This section collects any data citations, data availability statements, or supplementary materials included in this article.