

Abstract
in vitro screening platforms to assess teratogenic potential of compounds are emerging rapidly. ReproTracker is a human induced pluripotent stem cells (hiPSCs)-based biomarker assay that is shown to identify the teratogenicity potential of new pharmaceuticals and chemicals reliably. In its current state, the assay is limited to identifying the potential teratogenic effects and does not immediately quantify a clinical dose relevant to the exposure of chemicals or drugs observable in mothers or fetuses. The goal of this study was to evaluate whether the ReproTracker assay can be extrapolated in vivo and quantitatively predict developmental toxicity exposure levels of two known human teratogens, thalidomide, and carbamazepine. Here, we utilized Physiologically Based Pharmacokinetic (PBPK) modeling to describe the pharmacokinetic behavior of these compounds and conducted an in vitro to in vivo extrapolation (IVIVE) approach to predict human equivalent effect doses (HEDs) that correspond with in vitro concentrations potentially associated with adverse outcomes in ReproTracker. The HEDs derived from the ReproTracker concentration predicted to cause developmental toxicity were close to the reported teratogenic human clinical doses and the HED derived from the rat or rabbit developmental toxicity study. The ReproTracker derived-HED revealed to be sensitive and protective of humans.
Overall, this pilot study demonstrated the importance of integrating PBPK model in extrapolating and assessing developmental toxicity in vitro. The combination of these tools demonstrated that they could improve the safety assessment of drugs and chemicals without animal testing.
Keywords: New Approach Methodology, Developmental toxicity, ReproTracker, PBPK modeling, in vitro to in vivo extrapolation, human-induced pluripotent stem cells
1-. INTRODUCTION
Animal testing has been the gold standard in determining the possible impact of chemicals on human health for decades. Embryo-fetal development tests (OECD 414) are expensive ($100,000+/study) and use an exorbitant number of animals (560/study). Daston and Knudsen (2010) have established that the power of animal models to predict developmental effects in humans is low: concordance is estimated at 70%. Thus, faster, less expensive, and more targeted techniques are needed for informing chemical safety decisions in humans. The next generation of risk and safety assessment will evolve by introducing these new approach methods that include in vitro experiments coupled with computational tools complementing current regulatory standards.
Developmental and reproductive toxicity (DART) effects identified through OECD 414 and other in-life testing are challenging endpoints to capture with in vitro approaches. Many effects manifest over the life-course or multi-generational timelines, the duration of which is not amenable to in vitro cell culture models. Additionally, many classical developmental endpoints are tied to morphology, which is difficult to model in culture systems due to the functional and structural complexity of intact organisms and the often-poor understanding of how molecular changes correlate to developmental effects. In vitro screening platforms to assess teratogenic potential of compounds are emerging rapidly. These novel technologies show a promising ability to predict the outcomes of in-life animal studies and to provide an attractive means for identifying teratogens and other developmental toxicants. ReproTracker (Jamalpoor et al. 2022) is a human induced pluripotent stem cells (hiPSCs)-based biomarker assay that is shown to reliably identify the teratogenicity potential of new pharmaceuticals and chemicals. The assay is based on the differentiation of hiPSCs into functional cardiomyocytes, hepatocytes, and neural rosettes. Proper stem cell differentiation is investigated by morphological profiling and assessment of time-dependent expression patterns of cell-specific biomarkers. However, a major challenge of implementing in vitro models in a safety decision framework is understanding the quantitative aspects of compound dose-response at a specific target site during a specific “window of susceptibility” along the reproductive/developmental axis. These in vitro responses of potential toxic outcomes can be improved for hazard identification applications by introducing a quantitative framework to translate into equivalent human exposures.
In vitro to in vivo extrapolation (IVIVE) can translate the in vitro bioactive concentrations to external exposures that would be equal to or predicted to result in plasma concentrations. Of note, the IVIVE approach is rather a complex process and relies on both in vitro and in vivo pharmacokinetics and pharmacodynamics of the compounds. Physiologically Based Pharmacokinetic (PBPK) modeling approach can be applied to embody the physiology of an organism and allow for a quantitative understanding of a compound’s kinetics, yielding a biologically based mathematical relationship between organism-level exposure and concentration in a target tissue. In addition, to evaluate developmental effects, a whole-body pregnancy specific PBPK models for the specific period of embryonic development, including the aspect of the uterus, where the blastocyst is embedded is required. Somes studies demonstrated the benefits of integrating PBPK modeling and IVIVE and showed that the combination of these tools can be used to improve the safety assessment of drugs and chemicals while reducing animal testing (Chang et al. 2022, Martin et al. 2014).
The goal of this study was therefore to evaluate whether the ReproTracker assay can predict the in vivo developmental toxicity exposure levels of drugs using PBPK models describing their biokinetic behavior and IVIVE approach. Here, we performed IVIVE to predict human equivalent developmental toxicity dose levels (HEDs) of two known human teratogens (Thalidomide and Carbamazepine) that would correspond with in vitro concentrations associated with adverse outcomes in ReproTracker. The in vitro-derived HEDs were then compared to HEDs associated with the lowest observed effect levels (LOAELs) in rats and rabbits’ developmental studies, and human clinical doses (EMA 2020). The reliability of IVIVE outcomes for DART testing and the impact of PBPK modeling on risk assessment predictions were evaluated using in vivo pharmacokinetic studies of the test compounds in humans.
2-. METHODS
2.1. Chemicals
Thalidomide (CAS# 50–35-1) and carbamazepine (CAS# 298–46-4) used in this study were purchased from Sigma-Aldrich. The purity of the test compounds was greater than 98% (HPLC-grade standards). Stock solutions of the test compounds were prepared in dimethyl sulfoxide (DMSO; Sigma-Aldrich).
2.2. Assessment of developmental toxicity in The ReproTracker Assay
In ReproTracker, first a broad dose range-finding is performed to select the compound concentrations that will be applied in differentiation protocols. It is important to assess the impact on stem cell differentiation at non-cytotoxic concentrations, as highly cytotoxic concentrations of compounds would disturb proper stem cell differentiation while not providing relevant information about their potential teratogenic properties. The cellular toxicity of each tested compound was determined using the AlamarBlue cell viability assay (Sigma-Aldrich) in undifferentiated hiPSCs as described previously (Jamalpoor et al. 2022). In short, cells were seeded into a 96-well plate and incubated at 37°C for 24 hours. Next, cells were exposed to 20 consecutive concentrations in 2-fold dilutions steps of the test substances at a maximum concentration of 1 mM or the maximum soluble concentration. Cytotoxicity was estimated after 7 days of hiPSCs exposure to the tested compounds. Here, the medium was refreshed on day 3, and day 7. Subsequently, cells were washed and incubated with resazurin solution (0.01 mg/mL in PBS) for 2 hours, and absorbance was read via a FluoroSkan Microplate Fluorometer (Thermo Scientific) at excitation wavelength, 530 nm; emission wavelength, 590 nm. Next, the hiPSCs were differentiated towards cardiomyocytes, hepatocytes, and neuronal rosettes. During differentiation, hiPSCs were exposed to 5 concentrations of each tested compound. The lowest concentration that induced cytotoxicity (max 20–40%) in the dose finding was applied as the top concentration for the differentiation experiment. On day 0 (starting day of differentiation protocol), fresh dilutions of chemicals were prepared in differentiation medium and added to the cells with 0.1% v/v final concentration of the solvent (i.e., DMSO). Cells were refreshed 3 times during cardiomyocytes (on day 2, 6, and 10), 5 times during hepatocytes (on day 3, 7, 10, 14 and 17) and 3 times during neural rosette differentiation (on day 3, 7, and 10). The test substance was added to the specific differentiation medium before each medium exchange. Finally, potential developmental toxicity was investigated by quantitative gene expression profiling of selected biomarkers. Differentiation of hiPSCs into early mesoderm and, finally, to cardiomyocytes was closely monitored by quantifying the expression of mesodermal biomarker BMP4 and the cardiomyocyte-specific biomarker gene, MYH6. Appropriate hiPSCs differentiation into early endoderm and, finally, to hepatocytes was closely monitored by quantifying the timely expression of endodermal biomarker FOXA2 and the hepatocyte-specific biomarker, AFP. Differentiation of hiPSCs into early ectoderm and, finally, to neural rosettes was closely monitored by quantifying the expression of the neural ectoderm biomarker gene, PAX6 and the neural rosette-specific biomarker, Nestin. Besides the lineage- and cell-specific biomarkers, OCT4 (pluripotency marker) was included as an internal control to evaluate pluripotency.
In ReproTracker, compound classification was primarily based on a significant reduction in the selected biomarker expression following exposure to the test substances. The threshold of induced developmental toxicity was defined as one time the standard deviation of the biomarker expression levels in the solvent control cultures. Reduced expression of the selected biomarkers below the set threshold level in a concentration-dependent manner, upon exposure to a minimum of 2 consecutive non-cytotoxic concentrations, indicated disruption of the developmental program and, therefore, the compound was classified as a teratogen. Moreover, as an additional endpoint, morphological abnormalities and decline in cardiomyocyte contraction in response to compound exposure during and at the end of the differentiation protocol were closely monitored. For morphology assessment, bright field images were acquired using Operetta CLSTM high content imager (PerkinElmer inc. USA). Disruption of morphology/functionality in exposed samples was scored subjectively. Of note, a compound affecting only morphology/functionality of the differentiated cells without having any effect on the selected biomarker genes, was a non-developmental toxicant in ReproTracker.
2.3. PBPK model description
The workflow for the development of the human pregnancy models for conducing IVIVE using thalidomide and carbamazepine consisted of initial human PBPK model development in adult males with successful validation of model predictions of thalidomide and carbamazepine plasma concentrations. Then, using a pregnancy PBPK model, accounting for important changes in physiology, and key drug specific model parameters used for adult males, simulations were performed to predict limited pharmacokinetic data in pregnant women. The pregnancy model was then used to simulate exposures associated with LOAELs from the ReproTracker assays. Endpoints were also estimated from animal studies. All simulations with the PBPK model were generated using Berkeley Madonna (Version 10.5.1). The model codes are in Supplemental 3.
The structure of the human PBPK model for thalidomide and carbamazepine is shown in Figure 1. The model includes blood and five tissue compartments: gastrointestinal (GI) tract, liver, fat, uterus, and rest of the body. The current model can simulate kinetics through oral ingestion and intravenous dosing in single or multiple daily exposure scenarios and incorporates age-dependent human physiology of pregnant women. The model also incorporates metabolism in the liver and blood. Thalidomide undergoes primarily non-enzymatic hydrolysis in plasma as well as enzymatic metabolism through cytochromes P450 (Lepper et al. 2006). Carbamazepine is largely metabolized in the liver by cytochromes P450 (Pearce et al. 2017). The PBPK model assumes flow-limited tissue uptake for all compartments, meaning that the tissue and blood concentrations reach an equilibrium as the blood passes through the tissue and that the blood flow to the tissues is the limiting process.
Figure 1. The structure of the human PBPK model -.
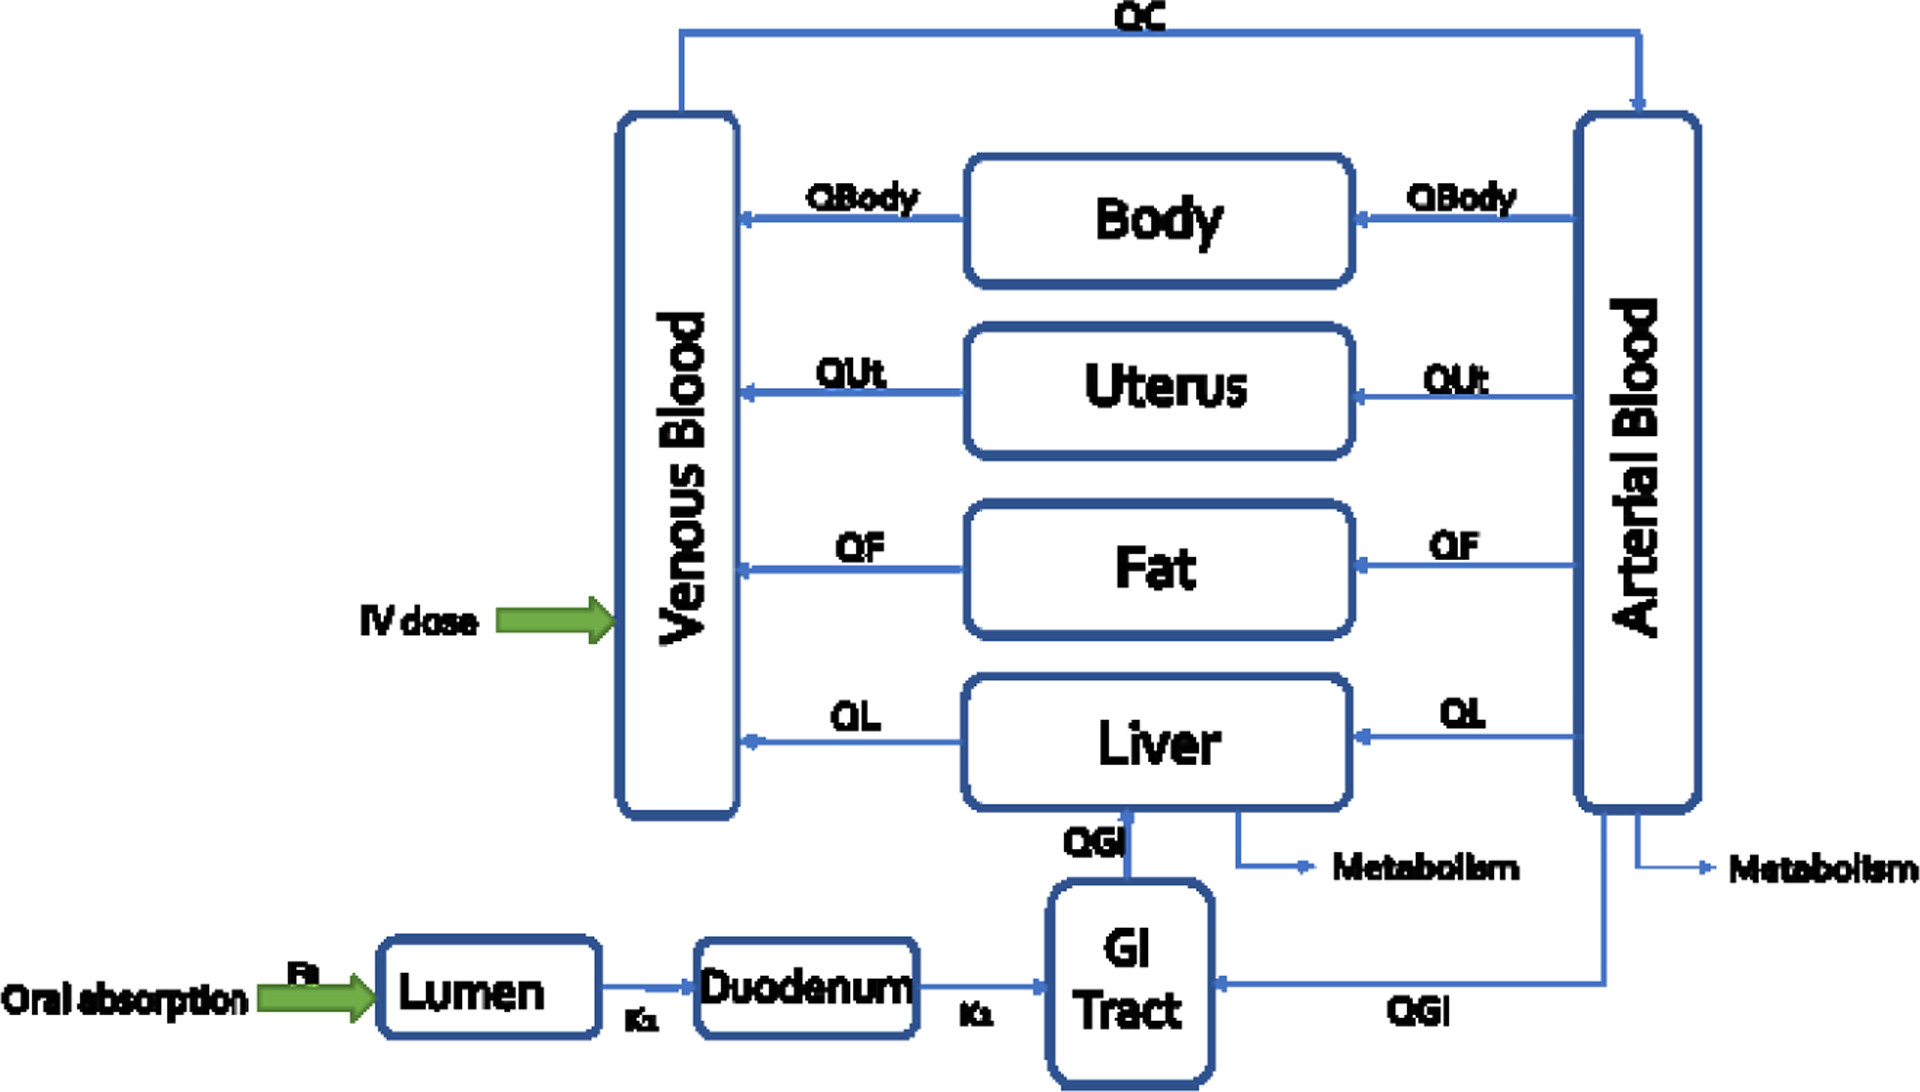
QL, QGI, QBody, QF, and QUt refer to blood flow to each tissue compartment. Fa describes the fraction available for absorption. K1 and k2 represent absorption rates for lumen to duodenum and from duodenum to GI tract.
2.3.1. Parameter estimation and analysis
All physiological parameters used in the current model are summarized in Supplemental 1 Table S1. The ReproTracker assay focuses on the gastrulation phase. Thus, a whole-body pregnancy specific PBPK model was developed for the developmental period of interest, including the uterus where the blastocyst is embedded, and the placenta is not yet formed. For the female pregnancy model used to do IVIVE, we chose to run the model at 5-week pregnancy and most of the parameters were taken from Kapraun et al. (2019), except for the uterus values that were taken from Abduljalil et al. (2012). Both authors created a repository of empirical models for tissue volumes, blood flow rates, and other quantities that undergo substantial changes in a human mother and her fetus during the time between conception and birth. The values reported in Table 1 of supplemental one corresponds to a 5-week pregnancy used for IVIVE and 8 weeks pregnancy used for validation of the pregnancy model. Chemical specific parameters are presented in Supplemental 1 Table S2. Metabolism was based on the oral clearance of thalidomide of 10.50 ± 2.10 L/h and on the apparent oral clearance of carbamazepine of 25 ± 5 mL/min after one dose of carbamazepine and 80 ± 30 mL/min after several doses (Rawlins et al. 1975; Lepper et al. 2006). Tissue:blood partition coefficients (PCs) are defined as the ratio of the equilibrium concentration of a test chemical between a specific tissue and blood. PCs are important determinants of the disposition of chemicals in different tissues. The PK-SIM software, freely available online (https://www.open-systems-pharmacology.org/), was used for the partition coefficient predictions. The partition coefficients (PC) were calculated using the algorithm of Rodgers and Rowland (Rodgers, Leahy, and Rowland 2005). The inputs to the algorithm were the octanol:water partition coefficient (Kow), the dissociation constant (pKa) and tissue composition. Parameters describing the absorption from the gut lumen to the systemic circulation are summarized in Supplemental 1 Table S3. Oral exposure is modeled using a 3-compartment absorption model, including lumen, duodenum, and remaining GI tract tissues. The blood flow from the GI enters the liver via the portal vein.
Table 1.
Carbamazepine plasma concentrations in 9 pregnant subjects (8-week pregnancy) after different oral scenarios (constant over all pregnancy) – Simulations using the in vivo data from Battino et al. 1985.
| Subjetcs | Dosing Scenarios* | Plasma Concentrations (μg/L) | |
|---|---|---|---|
| Human Data | Simulations | ||
| 1 | 400 + 200 + 200 | No Data | 10,648 |
| 2 | 200 + 200 + 300 | 4,777 | 10,375 |
| 3 | 200 + 200 + 200 | 6,399 | 8,543 |
| 4 | 200 + 200 + 400 | 7,500 | 12,206 |
| 5 | 200 + 400 + 400 | No Data | 14,986 |
| 6 | 300 + 300 | 7,211 | 8,647 |
| 7 | 200 + 200 + 400 | No Data | 12,206 |
| 8 | 200 + 200 + 400 | 5,600 | 12,206 |
| 9 | 200 | 4,200 | 2,103 |
Blood samples were always taken at 8am before the administration of the morning dose.
2.3.2. Calibration and validation of the model
Calibration of the PBPK model for thalidomide was performed using the toxicokinetic study by Teo et al. 2004 where 15 healthy male and female volunteers were administered a single 200 mg dose of thalidomide. The model was validated using toxicokinetic studies by Bai et al. 2012, and Fujita et al. 2008. Calibration of the PBPK model for carbamazepine was performed using the toxicokinetic study by Sumi et al. 1987 where 6 healthy subjects (male and female) were administered a solution or a tablet of 200 mg dose of carbamazepine. The model was validated using toxicokinetic studies by Wada et al. 1978, Bianchetti et al. 1987, Gerardin et al. 1976 and Bernus et al. 1994.
The PBPK model developed for human male was adapted to pregnant female by adding a uterus compartment and changing the physiological parameters according to section 2.2.1. Biomarkers used in the ReproTracker assay occur very early on in the pregnancy process which is why the model only has the uterus and no placenta or fetus. The only pharmacokinetic pregnancy data available in the literature was targeting stages of pregnancy going from 8 to 40 weeks. Therefore, we only simulated plasma concentrations at 8 weeks to compare the model simulations with the in vivo data from Battino et al. (1985) where plasma concentrations of carbamazepine were monitored in 9 pregnant epileptic patients treated with the drug alone at constant doses during pregnancy.
2.3.3. Sensitivity and Uncertainty Analysis
A sensitivity/uncertainty matrix can be used to determine the overall importance of a parameter. To evaluate the relative impact of each of the model parameters on each compound’s maximal concentration (Cmax) after oral exposure a local sensitivity analysis (LSA) was performed. The sensitivity coefficient (SC) was calculated according to the equation below (Teeguarden et al. 2005):
Each parameter was individually increased by 1% of its original value, with the other parameters held constant. The larger the absolute value of the sensitivity coefficient, the more important the parameter. A sensitivity coefficient of 1 represents a 1:1 relationship between the change in the parameter and the internal dose metric of choice. A negative SC indicates the given parameter influences the dose metric in an inverse direction. The SCs are grouped into one of three categories: namely, high (absolute values greater than or equal to 0.5), medium (absolute values greater than or equal to 0.2 but less than 0.5), or low (absolute values greater than or equal to 0.1 but less than 0.2), according to the IPCS guideline (WHO 2010).
Local sensitivity analysis uses the one-at-a-time sampling method to examine the uncertainty of parameters’ impact on model output. One of the shortcomings of the LSA is that it provides information on the parameter’s influence on the model outcome at the point it was computed. In addition, LSA does not consider the effect of the mutual interactions between parameters nor its influence on the model outputs. Therefore, LSA gives a limited view of model sensitivity. In contrast, global sensitivity analysis (GSA) methods investigate changes in the model outputs by varying all parameters simultaneously within their distributions or ranges. Examples of GSA are the Morris test and the extended Fourier Amplitude Sensitivity Test (eFAST). The Morris test calculates derivatives of the model outputs for each parameter and provides μ (the parameter’s influence on the model outputs) and σ metrics (estimates nonlinear effects or parameter interactions) to evaluate parameter sensitivity. The eFAST test is a variance-based GSA that quantifies which portion of a model output variation comes from the uncertainty in the model parameters. Given the distributions of the parameters, the method calculates the contribution of the parameters and their interactions to the model output variations. The eFAST test provides two sensitivity measures that vary with time: main effects (Si) and total effects (STi). The Si represents the reduction in model output variance if that parameter’s “true” value is known, and the STi represents the remaining proportion of the model output variance if all other parameters’ “true” values are known (McNally, Cotton, and Loizou 2011). The eFAST test can be, in some cases, computationally time-consuming. Both tests are implemented in Rvis software (version RVis_v0.9.11068.1_x64 from https://github.com/GMPtk/RVis was used).
We followed the sensitivity analysis workflow described in McNally et al. (2011), where the Morris test estimates the parameters which potentially affect the model outputs, and the eFAST GSA quantitatively analyzes those parameters. The purpose of the Morris test in the workflow was to save computational time by eliminating the least influential parameters. In this work, the eFAST method was rapid; therefore, there was no need to eliminate any of the parameters using Morris analysis.
The analysis was conducted at 10 and 50mg for thalidomide and 98.1 and 200mg for carbamazepine, the HED, and the therapeutic dose, respectively, for both compounds. For uterus and plasma concentrations, eFAST was run in a range of 1h to 24h, to investigate parameter sensitivities in the distribution and elimination phases.
The uncertainty of a model reflects the level of confidence in model predictions. The uncertainty usually arises from limitations in available knowledge in some input parameters that affect the model predictions. The uncertainty was qualitatively defined based on the origin and confidence in each parameter that were sensitive in the model. Most of our model parameters are reported to have medium or low uncertainty.
2.4. In vitro to in vivo extrapolation (IVIVE)
In vitro ReproTracker LOAELs were used to derive Human Equivalent Doses (HEDs) using the PBPK model (Figure 2).
Figure 2. In vitro to in vivo extrapolation.

Physiological parameters as well as parameters describing ADME processes of the chemical through the system were used to develop a PBPK model that can be used to predict the population distribution of plasma concentration from any given daily dose. Reverse dosimetry predicts administered doses equivalent to in vitro active concentration, which can be compared to the in vivo measurements (Adapted from Bell et al. (2018)).
The results of IVIVE were compared to in vivo toxicity data from rats and rabbits (LOAELs). Allometric scaling based on body weight was used to extrapolate rats and rabbits LOAELs from the ICH S5 (R3) guideline on reproductive toxicology: detection of toxicity to reproduction for human pharmaceuticals (EMA 2020) into HED that could be compared with the HED derived from the ReproTracker assay. The dose adjustment factor (DAF) is multiplied by the animal exposure (in mg/kg-day) to achieve the human equivalent exposure (in mg/kg-day). The derivation of the DAF is described in equation 2 (EPA 2013). Carbamazepine LOAELs were from the Food and Drug Administration (FDA 1967). For thalidomide, LOAELs were taken from Newman, Johnson, and Staples (1993), Schardein and Macina (2007); Christian et al. (2007).
| (Equation 1) |
| (Equation 2) |
The results of IVIVE were also compared to in vivo clinical data for thalidomide and carbamazepine. Thalidomide causes damage to the forming embryo in a short time sensitive window that extends between days 20 and days 36 after fertilization. Reports indicate that a single 50 mg tablet of thalidomide during the time-sensitive window is sufficient to cause birth defects in up to 50% of pregnancies (Vargesson 2015). For thalidomide, currently approved doses range from 100 to 400 mg/day. A dose of 50 mg was used for PK comparisons because that was the lowest dose used to treat insomnia when thalidomide was first developed. For carbamazepine, the therapeutic dose ranges from 100 to 800 mg twice daily. Finally, the Margin of Safety (MOS) was derived. It is usually calculated as the ratio of the toxic dose to 1% of the population to the dose that is 99% effective to the population. The toxic dose to 1% of the population refers to the in vitro HED which is the most sensitive concentration obtained in vitro across ReproTracker assays. The therapeutic dose was considered as the 99% effective dose to the population. The PBPK model was run at the in vitro HED and at the therapeutic dose for thalidomide and carbamazepine and the maximal concentration (Cmax) and the area under the curve (AUC) were recorded. The MOS was finally calculated.
3-. RESULTS
3.1. Developmental toxicity of thalidomide and carbamazepine and their LOAELs in ReproTracker
Thalidomide is a strong human teratogenic agent where its developmental toxicity cannot be detected in mouse models or in murine-based in vitro assays. In ReproTracker, exposure to non-cytotoxic concentrations of thalidomide decreased expression of cardiomyocyte-specific marker MYH6 in a dose-dependent manner starting at 0.4 μM and completely stopped the contraction ability of cardiomyocytes at 2 μM when compared to the non-exposed vehicle controls (Figure 3A, Supplementary figure S1). Thalidomide exposure also resulted in disruption of endoderm to hepatocyte differentiation, indicated by the reduced expression of the hepatocyte-specific marker AFP, and a disruption of the hepatocyte morphology starting at 2 μM (Figure 3A, Supplementary figure S1). Thalidomide had no effect on the morphology of neural rosettes, nor on expression pattern of the neural rosette-specific biomarker gene, NESTIN. Thalidomide, however, increased the gene expression of neural ectoderm biomarker gene (PAX6) in a dose-dependent manner (Figure 3A, Supplementary figure S1). Exposure to the antiepileptic drug carbamazepine in ReproTracker completely stopped the cardiomyocyte beating starting at 15.6 μM and disrupted the morphology of hepatocytes and neural rosettes at a concentration of 31.2 μM, and 15.6 μM, respectively (Figure 3B, Supplementary figure S1).Exposure to carbamazepine led to a significant and concentration-dependent decrease in expression of the cardiomyocyte-specific marker (MYH6), liver-specific markers (FOXA2, and AFP), and neural ectoderm biomarker gene (PAX6), when compared to controls (Figure 3B, Supplementary figure S1). In summary, both chemicals markedly disrupted morphology and decreased the expression of the selected biomarker genes in at least one or two of the three differentiated cells, confirming the teratogenicity of these chemicals in ReproTracker.
Figure 3. Developmental toxicity of thalidomide and carbamazepine in ReproTracker.
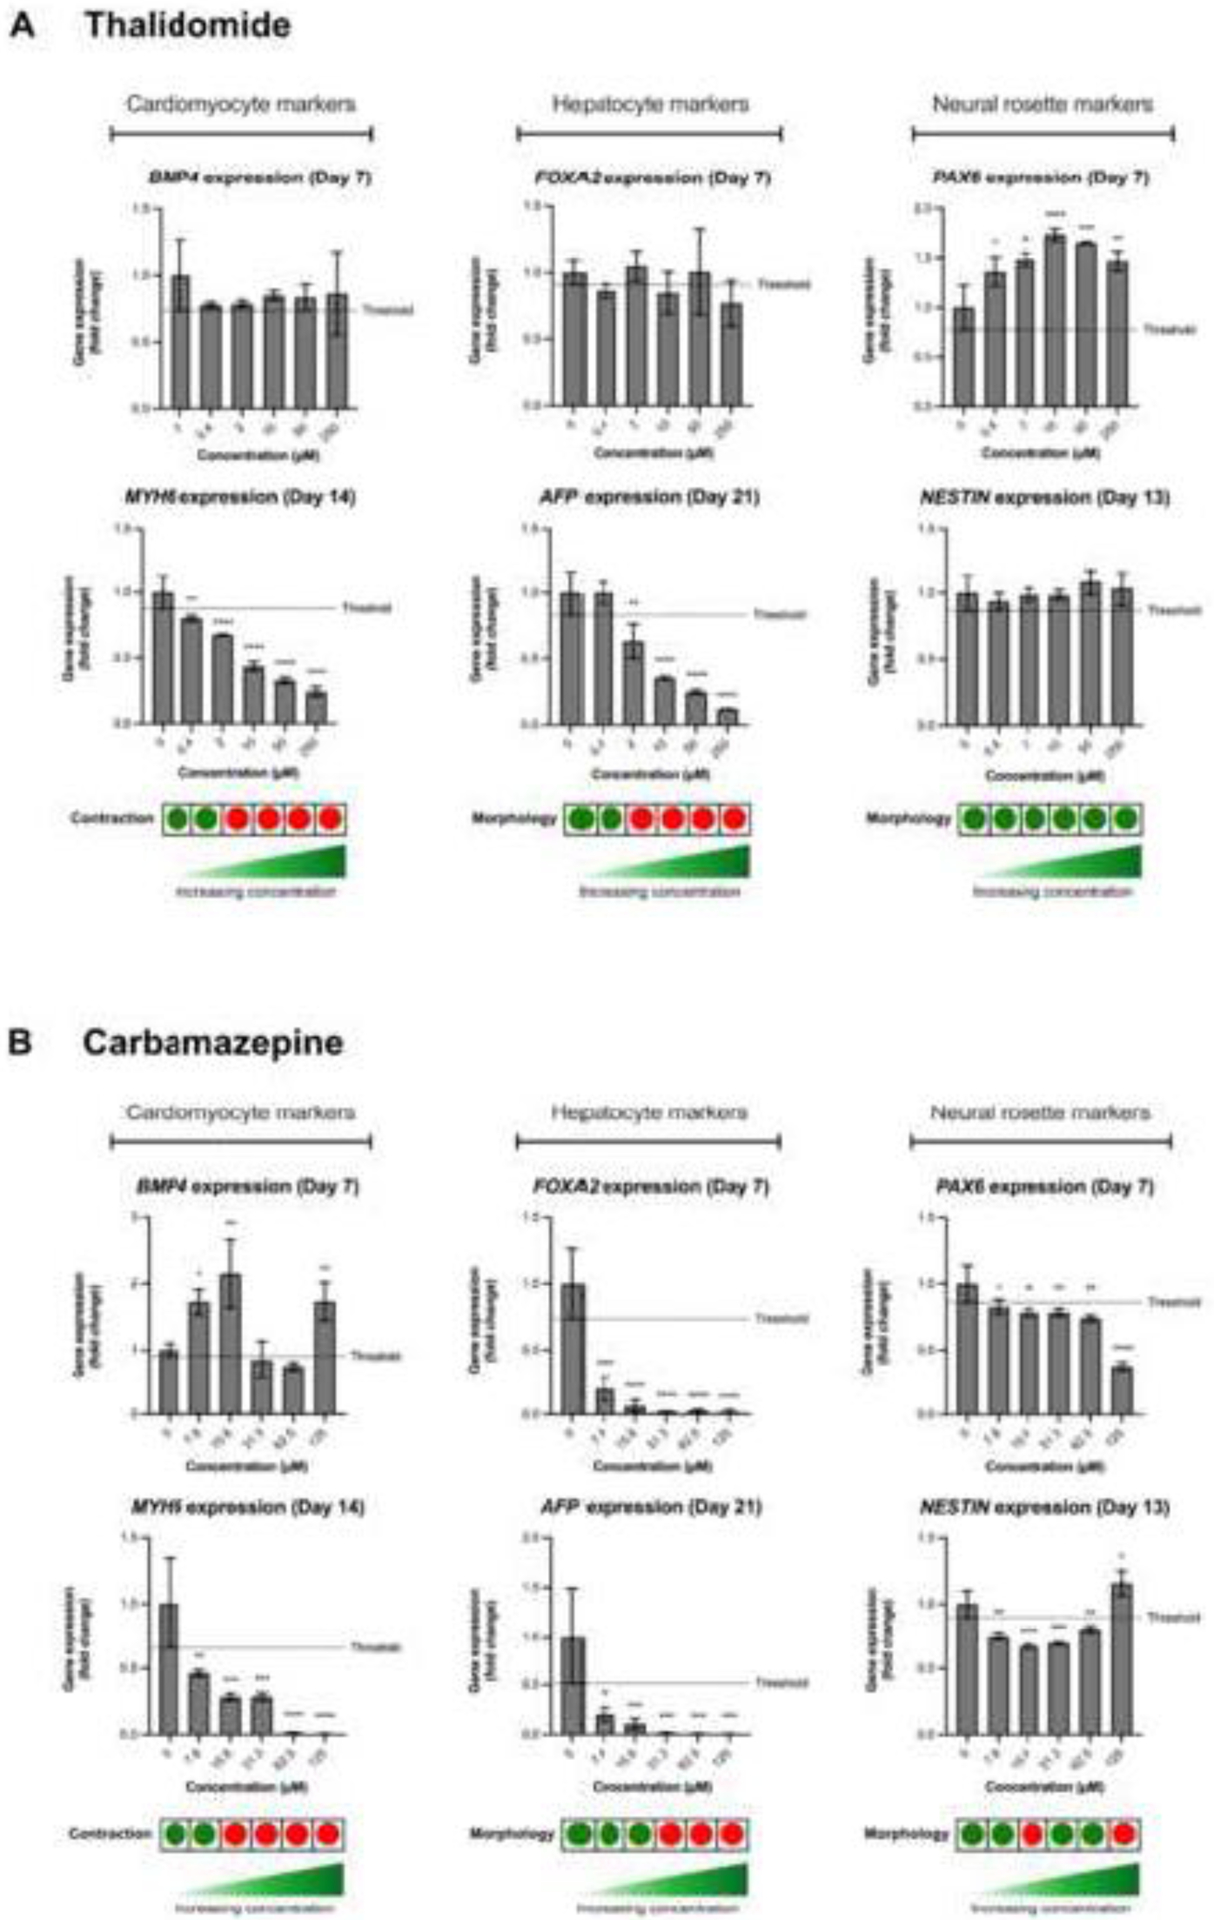
(A, B) Gene expression patterns of BMP4 (mesoderm marker), MYH6 (cardiomyocyte-specific marker), FOXA2 (endoderm marker), AFP (hepatocyte-specific marker), PAX6 (neural ectoderm marker), and NESTIN (neural rosette-specific marker) upon exposure to thalidomide and carbamazepine, respectively. Data are expressed as the mean ± SD of at least two biological replicates. Statistically significant compared to control condition (*p < 0.05, **p < 0.01, ***p < 0.001, ****p < 0.0001).
3.2. PBPK modeling
Degree of similarity of model simulations to experimental data can determine the level of confidence associated with a PBPK model. The performance of the model was evaluated using in vivo pharmacokinetic studies for all the test compounds in human. The visual fitting method was used to objectively determine the model’s goodness-of-fit (EPA 2006). In all the data sets used for model development, the mean values of the observed concentrations were reported instead of individual data points. Therefore, the accuracy of model predictions was graphically assessed by superimposing the predicted and observed mean plasma concentration-time profiles. Predictions of maximal concentration (Cmax) that were within a factor of two of the experimental data were considered adequate as proposed by the World Health Organization (WHO 2010). Monte Carlo (MC) analysis was also conducted to investigate the population variability. Only the sensitive parameters from the sensitivity analysis were varied. Partition coefficients, body weight, cardiac output, and metabolic constants were simulated as log normally distributed; and blood flows and tissue volumes were simulated as normally distributed. The coefficients of variation (CV) for partition coefficients were 30%, a CV of 22% was used for the body weight and a CV of 16 and 41% was used for the liver volume and the fat volume, respectively (Price et al. 2003), while a CV of 30% was assumed for the remaining model parameters. The distributions were truncated at 2 SDs (Clewell and Clewell 2008) to ensure physiological plausibility. Monte-Carlo simulations were performed with 1000 iterations to perform population-level simulations, at which convergence was achieved. Further increase in the number of iterations to 5000 and 10000 did not make a substantial difference. Mean blood concentration as well as the 5th and 95th percentiles are graphically represented in the results section.
Figures 4 and 5 as well as S2-1 to 3 in supplemental 2 show the results of the performance of the model when evaluated using the in vivo data from different articles from the literature (Fujita et al. 2008; Bai et al. 2013; Teo et al. 2004; Wada et al. 1978; Sumi et al. 1987; Bianchetti et al. 1987; Bernus et al. 1994; Gerardin et al. 1976). Model predicted mean plasma concentration time courses were in good agreement with observations across all the data sets, with predicted mean concentrations within a factor of two of the observed values. The results also show that the model consistently reproduces the general trend of the data rather than just portions of one or more data sets.
Figure 4.

Thalidomide plasma concentration in adult humans following oral dosing (200 mg) – simulations using the in vivo PK data from Bai et al. (2012) (A) and Teo et al. 2004) (B).
Figure 5.

Carbamazepine plasma concentration in adult humans following oral dosing (200 mg) Solution (A) or tablet (B) – simulations using the in vivo PK data from Sumi et al. (1987) and Bianchetti et al. (1987) (C).
Simulations were also run in an 8-week pregnant model and compared to the results from Battino et al. (1985) where plasma concentrations of carbamazepine were monitored in 9 pregnant epileptic patients treated with the drug alone at constant doses during pregnancy. This study showed that plasma concentrations were stable during pregnancy with plasma clearances significantly higher in weeks 4 to 24 than in weeks 25 to 32. Table 1 shows the results of the simulations of the PBPK model at 8 weeks pregnancy. The model simulations are close (i.e. within a factor of 2 on average) to the experimental data.
Next, sensitivity analysis was used to evaluate the impact of the model parameters on the concentration of each chemical in plasma. The larger the absolute value of the SC, the more important the parameter. A normalized SC of 1 represents that a 1% change in the parameter results in a 1% change in the internal dose metric of choice. A negative SC indicates the given parameter influences the dose metric in an inverse direction. Results of the sensitivity analysis can be found in Figure 6 and Table S2-1 in supplemental 2. For thalidomide, the most influential parameters to the plasma internal exposure after oral exposure were the absorption parameters (fraction absorbed and absorption rate), followed by the plasma clearance, the body weight, liver volume and hepatic intrinsic clearance. For carbamazepine, the most influential parameters to the plasma internal exposure after oral exposure were the fraction absorbed, the body weight, hepatic intrinsic clearance, liver volume, fat partition coefficient and fat volume which is consistent with the higher logKow of carbamazepine compared to thalidomide. No differences in sensitivity were noted between the low and high doses.
Figure 6.

Sensitivity analysis indices after oral exposure to thalidomide or carbamazepine. Plasma Cmax and plasma AUC were evaluated during the sensitivity analysis.
The uncertainty of a model reflects the level of confidence in model predictions. The uncertainty usually arises from limitations in available knowledge in some input parameters that affect the model predictions. The uncertainty was quantitatively defined based on the origin and confidence in each parameter that were sensitive in the model. MC simulations were run for each sensitive parameter and a ratio of 95th percentile over median was calculated. Uncertainty analysis results (Table S2–1) are summarized as high uncertainty (dose metric value could differ by over 200%), medium uncertainty (dose metric value could differ by over 30% but less than 200%) or low uncertainty (dose metric value could differ by less than 30%). Most of our model parameters are reported to have medium or low uncertainty. All parameters that are either directly measured or based on data from the literature (body weight, tissue volumes or blood flows) have low uncertainty. All parameters related to absorption and metabolism in the liver have medium uncertainty. The reliability of the model predictions is influenced by the level of uncertainty in the sensitive parameters of the model. Thus, if the highly sensitive parameters are also the ones that are highly uncertain, then the reliability of the model for risk assessment applications would be questionable. In the case of thalidomide and carbamazepine, the highly sensitive model parameters exhibit low uncertainty except for absorption rate and plasma clearance for thalidomide and hepatic clearance and body weight for carbamazepine, that exhibit medium uncertainty, contributing to a good level of confidence in the use of this model for predicting dose metrics.
Figure 7 (A–D) shows the Lowry plots of the eFAST quantitative analysis for the plasma concentration (CVPlas) and the uterus concentration (Cutugpl) at 1 and 5h for thalidomide. These time points were chosen to investigate parameter sensitivity and their influence on the model outputs during the absorption, distribution, and early elimination phases. The vertical bars depict the main and the total effects of each of the parameters, ranked in descending order of main effect. The ribbon on the top is a confidence band for the cumulative sum of model output variance. The contribution of different parameters to the variance of thalidomide plasma concentrations changes with time. The most notable being CLintb, the blood intrinsic clearance, which increases from less than 8.0% (Figure 7A) to 80% (Figure 7B). The parameters accounting for most of the variance are similar at both time points except that at 7h body weight (BW), rest of the body partition coefficient (Pbody), and absorption rate K1 are less sensitive. Concerning the contribution of different parameters to variance of thalidomide uterus concentrations, the most notable change is again CLintb, the blood intrinsic clearance, which increases from less than 5% (Figure 7C) to 44% (Figure 7D). The parameters accounting for most of the variance are similar at both time points except at 7h where the uterus partition coefficient (Put) replaces BW and the cardiac output as well as blood flow and volume of the uterus (QutC and Vutc) and other parameters are less sensitive.
Figure 7. Lowry plot of the quantitative global sensitivity analysis results of eFAST for thalidomide.

The total effect of a parameter comprised the main effect (green bar) and any interactions with other parameters (yellow bar) given as a proportion of variance. The ribbon, representing variance due to parameter interactions, is bounded by the cumulative sum of main effects and the minimum of the cumulative sum of the total effects for model predicted levels of plasma and uterus concentrations after bolus dose exposure.
Figure 8 (A–D) shows the Lowry plots of the eFAST quantitative analysis for the plasma concentration (CVPlas) and the uterus concentration (Cutugpl) at 1 and 24h for carbamazepine. These time points were chosen to investigate parameter sensitivity and their influence on the model outputs during the absorption, distribution, and early elimination phases. The vertical bars depict the main and the total effects of each of the parameters, ranked in descending order of main effect. The ribbon on the top is a confidence band for the cumulative sum of model output variance. The contribution of different parameters to the variance of carbamazepine plasma concentrations changes with time. The most notable being CLintc, the hepatic intrinsic clearance, which increases from less than 1.0% (Figure 8A) to 25% (Figure 8B). The parameters accounting for most of the variance are similar at both time points except that at 24h, absorption rates K1 and K2 and fat volume (Vfc) are not sensitive anymore. However, the liver volume (Vlc) that was not accounting for the variance at 1h is does at 24h. The most notable change is the uterus partition coefficient, which increases from less than 1% (Figure 8C) to 33% (Figure 8D). CLintc, the hepatic intrinsic clearance, also increases from less than 1.0% (Figure 8A) to 10% (Figure 8B). The parameter accounting for most of the variance, BW, is similar at both time points. Some of the parameters accounting for most of the variance at 1h are not sensitive anymore (uterus blood flow and volume, cardiac output, absorption rate K1 and K2, fat volume). However, the liver volume (Vlc) that was not accounting for the variance at 1h does at 24h.
Figure 8. Lowry plot of the quantitative global sensitivity analysis results of eFAST for carbamazepine.

The total effect of a parameter comprised the main effect (green bar) and any interactions with other parameters (yellow bar) given as a proportion of variance. The ribbon, representing variance due to parameter interactions, is bounded by the cumulative sum of main effects and the minimum of the cumulative sum of the total effects for model predicted levels of plasma and uterus concentrations after bolus dose exposure.
No changes in parameter interactions and ordering at various exposure concentrations were noted for both thalidomide and carbamazepine.
Table S4 in supplemental 1 provides a set of parameters for Thalidomide (top) and Carbamazepine (bottom) used in the GSA analysis.
3.3. In vitro to In vivo Extrapolation (IVIVE)
In vitro ReproTracker LOAELs were used to derive Human Equivalent Doses (HEDs) using the generic PBPK model developed for thalidomide and carbamazepine. Monte Carlo simulations were used to estimate median, 5th and 95th percentiles for the uterus and plasma concentrations for individuals exposed to the same, fixed dose (1 mg/day). Since the upper 95th percentile individuals have higher plasma or uterus concentrations for the same exposure, they are an example of a sensitive population. Then, reverse dosimetry predicted administered doses equivalent to in vitro active concentration from the ReproTracker assay (LOAEL concentration of 0.4 μM for thalidomide and 7.8 μM for carbamazepine from the ReproTracker are assumed to be uterine or plasma concentrations – both scenarios were simulated). Oral doses parameters for a tablet were used for simulation scenarios. Table 2 shows the results of IVIVE.
Table 2.
In vitro to in vivo extrapolation (IVIVE) and comparison with in vivo HED – median (5th percentile – 95th percentile)
| HED (mg/day) | Thalidomide | Carbamazepine1 | |
|---|---|---|---|
| Uterus 2 | From in vitro (Bolus dose) | 184.62 (126.36–271.44) | |
| From in vitro (Repeat exposure) | 30.00 (19.04–49.44) | 139.1 (91.88–210.52) | |
| Plasma 3 | From in vitro (Bolus dose) | 130.62 (88.36–191.58) | |
| From in vitro (Repeat exposure) | 10.06 (6.45–16.34) | 98.1 (64.94–149.4) | |
| Rat | From LOAEL4 | 27.63 | 221 |
| Rabbit | From LOAEL5 | 64.13 | 241 |
Total dose in mg/day (scenario of exposure is dose given twice daily so 92.31*2 and 69.55*2 for uterus for example)
Human equivalent doses are derived using the PBPK model and assuming the LOAEL concentration of 0.4 μM for thalidomide and 7.8 μM for carbamazepine from the ReproTracker are uterine concentrations.
Human equivalent doses are derived using the PBPK model and assuming the LOAEL concentration of 0.4 μM for thalidomide and 7.8 μM for carbamazepine from the ReproTracker are plasma concentrations.
Rat and rabbit LOAEL were then converted to human equivalent doses (HEDs) (Table 2) so they can be compared to the ReproTracker HEDs to derive a MOS. Table 3 shows the dose adjustment factor (DAF) which is based on body weight scaling according to the US-EPA (EPA 2013). An HED is the product of the dose administered to the animals in the animal study and the DAF. The HED that is selected as a point of departure (POD) for the study is then adjusted with uncertainty factors (UF). The interspecies extrapolation factor (UFA) is used to describe the uncertainty regarding using animal toxicity to describe human toxicity. The DAF used in the calculation addresses the toxicokinetic differences between species. However, some uncertainty in the extrapolation from animal to human remains. Since the magnitude of toxicity can also be influenced by species-specific toxicodynamic differences the toxicodynamic portion of the UFA (approximately 3) was retained. An uncertainty factor of 10 for intraspecies variability (UFH) was also applied. The UFH adjusts the PoD for the difference between the average human and the most sensitive applicable subpopulation. Therefore, the total UF in table 3 was set to 30. The HED in mg/kg was then calculated as LOAEL (mg/kg) × DAF / UF and then multiplied by the human body weight to have the HED in mg.
Table 3.
Animals PODs and their HED.
| Compounds | Species3 | LOAEL (mg/kg) | DAF | Unadjusted HED (mg) | UF | HED (mg) |
|---|---|---|---|---|---|---|
| Thalidomide1 | Rat | 50 | 0.247 | 828.9 | 30 | 27.63 |
| Rabbit | 60 | 0.478 | 1924 | 30 | 64.13 | |
| Carbamazepine2 | Rat | 400 | 0.247 | 6631 | 30 | 221 |
| Rabbit | 225 | 0.478 | 7215 | 30 | 241 |
Findings are abortions in rats and decreased number of fetuses, increased resorption in rabbits.
Findings are decreased implantation sites in rats and resorption in rabbits.
Rat, rabbit, and human body weight were 0.25, 3.5 and 67.1kg, respectively.
From another point of view, it is interesting to look if administered therapeutic doses result in uterine or plasma concentrations below the in vitro POD. The ability to rely on a measure of internal rather than external exposure reduces the uncertainty in the risk assessment by incorporating chemical-specific information on the uptake, distribution, metabolism and excretion of the chemical in both the experimental animal and the human (Clewell and Clewell 2008). For thalidomide, currently approved doses range from 100 to 400 mg/day. A dose of 50 mg was used for PK comparisons because that was the lowest dose used to treat insomnia when thalidomide was first developed. For carbamazepine, the therapeutic dose ranges from 100 to 800 mg twice daily. For our simulations, we used 100 mg twice daily. Table 4 shows the results of the simulations of plasma and uterus concentrations after exposure to the in vitro HED and the therapeutic dose. Results clearly show that administered therapeutic doses result in uterine or plasma concentrations over the estimated in vitro POD. The internal margin of exposure based on plasma concentration after exposure to the thalidomide and carbamazepine in vitro derived HED and therapeutic dose is 0.2 and 0.49, respectively. These results are in line with the fact that a single 50 mg tablet of thalidomide during the time-sensitive window is sufficient to cause birth defects in up to 50% of pregnant women (Vargesson 2015).
Table 4.
Steady state plasma and uterus maximal concentrations and AUC24 after repeated oral exposure to the in vitro HED and therapeutic doses.
| Compound | Dose (mg/day) | Maximal concentration (μg/L) | AUC24 (μg*h/L) | |||
|---|---|---|---|---|---|---|
| Plasma | Uterus | Plasma | Uterus | |||
| Thalidomide | In vitro HED | 30.00 | 346.59 | 112.37 | 2899 | 940 |
| In vitro HED | 10.06 | 116.22 | 37.68 | 972 | 315 | |
| Therapeutic dose | 50 | 577.64 | 187.29 | 4831 | 1566 | |
| Carbamazepine | In vitro HED | 139.11 | 2562 | 1754 | 55135 | 38727 |
| In vitro HED | 98.12 | 1807 | 1237 | 38884 | 27312 | |
| Therapeutic dose | 200 | 3684 | 2522 | 79274 | 55682 | |
69.55mg twice daily
49.05mg twice daily
The margin of safety calculated as the ratio of the toxic dose to 1% of the population (In vitro HED) to the dose that is 99% effective to the population (Therapeutic dose) was finally derived. The toxic dose to 1% of the population refers to the in vitro HED which is the most sensitive concentration obtained in vitro across the ReproTracker assays (10.06 and 98.1 mg/day for thalidomide and carbamazepine, respectively). The therapeutic dose was considered as the 99% effective dose to the population. The PBPK model was run at the in vitro HED and at the therapeutic dose for thalidomide and carbamazepine and the maximal concentration (Cmax) and the area under the curve (AUC) were recorded. The MOS was finally calculated. Results are presented in table 5.
Table 5.
Margin of safety (MOS).
| Compound | HED | Parameter | Mean | 1st percentile | 99th percentile | MOS |
|---|---|---|---|---|---|---|
| Thalidomide | In vitro HED1 10.06 mg/day | Cmax (μg/L) | 107.11 | 50.90 | 193.97 | 0.05 |
| AUC24 (μg*h/L) | 964 | 478 | 1725 | |||
| Therapeutic dose 50 mg/day | Cmax (μg/L) | 527.59 | 250.92 | 981.14 | ||
| AUC24 (μg*h/L) | 4767 | 2302 | 8934 | |||
| Carbamazepine | In vitro HED1 98.1 mg/day | Cmax (μg/L) | 1925 | 1070 | 3328 | 0.15 |
| AUC24 (μg*h/L) | 41817 | 22545 | 73209 | |||
| Therapeutic dose 200 mg/day | Cmax (μg/L) | 3889 | 2148 | 6859 | ||
| AUC24 (μg*h/L) | 84145 | 45964 | 150512 |
Human equivalent doses derived using the PBPK model and assuming the LOAEL concentration of 0.4 μM for thalidomide and 7.8 μM for carbamazepine from the ReproTracker are plasma concentrations.
4-. DISCUSSION
In vitro screening platforms are emerging rapidly to assess development toxicity responses of compounds. These emerging technologies show a promising ability to predict the outcomes of in-life animal studies and to provide an attractive means for identifying developmental toxicants. ReproTracker, is a unique in vitro human based reporter assay that can identify the teratogenicity potential of new pharmaceuticals and chemicals and signify the outcome of in vivo test systems. However, a major challenge of implementing in vitro models in a safety decision framework is understanding the quantitative aspects of compound dose-response at a specific target site during a specific “window of susceptibility” along the reproductive/developmental axis. The goal of this study was to evaluate whether the ReproTracker assay can predict the in vivo developmental toxicity exposure levels of two known human teratogens, thalidomide, and carbamazepine. These two drugs were chosen as they have a lot of pharmacokinetic data, in vivo toxicity data and in vitro results in the ReproTracker assay which were making them good candidates for this proof-of-concept. Here, we applied a PBPK model to describe the biokinetic behavior of these compounds and conducted IVIVE.
For both FDA and the European Medicines Agency (EMA) the aim of DART studies is to reveal any effects of pharmaceuticals on mammalian reproduction that are relevant for human risk assessment. For drugs, developmental effects are typically evaluated in two species (i.e., rodent and non-rodent (typically rabbit)). These new guidelines were created to avoid the risk of species differences in drug reaction/response. In the case of thalidomide, animal studies failed to detect the human teratogenic potential. This demonstrated for the first time that species differences exist in drug reaction/response. Indeed, mice were used to screen for thalidomide toxicity, but they are less sensitive to thalidomide than other species like non-human primates, rabbits, etc. (Merker et al. 1988; Stephens and Fillmore 2000; Vargesson 2015). Although classical toxicology screening programs involving animal testing have been the norm for years, in vitro and in silico methods continue to gain prominence within the toxicological and pharmaceutical community. Traditional risk assessment methods include determining a POD from animal toxicity studies and calculating a human reference dose using uncertainty factors to account for data limitations and variability. This approach does not consider pharmacokinetic (PK) processes which can influence the dose-response in humans. Allometric scaling was used in our case-study to calculate the human equivalent dose based on rat and rabbit in vivo studies. A better approach would have been to use a rat and rabbit PBPK model. Although PBPK models may improve the predictions, for this exercise, a simpler option was chosen to provide proof of concept. The interspecies extrapolation factor (UFA) was used to describe the uncertainty regarding using animal toxicity in rats and rabbits to describe human toxicity. The DAF used in the calculation addresses the toxicokinetic differences between species. Application of the default DAFs is not generally described as accounting for the toxicodynamic portion of response. Since the magnitude of toxicity can also be influenced by species-specific toxicodynamic differences the toxicodynamic portion of the UFA (approximately 3) was retained (EPA 2013). An uncertainty factor of 10 for intraspecies variability (UFH) to account for differences between the average human and the most sensitive population was also applied. Therefore, the total uncertainty factor applied to the rat and rabbit NOAELs was set to 30.
Alternative strategies are needed to address potentially sensitive populations like pregnant women. The in vivo PODs used in this case studies for thalidomide were derived in different species than mice and clearly show the teratogenic effect of thalidomide in rats and rabbits. Furthermore, the ReproTracker assay coupled with PBPK modeling shows that it is as sensitive than in vivo animal experiments. For carbamazepine, the HED derived from the ReproTracker assay using PBPK modeling is in the same range as the in vivo HED derived from rats and rabbits NOAELs after application of uncertainty factors. Someone could debate about the importance of “window of susceptibility” in DART and about the application of an uncertainty factor for study duration in the IVIVE approach. The in vitro system cannot be implemented in a testing situation with long duration like a few weeks/months. This is a dilemma for in vitro to in vivo extrapolation. The margin of safety (MOS) calculated for both thalidomide and carbamazepine show that developmental effects will occur at doses lower than the therapeutic dose. The traditional margin of safety is the ratio between the amount of drug that is toxic and the amount that is needed to reach the desired effect. However, the ability to rely on a measure of internal rather than external exposure reduces the uncertainty in the risk assessment by incorporating chemical-specific information on the kinetics of the chemical in both the experimental animal and humans (Clewell and Clewell 2008). The PBPK model developed in this case study allowed for the calculation of a ‘margin of internal exposure’ and ‘margin of safety’ to be defined based upon multiples of internal systemic dose relative to that at the human equivalent dose. The internal margins of exposure based on table 3 are in the same order of magnitude as the margin of safety. This explain why both drugs are not prescribed to pregnant women.
The complexity of IVIVE PK models might vary. Simple one-compartment models rely on the assumptions of linear dose-response and steady-state kinetics and can be quickly parameterized using in vitro data of clearance and plasma protein binding (Wetmore et al. 2012; Wetmore 2015). Pregnancy-specific PBPK models that simulate in-utero exposure are favored for developmental effects, however this adds complexity due to the development of and interactions between maternal and fetal tissues. Our PBPK model captures compound distribution in the pregnant woman without consideration of the fetus. It is appropriate as in vitro endpoints from the ReproTracker recapitulate the cellular events during gastrulation and organogenesis process when the chemical concentration in plasma or in the uterus is the relevant dose metric. It is well known that during gastrulation and organogenesis, the placenta is not yet formed, which is the reason why, to do IVIVE, the model was run for the first 5 weeks of pregnancy knowing that organogenesis occurs from weeks three through week eight of pregnancy (Burton and Jauniaux 2018). Gestation is a major cause of physiological change. Whereas many physiological parameters can be treated as constants in typical PBPK modeling, this is inappropriate for some exposure scenarios in a pregnancy model due to the rapid changes in both maternal and fetal anatomy. Any other endpoint targeting a different window of susceptibility would need a different PBPK model that allows for transport modeling between mother and fetus. Accuracy in physiological parameters is essential in developing IVIVE approaches with PBPK modeling. However, some key PK parameters like absorption and clearances are also extremely important. In the case of thalidomide and carbamazepine, in vivo and in vitro clearance data were available. Simulations of carbamazepine plasma time course using the apparent oral clearance of 25±2.1 L/h from Rawlins et al. (1975) were in good agreement with the in vivo pharmacokinetic studies used to calibrate the model. Carbamazepine also induces its own metabolism. This leads to enhanced clearance, reduced half-life, and a reduction in serum levels of carbamazepine. This was addressed in the model by increasing the clearance as suggested by in vivo studies (Rawling et al. 1975; FDA (1968)). Thalidomide undergoes primarily non-enzymatic hydrolysis in plasma. Simulations using the in vivo clearance of 10.5 L/h from Lepper et al. (2006) or the in vitro clearance predicted in Sipes et al. (2017) were not replicating the in vivo pharmacokinetic data used to calibrate the model. Therefore, the clearance value for thalidomide was fitted to the in vivo pharmacokinetic data during the calibration phase.
The global sensitivity analysis quantified 15 parameters with main and total effects higher than 1%. For both uterus and plasma concentrations, the highest-ranking parameters identified by GSA include absorption rate, uterus volume and blood flow as well as fat volume and rest of the body partition coefficient at 1h and plasma and hepatic clearance as well as uterus partition coefficient and liver volume at 5 or 24h. The main effects of these parameters (absorption rates, partition into tissues, clearances, and volumes) and their pair-wise interactions are characteristic of the kinetic processes of distribution and elimination. In addition to these parameters, body weight, to which several model parameters are scaled, was not surprisingly identified as a crucial physiological parameter contributing to model output variance.
With the new paradigm and the shift to animal free testing, the generic PBPK model developed in this case study could be used for other chemicals using Quantitative Structure-Activity Relationship (QSAR) models for predicting ADME (absorption, distribution, metabolism, and excretion) properties when in vivo or in vitro data are not available. It is important to note that pregnancy alters the function of drug-metabolizing enzymes. Some enzymes like CYP3A4 are increased but others like CYP1A2 are decreased (Darakjian and Kaddoumi 2019; Isoherranen and Thummel 2013; Ke et al. 2012). This was not considered explicitly in our modeling approach and key drug specific model parameters used for adult males were used to run simulations and predict limited pharmacokinetic data in pregnant women.
In vitro pharmacokinetic consideration is also important. Differences in chemical behavior in multicomponent in vitro systems are important factors that influence responses to these chemicals. It has been shown that the response can differ because of compound binding to plastics, serum proteins, agarose support, evaporation etc. (Kramer et al. 2012). The free concentration of a chemical drives both its kinetics and dynamics and quantitative in vitro to in vivo extrapolation (QIVIVE) depends on accurate estimate of free concentration in the in vitro system rather than the use of nominal (e.g., administered) concentration in the 3D microtissue. This aspect was not taken into consideration in this analysis. However, some published mass-balance models like Armitage, Wania, and Arnot (2014) could be used to calculate the free medium concentration and give more accurate results.
In this study, we showed that in vitro derived HEDs estimated with the applied PBPK model for carbamazepine and thalidomide achieved good agreement with in vivo data. As a matter of fact, for thalidomide, the range of HEDs (6–49 mg/day) derived from the in vitro ReproTracker concentration predicted to cause human developmental toxicity was close to the reported teratogenic clinical doses (50 mg/day) and the HED derived from the rat or rabbit developmental toxicity study (28–64 mg/day). A similar approach was applied by Chang et al. (2022) where they used in vitro developmental concentrations derived from devTOX quickPredict assay and applied various PK/PBPK models to estimate in vivo doses in rats and humans that would lead to potential developmental toxicity. They assessed how different modeling strategies (such as different PK model topologies and platforms) affected the results of IVIVE. Given the high agreement between the HEDs generated by the PK/PBPK models and the in vivo data, it is therefore possible to estimate in vivo developmental toxicity levels quantitatively using in vitro developmental assays and IVIVE.
5-. CONCLUSION
This pilot study demonstrated the importance of integrating PBPK model in assessing developmental toxicity in vitro and showed that the combination of these tools can be used to improve the safety assessment of drugs and chemicals without animal testing. Future work is demanded to assess whether our model and parameterization are appropriate and can be applied to a broader chemical universe. We will undertake a chemical space analysis on compounds with known DART effects to better understand the relationship between physical-chemical parameters for the wider library of pharmaceuticals and chemicals. Future work also involves the creation of a graphical user interface called DRIIVE (Developmental and Reproductive In vitro to In vivo Extrapolation). DRIIVE will be useful for the scientific community who lacks modeling expertise or programming backgrounds. With DRIIVE, toxicologists will be able to run simulations and do IVIVE based on reproductive in vitro assays.
Supplementary Material
FUNDING
This work was supported by the National Institutes of Environmental Health Sciences [grant number 1R43ES035657-01].
Declaration of interests
Marjory Moreau reports financial support was provided by National Institute of Environmental Health Sciences.
Footnotes
Publisher's Disclaimer: This is a PDF file of an unedited manuscript that has been accepted for publication. As a service to our customers we are providing this early version of the manuscript. The manuscript will undergo copyediting, typesetting, and review of the resulting proof before it is published in its final form. Please note that during the production process errors may be discovered which could affect the content, and all legal disclaimers that apply to the journal pertain.
DECLARATION OF CONFLICTING INTERESTS
The authors declared no potential conflicts of interest with respect to the research authorship, and/or publication of this article. Amer Jamalpoor, Sabine Hartvelt, and Giel Hendriks are employed by Toxys, a Dutch company that offers ReproTracker® as a commercial service. Both Marjory Moreau and Amer Jamalpoor contributed equally to this study and have the right to list their name first in their CV.
REFERENCES
- Abduljalil K, Furness P, Johnson TN, Rostami-Hodjegan A, and Soltani H. 2012. ‘Anatomical, physiological and metabolic changes with gestational age during normal pregnancy: a database for parameters required in physiologically based pharmacokinetic modelling’, Clin Pharmacokinet, 51: 365–96. [DOI] [PubMed] [Google Scholar]
- Armitage JM, Wania F, and Arnot JA. 2014. ‘Application of mass balance models and the chemical activity concept to facilitate the use of in vitro toxicity data for risk assessment’, Environ Sci Technol, 48: 9770–9. [DOI] [PubMed] [Google Scholar]
- Bai N, Cui XY, Wang J, Sun CG, Mei HK, Liang BB, Cai Y, Song XJ, Gu JK, and Wang R. 2013. ‘Determination of thalidomide concentration in human plasma by liquid chromatography-tandem mass spectrometry’, Exp Ther Med, 5: 626–30. [DOI] [PMC free article] [PubMed] [Google Scholar]
- Battino D, Binelli S, Bossi L, Canger R, Croci D, Cusi C, De Giambattista M, and Avanzini G. 1985. ‘Plasma concentrations of carbamazepine and carbamazepine 10,11-epoxide during pregnancy and after delivery’, Clin Pharmacokinet, 10: 279–84. [DOI] [PubMed] [Google Scholar]
- Bell SM, Chang X, Wambaugh JF, Allen DG, Bartels M, Brouwer KLR, Casey WM, Choksi N, Ferguson SS, Fraczkiewicz G, Jarabek AM, Ke A, Lumen A, Lynn SG, Paini A, Price PS, Ring C, Simon TW, Sipes NS, Sprankle CS, Strickland J, Troutman J, Wetmore BA, and Kleinstreuer NC. 2018. ‘In vitro to in vivo extrapolation for high throughput prioritization and decision making’, Toxicol In Vitro, 47: 213–27. [DOI] [PMC free article] [PubMed] [Google Scholar]
- Bernus I, Dickinson RG, Hooper WD, and Eadie MJ. 1994. ‘Early stage autoinduction of carbamazepine metabolism in humans’, Eur J Clin Pharmacol, 47: 355–60. [DOI] [PubMed] [Google Scholar]
- Bianchetti G, Padovani P, Thenot JP, Thiercelin JF, and Morselli PL. 1987. ‘Pharmacokinetic interactions of progabide with other antiepileptic drugs’, Epilepsia, 28: 68–73. [DOI] [PubMed] [Google Scholar]
- Burton GJ, and Jauniaux E. 2018. ‘Development of the Human Placenta and Fetal Heart: Synergic or Independent?’, Front Physiol, 9: 373. [DOI] [PMC free article] [PubMed] [Google Scholar]
- Chang X, Palmer J, Lumen A, Lee UJ, Ceger P, Mansouri K, Sprankle C, Donley E, Bell S, Knudsen TB, Wambaugh J, Cook B, Allen D, and Kleinstreuer N. 2022. ‘Quantitative in vitro to in vivo extrapolation for developmental toxicity potency of valproic acid analogues’, Birth Defects Res, 114: 1037–55. [DOI] [PMC free article] [PubMed] [Google Scholar]
- Christian MS, Laskin OL, Sharper V, Hoberman A, Stirling DI, and Latriano L. 2007. ‘Evaluation of the developmental toxicity of lenalidomide in rabbits’, Birth Defects Res B Dev Reprod Toxicol, 80: 188–207. [DOI] [PubMed] [Google Scholar]
- Clewell RA, and Clewell HJ 3rd. 2008. ‘Development and specification of physiologically based pharmacokinetic models for use in risk assessment’, Regul Toxicol Pharmacol, 50: 129–43. [DOI] [PubMed] [Google Scholar]
- Darakjian LI, and Kaddoumi A. 2019. ‘Physiologically Based Pharmacokinetic/Pharmacodynamic Model for Caffeine Disposition in Pregnancy’, Mol Pharm, 16: 1340–49. [DOI] [PubMed] [Google Scholar]
- Daston G, and Knudsen TB. 2010. ‘Fundamental Concepts, Current Regulatory Design and Interpretation’, Comprehensive Toxicology: 3–9. [Google Scholar]
- EMA. 2020. “ICH S5 (R3) guideline on reproductive toxicology: Detection of Toxicity to Reproduction for Human Pharmaceuticals.” In, edited by European Medicines Agency - Committee for Medicinal Products for Human Use. [Google Scholar]
- EPA. 2006. “Approaches for the application of physiologically based pharmacokinetic (pbpk) models and supporting data in risk assessment.” In, edited by Office of Research and Development National Center for Environmental Assessment, U.S. Environmental Protection Agency. Washington, D.C. [Google Scholar]
- ———. 2013. “Recommended Use of Body Weight3/4 as the Default Method in Derivation of the Oral Reference Dose.” In, edited by Office of the Science Advisor. Washington, DC. [Google Scholar]
- FDA. 1967. ‘Pharmtox review of Tegretol NDA 016608 Part 02’.
- Fujita Y, Yamamoto K, Aomori T, Murakami H, and Horiuchi R. 2008. ‘[Comparison of dissolution profile and plasma concentration-time profile of the thalidomide formulations made by Japanese, Mexican and British companies]’, Yakugaku Zasshi, 128: 1449–57. [DOI] [PubMed] [Google Scholar]
- Gerardin AP, Abadie FV, Campestrini JA, and Theobald W. 1976. ‘Pharmacokinetics of Carbamazepine in Normal Humans After Single and Repeated Oral Doses’, Journal of Pharmacokinetics and Biopharmaceutics, 4: 521–35. [DOI] [PubMed] [Google Scholar]
- Isoherranen N, and Thummel KE. 2013. ‘Drug metabolism and transport during pregnancy: how does drug disposition change during pregnancy and what are the mechanisms that cause such changes?’, Drug Metab Dispos, 41: 256–62. [DOI] [PMC free article] [PubMed] [Google Scholar]
- Jamalpoor A, Hartvelt S, Dimopoulou M, Zwetsloot T, Brandsma I, Racz PI, Osterlund T, and Hendriks G. 2022. ‘A novel human stem cell-based biomarker assay for in vitro assessment of developmental toxicity’, Birth Defects Res, 114: 1210–28. [DOI] [PubMed] [Google Scholar]
- Kapraun DF, Wambaugh JF, Setzer RW, and Judson RS. 2019. ‘Empirical models for anatomical and physiological changes in a human mother and fetus during pregnancy and gestation’, PLoS One, 14: e0215906. [DOI] [PMC free article] [PubMed] [Google Scholar]
- Ke AB, Nallani SC, Zhao P, Rostami-Hodjegan A, and Unadkat JD. 2012. ‘A PBPK Model to Predict Disposition of CYP3A-Metabolized Drugs in Pregnant Women: Verification and Discerning the Site of CYP3A Induction’, CPT Pharmacometrics Syst Pharmacol, 1: e3. [DOI] [PMC free article] [PubMed] [Google Scholar]
- Kramer NI, Krismartina M, Rico-Rico A, Blaauboer BJ, and Hermens JL. 2012. ‘Quantifying processes determining the free concentration of phenanthrene in Basal cytotoxicity assays’, Chem Res Toxicol, 25: 436–45. [DOI] [PubMed] [Google Scholar]
- Lepper ER, Smith NF, Cox MC, Scripture CD, and Figg WD. 2006. ‘Thalidomide metabolism and hydrolysis: mechanisms and implications’, Curr Drug Metab, 7: 677–85. [DOI] [PubMed] [Google Scholar]
- McNally K, Cotton R, and Loizou GD. 2011. ‘A Workflow for Global Sensitivity Analysis of PBPK Models’, Front Pharmacol, 2: 31. [DOI] [PMC free article] [PubMed] [Google Scholar]
- Merker HJ, Heger W, Sames K, Sturje H, and Neubert D. 1988. ‘Embryotoxic effects of thalidomide-derivatives in the non-human primate Callithrix jacchus. I. Effects of 3-(1,3-dihydro-1-oxo-2H-isoindol-2-yl)-2,6-dioxopiperidine (EM12) on skeletal development’, Arch Toxicol, 61: 165–79. [DOI] [PubMed] [Google Scholar]
- Newman LM, Johnson EM, and Staples RE. 1993. ‘Assessment of the effectiveness of animal developmental toxicity testing for human safety’, Reprod Toxicol, 7: 359–90. [DOI] [PubMed] [Google Scholar]
- Pearce RG, Setzer RW, Strope CL, Wambaugh JF, and Sipes NS. 2017. ‘httk: R Package for High-Throughput Toxicokinetics’, J Stat Softw, 79: 1–26. [DOI] [PMC free article] [PubMed] [Google Scholar]
- Price PS, Conolly RB, Chaisson CF, Gross EA, Young JS, Mathis ET, and Tedder DR. 2003. ‘Modeling interindividual variation in physiological factors used in PBPK models of humans’, Crit Rev Toxicol, 33: 469–503. [PubMed] [Google Scholar]
- Rawlins MD, Collste P, Bertilsson L, and Palmer L. 1975. ‘Distribution and elimination kinetics of carbamazepine in man’, Eur J Clin Pharmacol, 8: 91–6. [DOI] [PubMed] [Google Scholar]
- Rodgers T, Leahy D, and Rowland M. 2005. ‘Physiologically based pharmacokinetic modeling 1: predicting the tissue distribution of moderate-to-strong bases’, J Pharm Sci, 94: 1259–76. [DOI] [PubMed] [Google Scholar]
- Schardein JL, and Macina OT. 2007. Human developmental toxicants: aspects of toxicology and chemistry (CRC Press: Boca Raton: ). [Google Scholar]
- Stephens TD, and Fillmore BJ. 2000. ‘Hypothesis: thalidomide embryopathy-proposed mechanism of action’, Teratology, 61: 189–95. [DOI] [PubMed] [Google Scholar]
- Sumi M, Watari N, Umezawa O, and Kaneniwa N. 1987. ‘Pharmacokinetic study of carbamazepine and its epoxide metabolite in humans’, J Pharmacobiodyn, 10: 652–61. [DOI] [PubMed] [Google Scholar]
- Teeguarden JG, Deisinger PJ, Poet TS, English JC, Faber WD, Barton HA, Corley RA, and Clewell HJ 3rd. 2005. ‘Derivation of a human equivalent concentration for n-butanol using a physiologically based pharmacokinetic model for n-butyl acetate and metabolites n-butanol and n-butyric acid’, Toxicol Sci, 85: 429–46. [DOI] [PubMed] [Google Scholar]
- Teo SK, Colburn WA, Tracewell WG, Kook KA, Stirling DI, Jaworsky MS, Scheffler MA, Thomas SD, and Laskin OL. 2004. ‘Clinical pharmacokinetics of thalidomide’, Clin Pharmacokinet, 43: 311–27. [DOI] [PubMed] [Google Scholar]
- Vargesson N 2015. ‘Thalidomide-induced teratogenesis: history and mechanisms’, Birth Defects Res C Embryo Today, 105: 140–56. [DOI] [PMC free article] [PubMed] [Google Scholar]
- Wada JA, Troupin AS, Friel P, Remick R, Leal K, and Pearmain J. 1978. ‘Pharmacokinetic comparison of tablet and suspension dosage forms of carbamazepine’, Epilepsia, 19: 251–5. [DOI] [PubMed] [Google Scholar]
- Wetmore BA 2015. ‘Quantitative in vitro-to-in vivo extrapolation in a high-throughput environment’, Toxicology, 332: 94–101. [DOI] [PubMed] [Google Scholar]
- Wetmore BA, Wambaugh JF, Ferguson SS, Sochaski MA, Rotroff DM, Freeman K, Clewell HJ 3rd, Dix DJ, Andersen ME, Houck KA, Allen B, Judson RS, Singh R, Kavlock RJ, Richard AM, and Thomas RS. 2012. ‘Integration of dosimetry, exposure, and high-throughput screening data in chemical toxicity assessment’, Toxicol Sci, 125: 157–74. [DOI] [PubMed] [Google Scholar]
- WHO. 2010. “Characterization and application of physiologically based pharmacokinetic models in risk assessment.” In, edited by World Health Organization IPoCS. Geneva, Switzerland. [Google Scholar]
Associated Data
This section collects any data citations, data availability statements, or supplementary materials included in this article.