

Abstract
In the central nervous system, microglia are responsible for removing infectious agents, damaged/dead cells, and amyloid plaques by phagocytosis. Other cell types, such as astrocytes, are also recently recognized to show phagocytotic activity under some conditions. Oligodendrocyte precursor cells (OPCs), which belong to the same glial cell family as microglia and astrocytes, may have similar functions. However, it remains largely unknown whether OPCs exhibit phagocytic activity against foreign materials like microglia. To answer this question, we examined the phagocytosis activity of OPCs using primary rat OPC cultures. Since innate phagocytosis activity could trigger cell death pathways, we also investigated whether participating in phagocytosis activity may lead to OPC cell death. Our data shows that cultured OPCs phagocytosed myelin-debris-rich lysates prepared from rat corpus callosum, without progressing to cell death. In contrast to OPCs, mature oligodendrocytes did not show phagocytotic activity against the bait. OPCs also exhibited phagocytosis towards lysates of rat brain cortex and cell membrane debris from cultured astrocytes, but the percentage of OPCs that phagocytosed beta-amyloid was much lower than the myelin debris. We then conducted RNA-seq experiments to examine the transcriptome profile of OPC cultures and found that myelination- and migration-associated genes were downregulated 24 hours after phagocytosis. On the other hand, there were a few upregulated genes in OPCs 24 hours after phagocytosis. These data confirm that OPCs play a role in debris removal and suggest that OPCs may remain in a quiescent state after phagocytosis.
Keywords: cell culture, oligodendrocyte precursor cells, phagocytosis, RNA-seq, transcriptome profile
Graphical Abstract
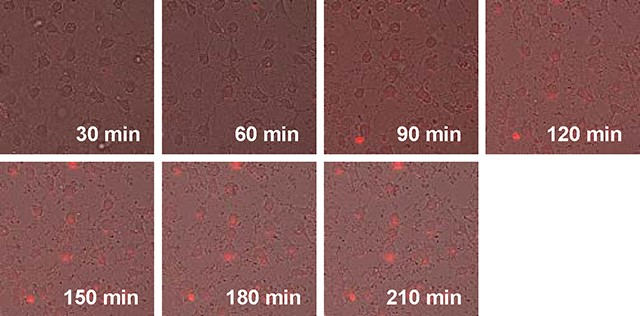
Time-lapse images of oligodendrocyte precursor cell cultures after treatment with pHrodo-labeled myelin debris
In the central nervous system, microglia are recognized as the primary phagocytes, responsible for clearing infectious agents, damaged cells, and amyloid plaques. Recently, astrocytes have also shown phagocytic activity under specific conditions. Whether oligodendrocyte precursor cells (OPCs), part of the same glial cell family as microglia and astrocytes, share this function remained uncertain. To address this, we investigated phagocytosis in primary rat OPC cultures. Our findings reveal that OPCs effectively phagocytose myelin debris without triggering cell death pathways. In contrast, mature oligodendrocytes did not exhibit phagocytic activity. OPCs also demonstrated phagocytosis of brain cortex lysates and astrocyte membrane debris, albeit with a lower efficiency for beta-amyloid. Transcriptome analysis showed downregulation of myelination- and migration-related genes 24 hours post-phagocytosis, suggesting OPCs play a role in debris removal and potentially enter a quiescent state afterward.
Introduction:
Phagocytosis is one of the fundamental cellular mechanisms to maintain cellular homeostasis. In multicellular organisms, the phagocytosis activity is observed not only in specialized types of cells (immune cells such as macrophages, neutrophils, monocytes, etc.) but also in non-specialized types of cells (non-immune cells such as epithelial cells, endothelial cells, fibroblasts, etc.) 1. In the phagocytosis process, cells first recognize large particles (larger than 0.5 μm), such as pathogens and cell debris, by receptor(s) expressed on the plasma membrane. Then, they engulf those foreign materials with the plasma membrane to form a phagosome. Finally, the phagosome fuses with the lysosome to digest the foreign material, maintaining homeostasis of the microenvironment 2–4. In the central nervous system (CNS), microglia are considered to be the specialized cell for phagocytosis. They constitute 10–20% of glial cells in the brain and spinal cord, and their role as immune cells of the CNS is well known 5–7. Under physiological conditions during development, the phagocytosis activity of microglia plays a crucial role by removing overproduced neurons and synapses to refine the neural networks for learning and memory 8–11. Apoptotic cells and cell debris, which are generated during CNS development and aging, are also phagocytosed by microglia to maintain homeostasis in the brain 12–14. Under pathological conditions, microglia phagocytose micro-organisms, damaged/dead cells, myelin debris, and amyloid plaques, which may be deleterious to brain function. In that situation (e.g. pathological conditions), microglia may exhibit two different phenotypes depending on the context; one is the so-called M1 state, in which microglia secret pro-inflammatory (harmful) soluble factors, and another is the so-called M2 state, in which microglia secret anti-inflammatory (beneficial) soluble factors to promote repair from diseases 7,15.
Although microglia are the primary cell type for removing foreign materials, including cell debris and pathogens, other glial cells may also participate in this process. For example, in both immature and adult mouse brains, astrocytes engulf and eliminate excitatory and inhibitory synapses through MEGF10 and MERTK pathways via the phagocytosis process 16. In cell culture, astrocytes were confirmed to phagocytose myelin debris 17. In addition, the same group reported that apolipoprotein E2 (APOE2), a protein that affects the genetic risk factor for Alzheimer’s disease (AD), enhanced the phagocytotic activity of astrocytes against synapses 18. The phagocytotic activity of astrocytes was also observed within the penumbra region in the later stage of stroke in mice, and the upregulation of the ABCA1 pathway and related molecules, MEGF10 and GULP1, regulated the phagocytosis process in astrocytes 19. In the peripheral nervous system (PNS), descriptive studies have postulated that Schwann cells, the principal glial cell in the PNS, were involved in myelin clearance through autophagy and/or phagocytosis mechanisms 20,21. Furthermore, recent studies reported that Schwann cells phagocytosed myelin debris by the Axl/Mertk phagocytic pathways and used autophagy to clear myelin debris 22–24. Interestingly, although oligodendrocytes in the CNS have equivalent functions to Schwann cells in the PNS, they do not contribute to removing myelin debris 22,25,26. Recently, it has been reported that oligodendrocyte lineage cells express immune-related genes in mouse models of multiple sclerosis, and that MHC-II-expressing oligodendrocyte precursor cells (OPCs) exhibit phagocytic activity in vitro 27. However, it remains largely unknown whether OPCs exhibit phagocytic activity similar to microglia. OPCs, also known as NG2 cells, are distributed in both gray and white matter in the brain 28–31. During development and/or after myelin/oligodendrocyte damage in adult brain, OPCs migrate towards the target regions and then proliferate and differentiate into oligodendrocytes, increasing the number of mature functional oligodendrocytes 32–35. It may be possible that OPCs could contribute to myelin clearance when needed, as the number of OPCs is increased after brain injury. Therefore, this study aims to determine if OPCs show phagocytosis activity against myelin debris and other foreign materials using primary OPC cultures and whether/how the OPC transcriptome profile changes after phagocytosis.
Materials and Methods:
Animals
All experimental procedures were followed by National Institutes of Health Guide for the Care and Use of Laboratory Animals and approved by the Massachusetts General Hospital Institutional Animal Care and Use Committee (IACUC#: 2011N000064, 2012N000165, 2022N000114). Mother rats were housed individually and had free access to food and water.
Primary culture of OPC, oligodendrocyte, and microglia
Primary OPC, oligodendrocyte and microglial cultures were prepared as described previously with some modifications 36,37. In brief, after decapitation with surgical scissors, cerebral cortices from 6 of 1- or 2-day-old Sprague Dawley rats (RRID:RRRC_00239, Charles River Laboratories, Wilmington, MA) were pooled (mixed both sexes), dissected, minced, and digested. A total of 60 neonatal rats were used in this study. Dissociated cells were plated in poly-D-lysine-coated (cat. no. P0899, Sigma, St. Louis, MO) 75 cm2 flasks (cat. no. 156472, Thermo Fisher Scientific, Waltham, MA) and maintained in Dulbecco’s Modified Eagle’s medium (DMEM, cat. no. 11995-073, Thermo Fisher Scientific, Waltham, MA) containing 20% heat-inactivated fetal bovine serum (FBS, cat. no. S11550H, ATLANTA Biologicals, Flowery Branch, GA) and 1% penicillin/streptomycin (PS, cat. no. 15140-163, Thermo Fisher Scientific, Waltham, MA). The medium was replaced every 3 days until the cells reached confluence. After approximately 10 days, the flasks were shaken for 1 hour on an orbital shaker (218 rpm) at 37°C, and the supernatant containing non-adherent cells was collected as the microglia fraction. The media containing microglia were then centrifuged at 1,000 rpm for 5 minutes, suspended in DMEM/F12 (cat. no. 11320-082, Thermo Fisher Scientific, Waltham, MA) containing 1% PS and 10% FBS, and cultured at 37°C for 1 day. Following this 1-day incubation, the rat primary microglia were used for the phagocytosis assay.
The remaining cells at the bottom of the flask after the 1-hour shaking were added to a new medium with DMEM containing 20% FBS and 1% PS and shaken on an orbital shaker (218 rpm) at 37°C overnight (<19 hours). The supernatant was collected and plated on non-coated tissue culture dishes for 1 hour at 37°C to remove contaminated astrocytes and microglia, as they can attach to the bottom of non-coated tissue culture dishes, whereas OPCs would not. The supernatant, which contained non-adherent cells (e.g., OPCs), was collected, centrifuged at 1,000 rpm at room temperature for 5 minutes, suspended in OPC proliferation media (Neurobasal medium, cat. no. 21103-049, Thermo Fisher Scientific, Waltham, MA, containing 2% B27 supplement, cat. no. 17504-044, Thermo Fisher Scientific, Waltham, MA), 1% P/S, 2 mM glutamine (cat. no. 25030-164, Thermo Fisher Scientific, Waltham, MA), 10 ng/mL PDGF-AA (cat. no. 100-13A, PEPROTECH, Rocky Hill, NJ), 10 ng/mL FGF-2 (cat. no. 100-18B, PEPROTECH, Rocky Hill, NJ)), and then seeded onto poly-DL-ornithine-coated plates (cat. no. P0421, Sigma, St. Louis, MO). After a couple of days, OPCs were ready for experiments in this study.
To obtain oligodendrocytes, OPCs were treated with oligodendrocyte differentiation media (DMEM containing 2% B27 supplement, 10 ng/mL CNTF (cat. no. 450-50, PEPROTECH, Rocky Hill, NJ), and 15 nM T3 (cat. no. T6397, Sigma, St. Louis, MO). OPC differentiation into oligodendrocytes was initiated 4 days after seeding the OPCs. At 5 days after the initiation of differentiation by switching the culture media, oligodendrocytes were used for the phagocytosis assay.
Preparations of bait materials and phagocytosis assay
Isolation of rat corpus callosum (white matter, WM) and cortex (gray matter, GM) was performed as follows. Female 5~6-month-old Sprague-Dawley rats (RRID:RRRC_00239, Charles River Laboratories, Wilmington, MA) housed in individual cages were deeply anesthetized with isoflurane (3~5% isoflurane) and then transcardially perfused with ice-cold PBS, followed by decapitation. A total 10 female rats were used for this study. The brains were then removed and cooled in ice-cold Hanks’ Balanced Salt Solution (HBSS, cat. no. 14025-134, Thermo Fisher Scientific, Waltham, MA) for 1 min. After removing the meninges and choroid plexus, the cerebrum was sliced into five to ten coronal sections using a brain matrix. Subsequently, the brain sections were trimmed, and the regions of WM and GM were isolated by direct visualization using a light microscope. The isolated samples of WM and GM were placed in tubes on ice. PBS was added to the samples, which were then ultrasonicated. Turbidity was measured at 600 nm (OD 600), and the samples were stored at −80°C until use. Cell debris from cultured glial cells (astrocytes) and Beta-amyloid (1–42) (Aβ, cat. no. AS-20276, Anaspec, Inc., Fremont, CA) were prepared as previously described 37. Briefly, cells remaining at the bottom of the flask after shaking were incubated with 0.25% trypsin-EDTA (cat. no. 25200-114, Thermo Fisher Scientific, Waltham, MA) at 37°C for 10 min, collected into a fresh tube, and then frozen using liquid nitrogen. A stock solution of Aβ was diluted with 1% NH4OH (cat. no. AS-61322, Anaspec, Inc., Fremont, CA) following the manufacturer’s protocol and stored at −80°C. To obtain fibril Aβ, the frozen Aβ was thawed and incubated at 37°C for 3 days before pHrodo-labeling. Staining with pHrodo was prepared as previously described with some modifications 37. Each frozen sample (WM, GM, cell debris, and Aβ) was thawed on ice, incubated with pHrodo Red succinimidyl (NHS) ester (10,000x, cat. no. P36600, Molecular Probes, Eugene, OR) at room temperature for 1 h in the dark, and then washed with PBS twice. The phagocytosis assay was performed as previously described with some modifications 37. Briefly, OPCs, oligodendrocytes, and microglia were treated with pHrodo-labeled baits suspended in the appropriate media (OPC-proliferation media for OPCs, differentiation media for oligodendrocytes, DMEM/F12 supplemented with 10% FBS for microglia) at 37°C for 24 h. Random photos were taken in the wells, and the total cell numbers and the cells that overlapped with the red color (e.g. the signal of pHrodo) were counted. The percentage of phagocytosing cells was determined in a blinded manner.
Cell viability and cell death assay
For OPC damage assessment during phagocytosis, the LDH assay was performed using the Cytotoxicity Detection Kit (cat. no. 4744926001, Roche), as previously described with some modifications 38. Briefly, supernatants were collected and mixed with LDH reagent. Cells were washed with ice-cold PBS twice and then incubated with 0.1% Triton X-100 (cat. no. T9284-500ML, Sigma-Aldrich, St. Louis, MO) in PBS. After centrifugation at 12,000 rpm for 5 min, the mixture was mixed with LDH reagent. After incubation at room temperature for 10 min, the mixture of LDH reagents and supernatants was measured using a plate reader (excitation: 490 nm, emission: 630 nm). In addition to the LDH assay, trypan blue staining was also performed after the phagocytosis assay. As a positive control for trypan blue staining, OPCs were treated with 10 μM H2O2 (cat. no. 216763-100ML, Sigma-Aldrich, St. Louis, MO) in OPC-proliferation media at 37°C for 24 h. Non-treated OPCs, WM debris-treated OPCs, and H2O2-treated OPCs were washed with pre-warmed PBS twice, treated with 0.5% trypan blue (cat. no. 15250-061, Thermo Fisher Scientific, Waltham, MA) in culture media, and then observed under the microscope within 10 min after trypan blue staining.
Microscope, time-laps observation
Brightfield images were captured using a microscope (Eclipse Ti-S, Nikon, Japan) with a 20x objective (CFI S Plan Fluor ELWD 20XC, NA 0.45, Nikon, Japan). Time-lapse images were obtained using a fluorescence microscope (BZ-X800, Keyence, Itasca, IL) equipped with a 20x objective (CFI Plan Fluor 20XC MI, NA 0.75, Nikon, Japan). The brightfield and fluorescence images were captured and stitched together using Analysis software (version 2.1, Keyence, Itasca, IL). All photos were taken at a rate of one shot per minute. Time-lapse observations were initiated 30 minutes after the treatment of WM debris. In the time-lapse experiment, we captured 180 photos per minute over a total duration of 180 minutes. These photos were then stitched together to create a high-speed motion video at a 60x speed. Therefore, the duration of the time-lapse video in the Supplementary time-lapse Video is three minutes, corresponding to the total imaging time of 180 minutes.
RNA sequencing (RNA-seq)
We conducted bulk mRNA-seq experiments to map the transcriptome profiles of OPCs. Three experimental groups were prepared; (i) control OPCs (no treatment), (ii) OPCs + phagocytosis (samples were prepared 24 hours after treating OPCs with white matter debris), and (iii) differentiating OPCs (samples were prepared 48 hours after switching the culture media to the “differentiation medium”). Four OPC dishes were prepared for each group (e.g. N=4/group). For RNA extraction, cells were washed with ice-cold PBS twice, resuspended with QIAzol (cat. no. 79306, Qiagen Sciences, MD), and then, RNA was extracted followed by manufacture’s protocol. The RIN of our RNA samples were all above 9.5. Library preparation and sequencing were performed by Azenta US, Inc. (South Plainfield, NJ). The library preparation was conducted based on the PolyA selection, and the sequencing was performed using Illumia HiSeq 2 × 150 bp sequencing. The raw data was obtained in FASTQ format, and STAR (ver 2.7.10a)/RSEM (ver 1.3.3) was used for mapping and quantifying the abundance of transcripts, expressed as transcript per kilobase million (TPM). The bioinformatics analysis was conducted using the R software. DESeq2 (ver 1.36.0) was used for differential expression analysis, and the level with adjusted p-value <0.1 and |log2fold change| > 0.58 was set to filter differential expression genes (DEGs). Metascape was used for the gene set enrichment analysis 39. Our sequence data, presented as FASTQ files, have been stored under accession number PRJNA 1014697. Please see Supplementary Table S1 for the sample and sequencing metadata.
Statistical Analysis
Statistical analyses were performed with Prism 9 (RRID:SCR_002798, GraphPad software, USA). Power estimates were calculated based on alpha=0.05 and beta=0.8 to obtain group sizes appropriate for detecting effect sizes in the range of 40–50% for cell cultures models. An assessment of the normality of data was performed by Shapiro-Wilk test. Statistical analysis was conducted by unpaired t test, one-way analysis of variance (ANOVA) followed by Tukey’s multiple comparison test, or two-way ANOVA followed by Sidak’s multiple comparison test. Differences with P < 0.05 were considered statistically significant. Data were expressed as mean ± SD. In this study, no exclusion criteria were pre-determined, and no test for outliers was conducted.
Results:
We first checked whether cultured OPCs would show phagocytosis activity. Primary OPC cultures were prepared from neonatal rat brains. Immunocytochemistry experiments confirmed that our primary cultured cells consisted of a pure population of OPCs (Supplementary Figure S1a). Furthermore, our cultured OPCs were also functional because they were successfully differentiated into mature oligodendrocytes when required (Supplementary Figure S1b). For phagocytosis assay, we started with using pHrodo-labeled rat corpus callosum homogenates (WM debris) as bait for OPCs. pHrodo-labeled materials fluoresce once they are moved into the phagolysosome structure in the cytosol during the phagocytosis process 40. Twenty-four hours after adding WM debris, most OPCs were positive with the red fluorescence signals (Figure 1a), and the treatment of WM debris did not induce cell death in cultured OPCs (Figure 1b and 1c). The time-lapse observation further confirmed the phagocytosis of pHrodo-labeled WM debris in our culture system (Figure 1d and Supplementary Video).
Figure 1. OPCs phagocytosis against myelin-rich cell debris.
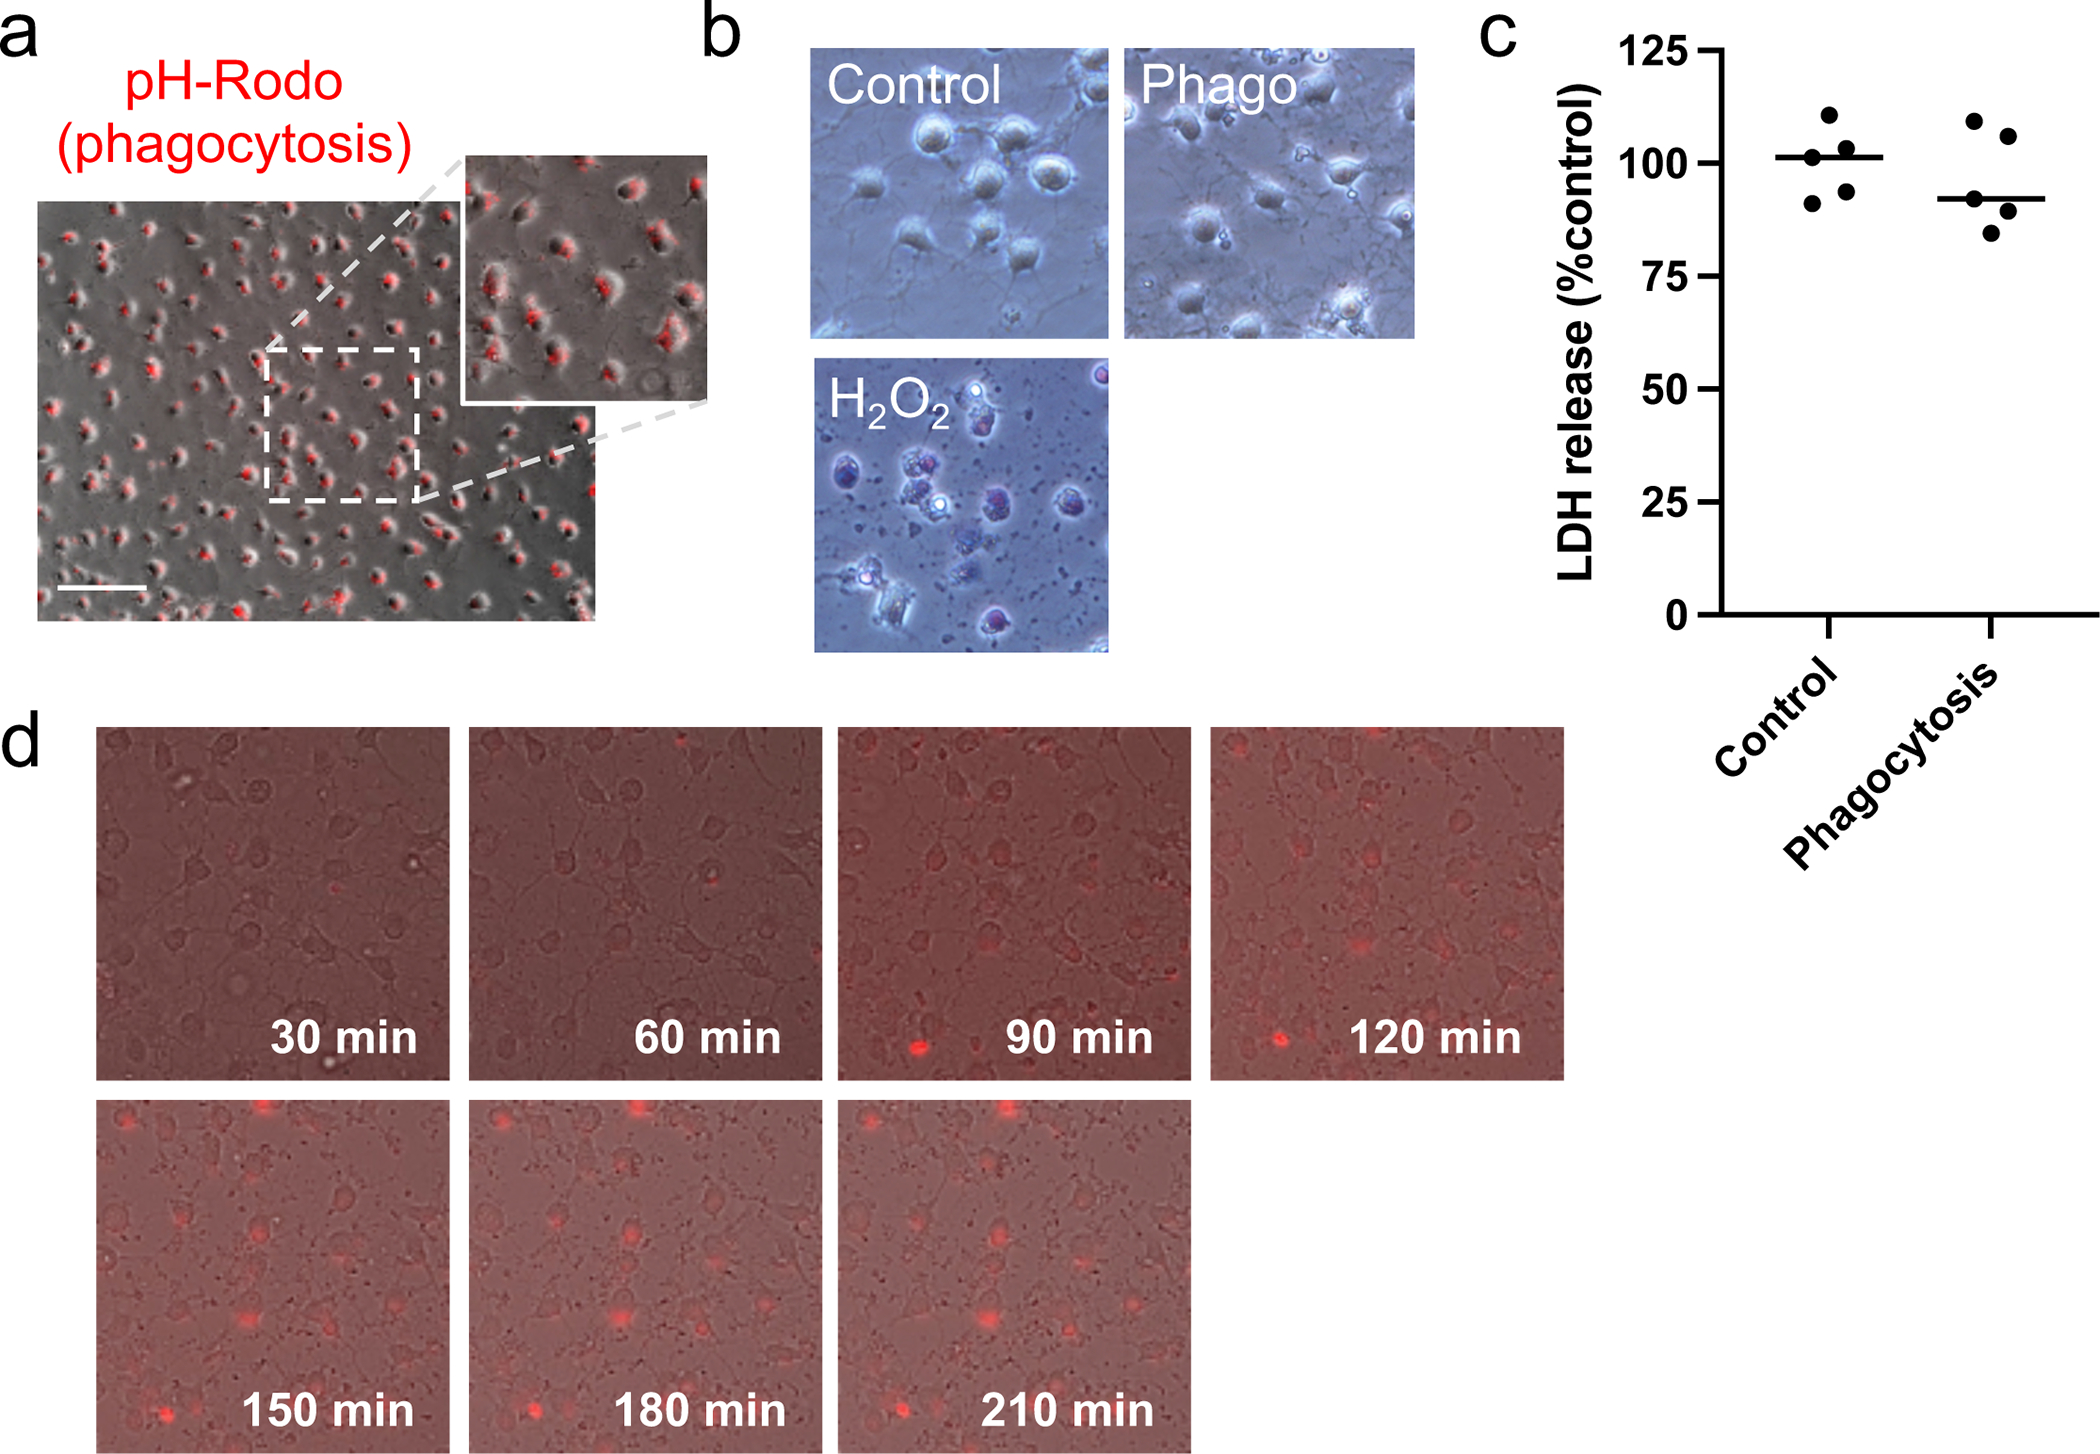
(a) Cultured rat OPCs (oligodendrocyte precursor cells) were prepared from neonatal rat brains. Myelin-rich debris (white matter debris) were prepared from rat corpus callosum, and the debris were labeled with pHrodo. pHrodo-labeled materials fluoresce once they are moved into the phagolysosome structure in the cytosol during the phagocytosis process, and twenty-four hours after treatment with pHrodo-labeled myelin-rich debris, most OPCs were positive with red fluorescence. (b) OPCs were healthy (no cell damage assessed by trypan blue staining) at twenty-four hours after treatment with myelin-rich debris. As a negative control, cells were treated with 10 μM H2O2, and as expected, OPCs were positive with trypan blue. Scale bar = 50 um. (c) Similarly, LDH assay confirmed that OPCs did not exhibit cell damage 24 hours after myelin-rich debris. Data are mean ± S.D. of n=5 (n = number of independent cell culture preparations). p=0.55; unpaired t test. (d) The time-lapse observation further confirmed OPC phagocytosis against pHrodo-labeled myelin-rich debris. Please see Supplementary file for the time lapse movie. Sample size recommended/used in experiments in Figure 1 = 4~5/5.
We next examined whether OPCs would phagocytose other types of baits. In addition to WM debris (prepared from rat corpus callosum), we prepared pHrodo-labeled gray matter (GM) debris (prepared from rat cortex homogenates), pHrodo-labeled cell debris (prepared from cell membranes from cultured rat astrocytes), and pHrodo-labeled amyloid beta. While microglia phagocytosed all these baits37, cultured OPCs phagocytosed WM debris, GM debris, and cell debris, but the percentage of OPCs that phagocytosed beta-amyloid was much lower than the other baits (Figure 2a), suggesting that phagocytotic activity of OPCs is more selective than that of microglia. We also checked if mature oligodendrocytes would show similar phagocytosis activity in vitro, but unlike OPCs, mature oligodendrocytes did not phagocytose pHrodo-labeled WM debris (Figure 2b). Then, we compared the temporal pattern of phagocytosis between OPCs and microglia. At 2 hours after the treatment of pHrodo-labeled WM debris, microglia showed a larger percentage of phagocytosing cells than OPCs (Figure 2c–d), suggesting that the debris will be removed more rapidly by microglia than by OPCs. At 24 hours, on the other hand, there was no significant difference in the percentage of phagocytosing cells between OPCs and microglia.
Figure 2. Phagocytosis activity in OPCs, oligodendrocytes, and microglia.
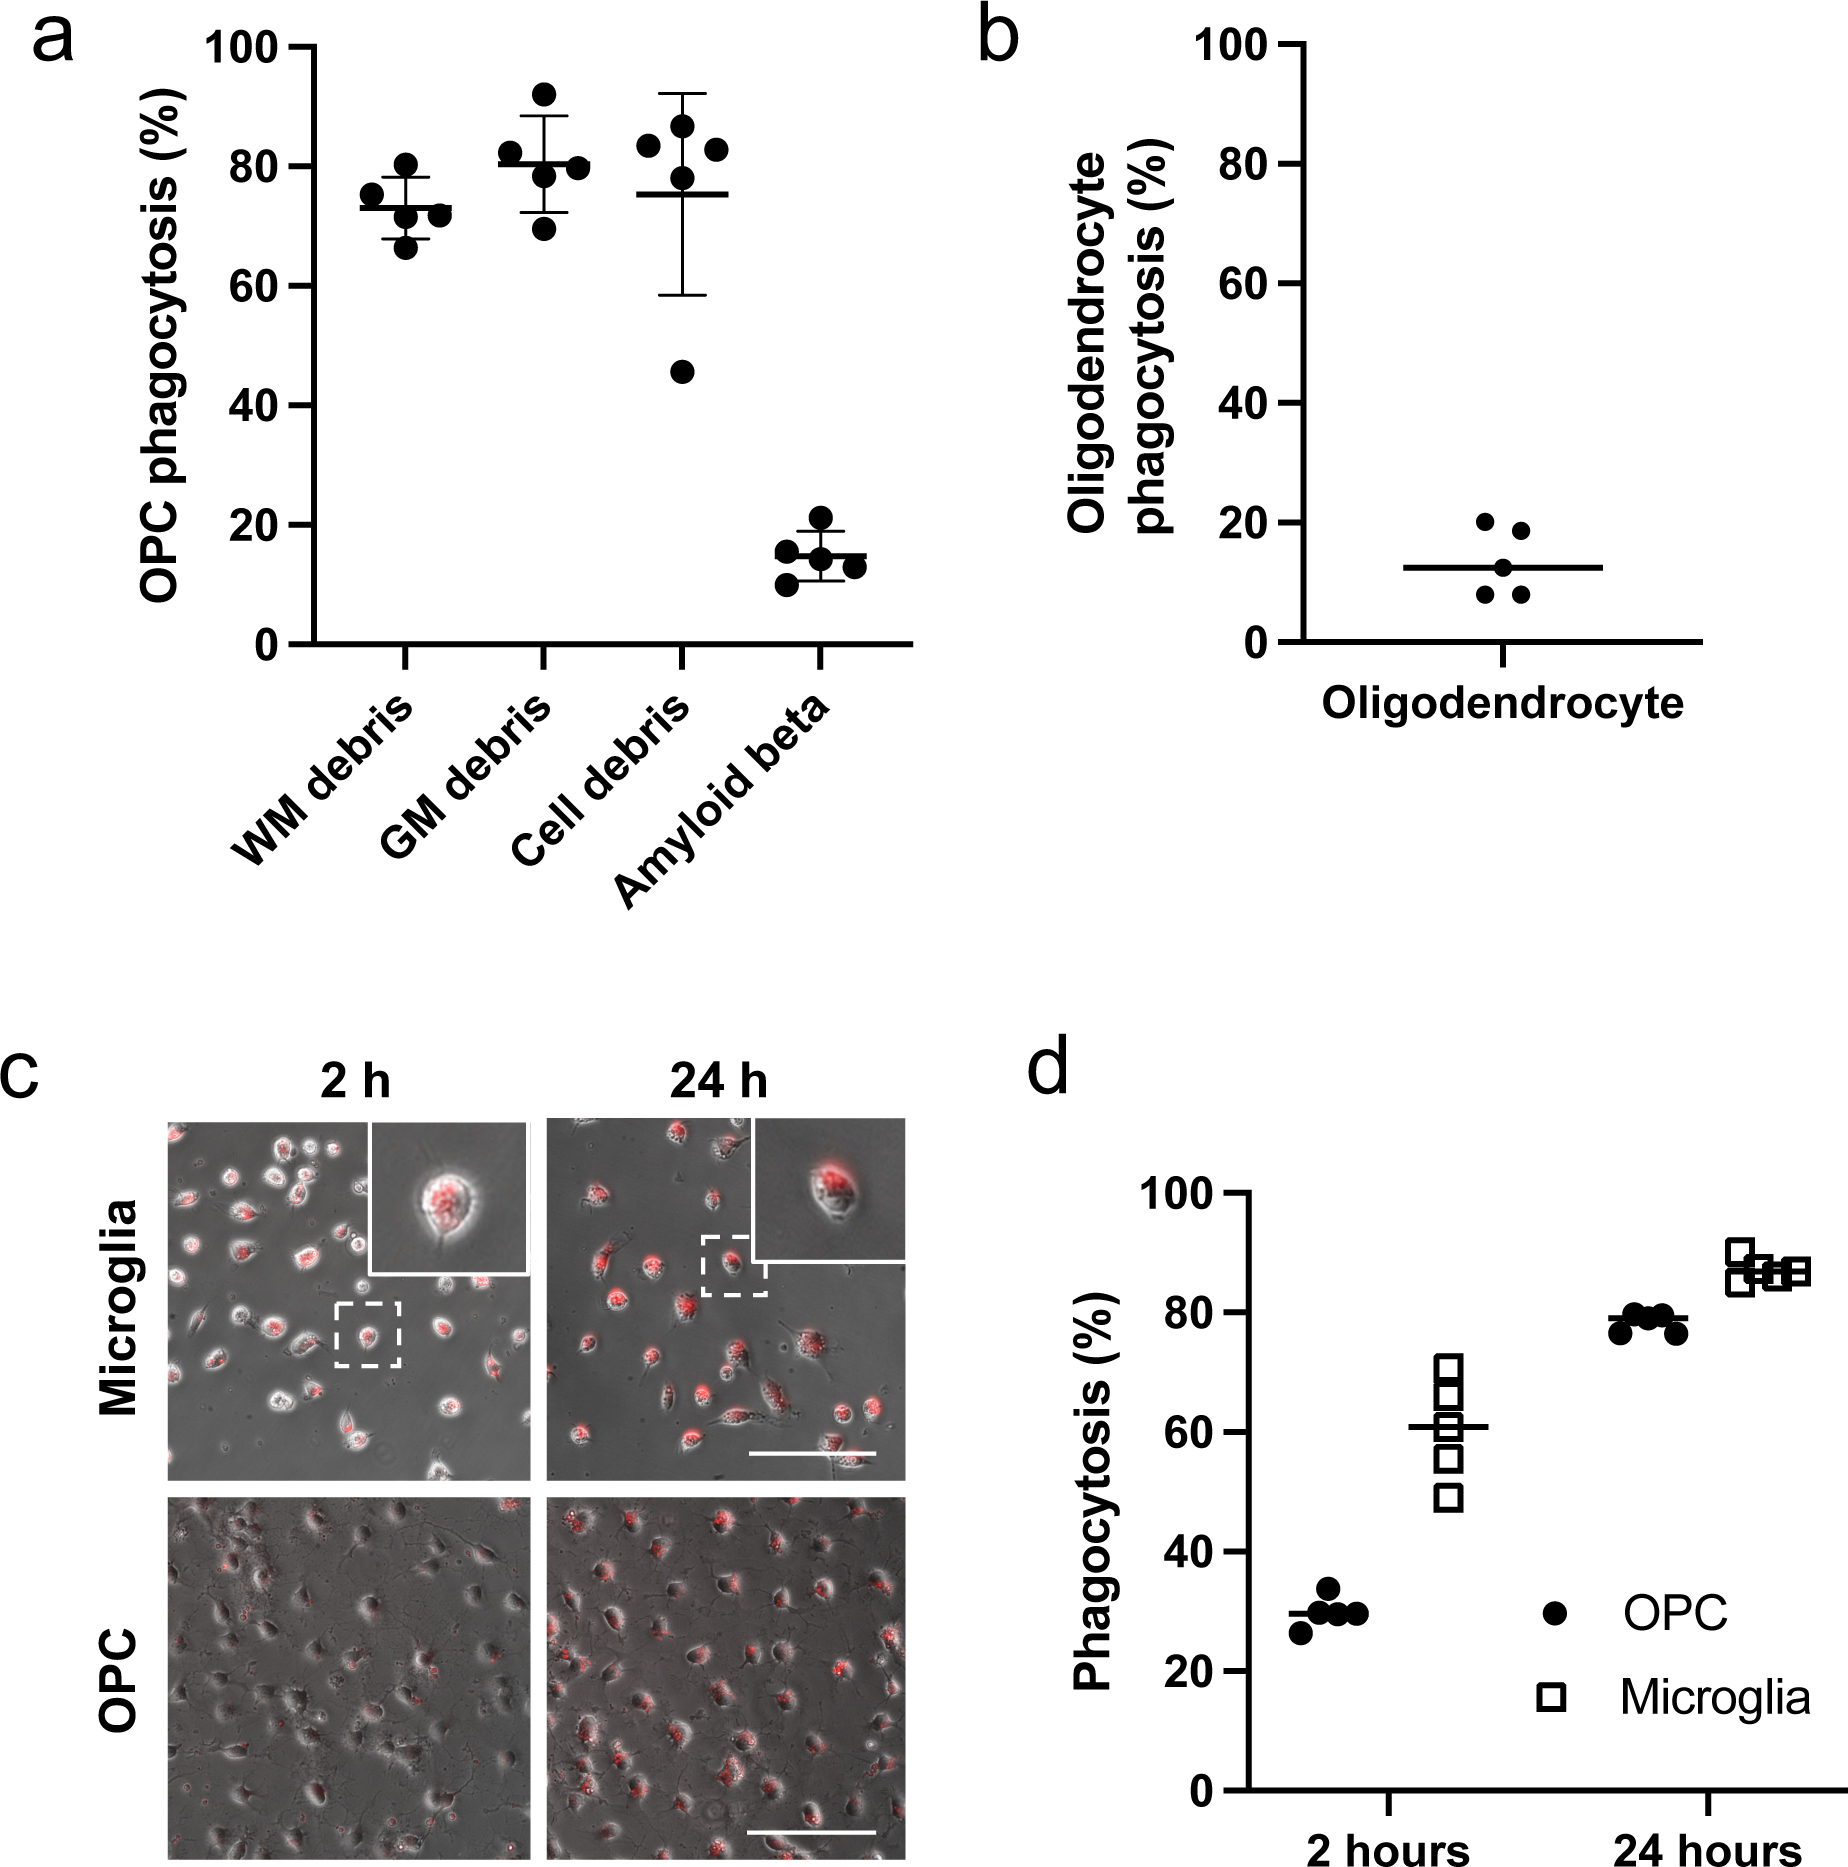
(a) Four different baits were prepared, and these materials were labeled with pHrodo before adding to the culture media of OPCs. Twenty-four hours after the treatment, the percentage of red-fluorescent-positive cells was counted. Data are mean ± S.D. of n=5 (n = number of independent cell culture preparations). WM: white matter, GM: gray matter. OPCs phagocytosed WM debris, GM debris, and cell debris, but not amyloid beta (One-way ANOVA: F(3,16)=48.4, p<0.0001; Tukey’s multiple comparison: p<0.0001 between amyloid beta and other baits). (b) Twenty-four hours after adding pHrodo-labeled WM debris to cultured oligodendrocytes, the percentage of red-fluorescent-positive cells was counted. Data are mean ± S.D. of n=5 (n = number of independent cell culture preparations). (c-d) Two or twenty-four hours after adding pH-Rodo-labeled WM debris to cultured microglia or OPCs, the percentage of red-fluorescent-positive cells was counted. The inserted images in the upper panels are representative images of amoeboid microglia. Scale bar = 50 μm for both images of microglia and OPC cultures. Data are mean ± S.D. of n=5 (n = number of independent cell culture preparations). Two-way ANOVA followed by Sidak’s multiple comparison test confirmed the significant difference between the percentage of cells that are phagocytotic in microglia and in OPCs at 2 hours after treatment (ANOVA: Cell types × Time interaction – F (1,16) = 27.5, p < 0.0001; Sidak’s multiple comparison: p<0.05 for all the comparisons). Sample size recommended/used in experiments in Figure 2 = 4~5/5.
We then conducted RNA-seq experiments to examine the changes in the OPC transcriptome profile after phagocytosis. In addition to control OPCs and phagocytosed OPCs, we also prepared a group of differentiating OPCs (48 hours after initiating cell differentiation) to ascertain that our OPC cultures were truly functional by demonstrating that they could differentiate into mature oligodendrocytes. As expected, compared to control OPCs, differentiating OPCs showed robust increases in myelin-related genes, such as Mbp (log2fold change: 4.37), Plp1 (log2fold change: 4.44), and Mag (log2fold change: 4.19), confirming that cultured OPCs successfully differentiated in our system. Among the three groups (control-OPC, phago-OPCs, and diff-OPCs), we compared their top 5% highest abundant genes and found that more than 95% of genes were identical between the control OPC and phago-OPC groups (Figure 3a). On the other hand, 304 genes out of 1470 genes (approx. 20%) were unique only in the diff-OPCs group. The numbers of marker genes for newly formed oligodendrocytes and markers for myelinating oligodendrocytes in the top 5% genes of differentiating OPCs were larger than the ones of the other two groups (Figure 3b). We next investigated the differences between control OPCs and phago-OPCs. The MA plot (Figure 3c; blue dots indicate genes of adjusted p value < 0.1) and the volcano plot (Figure 3d; red dots indicate genes of log2fold > |0.58| and adjusted p value < 0.1) showed that there were more downregulated genes than upregulated genes in the phago-OPC group. The top 10 upregulated or downregulated genes in the phago-OPCs group are presented in Tables 1 and 2. In the differentially expressed genes (DEGs) list, there were less than 20 genes for upregulation after phagocytosis, and most of them were transcription factor genes (Table 1). Then, we checked how many genes were related to the phagocytosis pathway by comparing our DEG list with the genes in the phagocytosis Gene Ontology (GO) Term (GO:0006909). There were ten genes in our DEG list, and all were downregulated in the phago-OPC group (Figure 3e).
Figure 3. Transcriptome changes after phagocytosis in OPCs.
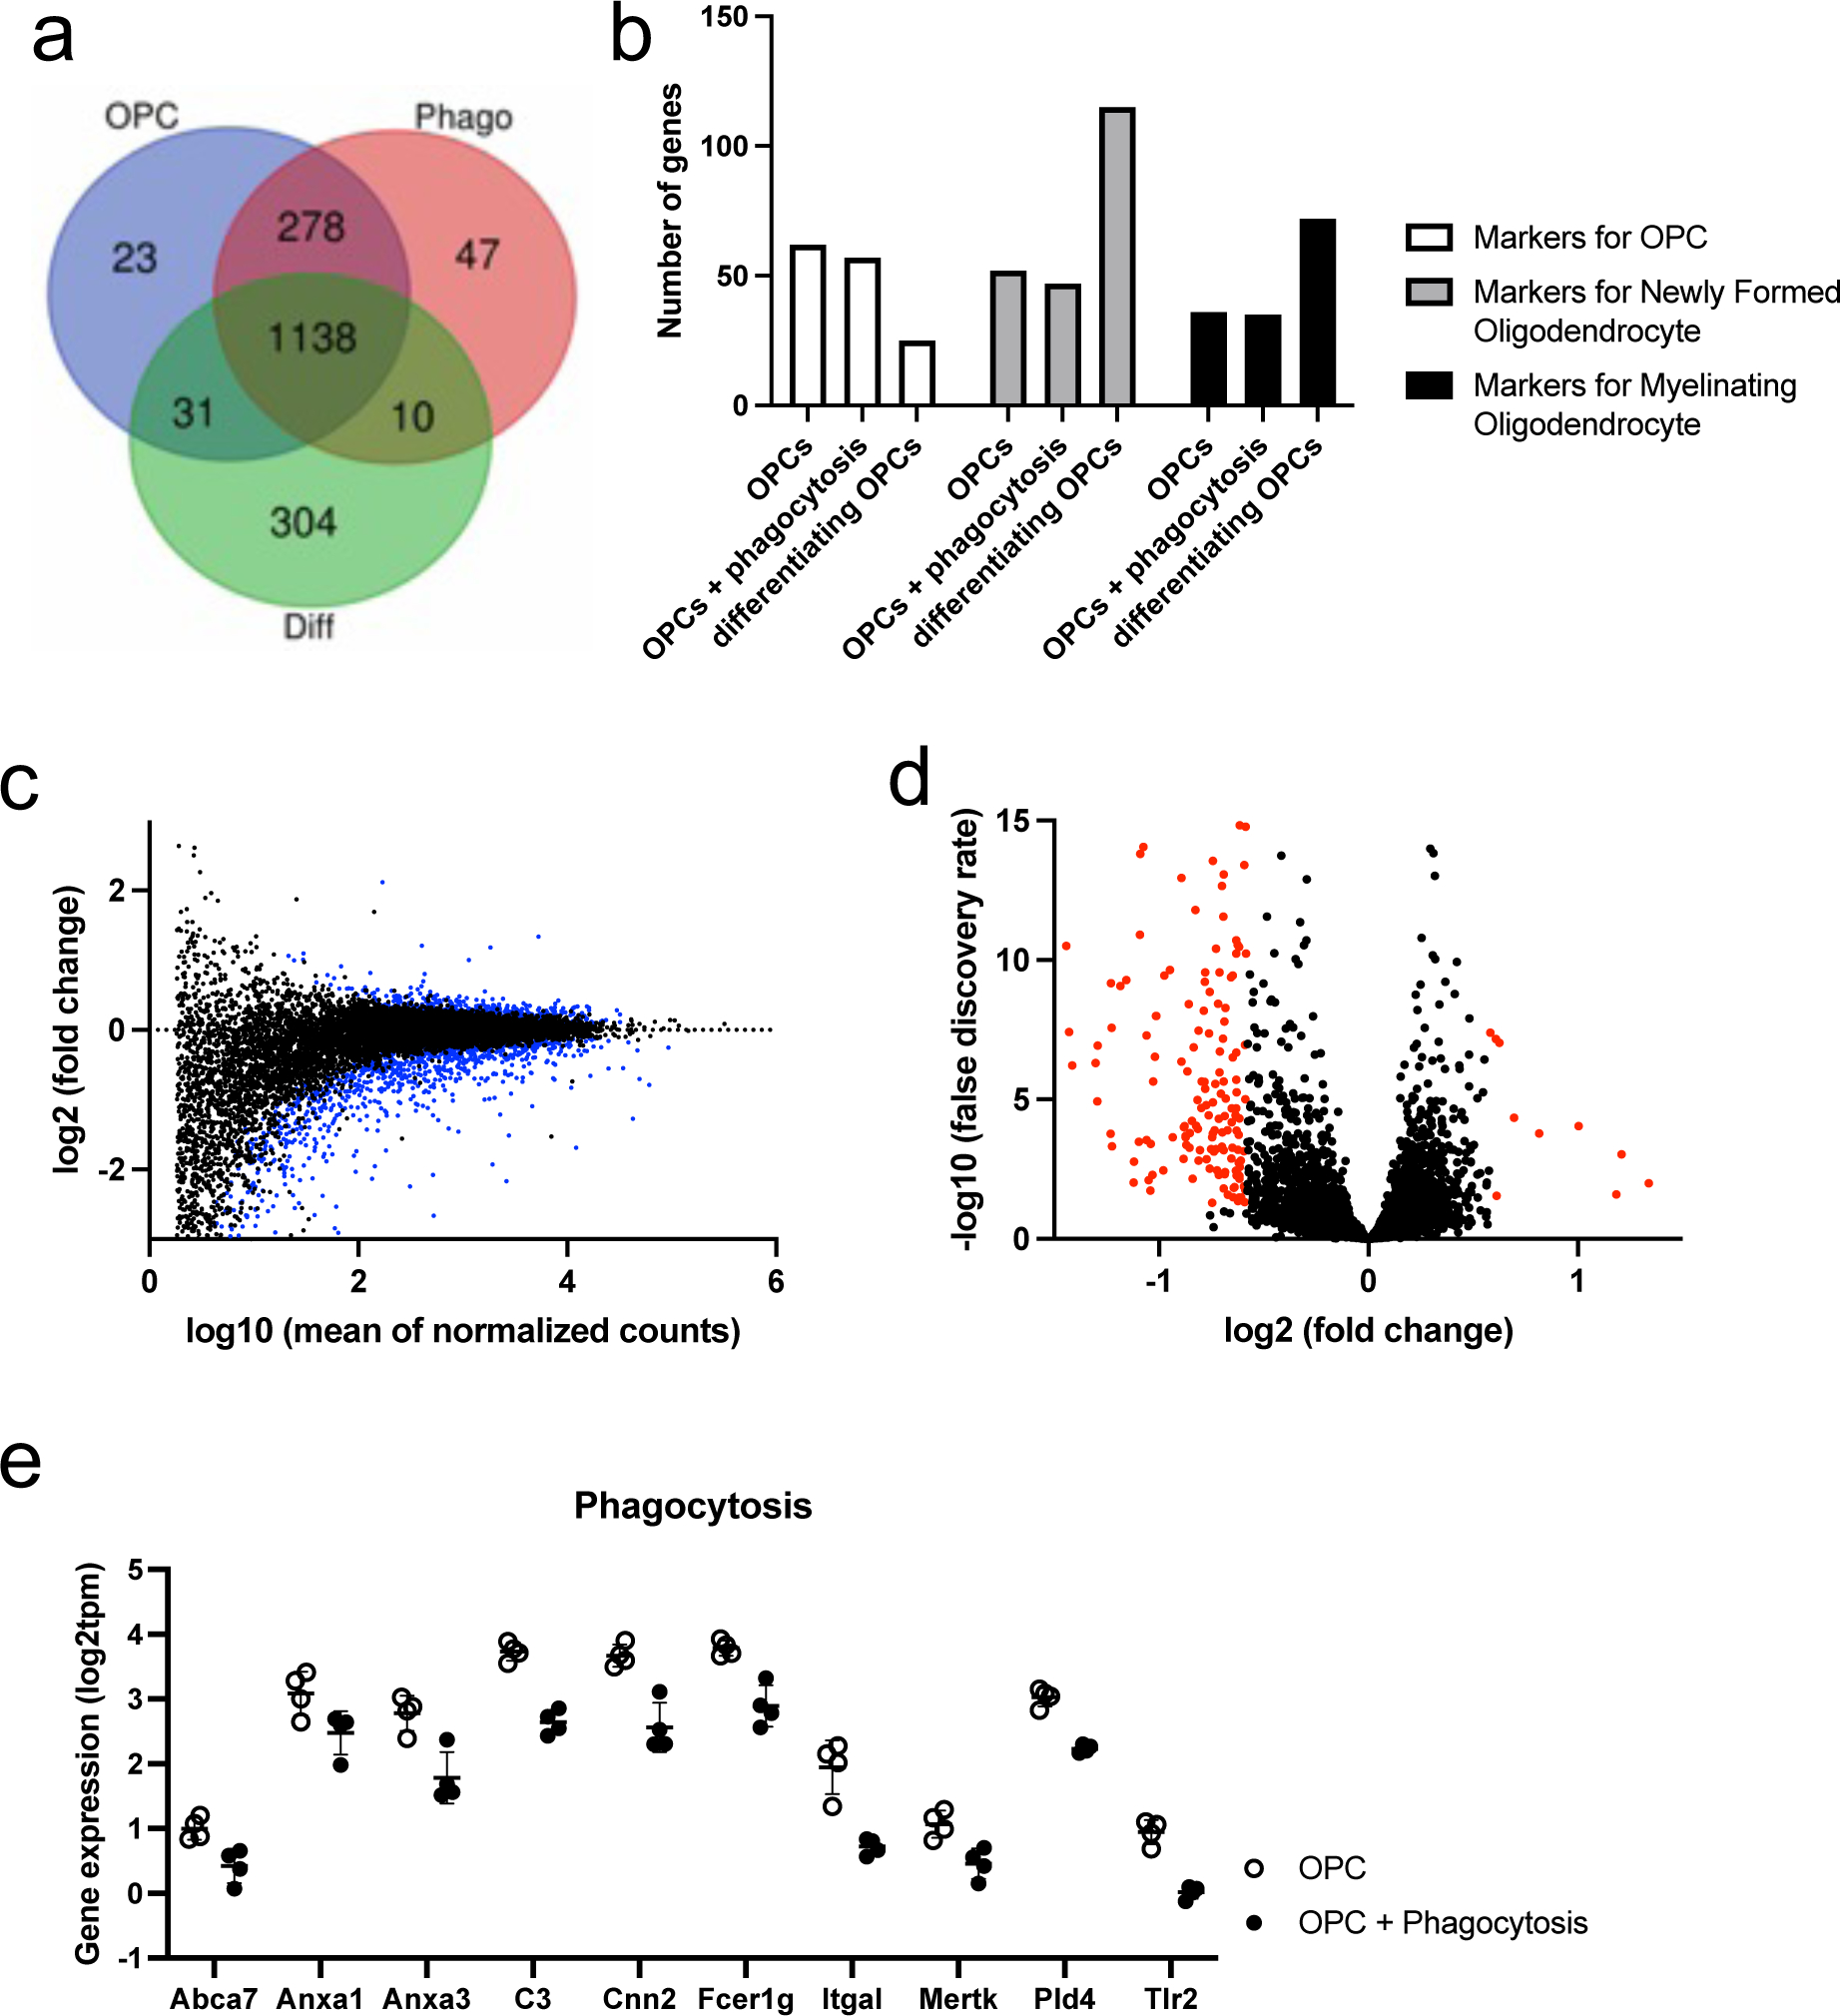
(a) We prepared three groups for RNA-seq experiments; (i) control OPCs, (ii) OPCs + phagocytosis (samples were prepared at 24 hours after treating cells with WM debris), and (iii) differentiating OPCs (samples were prepared at 48 hours after initiating a process of differentiation). Four samples were prepared for each group. The Venn diagram were drawn using top 5% genes in each group. OPCs: control OPCs, Phago: OPCs + phagocytosis, Diff: differentiating OPCs. (b) Based on the previous dataset of cell type marker genes 58, we counted the number of genes in the top 5% genes list. (c) The MA plot. The blue dots indicate the genes of adjusted p values were less than 0.1. (d) The volcano plot. The red dots indicate the genes of log2fold change was larger than 0.58 or less than −0.58 with adjusted p values less than 0.1. (e) We compared our differential expression genes (DEGs) list with the gene list of GO: 0006909 (Phagocytosis Gene Ontology Term). Ten genes that were included in GO: 0006909 were significantly downregulated after phagocytosis.
Table 1:
Top 10 upregulated genes by phagocytosis
| ext_gene | log2FoldChange | padj |
|---|---|---|
|
| ||
| Egr2 | 2.116783889 | 0.026106387 |
| Egr1 | 1.339130701 | 0.01010023 |
| Junb | 1.209930574 | 0.000935622 |
| Fos | 1.183344005 | 0.025515161 |
| Ier2 | 1.004335561 | 9.07E-05 |
| Lrfn2 | 0.816203822 | 0.000166076 |
| Brinp3 | 0.80127719 | 5.15E-18 |
| Sox9 | 0.695734315 | 4.49E-05 |
| Eln | 0.625494389 | 9.30E-08 |
| Bmp7 | 0.612421012 | 0.028444255 |
Table 2:
Top 10 downregulated genes by phagocytosis
| ext_gene | log2FoldChange | padj |
|---|---|---|
|
| ||
| RGD1565462 | −3.260771806 | 0.077808628 |
| Rn7sl1 | −2.664476965 | 0.064739989 |
| Metazoa_SRP | −2.664476965 | 0.064739989 |
| Scg2 | −2.244344478 | 8.27E-27 |
| H19 | −2.165769336 | 8.74E-07 |
| FAM187A | −2.134633498 | 0.007035938 |
| Dlk1 | −2.078729207 | 7.02E-52 |
| Cd93 | −1.953400066 | 2.14E-16 |
| Enpp6 | −1.925145397 | 1.25E-25 |
| Tmem125 | −1.728401462 | 0.000148879 |
Because there were over 150 downregulated genes in the phago-OPC group compared to the control OPC group, we also conducted the pathway analysis with Metascape to examine which pathways were suppressed after phagocytosis. Figure 4a summarizes the result of enriched pathways (parent GO term) from downregulated genes in the phago-OPC group, and among the developmental process (GO: 0032502), glial-differentiation-related pathways were highly enriched. Notably, myelin-related genes were downregulated after phagocytosis, including Plp1, Cldn11, Mag, Lgi4, Rarb, Gjc3, Sh3tc2, Mbp, Lpar1, Myrf, Mfasc, Prx, Pllp, Tppp, Plec (Figure 4b). Migration-related genes were also downregulated after phagocytosis (Figure 4c), a finding of particular relevance to OPCs, which need to migrate to the target region to enable myelination during development or re-myelination after white matter damage. Finally, we checked whether the pathways for the complement cascades, integrin pathways, and Notch signaling were changed by phagocytosis because these pathways are involved in phagocytosis and/or cell migration. The pathway analysis showed that these three pathways (complement activation, integrin-mediated signaling pathway, regulation of Notch signaling pathway) were highly enriched in our downregulated genes list (Table 3 and Figure 4d).
Figure 4. Changes in myelination- and migration-associated gene expression after phagocytosis.
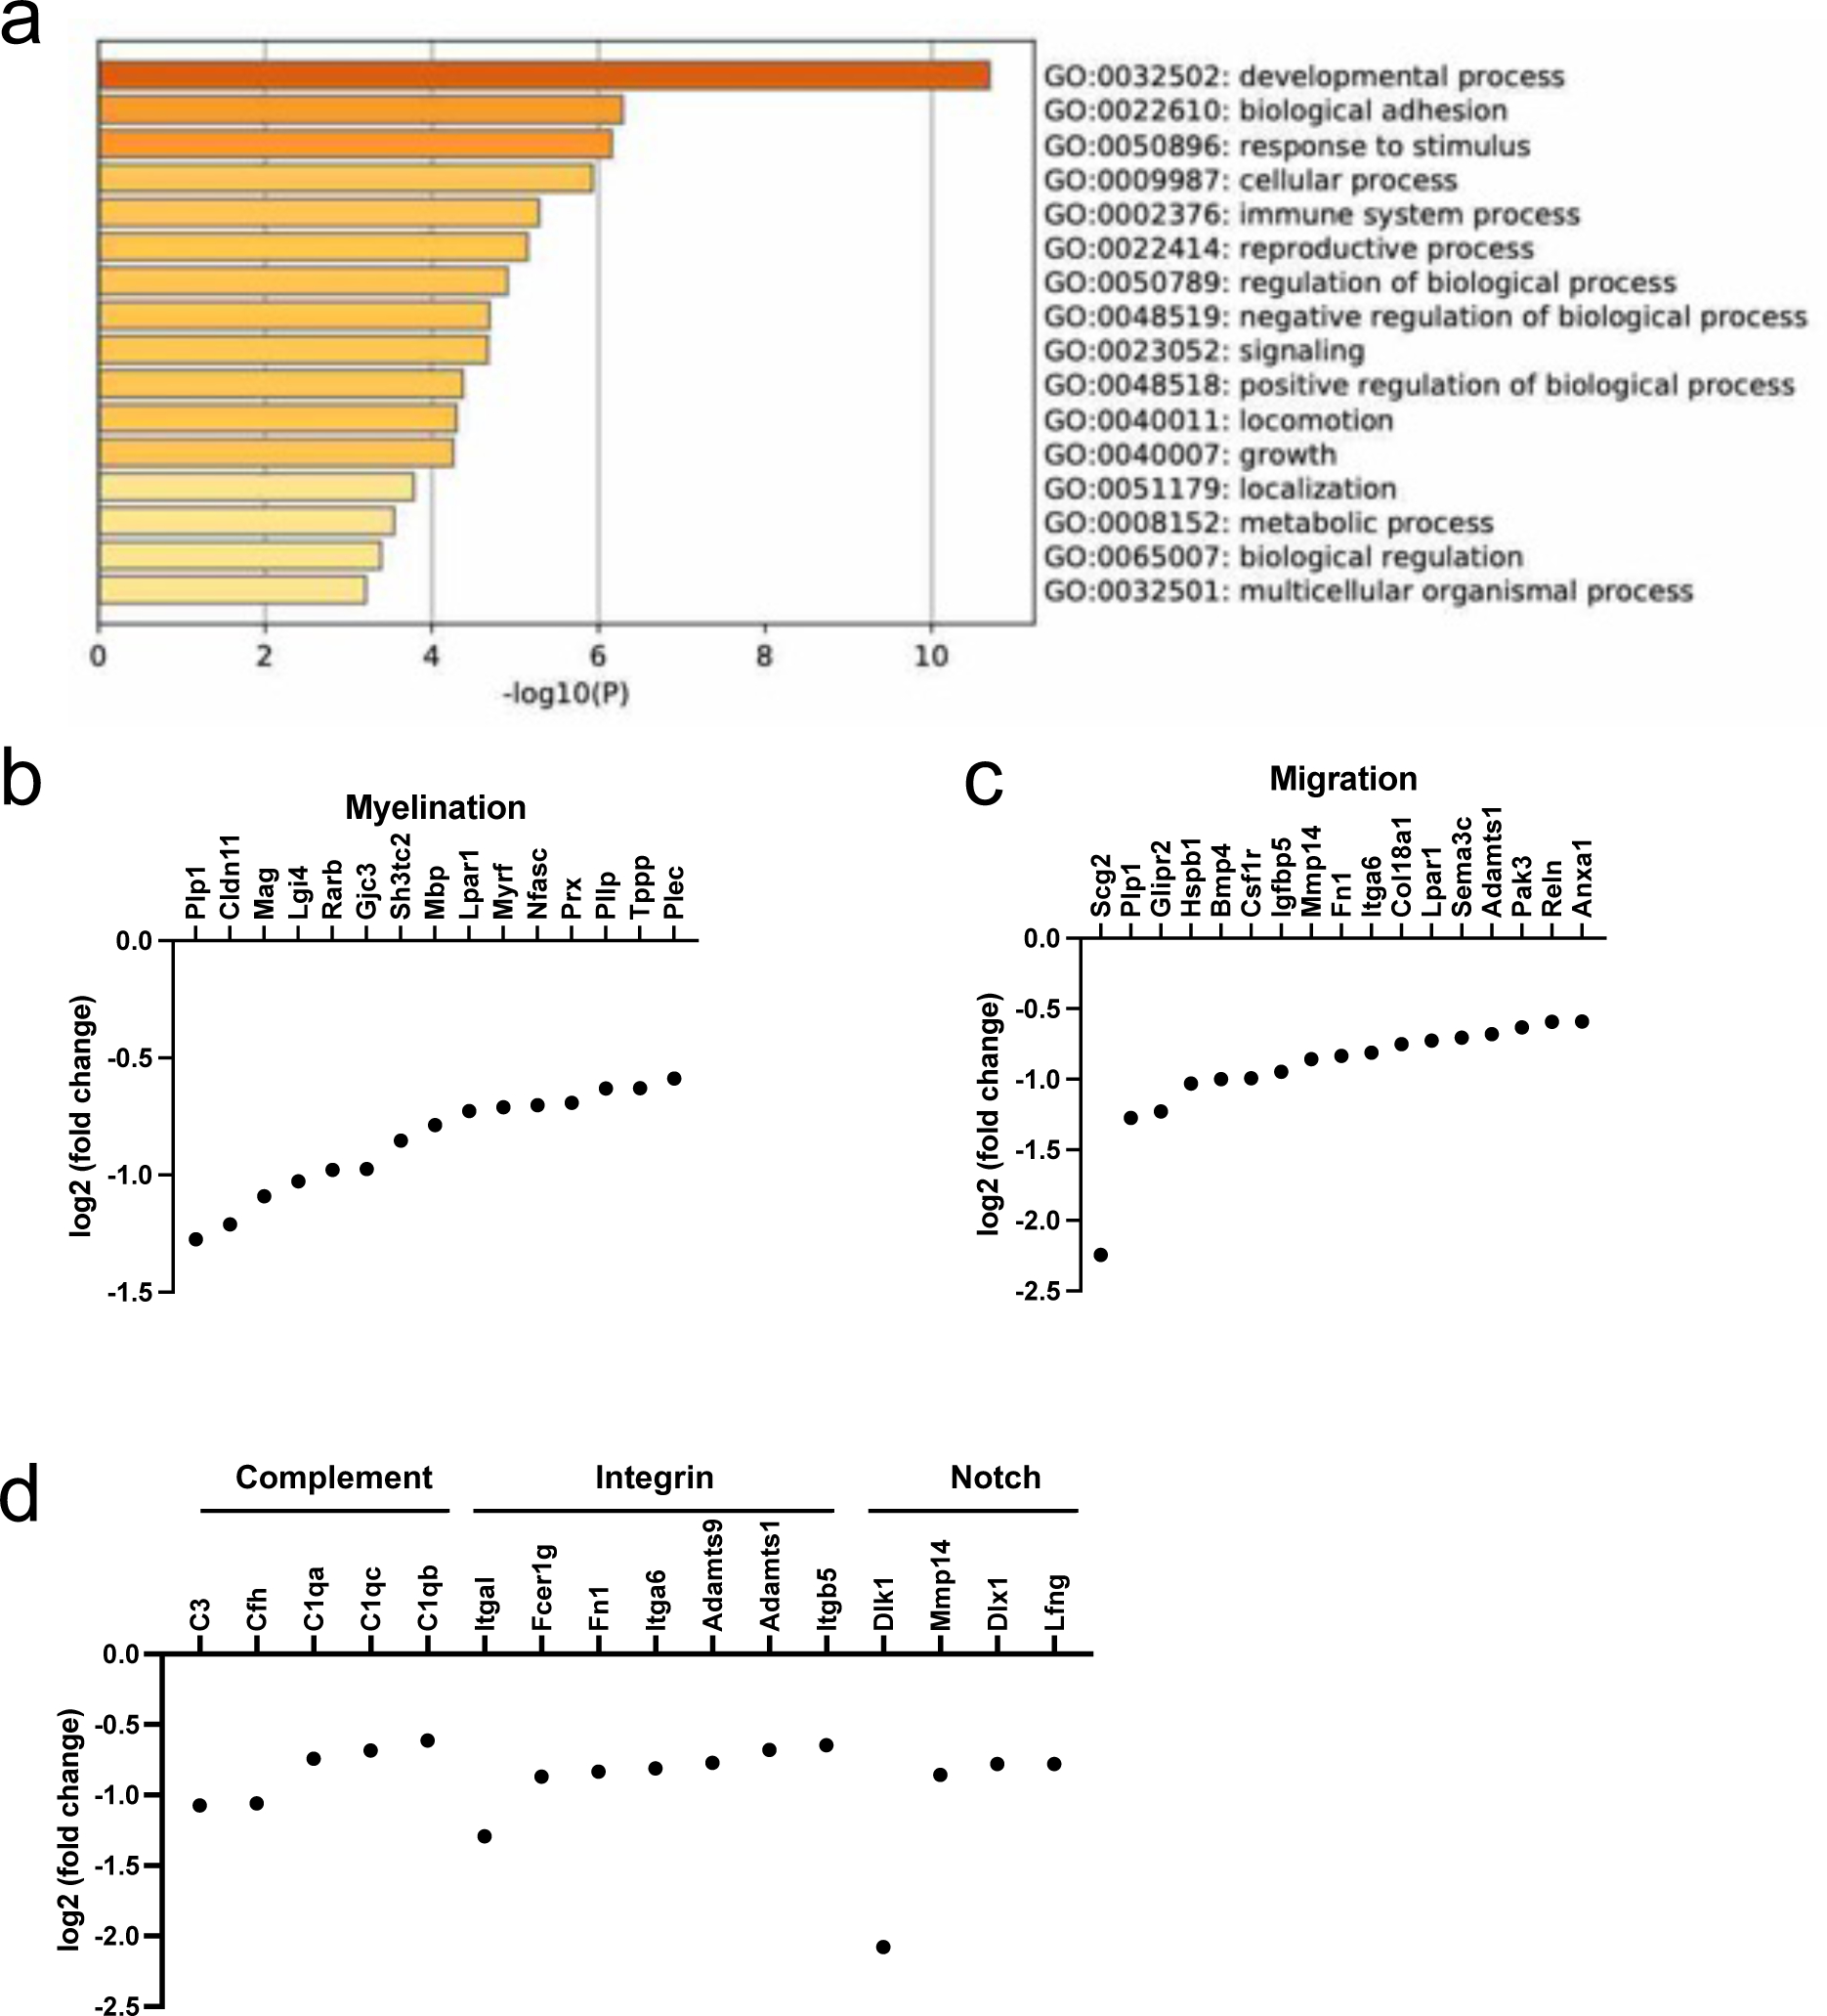
(a) Using our DEG list (downregulated genes; threshold – log2fold change < −0.58, adjusted p value < 0.1), we conducted pathway analysis using Metascape. Parent GO terms that were significantly enriched were presented as bar graphs. Darker colored bars indicate lower p values. (b-c) Multiple myelination- and migration-associated genes were downregulated at 24 hours after phagocytosis. (d) In our DEG list, there were also some genes that were associated with complement signaling, integrin-related pathways, and Notch signaling. These mechanisms are known to be related to cell differentiation and migration.
Table 3:
Top 3 highly enriched pathways for downregulated genes
| GO | Description | Hits | LogP |
|---|---|---|---|
|
| |||
| GO:0006956 | complement activation | C3|C1qb|Cfh|C1qa|C1qc | −4.286836732 |
| GO:0007229 | integrin-mediated signaling pathway | Fcer1g|Fn1|Adamts1|Itga6|Itgb5|Itgal|Adamts9 | −4.674212552 |
| GO:0008593 | regulation of Notch signaling pathway | Mmp14|Dlk1|Lfng|Dlx1 | −2.148472261 |
Discussion:
Protists (e.g. eukaryotic unicellular organisms) use phagocytosis as a means of feeding, while multicellular organisms use phagocytosis as a basic process to remove pathogens and debris 4. Although it is generally thought that almost all cell types of multicellular organisms show phagocytosis activity, it is still mostly unknown whether OPCs phagocytose foreign materials. In the present study, using a primary cell culture system of OPCs, we showed that (1) OPCs phagocytosed cell debris from corpus callosum, cortex, or cultured astrocytes, (2) OPCs did not phagocytose beta-amyloid, (3) compared to microglia, OPCs phagocytose myelin debris more slowly, and (4) expressions of myelination- and migration-associated genes were downregulated after phagocytosis in OPCs. These findings confirm that OPCs indeed show phagocytosis activity and may also support a novel concept that OPCs partly contribute to myelin debris clearance, which helps to keep OPCs in a quiescent state.
OPCs belong to the glial cell family. The main role of OPCs is to generate mature oligodendrocytes, which are specialized in the production of a lipid-rich membrane to form the myelin sheath around axons for saltatory nerve impulse conduction. When needed during development or after brain damage, OPCs proliferate and migrate, and then differentiate into mature oligodendrocytes in the target regions to increase the number of oligodendrocytes. Recent studies show that OPCs receive trophic support from neighboring cells, such as endothelial cells, astrocytes, and pericytes 41–49. In turn, OPCs support neighboring cells 42,50–53, and in this regard, they are not merely progenitor cells for oligodendrocytes; rather, they actively participate in maintaining homeostasis of the brain. Our finding that OPCs could remove myelin or cell debris by phagocytosis further support the importance of OPCs in regulating brain function, because an accumulation of myelin/cell debris could activate deleterious cascades in the brain 54–57. In addition, the data from our RNA-seq experiments may propose a new concept that OPCs stay in a quiescent state after phagocytosis. In general, microglia are responsible for removing unnecessary/toxic substances, such as pathogens, dead/damaged cells, amyloid beta, and myelin debris, in the brain. Under physiological conditions, microglia are in an inactivated state and may not compete with OPCs in removing myelin/cell debris, especially if OPCs are not situated in close proximity to the microglia. However, under pathological conditions, microglia become activated. With an increase in the number of microglia, foreign materials are removed more rapidly, as our data showed that microglia phagocytose foreign materials at a faster rate than OPCs. As the phagocytosis activity of OPCs decreases, more OPCs remain in an active state, enabling them to perform their functions in oligodendrogenesis. Thus, microglia activation may have a secondary effect of promoting oligodendrogenesis. Future studies are warranted to test this new hypothesis for a deeper understanding of the function of OPCs.
Our current study confirms that OPCs possess the ability of phagocytosis and has also generated a novel transcriptome dataset of control OPCs and phagocytosing OPCs. Recently, a remarkable study by Falcão et al. demonstrated the emergence of disease-specific oligodendrocyte lineage cells in multiple sclerosis 27. The study also revealed that cultured OPCs could take up myelin. Our findings align with this report and further expand the novel concept that OPCs contribute to the clearance of myelin debris in the context of disease. However, questions still remain regarding the roles and mechanisms of OPC phagocytosis. First, this study aimed to examine whether OPCs exhibit phagocytic activity against foreign materials, including myelin-enriched cell debris and amyloid beta. Therefore, we did not specifically investigate mechanism-based hypotheses for OPC phagocytosis. However, our newly generated RNAseq database on OPC phagocytosis will facilitate the investigation of the molecular mechanisms underlying OPC phagocytosis. In this context, several questions arise for our future studies: (i) Why do OPCs exhibit a slower response to myelin/cell debris compared to microglia?, (ii) Why can OPCs remove myelin/cell debris through phagocytosis while oligodendrocytes cannot?, (iii) Why do OPCs phagocytose myelin/cell debris but not beta-amyloid?, and (iv) How do OPCs distinguish between performing oligodendrogenesis or phagocytosis, given their relatively low proportion in adults? Addressing these questions will rely on uncovering the detailed mechanisms of OPC phagocytosis, including the identification of receptors and intracellular signaling cascades involved. Second, we used a cell culture system of primary OPCs, so future studies will be needed to check OPC phagocytosis in vivo. Our pilot experiments indicate that at least under physiological conditions, OPCs could phagocytose foreign materials (e.g. fluorescent beads) (Supplementary Figure S2). Therefore, questions about (i) whether OPC phagocytosis would be changed by diseased conditions and (ii) whether suppression of OPC phagocytosis promotes oligodendrogenesis need to be addressed using mouse/rat models of CNS diseases. Finally, we need to think about the possibility of using the mechanisms of OPC phagocytosis as a therapeutic target for CNS diseases. White matter damage by oligodendrocyte/myelin loss is one of the major characteristics of many CNS diseases, such as stroke and vascular dementia. Under diseased conditions, OPC proliferation and differentiation are essential processes for repairing damaged brain regions. Our data suggests that OPC phagocytotic activity is inversely linked to its activities that are associated with oligodendrogenesis. This novel concept opens up the possibility of promoting endogenous oligodendrogenesis by modulating the amount of OPC phagocytosis after white matter damage. An understanding of the mechanisms of OPC phagocytosis will be an exciting first step in this process.
In conclusion, we demonstrate that cultured OPCs show phagocytotic activity against myelin and cell debris. After phagocytosis, the expression levels of myelination- and migration-associated genes are downregulated in OPCs. These data suggest that OPCs at least partly contribute to the clearance of myelin and cell debris, and that OPCs may remain in a quiescent state after their phagocytotic activity. Our current study provides a novel concept for understanding the mechanisms by which OPCs contribute to homeostasis in their microenvironment through phagocytosis.
Supplementary Material
Acknowledgements:
Supported in part by National Institutes of Health. The authors thank Ms. Yuki Hamanaka for her valuable support of this project. Dedicated to the memory of Ms. Yuki Hamanaka.
Abbreviations:
- AD
Alzheimer’s disease
- ANOVA
analysis of variance
- APOE2
apolipoprotein E2
- Aβ
beta-amyloid
- CNS
central nervous system
- CNTF
ciliary neurotrophic factor
- DEG
differential expression gene
- DMEM
Dulbecco’s Modified Eagle’s medium
- EDTA
ethylenediaminetetraacetic acid
- FBS
fetal bovine serum
- GFAP
glial fibrillary acidic protein
- GM
gray matter
- GO
Gene Ontology
- HBSS
Hanks’ Balanced Salt Solution
- Iba1
ionized calcium-binding adapter molecule 1
- MBP
myelin basic protein
- OPC
oligodendrocyte precursor cell
- PDGF
platelet-derived growth factor
- PDGFRα
platelet-derived growth factor receptor alpha
- PNS
peripheral nervous system
- PS
penicillin/streptomycin
- TPM
transcript per kilobase million
- T3
triiodothyronine
- WM
white matter
Footnotes
CRediT Taxonomy: authors’ contribution(s) to the submitted manuscript are attributed as follows:
CRediT Taxonomy
Gen Hamanaka
Conceptualization, Data curation, Formal analysis, Investigation, Methodology, Writing – original draft, Writing – review & editing
Ivan Hernandez
Investigation, Methodology
Hajime Takase
Data curation, Formal analysis, Investigation, Methodology
Hidehiro Ishikawa
Data curation, Funding acquisition, Investigation, Methodology
Fouzi Benboujja
Investigation, Methodology
Shintaro Kimura
Funding acquisition, Investigation, Methodology
Norito Fukuda
Investigation, Methodology
Shuzhen Guo
Investigation, Methodology
Josephine Lok
Investigation, Methodology
Eng Lo
Conceptualization, Data curation, Funding acquisition, Supervision, Writing – review & editing
Ken Arai
Conceptualization, Data curation, Formal analysis, Funding acquisition, Project administration, Visualization, Writing – original draft, Writing – review & editing
Human subjects
Informed consent was achieved for all subjects, and the experiments were approved by the local ethics committee.
Conflict of interest disclosure
All experiments were conducted in compliance with the ARRIVE guidelines.
Data Availability Statement:
The data that support the findings of this study are openly available in figures at this research manuscript.
References:
- 1.Rabinovitch M. Professional and non-professional phagocytes: an introduction. Trends Cell Biol. 1995;5:85–87. doi: 10.1016/s0962-8924(00)88955-2 [DOI] [PubMed] [Google Scholar]
- 2.Gordon S Phagocytosis: An Immunobiologic Process. Immunity. 2016;44:463–475. doi: 10.1016/j.immuni.2016.02.026 [DOI] [PubMed] [Google Scholar]
- 3.Underhill DM, Goodridge HS. Information processing during phagocytosis. Nature Reviews Immunology. 2012;12:492–502. doi: 10.1038/nri3244 [DOI] [PMC free article] [PubMed] [Google Scholar]
- 4.Uribe-Querol E, Rosales C. Phagocytosis: Our Current Understanding of a Universal Biological Process. Frontiers in Immunology. 2020;11. doi: 10.3389/fimmu.2020.01066 [DOI] [PMC free article] [PubMed] [Google Scholar]
- 5.Li Q, Barres BA. Microglia and macrophages in brain homeostasis and disease. Nat Rev Immunol. 2018;18:225–242. doi: 10.1038/nri.2017.125 [DOI] [PubMed] [Google Scholar]
- 6.Spiteri AG, Wishart CL, Pamphlett R, Locatelli G, King NJC. Microglia and monocytes in inflammatory CNS disease: integrating phenotype and function. Acta Neuropathol. 2022;143:179–224. doi: 10.1007/s00401-021-02384-2 [DOI] [PMC free article] [PubMed] [Google Scholar]
- 7.Lee J, Hamanaka G, Lo EH, Arai K. Heterogeneity of microglia and their differential roles in white matter pathology. CNS Neurosci Ther. 2019;25:1290–1298. doi: 10.1111/cns.13266 [DOI] [PMC free article] [PubMed] [Google Scholar]
- 8.Lichtman JW, Colman H. Synapse elimination and indelible memory. Neuron. 2000;25:269–278. doi: 10.1016/s0896-6273(00)80893-4 [DOI] [PubMed] [Google Scholar]
- 9.Guedes JR, Ferreira PA, Costa JM, Cardoso AL, Peca J. Microglia-dependent remodeling of neuronal circuits. J Neurochem. 2022;163:74–93. doi: 10.1111/jnc.15689 [DOI] [PMC free article] [PubMed] [Google Scholar]
- 10.Schafer DP, Lehrman EK, Kautzman AG, Koyama R, Mardinly AR, Yamasaki R, Ransohoff RM, Greenberg ME, Barres BA, Stevens B. Microglia sculpt postnatal neural circuits in an activity and complement-dependent manner. Neuron. 2012;74:691–705. doi: 10.1016/j.neuron.2012.03.026 [DOI] [PMC free article] [PubMed] [Google Scholar]
- 11.Butler CA, Popescu AS, Kitchener EJA, Allendorf DH, Puigdellivol M, Brown GC. Microglial phagocytosis of neurons in neurodegeneration, and its regulation. J Neurochem. 2021;158:621–639. doi: 10.1111/jnc.15327 [DOI] [PubMed] [Google Scholar]
- 12.Lloyd AF, Davies CL, Miron VE. Microglia: origins, homeostasis, and roles in myelin repair. Curr Opin Neurobiol. 2017;47:113–120. doi: 10.1016/j.conb.2017.10.001 [DOI] [PubMed] [Google Scholar]
- 13.Galloway DA, Phillips AEM, Owen DRJ, Moore CS. Phagocytosis in the Brain: Homeostasis and Disease. Front Immunol. 2019;10:790. doi: 10.3389/fimmu.2019.00790 [DOI] [PMC free article] [PubMed] [Google Scholar]
- 14.Derecki NC, Katzmarski N, Kipnis J, Meyer-Luehmann M. Microglia as a critical player in both developmental and late-life CNS pathologies. Acta Neuropathol. 2014;128:333–345. doi: 10.1007/s00401-014-1321-z [DOI] [PMC free article] [PubMed] [Google Scholar]
- 15.Guo S, Wang H, Yin Y. Microglia Polarization From M1 to M2 in Neurodegenerative Diseases. Front Aging Neurosci. 2022;14:815347. doi: 10.3389/fnagi.2022.815347 [DOI] [PMC free article] [PubMed] [Google Scholar]
- 16.Chung WS, Clarke LE, Wang GX, Stafford BK, Sher A, Chakraborty C, Joung J, Foo LC, Thompson A, Chen C, et al. Astrocytes mediate synapse elimination through MEGF10 and MERTK pathways. Nature. 2013;504:394–400. doi: 10.1038/nature12776 [DOI] [PMC free article] [PubMed] [Google Scholar]
- 17.Liddelow SA, Guttenplan KA, Clarke LE, Bennett FC, Bohlen CJ, Schirmer L, Bennett ML, Munch AE, Chung WS, Peterson TC, et al. Neurotoxic reactive astrocytes are induced by activated microglia. Nature. 2017;541:481–487. doi: 10.1038/nature21029 [DOI] [PMC free article] [PubMed] [Google Scholar]
- 18.Chung WS, Verghese PB, Chakraborty C, Joung J, Hyman BT, Ulrich JD, Holtzman DM, Barres BA. Novel allele-dependent role for APOE in controlling the rate of synapse pruning by astrocytes. Proc Natl Acad Sci U S A. 2016;113:10186–10191. doi: 10.1073/pnas.1609896113 [DOI] [PMC free article] [PubMed] [Google Scholar]
- 19.Morizawa YM, Hirayama Y, Ohno N, Shibata S, Shigetomi E, Sui Y, Nabekura J, Sato K, Okajima F, Takebayashi H, et al. Reactive astrocytes function as phagocytes after brain ischemia via ABCA1-mediated pathway. Nat Commun. 2017;8:28. doi: 10.1038/s41467-017-00037-1 [DOI] [PMC free article] [PubMed] [Google Scholar]
- 20.Satinsky D, Pepe FA, Liu CN. The Neurilemma Cell in Peripheral Nerve Degeneration and Regeneration. Exp Neurol. 1964;9:441–451. doi: 10.1016/0014-4886(64)90052-4 [DOI] [PubMed] [Google Scholar]
- 21.Holtzman E, Novikoff AB. Lysomes in the rat sciatic nerve following crush. J Cell Biol. 1965;27:651–669. doi: 10.1083/jcb.27.3.651 [DOI] [PMC free article] [PubMed] [Google Scholar]
- 22.Gomez-Sanchez JA, Carty L, Iruarrizaga-Lejarreta M, Palomo-Irigoyen M, Varela-Rey M, Griffith M, Hantke J, Macias-Camara N, Azkargorta M, Aurrekoetxea I, et al. Schwann cell autophagy, myelinophagy, initiates myelin clearance from injured nerves. J Cell Biol. 2015;210:153–168. doi: 10.1083/jcb.201503019 [DOI] [PMC free article] [PubMed] [Google Scholar]
- 23.Jang SY, Shin YK, Park SY, Park JY, Lee HJ, Yoo YH, Kim JK, Park HT. Autophagic myelin destruction by Schwann cells during Wallerian degeneration and segmental demyelination. Glia. 2016;64:730–742. doi: 10.1002/glia.22957 [DOI] [PubMed] [Google Scholar]
- 24.Brosius Lutz A, Chung WS, Sloan SA, Carson GA, Zhou L, Lovelett E, Posada S, Zuchero JB, Barres BA. Schwann cells use TAM receptor-mediated phagocytosis in addition to autophagy to clear myelin in a mouse model of nerve injury. Proc Natl Acad Sci U S A. 2017;114:E8072–E8080. doi: 10.1073/pnas.1710566114 [DOI] [PMC free article] [PubMed] [Google Scholar]
- 25.Cahoy JD, Emery B, Kaushal A, Foo LC, Zamanian JL, Christopherson KS, Xing Y, Lubischer JL, Krieg PA, Krupenko SA, et al. A transcriptome database for astrocytes, neurons, and oligodendrocytes: a new resource for understanding brain development and function. J Neurosci. 2008;28:264–278. doi: 10.1523/JNEUROSCI.4178-07.2008 [DOI] [PMC free article] [PubMed] [Google Scholar]
- 26.Brosius Lutz A, Barres BA. Contrasting the glial response to axon injury in the central and peripheral nervous systems. Dev Cell. 2014;28:7–17. doi: 10.1016/j.devcel.2013.12.002 [DOI] [PubMed] [Google Scholar]
- 27.Falcão AM, van Bruggen D, Marques S, Meijer M, Jäkel S, Agirre E, Samudyata, Floriddia EM, Vanichkina DP, Ffrench-Constant C, et al. Disease-specific oligodendrocyte lineage cells arise in multiple sclerosis. Nat Med. 2018;24:1837–1844. doi: 10.1038/s41591-018-0236-y [DOI] [PMC free article] [PubMed] [Google Scholar]
- 28.Trotter J, Karram K, Nishiyama A. NG2 cells: Properties, progeny and origin. Brain Res Rev. 2010;63:72–82. doi: 10.1016/j.brainresrev.2009.12.006 [DOI] [PMC free article] [PubMed] [Google Scholar]
- 29.Nishiyama A, Komitova M, Suzuki R, Zhu X. Polydendrocytes (NG2 cells): multifunctional cells with lineage plasticity. Nat Rev Neurosci. 2009;10:9–22. doi: 10.1038/nrn2495 [DOI] [PubMed] [Google Scholar]
- 30.Butt AM, De La Rocha IC, Rivera A. Oligodendroglial Cells in Alzheimer’s Disease. Adv Exp Med Biol. 2019;1175:325–333. doi: 10.1007/978-981-13-9913-8_12 [DOI] [PubMed] [Google Scholar]
- 31.Butt AM, Papanikolaou M, Rivera A. Physiology of Oligodendroglia. Adv Exp Med Biol. 2019;1175:117–128. doi: 10.1007/978-981-13-9913-8_5 [DOI] [PubMed] [Google Scholar]
- 32.Hamanaka G, Ohtomo R, Takase H, Lok J, Arai K. Role of oligodendrocyte-neurovascular unit in white matter repair. Neurosci Lett. 2018;684:175–180. doi: 10.1016/j.neulet.2018.07.016 [DOI] [PubMed] [Google Scholar]
- 33.Hamanaka G, Ohtomo R, Takase H, Lok J, Arai K. White-matter repair: Interaction between oligodendrocytes and the neurovascular unit. Brain Circ. 2018;4:118–123. doi: 10.4103/bc.bc_15_18 [DOI] [PMC free article] [PubMed] [Google Scholar]
- 34.Tsai HH, Niu J, Munji R, Davalos D, Chang J, Zhang H, Tien AC, Kuo CJ, Chan JR, Daneman R, Fancy SP. Oligodendrocyte precursors migrate along vasculature in the developing nervous system. Science. 2016;351:379–384. doi: 10.1126/science.aad3839 [DOI] [PMC free article] [PubMed] [Google Scholar]
- 35.Zhang ZG, Chopp M. Promoting brain remodeling to aid in stroke recovery. Trends Mol Med. 2015;21:543–548. doi: 10.1016/j.molmed.2015.07.005 [DOI] [PMC free article] [PubMed] [Google Scholar]
- 36.Egawa N, Hamanaka G, Chung KK, Ishikawa H, Shindo A, Maki T, Takahashi R, Inoue H, Lo EH, Arai K. High Mobility Group A1 Regulates Transcription Levels of Oligodendrocyte Marker Genes in Cultured Oligodendrocyte Precursor Cells. Int J Mol Sci. 2022;23. doi: 10.3390/ijms23042236 [DOI] [PMC free article] [PubMed] [Google Scholar]
- 37.Hamanaka G, Kubo T, Ohtomo R, Takase H, Reyes-Bricio E, Oribe S, Osumi N, Lok J, Lo EH, Arai K. Microglial responses after phagocytosis: Escherichia coli bioparticles, but not cell debris or amyloid beta, induce matrix metalloproteinase-9 secretion in cultured rat primary microglial cells. Glia. 2020;68:1435–1444. doi: 10.1002/glia.23791 [DOI] [PMC free article] [PubMed] [Google Scholar]
- 38.Takase H, Lok J, Arai K. A radical scavenger edaravone and oligodendrocyte protection/regeneration. Neural Regen Res. 2018;13:1550–1551. doi: 10.4103/1673-5374.237116 [DOI] [PMC free article] [PubMed] [Google Scholar]
- 39.Zhou Y, Zhou B, Pache L, Chang M, Khodabakhshi AH, Tanaseichuk O, Benner C, Chanda SK. Metascape provides a biologist-oriented resource for the analysis of systems-level datasets. Nat Commun. 2019;10:1523. doi: 10.1038/s41467-019-09234-6 [DOI] [PMC free article] [PubMed] [Google Scholar]
- 40.Miksa M, Komura H, Wu R, Shah KG, Wang P. A novel method to determine the engulfment of apoptotic cells by macrophages using pHrodo succinimidyl ester. J Immunol Methods. 2009;342:71–77. doi: 10.1016/j.jim.2008.11.019 [DOI] [PMC free article] [PubMed] [Google Scholar]
- 41.Uemura MT, Ihara M, Maki T, Nakagomi T, Kaji S, Uemura K, Matsuyama T, Kalaria RN, Kinoshita A, Takahashi R. Pericyte-derived bone morphogenetic protein 4 underlies white matter damage after chronic hypoperfusion. Brain Pathol. 2018;28:521–535. doi: 10.1111/bpa.12523 [DOI] [PMC free article] [PubMed] [Google Scholar]
- 42.Maki T, Morancho A, Martinez-San Segundo P, Hayakawa K, Takase H, Liang AC, Gabriel-Salazar M, Medina-Gutierrez E, Washida K, Montaner J, et al. Endothelial Progenitor Cell Secretome and Oligovascular Repair in a Mouse Model of Prolonged Cerebral Hypoperfusion. Stroke. 2018;49:1003–1010. doi: 10.1161/STROKEAHA.117.019346 [DOI] [PMC free article] [PubMed] [Google Scholar]
- 43.Arai K, Lo EH. An oligovascular niche: cerebral endothelial cells promote the survival and proliferation of oligodendrocyte precursor cells. J Neurosci. 2009;29:4351–4355. doi: 10.1523/JNEUROSCI.0035-09.2009 [DOI] [PMC free article] [PubMed] [Google Scholar]
- 44.Arai K, Lo EH. Oligovascular signaling in white matter stroke. Biol Pharm Bull. 2009;32:1639–1644. doi: 10.1248/bpb.32.1639 [DOI] [PMC free article] [PubMed] [Google Scholar]
- 45.Ulanska-Poutanen J, Mieczkowski J, Zhao C, Konarzewska K, Kaza B, Pohl HB, Bugajski L, Kaminska B, Franklin RJ, Zawadzka M. Injury-induced perivascular niche supports alternative differentiation of adult rodent CNS progenitor cells. Elife. 2018;7. doi: 10.7554/eLife.30325 [DOI] [PMC free article] [PubMed] [Google Scholar]
- 46.Miyamoto N, Maki T, Shindo A, Liang AC, Maeda M, Egawa N, Itoh K, Lo EK, Lok J, Ihara M, Arai K. Astrocytes Promote Oligodendrogenesis after White Matter Damage via Brain-Derived Neurotrophic Factor. J Neurosci. 2015;35:14002–14008. doi: 10.1523/JNEUROSCI.1592-15.2015 [DOI] [PMC free article] [PubMed] [Google Scholar]
- 47.Arai K, Lo EH. Astrocytes protect oligodendrocyte precursor cells via MEK/ERK and PI3K/Akt signaling. J Neurosci Res. 2010;88:758–763. doi: 10.1002/jnr.22256 [DOI] [PMC free article] [PubMed] [Google Scholar]
- 48.Kato S, Aoyama M, Kakita H, Hida H, Kato I, Ito T, Goto T, Hussein MH, Sawamoto K, Togari H, Asai K. Endogenous erythropoietin from astrocyte protects the oligodendrocyte precursor cell against hypoxic and reoxygenation injury. J Neurosci Res. 2011;89:1566–1574. doi: 10.1002/jnr.22702 [DOI] [PubMed] [Google Scholar]
- 49.Arai K, Lo EH. Wiring and plumbing: Oligodendrocyte precursors and angiogenesis in the oligovascular niche. J Cereb Blood Flow Metab. 2021;41:2132–2133. doi: 10.1177/0271678X211014979 [DOI] [PMC free article] [PubMed] [Google Scholar]
- 50.Kishida N, Maki T, Takagi Y, Yasuda K, Kinoshita H, Ayaki T, Noro T, Kinoshita Y, Ono Y, Kataoka H, et al. Role of Perivascular Oligodendrocyte Precursor Cells in Angiogenesis After Brain Ischemia. J Am Heart Assoc. 2019;8:e011824. doi: 10.1161/JAHA.118.011824 [DOI] [PMC free article] [PubMed] [Google Scholar]
- 51.Seo JH, Maki T, Maeda M, Miyamoto N, Liang AC, Hayakawa K, Pham LD, Suwa F, Taguchi A, Matsuyama T, et al. Oligodendrocyte precursor cells support blood-brain barrier integrity via TGF-beta signaling. PLoS One. 2014;9:e103174. doi: 10.1371/journal.pone.0103174 [DOI] [PMC free article] [PubMed] [Google Scholar]
- 52.Chavali M, Ulloa-Navas MJ, Perez-Borreda P, Garcia-Verdugo JM, McQuillen PS, Huang EJ, Rowitch DH. Wnt-Dependent Oligodendroglial-Endothelial Interactions Regulate White Matter Vascularization and Attenuate Injury. Neuron. 2020;108:1130–1145 e1135. doi: 10.1016/j.neuron.2020.09.033 [DOI] [PMC free article] [PubMed] [Google Scholar]
- 53.Niu J, Tsai HH, Hoi KK, Huang N, Yu G, Kim K, Baranzini SE, Xiao L, Chan JR, Fancy SPJ. Aberrant oligodendroglial-vascular interactions disrupt the blood-brain barrier, triggering CNS inflammation. Nat Neurosci. 2019;22:709–718. doi: 10.1038/s41593-019-0369-4 [DOI] [PMC free article] [PubMed] [Google Scholar]
- 54.Kotter MR, Li WW, Zhao C, Franklin RJ. Myelin impairs CNS remyelination by inhibiting oligodendrocyte precursor cell differentiation. J Neurosci. 2006;26:328–332. doi: 10.1523/JNEUROSCI.2615-05.2006 [DOI] [PMC free article] [PubMed] [Google Scholar]
- 55.Lassmann H, Bruck W, Lucchinetti CF. The immunopathology of multiple sclerosis: an overview. Brain Pathol. 2007;17:210–218. doi: 10.1111/j.1750-3639.2007.00064.x [DOI] [PMC free article] [PubMed] [Google Scholar]
- 56.Schwab ME. Nogo and axon regeneration. Curr Opin Neurobiol. 2004;14:118–124. doi: 10.1016/j.conb.2004.01.004 [DOI] [PubMed] [Google Scholar]
- 57.Neumann H, Kotter MR, Franklin RJ. Debris clearance by microglia: an essential link between degeneration and regeneration. Brain. 2009;132:288–295. doi: 10.1093/brain/awn109 [DOI] [PMC free article] [PubMed] [Google Scholar]
- 58.Voskuhl RR, Itoh N, Tassoni A, Matsukawa MA, Ren E, Tse V, Jang E, Suen TT, Itoh Y. Gene expression in oligodendrocytes during remyelination reveals cholesterol homeostasis as a therapeutic target in multiple sclerosis. Proc Natl Acad Sci U S A. 2019;116:10130–10139. doi: 10.1073/pnas.1821306116 [DOI] [PMC free article] [PubMed] [Google Scholar]
Associated Data
This section collects any data citations, data availability statements, or supplementary materials included in this article.
Supplementary Materials
Data Availability Statement
The data that support the findings of this study are openly available in figures at this research manuscript.